Investigating Entities:
In order to accelerate time to value, there are several dashboards within the app which will populate with data as soon as scoring rules are set up and enabled.
Entity Behavioral Scores:
This dashboard takes the input of a particular set of entities, defined by the Entity Field dropdown which lists every entity associated with an anomaly scoring rule within the environment and provides a consolidated view of the scores for a given window provided by the Profile Window dropdown.
This consists of a Entity Behavior Scores section which lists the total score across all entities within the window (and a comparison with previous windows through the timechart beneath), the distribution of all the entity scores in a histogram for ease of score model health monitoring and perhaps most importantly a ranked list showing entities prioritised by behavioural score (which also includes change from average score for that entity across recent windows and the specific rules their indicator values have triggered). This list is also clickable and drills down to the Single Entity Profile dashboard.
From the list you can select to either Allow List Entity which removes the entity from all indicator and scoring searches permanently (editable via a created lookup) or Mark Reviewed to indicate to yourself and colleagues that an entity has been investigated today.
Additionally there is a Score Rule Health section which contains information on the number/percentage of rules associated with the entity which triggered within the given profile window, a pie chart showing the split of the total score attributed between the various scoring rules and a timeline showing the frequency particular rules triggered.

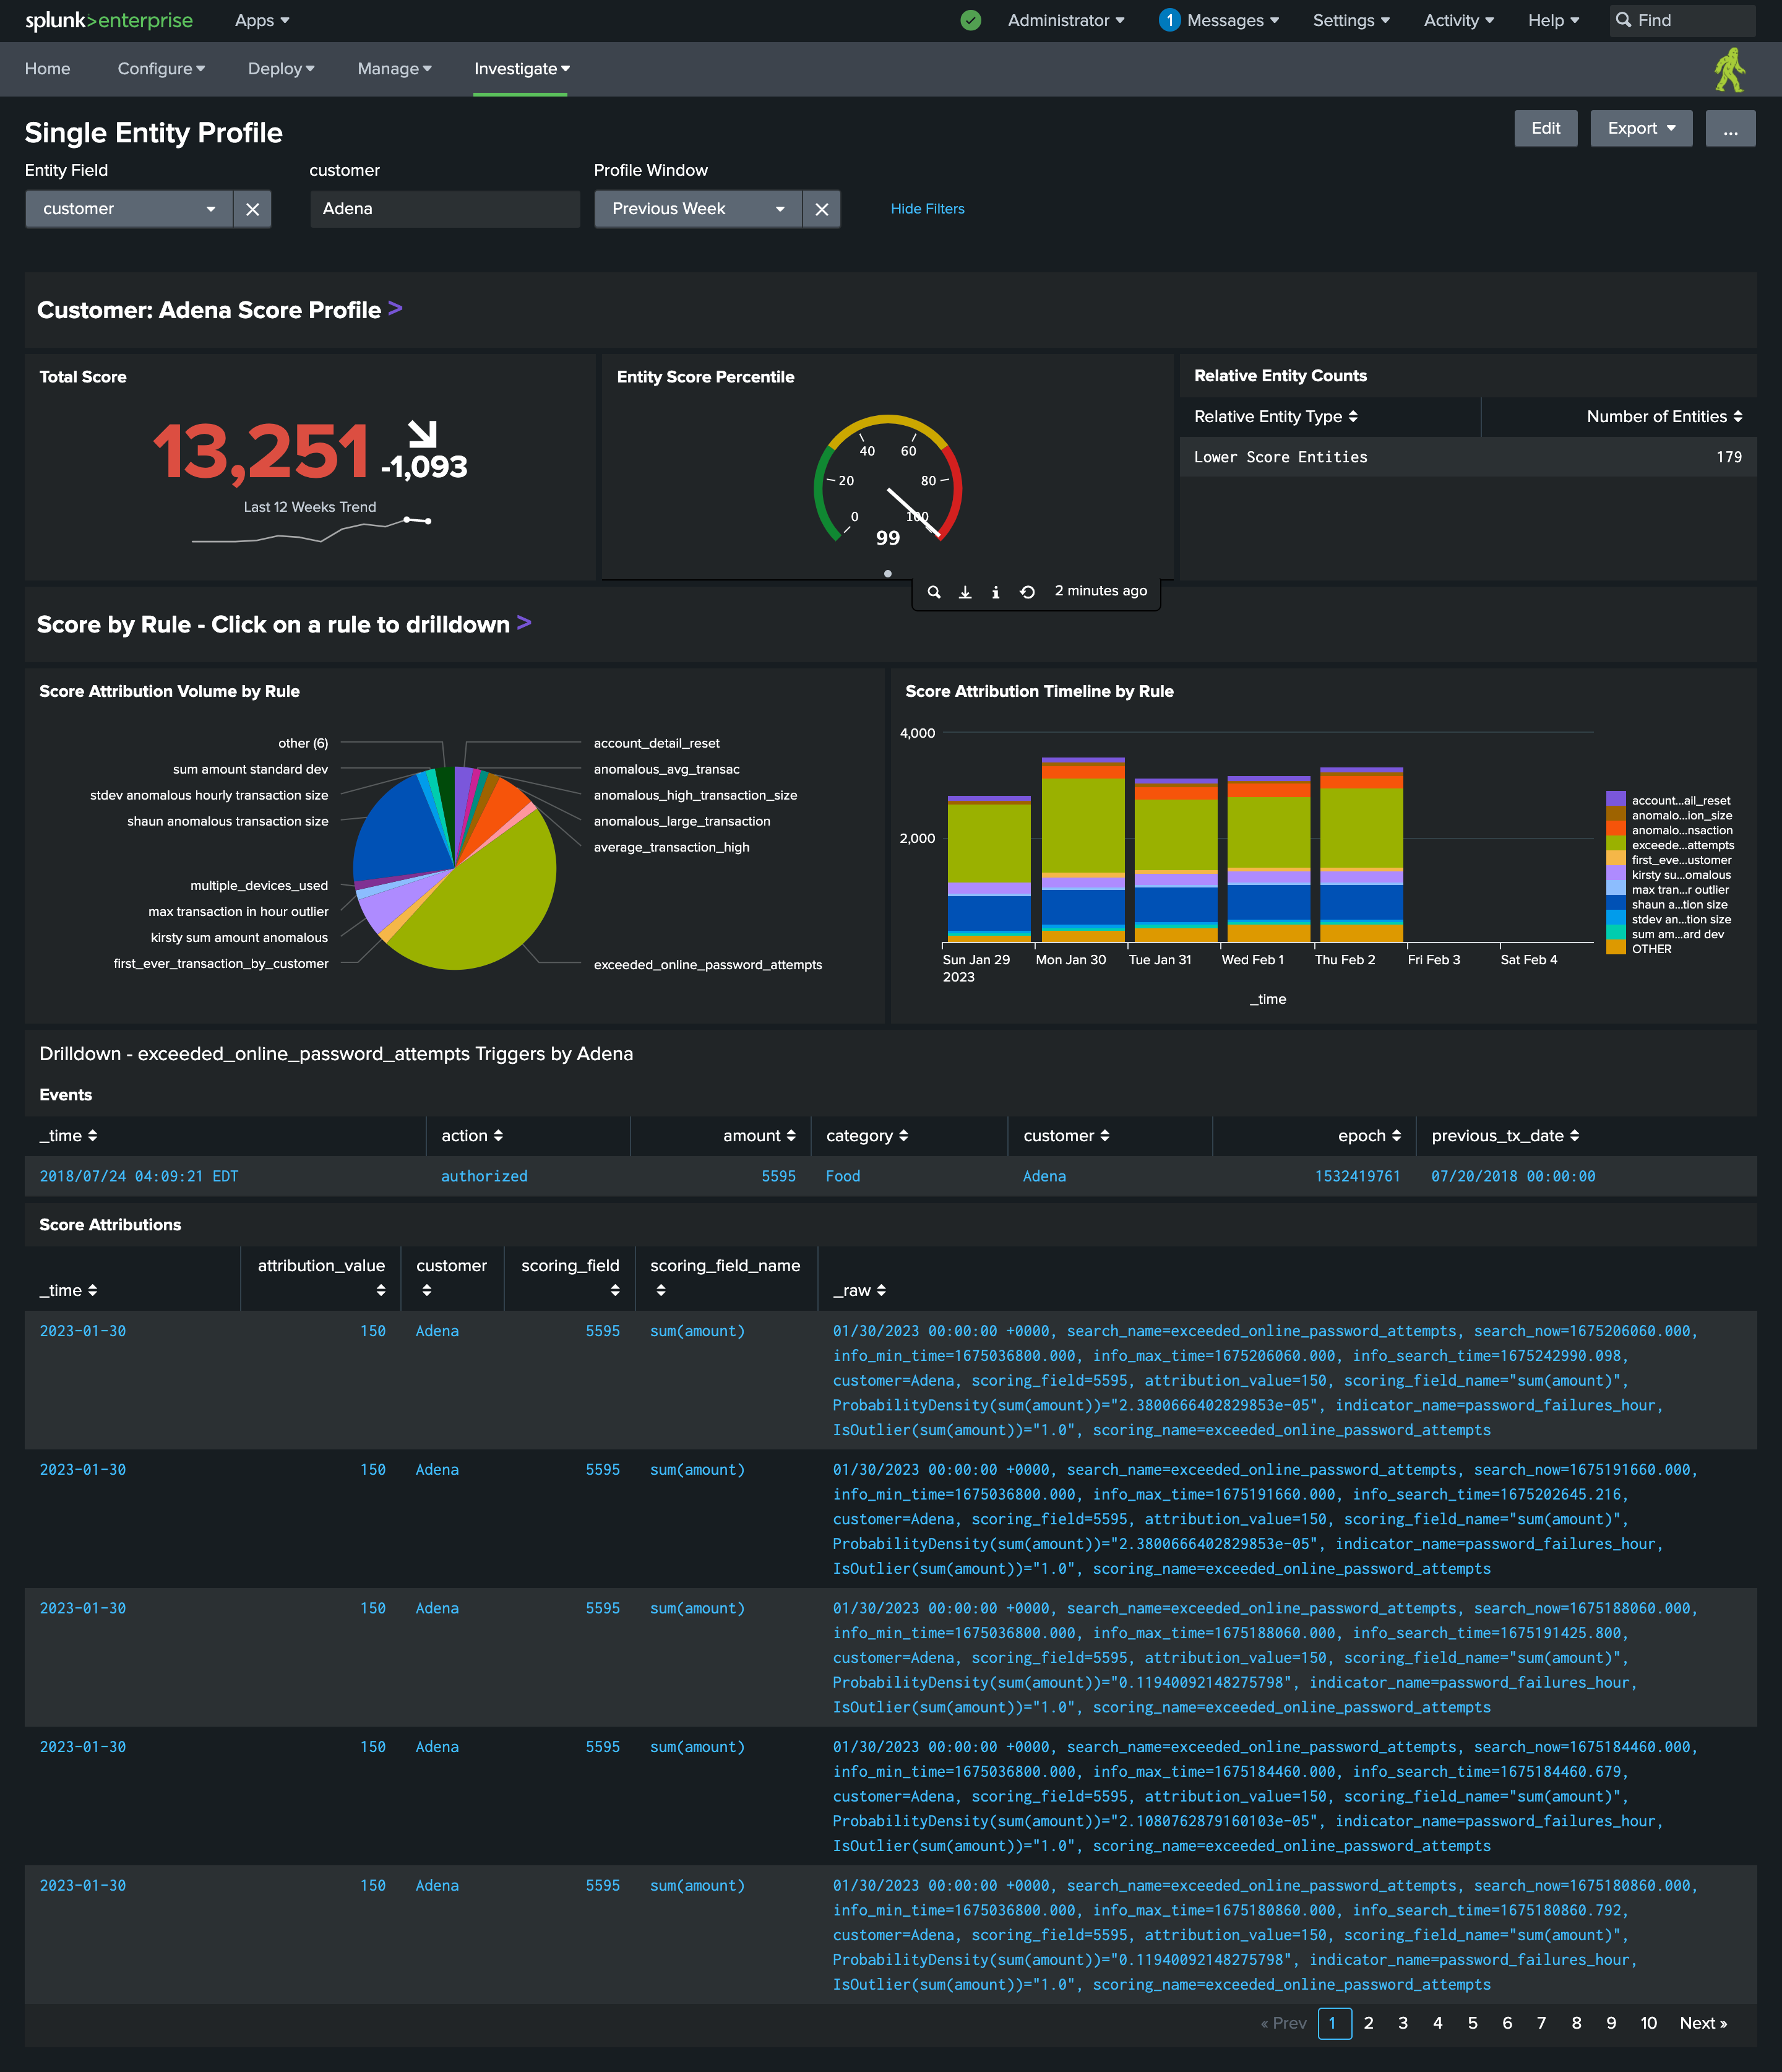
Single Entity Profile:
This dashboard takes the input of a particular set of entities, defined by the Entity Field dropdown which lists every entity associated with a scoring rule within the environment and a chosen entity from that set (entered in the text box input) to display the profile of the chosen entity across a given Profile Window
This consists of a Score Profile section which lists the total score for the entity within the window (and a comparison with previous windows through the sparkline beneath), a radial indicator displaying where that score sits percentile wise in comparison to all of the entities within the entity group for the given window and a table showing the raw number of entities with scores below, equal to and above the chosen entity - providing context around the entity's behavioural profile.
Additionally there is a Score By Rule section which contains a pie chart showing the split of the total score attributed between the various scoring rules and a timeline showing the frequency and attribution particular rules triggered. Clicking on any given rule in either chart will open a panel beneath showing both the raw events and attribution events for the selected rule and entity in the given profile window