Managing Existing Behavioral Indicators/Scoring Rules:
Developing effective behavioural models is both an ongoing process and one with many moving parts on the Splunk backend. As such, there are views developed which enable you to monitor the health of your deployed searches, both Behavioral Indicators and Scoring Rules, and to drilldown to edit existing rules when required.
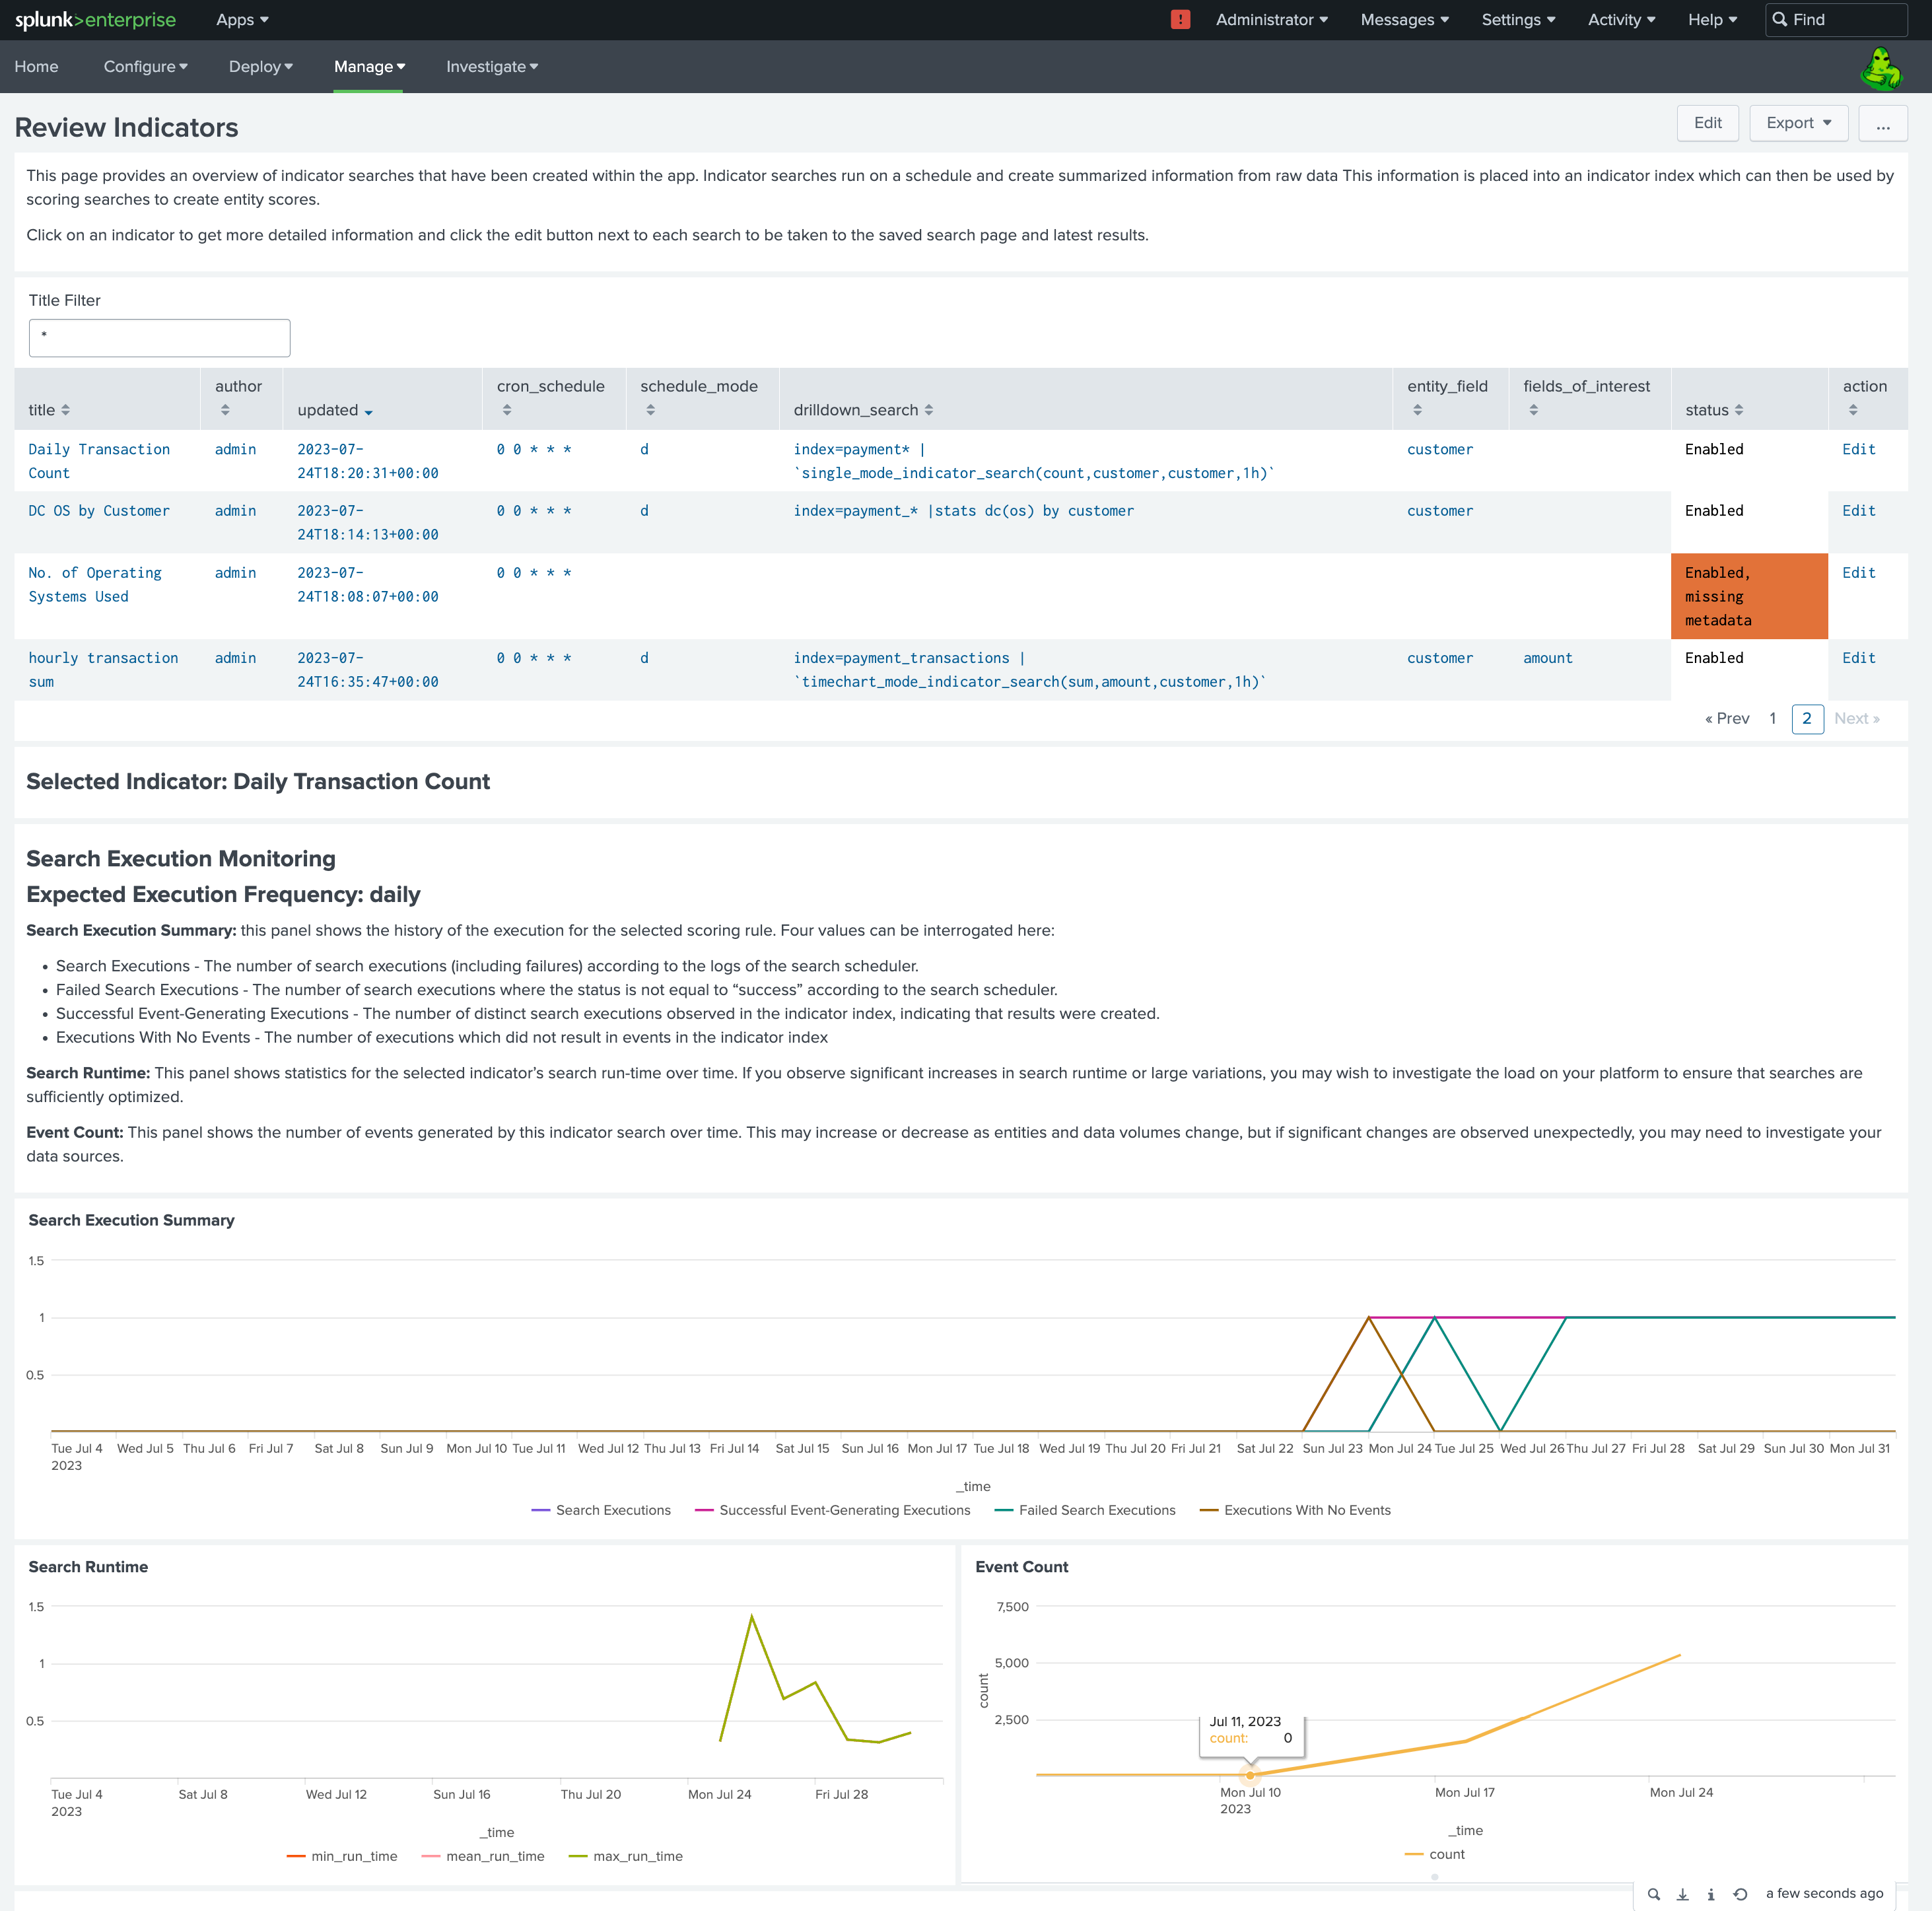
Review Indicators:
This dashboard provides a selectable table of all the indicator searches which are defined on the instance. Listed is their name, owner, schedule, status (enabled/disabled), specified base search and relevant fields. Additionally an edit button links to the underlying saved search where the user can edit the SPL, schedule or enable/disable the search.
Selecting a search from the table opens up two sections of panels:
-
Search Execution Monitoring: a selection of views displaying the searches which have run successfully/failed and of those which ran successfully produced events or didn't, The number of events returned by recent searches and the average run time of the searches. These panels are designed to highlight any issues with the search logic or failure by the search to run.
-
Indicator Data Analysis: a pair of panels summarising the content of the indicator fields. The first covers statistics on the numeric values of various fields within the indicator search and the second shows the cardinality of field values, which is useful for gauging the range of non-numeric values represented and can aid investigation into search execution failures.
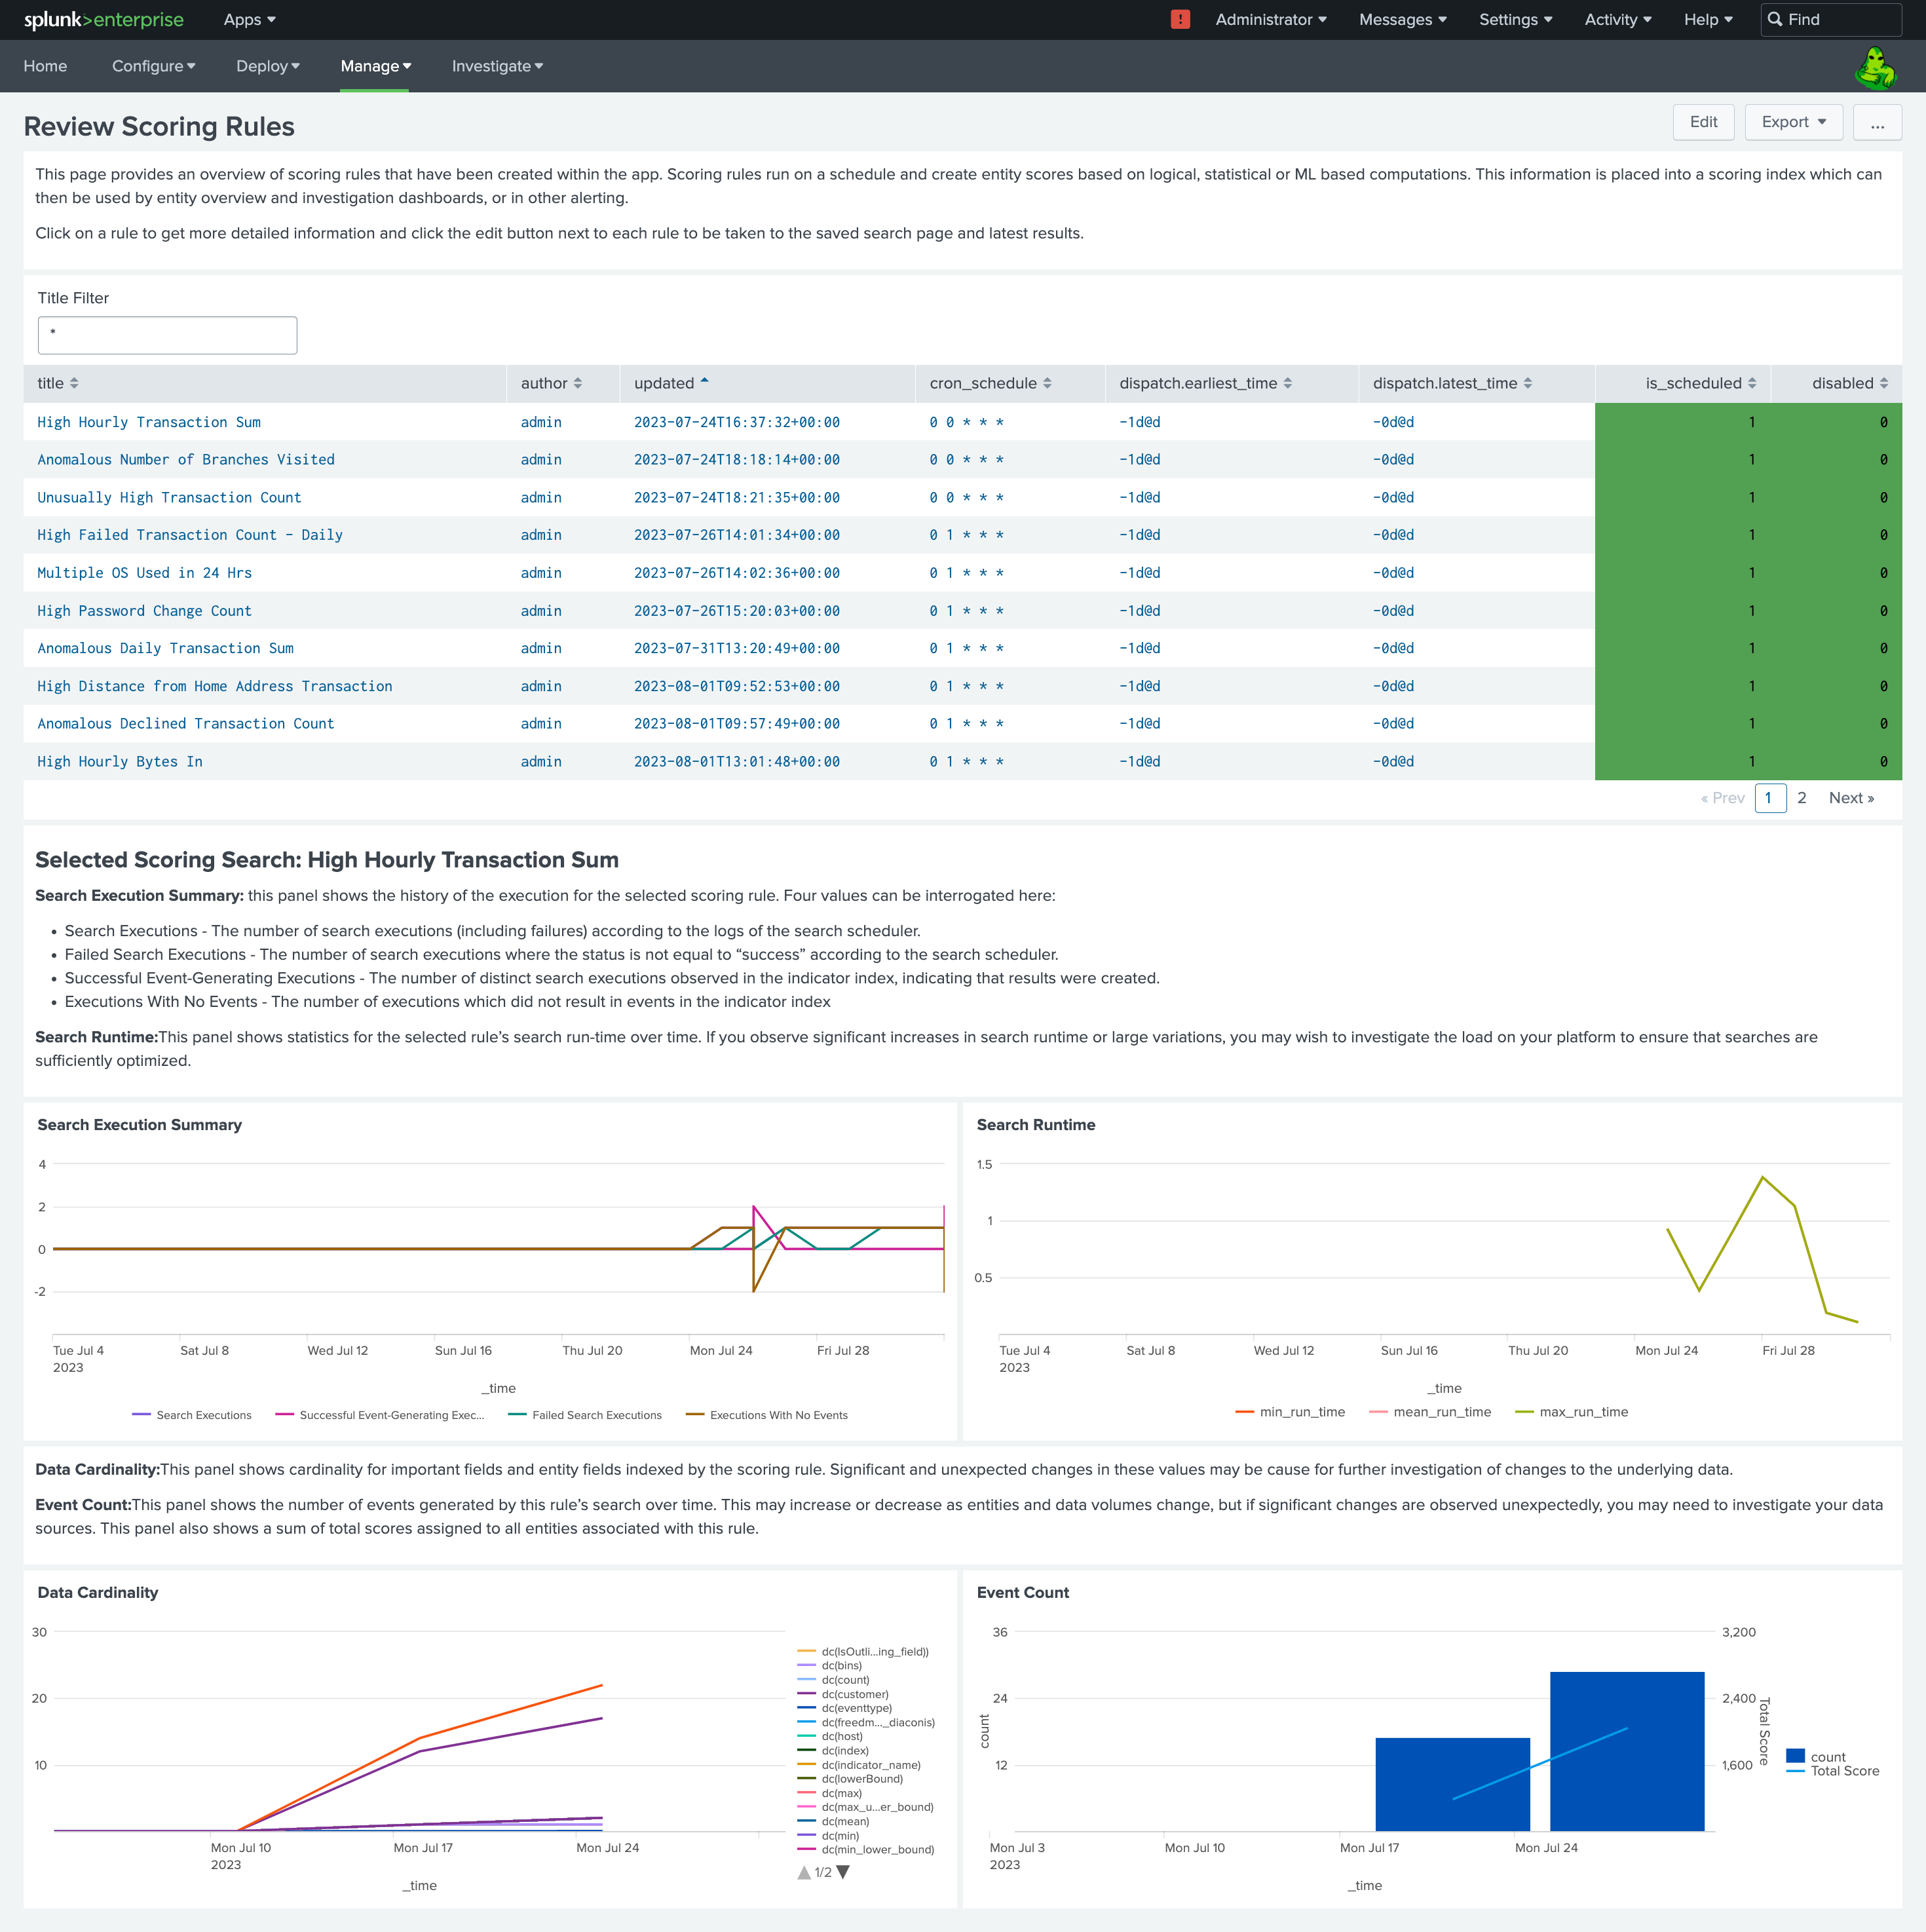
Review Scoring Rules:
This dashboard provides a selectable table of all the scoring rule searches which are defined on the instance. Listed is their name, owner, schedule, status (enabled/disabled), specified base search and relevant fields. Additionally an edit button links to the underlying saved search where the user can edit the SPL, schedule or enable/disable the search.
Selecting a search from the table opens up four panels:
- Search Execution Summary: This panel shows the history of the execution for the selected scoring rule.
- Search Runtime: This panel shows statistics for the selected rule’s search run-time over time. If you observe significant increases in search runtime or large variations, you may wish to investigate the load on your platform to ensure that searches are sufficiently optimized.
- Data Cardinality: This panel shows cardinality for important fields and entity fields indexed by the scoring rule. Significant and unexpected changes in these values may be cause for further investigation of changes to the underlying data.
- Event Count: This panel shows the number of events generated by this rule’s search over time. This may increase or decrease as entities and data volumes change, but if significant changes are observed unexpectedly, you may need to investigate your data sources. This panel also shows a sum of total scores assigned to all entities associated with this rule.