Using the v6 Collector
The collector page is the operator screen for up to four independent rigs. The footer identifies the installed version. These instructions and screenshots describe v6.0.5. Screenshots use an isolated demonstration collector with a mock HEC destination; they do not show production credentials or prove destination availability.
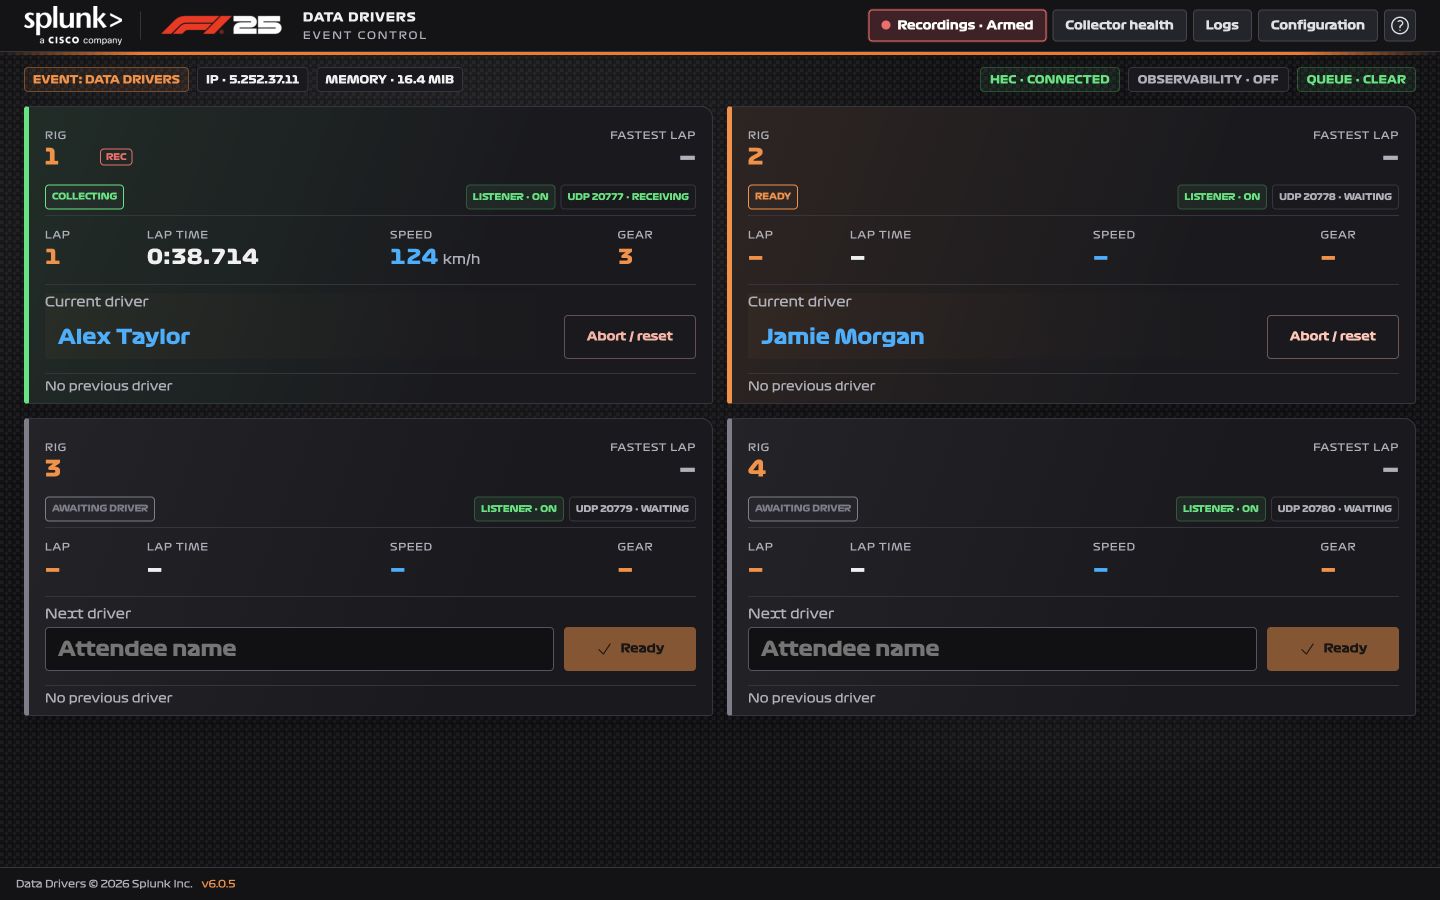
Status bar
| Pill | Meaning |
|---|---|
| Event | Event Name used to identify the event in Splunk. |
| IP | Public internet address. Use the host’s LAN address for local rigs. |
| Memory | Collector-process memory, not the entire host or Docker VM. |
| HEC / Observability | Destination delivery status. Click to open that destination’s health tab. |
| Queue | Outgoing batches waiting on disk. Click for queue health. |
Connected means delivery has succeeded and there is no current delivery problem; it does not verify dashboard results. Waiting means no successful delivery since startup. Retrying means a failed delivery is being retried. Off means disabled. A disabled destination with retained data is paused.
The Queue pill suppresses brief pending batches for three seconds to avoid flicker. Delayed uses the configured warning threshold, normally 30 seconds. That threshold never expires or deletes data.
Rig cards
| Card state | Operator meaning |
|---|---|
| Awaiting driver | Enter the next attendee. No race is being collected. |
| Driver required | Game traffic is arriving without a ready driver; race payloads are not saved or forwarded. |
| Ready (papaya) | Driver assigned; waiting for the first starting light. |
| Collecting (green) | Race telemetry is being accepted. |
| Awaiting result (cyan) | Session Ended arrived; wait for Final Classification. |
| Saving result | Final Classification arrived; local completion is being committed. Wait. |
| Warning / error | Select the pill to open the relevant activity log. |
Listener · On means the UDP socket is open. The UDP pill describes traffic, not whether a race is being captured. Silence before a race or between drivers is normal. A genuine interruption during capture needs investigation.
Each card shows Rig, Fastest Lap (purple), Lap, Lap Time, Speed and Gear. The current driver replaces the entry field after assignment, displayed in cyan. The label, name and action button stay aligned; entered and assigned names use the same bold typography. The bottom row retains the last result; Saved locally is not a Splunk delivery acknowledgement.
Entering a driver name
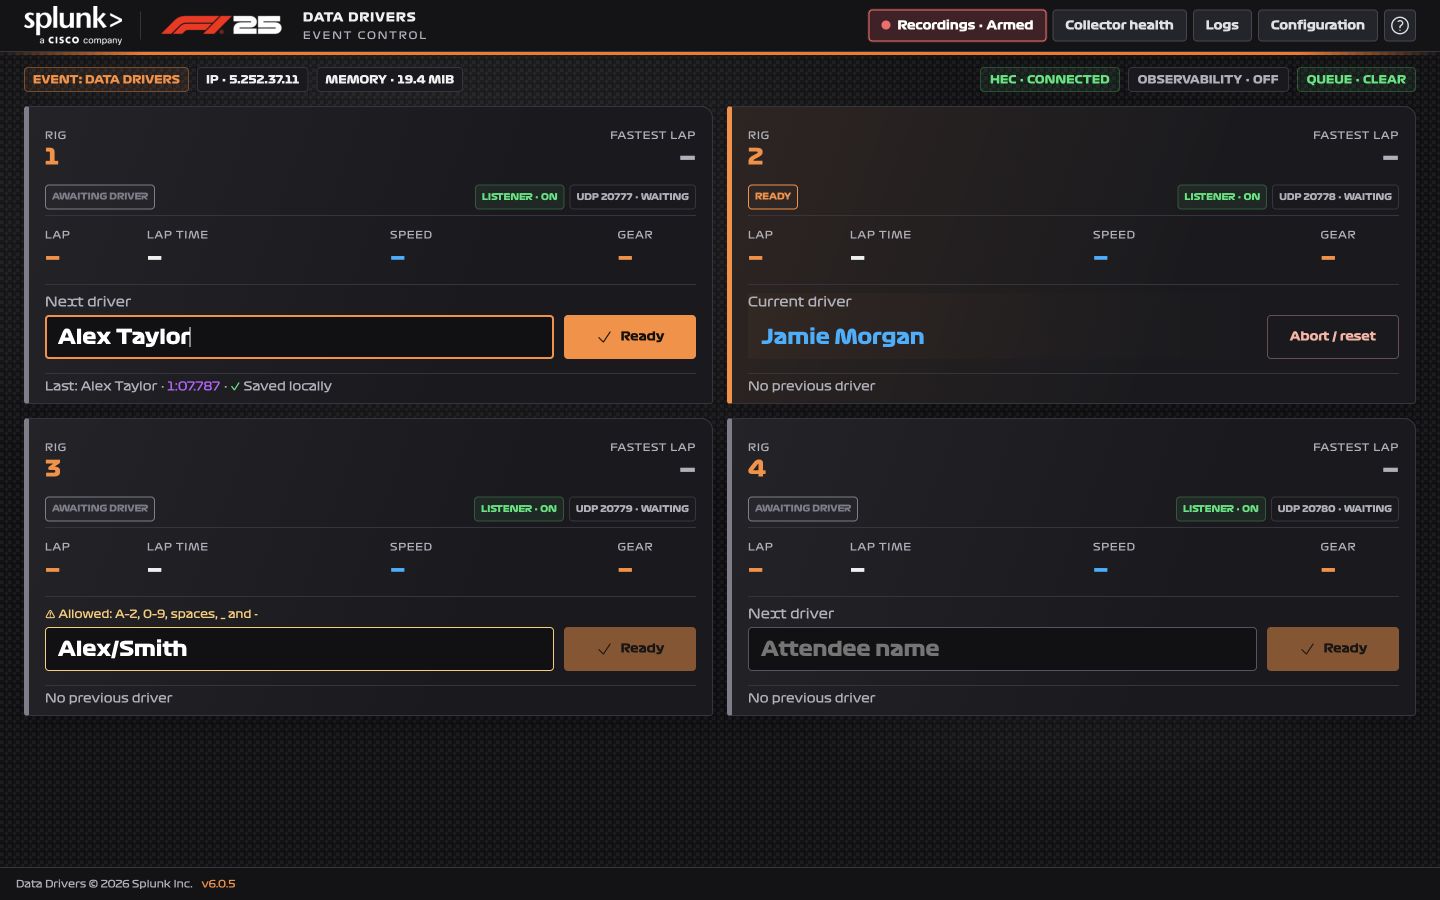
- Enter the attendee’s display name in Next driver on the correct rig.
- Select Ready before the game starts its lights.
- Ask the attendee to start the race. Capture begins at STLG 1, the first starting light.
Names must contain 1–60 characters using A–Z, a–z, 0–9, ordinary spaces, underscores or hyphens. Apostrophes, accents, slashes and other punctuation are not accepted. Leading/trailing spaces are trimmed; spaces inside the name remain in the UI and Splunk.
Validation runs as you type. An invalid name stays visible, the label changes to an amber explanation, and Ready is disabled until corrected. The warning uses the existing label row, keeping card height unchanged. The API applies the same rules.
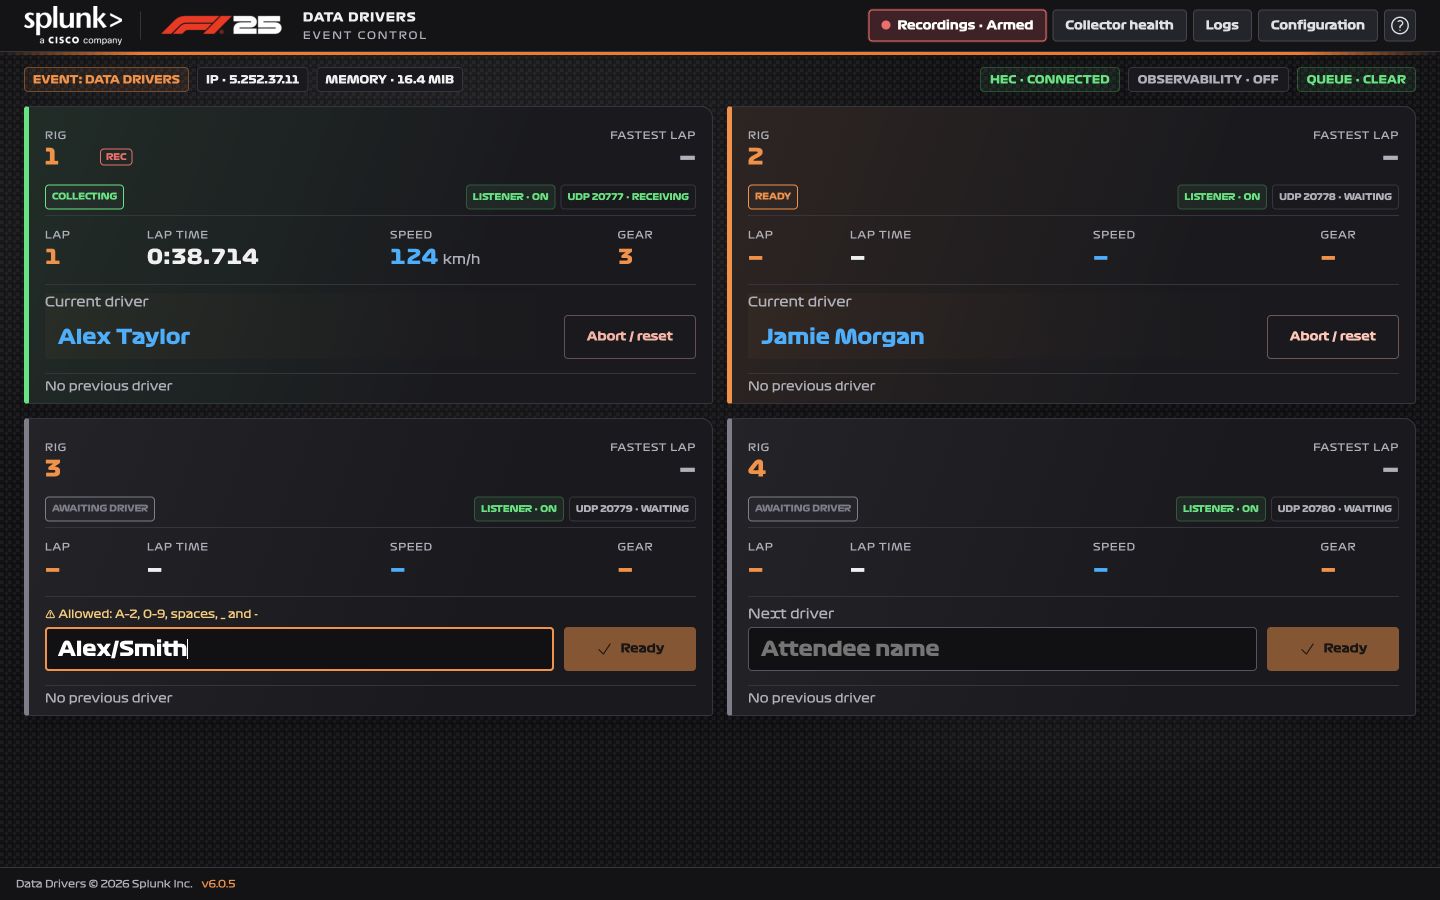
A name is required for collection. Editing a name after missing the lights cannot recover the beginning of that race. See Running an Event.
Top menu
| Button | Use |
|---|---|
| Recordings | Arm recording globally, upload/download files and play a race on an idle rig. |
| Collector health | Inspect Overview, Rigs, HEC, Observability and Queue. |
| Logs | Search and download the current run’s activity history. The red badge counts unread warnings/errors. |
| Configuration | Set the event, rigs and destinations. |
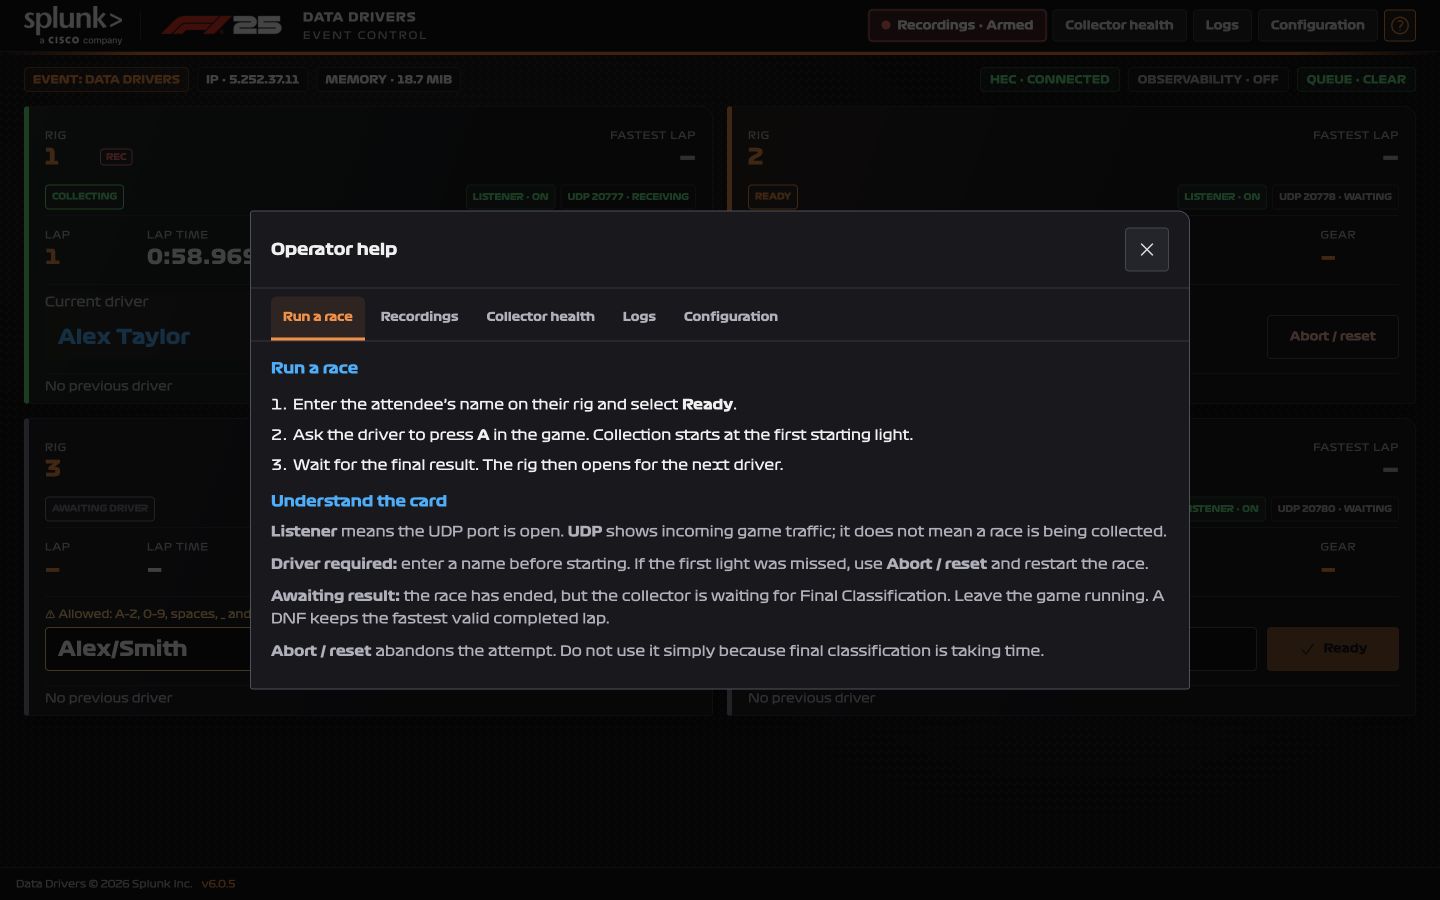
| ? | Tabbed help for race operation and each menu feature. |
Recommended first-use sequence
Configure the event and destinations, verify Listener · On, configure the game’s UDP address/port, then run a complete three-lap test race with a ready driver. Verify the final result and both destination dashboards. There is no Master Control switch in v6; listeners start with the collector.