Collector Configuration
Open Configuration. The Event, Rigs, HEC, Observability and Queue tabs share one Save configuration button. Settings persist in /data/config.json. Use a named Docker volume mounted at /data so replacement containers and Watchtower updates reuse them; see persistent storage.
General
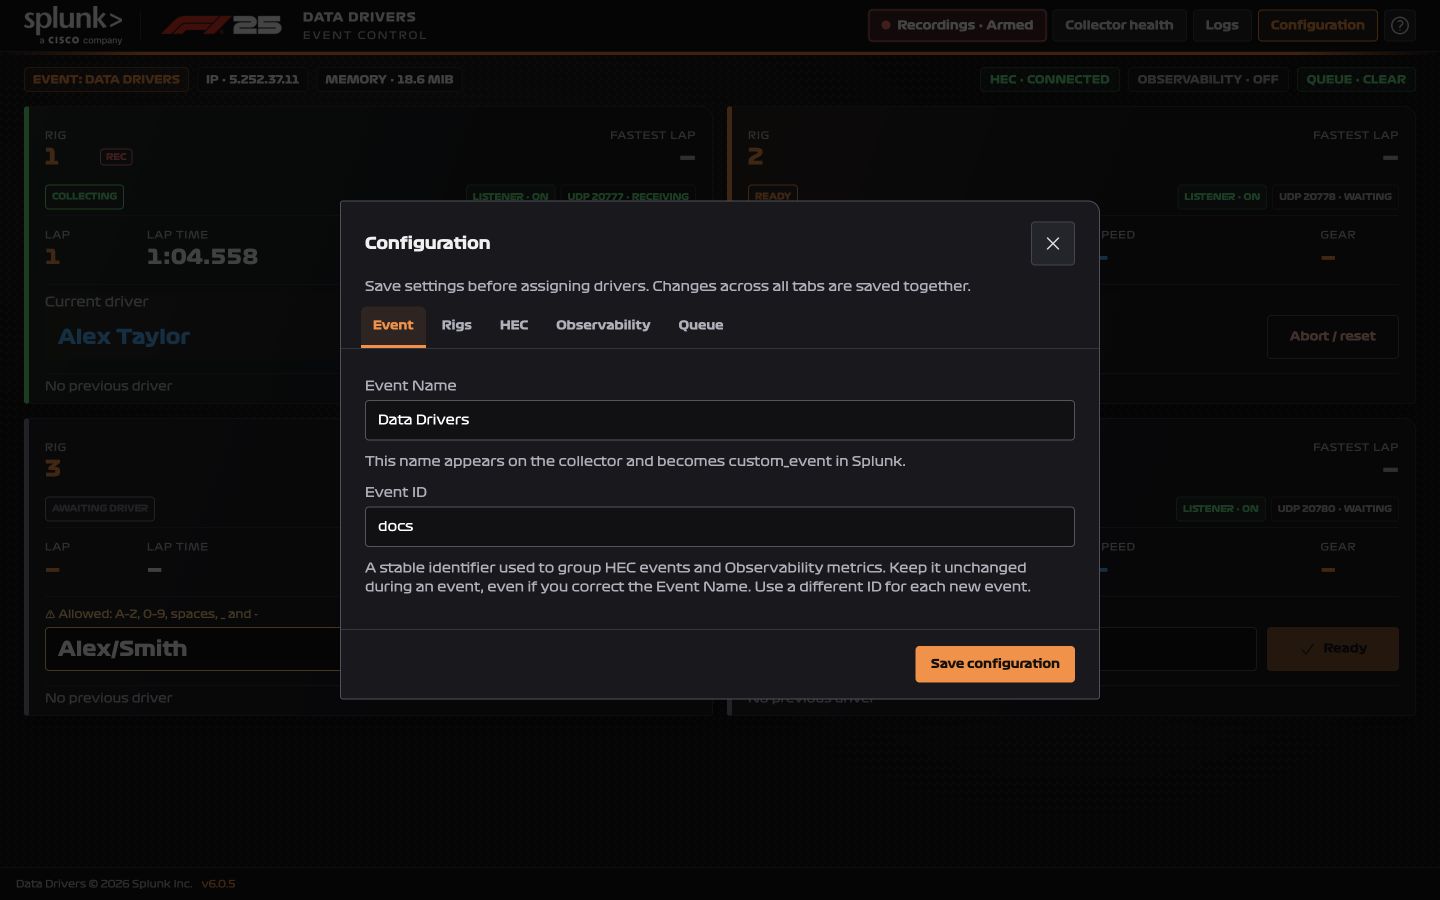
Under Event, set Event Name (shown in the UI and exported as HEC custom_event) and Event ID (a stable event identifier). Keep the ID fixed throughout the event; use a new ID for a new event.
Under Rigs, configure one to four rigs with unique IDs and UDP ports. The optional source IP restricts which game host can supply that rig. Standard ports are:
| Rig | UDP port |
|---|---|
| Rig 1 | 20777 |
| Rig 2 | 20778 |
| Rig 3 | 20779 |
| Rig 4 | 20780 |
Save event, rig and destination changes before assigning drivers. Changes affecting assigned rigs are rejected until those attempts finish or are reset. Queue warning, disk limit, health export and health interval can be changed during capture. Listeners start automatically; there is no deploy-then-Master-Control sequence.
Destinations
Enable HEC, Observability, or both. At least one destination must be configured and enabled before assigning a driver. Blank token fields retain saved tokens. Test saved connection uses saved settings, so save first.
Splunk Enterprise / Cloud
- Open HEC and select Enable HEC.
- Enter the HEC URL, such as
https://splunk.example.com:8088, and token. - Save, then select Test saved connection.
The HEC token determines the index; the collector has no index override. Use http:// only for an endpoint actually serving plain HTTP. For HTTPS, certificate verification is enabled by default. The Allow unverified HEC certificates option supports self-signed/IP-addressed endpoints when required by your deployment. Observability always verifies certificates.
Changing a destination URL sends its retained backlog to the new address with the original event metadata. Disabling a destination pauses its backlog; it does not discard it.
Splunk Observability Cloud
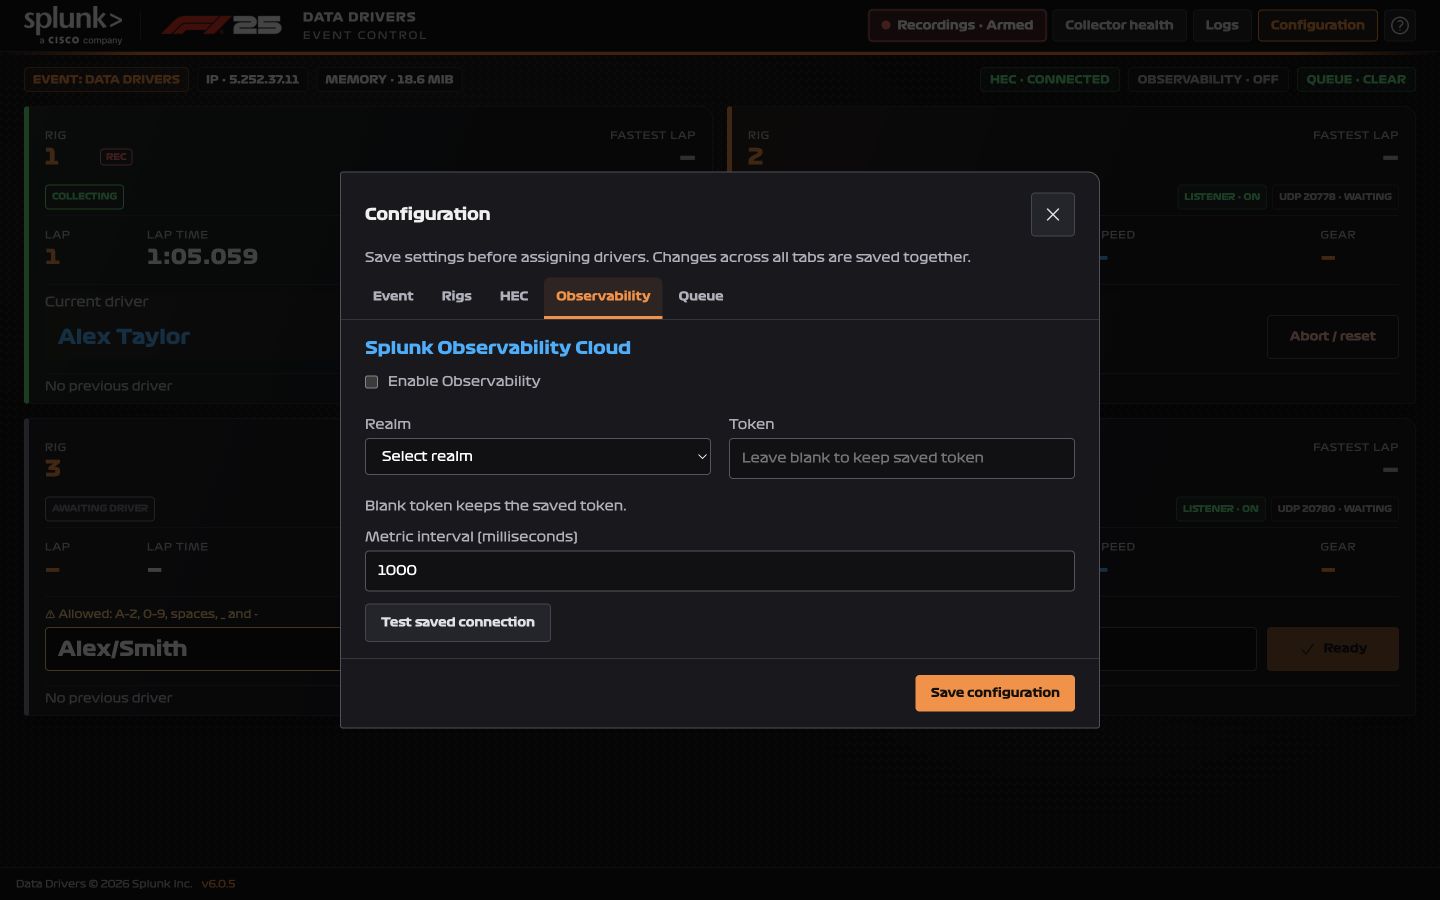
Enable Observability, select your organization’s realm, enter the token, save and test. Supported realms: au0, eu0, eu1, eu2, jp0, sg0, us0, us1, us2. The endpoint is derived as https://ingest.<realm>.observability.splunkcloud.com/v2/datapoint; no URL override is needed.
The collector exports 24 race gauges with the dashboard metric names and dimensions. The Metric interval controls the additional sampled gauges, not all race gauges. HEC sends flattened events; Observability sends metrics.
On Splunk Show
Leave the provisioned HEC settings unchanged unless your administrator directs otherwise. Configure your own Observability realm/token if needed. Confirm the installed release using the footer.
Automation
Both POST /update_hec and POST /api/update_hec accept the fields hec_url, hec_token, and hec_enabled. Boolean, 0/1 and quoted equivalents such as "true" are accepted. Explicit null is rejected. Success returns HTTP 200 with {"message":"HEC configuration updated successfully"}.
These routes enable the HEC-only unverified-certificate setting. Existing Ansible requests to port 81 work when that port is published. Apply updates before assigning drivers, and restrict configuration API access to the operator/automation network.
Queue and health export
The Queue tab sets the warning age (default 30 seconds), disk budget (default 2048 MiB) and health export (default every 10 seconds). The warning age never deletes data. At the storage limit, collection reports an error; existing queued batches remain intact.
Health export continues between races. Disable it here if unwanted; the local health view still works. Optional health samples may be skipped to reserve capacity for race data.
Playback Mode
Playback is no longer a global configuration mode. Use Recordings → Playback for a single 1× replay on an idle rig. See recording and playback instructions.
What starting validates
Before selecting Ready, configure an event, valid rig settings and at least one enabled destination. Check listener/storage status and test each saved destination. A destination outage during an event uses the disk queue; it does not require restarting all rigs.