Monitoring and Troubleshooting
Check game reception, race progress and destination delivery separately. A green UDP pill alone does not mean a race is being captured or that Splunk has received it.
Pre-event checklist
- Confirm the expected v6 image/version and a healthy container.
- Confirm Event, rig ports and Listener · On on every rig.
- Test both saved destinations you intend to use.
- Run a complete three-lap race on every rig at normal speed, entering a driver and selecting Ready before the first light.
- Check SEND → Awaiting result → Final Classification → next driver, with the correct fastest lap.
- Verify the events/metrics and driver/event filters in your actual dashboards.
- Check that both destination queues drain and there are no unresolved storage errors.
- If recording is needed, arm it, then download and test a completed file.
Collector Health
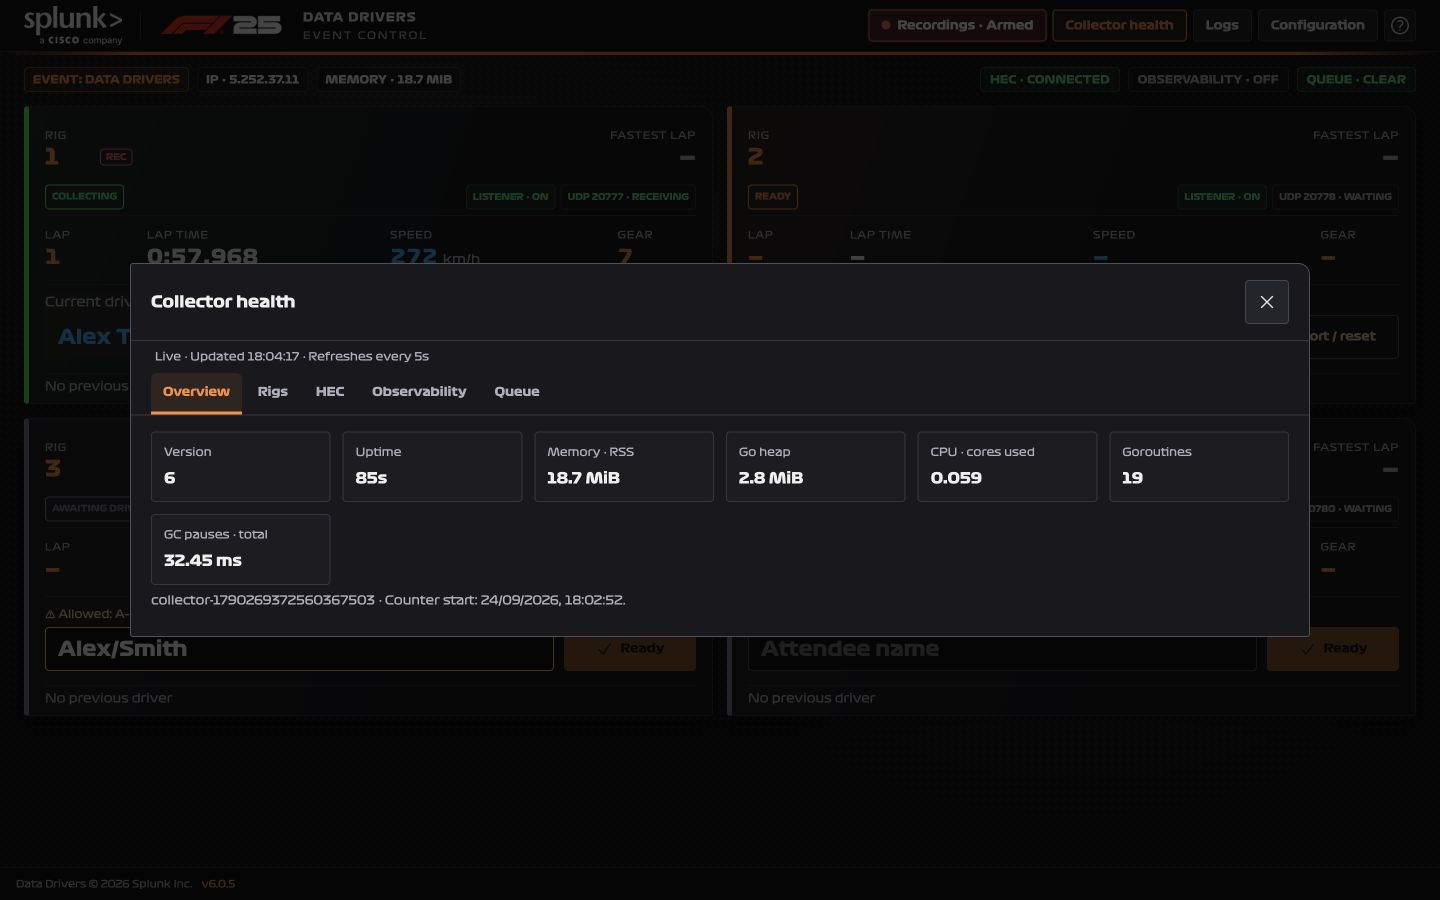
Collector health refreshes every five seconds and has one row of tabs:
| Tab | What to inspect |
|---|---|
| Overview | Process uptime, memory, CPU and runtime diagnostics. |
| Rigs | Listener status, packet/byte rates, invalid packets, filtered reasons and race counters. |
| HEC | Delivery attempts, failures, latency, last delivery and errors. |
| Observability | Independent metric delivery status and errors. |
| Queue | Pending batches, oldest age, disk usage/headroom, writer buffer and health exports. |
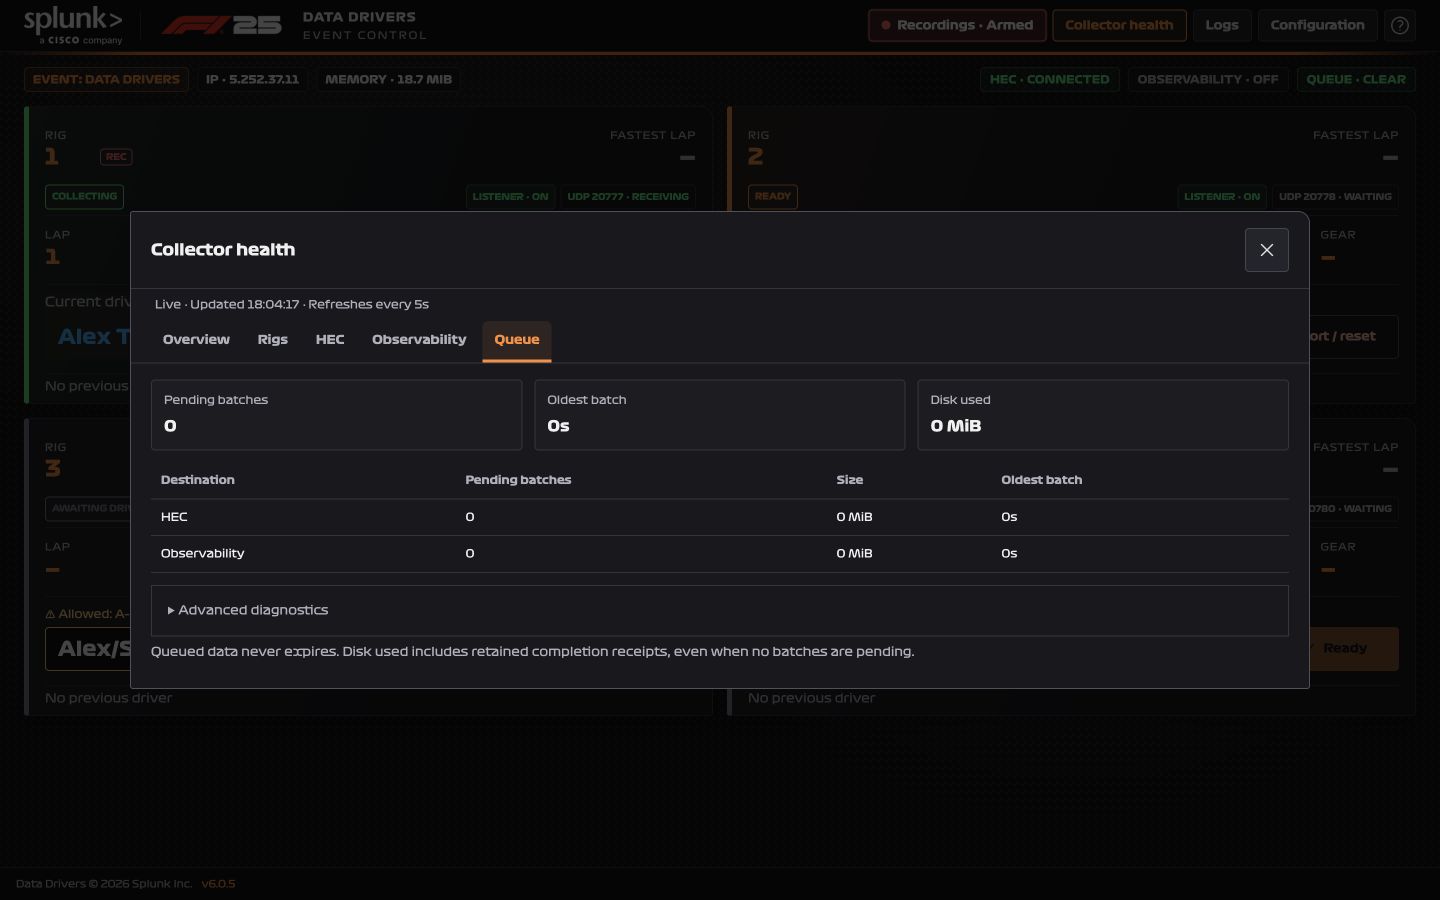
Filtered means deliberately excluded traffic: no ready driver, before the first light, closed/wrong session, another car or an old/duplicate frame. It is not measured UDP packet loss. Health samples skipped means optional health exports were not admitted under pressure; already persisted samples remain queued.
Goroutines and garbage-collection pauses are diagnostic indicators, useful when investigating growing resource usage or stalls. They are not race states. Memory in Docker is process RSS; counters generally reset on restart or listener recreation.
Health data in Splunk
Health export is enabled by default. Per-rig HEC health uses sourcetype=SplunkData, source=f1_2025 and hosts rig_1–rig_4, preserving the existing rate/count dashboard fields. Process/delivery health uses sourcetype=CollectorHealth. Observability health uses f1.collector.*. Configure export and its interval under Configuration → Queue.
Logs
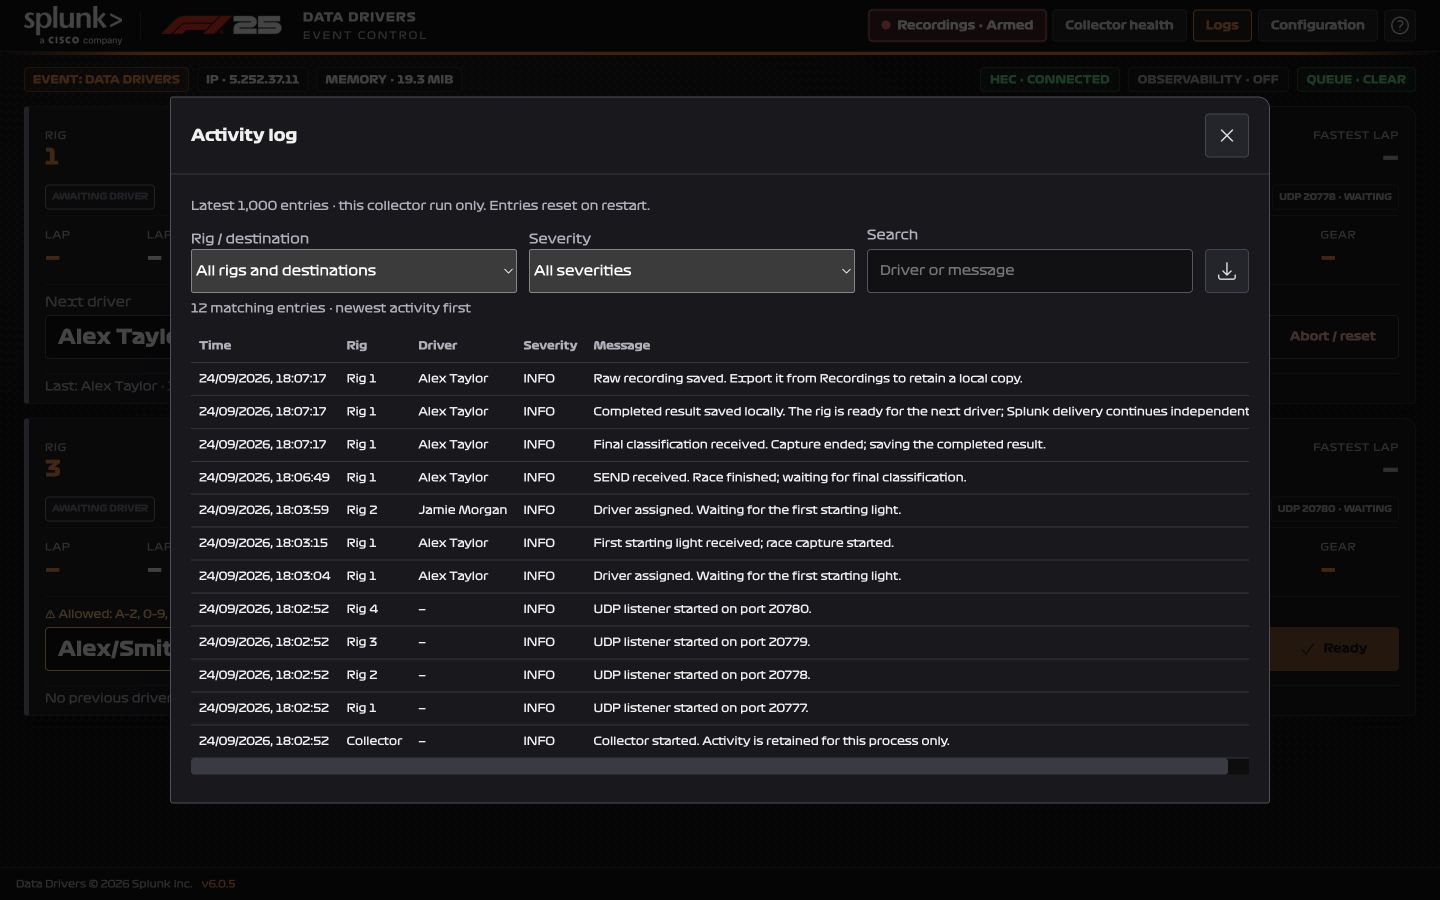
Open Logs, or select a rig status/listener/UDP pill for that rig’s history. Filter by rig/destination and severity, or search driver/message text. Use the download icon to export retained entries as JSON.
The latest 1,000 entries are held in memory for the current run; they reset on restart and are not forwarded to Splunk. Repeated identical messages are grouped; a ×N badge appears beside the message only when it occurs more than once. There is no separate Count column. Grouping requires the same rig/destination, driver, severity and message within 60 seconds of the previous occurrence, with no intervening different entry for that rig/destination. The red badge tracks unread warnings and errors. Export before restarting when investigating a problem. Container logs are also available with docker logs -f f1-2025 (substitute your container name).
Common problems
| Symptom | Action |
|---|---|
| Driver required / UDP not collecting | Enter the name and select Ready before starting. If the lights passed, restart the race. |
| First light missed | Abort/reset the attempt, assign the driver and restart the race. |
| Awaiting result | Leave the game running to Final Classification; SEND alone does not complete a heat. |
| Saving result / storage error | Check free space, volume writability and Queue health. Let local saving recover; do not force a duplicate heat. |
| Listener failed | Check for another process using the UDP port, correct Configuration → Rigs and save to retry. |
| Delivery retrying | Check destination health and logs, URL scheme/port, token, realm and network reachability. |
| Queue delayed | Restore delivery and watch each destination drain. Raising the warning threshold does not fix the outage. |
| Status unavailable | Browser cannot confirm the collector’s current state. Check the container/network; do not rely on stale card values. |
Configuration missing after an update
Verify that f1-v6-data is mounted at /data; creating a replacement without reusing storage starts with fresh settings. See persistent storage and Watchtower. Do not delete old anonymous volumes before checking whether they contain the missing configuration.
No UDP packets
Confirm F1 25 UDP Telemetry On, Broadcast Off, format 2025, correct collector address and unique rig port. Check Docker UDP publishing, host firewall/cloud security group and any configured source-IP restriction. The public IP pill is not the address to use for a LAN-only collector.
Packets arrive but no events are delivered
First distinguish reception from capture: a driver must be Ready before STLG 1. Then check the destination is enabled, its saved connection test succeeds and its queue is progressing. The HEC token selects the index. Check event-name and time-range filters in dashboards.
Delivery errors while no one is racing
Health exports still send data between races. Sleep, network interruptions or destination outages can therefore cause delivery failures while UDP is idle. Brief transient failures update health but are suppressed in the activity log; sustained failures are reported after the queue warning threshold. Credential/destination rejections are reported immediately. Retained batches are retried.
Queue retention and shutdown
Unsent batches are stored independently per destination on /data. They survive container restarts with the volume preserved and do not expire after 30 seconds. Delivery is at least once: a lost response may cause a duplicate; use record_id when deduplicating HEC events.
Graceful shutdown stops admission and drains accepted telemetry to disk. If storage is unwritable, shutdown waits for recovery; a forced kill or power loss can still lose unwritten memory. Use the deployment’s stop grace period and resolve storage errors before forcing termination.
Before terminating a disposable EC2 instance, check both queues are empty and export any wanted recordings/logs. A locally saved result or a healthy container is not proof that every queued batch is already in Splunk.