Viewing the Logs
In order to see logs click on the Log Observer ![]()
![]() in the left-hand menu. Once in Log Observer please ensure Index on the filter bar is set to splunk4rookies-workshop.
in the left-hand menu. Once in Log Observer please ensure Index on the filter bar is set to splunk4rookies-workshop.
Next, click Add Filter and search for the field deployment.environment, select your workshop instance and click = (to include). You will now see only the log messages from your PetClinic application.
Next search for the field service_name, select the value customers-service and click = (to include). Now the log entries will be reduced to show the entries from your customers-service only.
In the log entry you will see the message is formatted as per the pattern we configured for logback eariler (1):
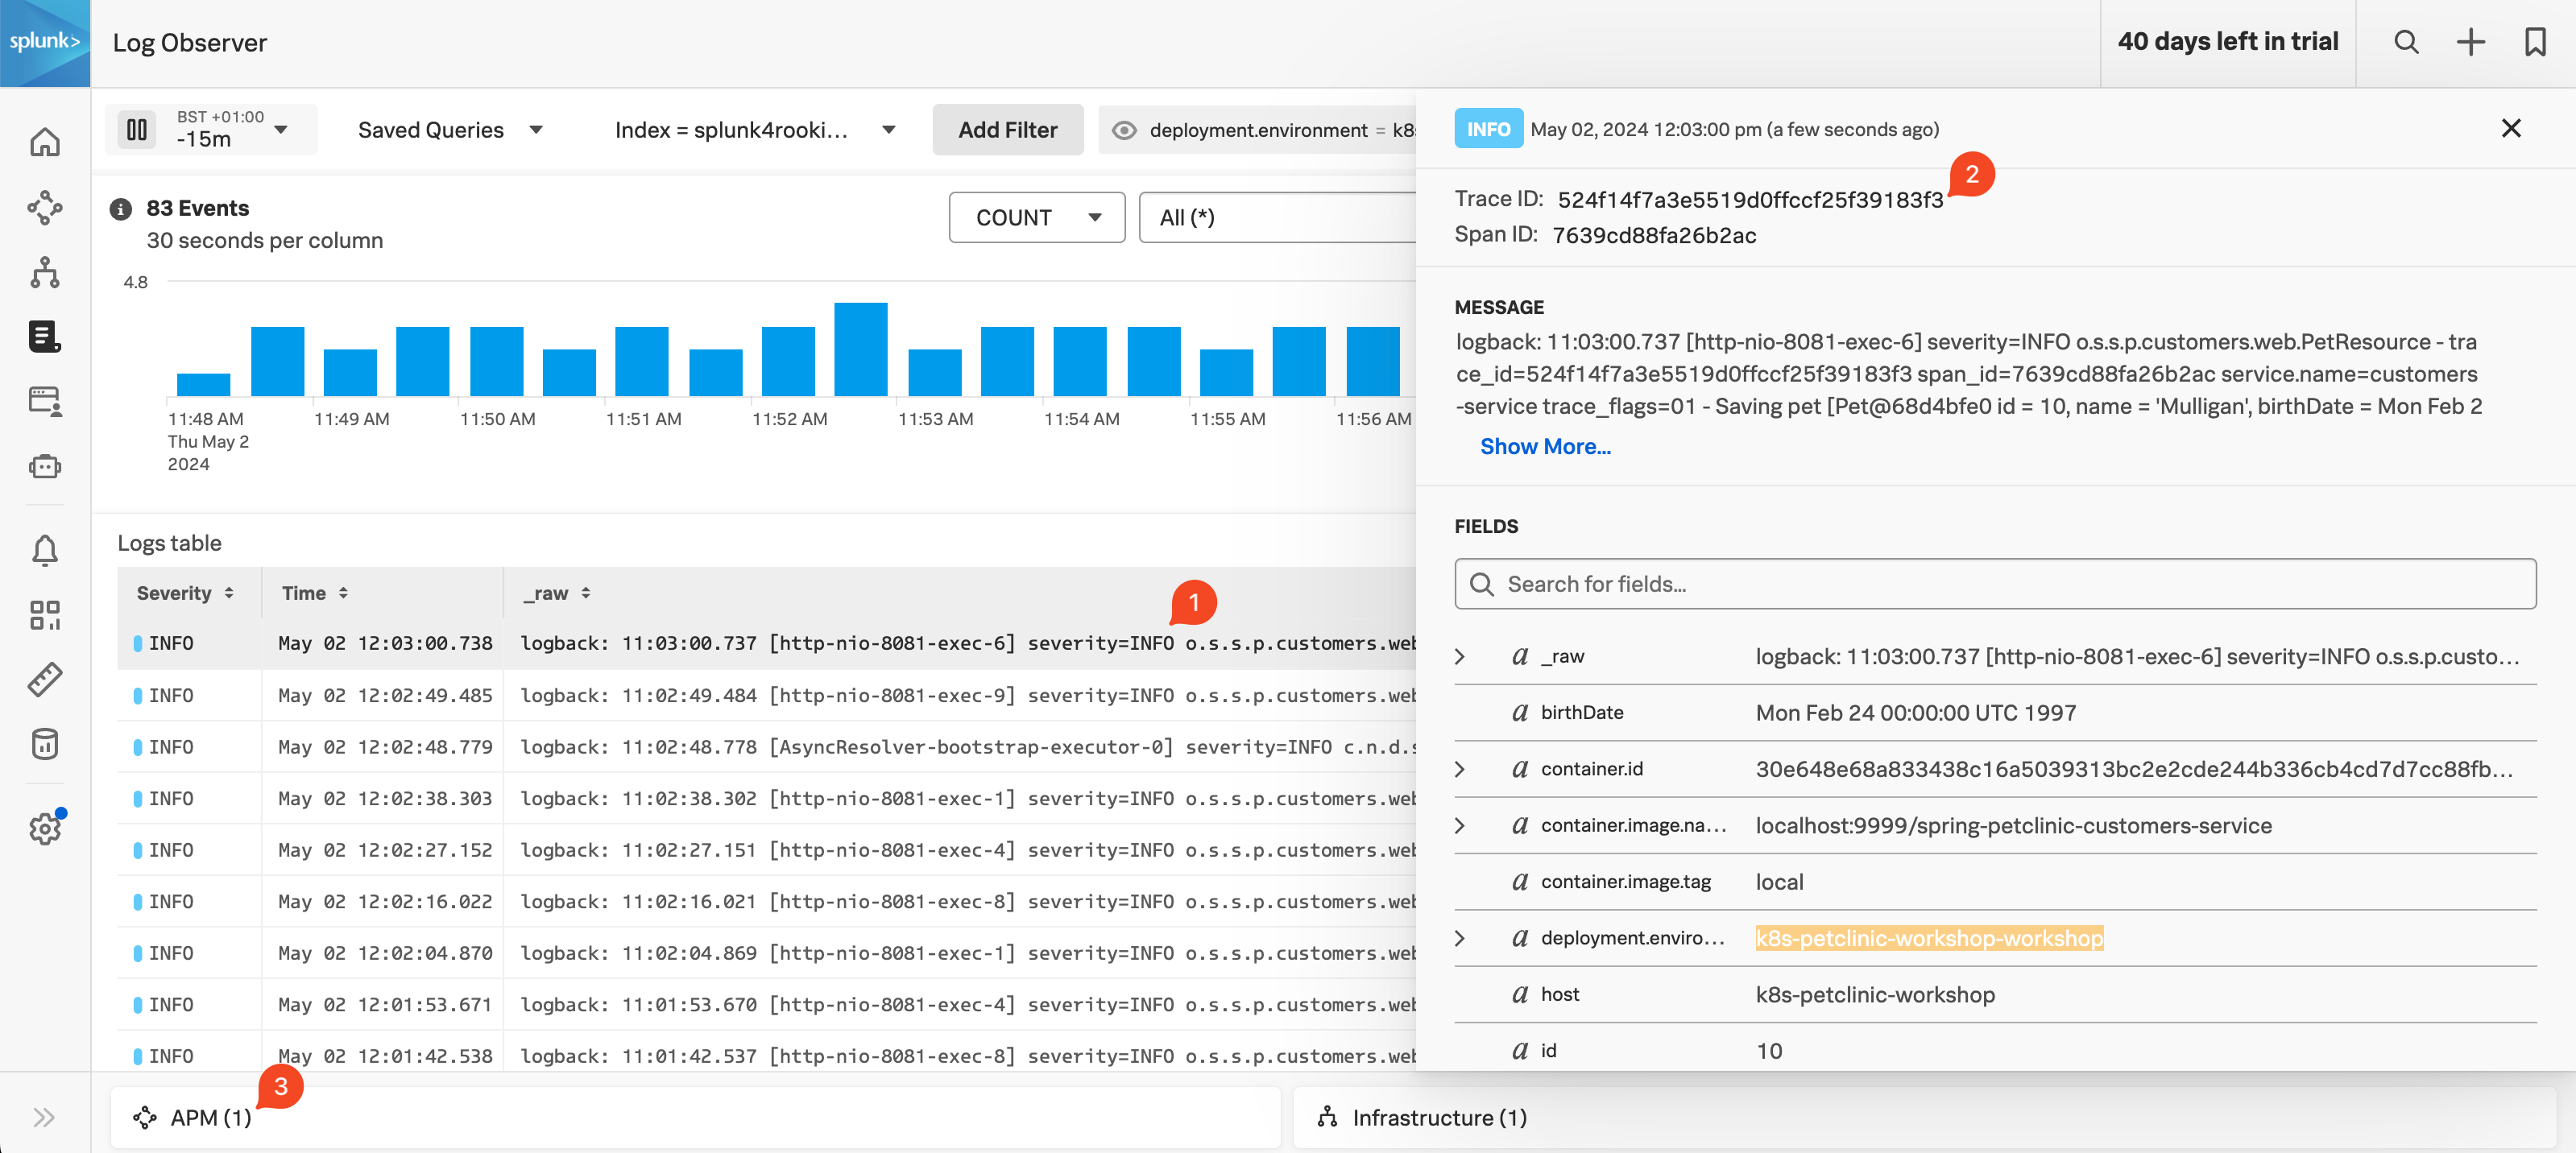
Click on an entry with an injected trace_id (1). A side pane will open where you can see the detailed information, including the relevant trace and span IDs (2).