Up until this point, there have been no code changes, yet tracing, profiling and Database Query Performance data is being sent to Splunk Observability Cloud.
Next we will add the Splunk Log Observer to the mix to obtain log data from the Spring PetClinic application.
This change will update the configuration of logback in the Spring PetClinic application. This will allow the automatic discovery and configuration to add OpenTelemetry relevant information into the logs.
The Splunk Log Observer is then used to view the logs and with the changes to the log format the platform can automatically correlate log information with services and traces.
First, clone the PetClinic GitHub repository, as we will need this later in the workshop to compile, build, package and containerize the application:
cd ~ && git clone https://github.com/hagen-p/spring-petclinic-microservices.git
Then change into the spring-petclinic-microservices directory:
cd ~/spring-petclinic-microservices
The Spring PetClinic application can be configured to use several different Java logging libraries. In this scenario, the application is using logback. To make sure we get the OpenTelemetry information in the logs we need to update a file named logback.xml with the log structure and add an OpenTelemetry dependency to the pom.xml of each of the services in the PetClinic microservices folders.
First, let’s set the Log Structure/Format. SpringBoot will allow you to set a global template, but for ease of use, we will replace the existing content of the logback-spring.xml files of each service with the following XML content using a prepared script.
Note
The following entries will be added:
trace_id
span_id
trace_flags
service.name
deployment.environment
These fields allow the Splunk Observability Cloud to display Related Content when using the log pattern shown below:
The following script will update the logback-spring.xml for all of the services with the log structure in the format above:
. ~/workshop/petclinic/scripts/update_logback.sh
Overwritten /home/splunk/spring-petclinic-microservices/spring-petclinic-admin-server/src/main/resources/logback-spring.xml with new XML content.
Overwritten /home/splunk/spring-petclinic-microservices/spring-petclinic-api-gateway/src/main/resources/logback-spring.xml with new XML content.
Overwritten /home/splunk/spring-petclinic-microservices/spring-petclinic-config-server/src/main/resources/logback-spring.xml with new XML content.
Overwritten /home/splunk/spring-petclinic-microservices/spring-petclinic-customers-service/src/main/resources/logback-spring.xml with new XML content.
Overwritten /home/splunk/spring-petclinic-microservices/spring-petclinic-discovery-server/src/main/resources/logback-spring.xml with new XML content.
Overwritten /home/splunk/spring-petclinic-microservices/spring-petclinic-vets-service/src/main/resources/logback-spring.xml with new XML content.
Overwritten /home/splunk/spring-petclinic-microservices/spring-petclinic-visits-service/src/main/resources/logback-spring.xml with new XML content.
Script execution completed.
We can verify if the replacement has been successful by examining the logback-spring.xml file from one of the services:
Before we can build the new services with the updated log format we need to add the OpenTelemetry dependency that handles field injection to the pom.xml of our services:
. ~/workshop/petclinic/scripts/add_otel.sh
Dependencies added successfully in spring-petclinic-admin-server
Dependencies added successfully in spring-petclinic-api-gateway
Dependencies added successfully in spring-petclinic-config-server
Dependencies added successfully in spring-petclinic-discovery-server
Dependencies added successfully in spring-petclinic-customers-service
Dependencies added successfully in spring-petclinic-vets-service
Dependencies added successfully in spring-petclinic-visits-service
Dependency addition complete!
The Services are now ready to be built, so run the script that will use the maven command to compile/build/package the PetClinic microservices:
Note
Note the -P buildDocker, this will build the new containers and take 3-5 minutes to complete.
Given that Kubernetes needs to pull these freshly built images from somewhere, we are going to store them in the repository we tested earlier. To do this, run the script that will push the newly built containers into our local repository:
. ~/workshop/petclinic/scripts/push_docker.sh
The push refers to repository [localhost:5000/spring-petclinic-vets-service]
0391386bcb2a: Preparing
bbb67f51a186: Preparing
105351d0ada3: Preparing
49cfeae6cb9f: Preparing
b4da5101fcde: Preparing
49cfeae6cb9f: Pushed
e742c14be110: Mounted from spring-petclinic-visits-service
540aa741fede: Mounted from spring-petclinic-visits-service
a1dfe59d4939: Mounted from spring-petclinic-visits-service
1e99e92c46bf: Mounted from spring-petclinic-visits-service
f5aa38537736: Mounted from spring-petclinic-visits-service
d2210512edb4: Mounted from spring-petclinic-visits-service
8e87ff28f1b5: Mounted from spring-petclinic-visits-service
local: digest: sha256:42337b2a4ff7d0ac9b7c2cf3c70aa20b7b52d092f1e05d351e031dd7fad956fc size: 3040
The push refers to repository [localhost:5000/spring-petclinic-customers-service]
15d54d9adca8: Preparing
886f6def5b35: Preparing
1575ae90e858: Preparing
ccc884d92d18: Preparing
b4da5101fcde: Preparing
ccc884d92d18: Pushed
e742c14be110: Mounted from spring-petclinic-vets-service
540aa741fede: Mounted from spring-petclinic-vets-service
a1dfe59d4939: Mounted from spring-petclinic-vets-service
1e99e92c46bf: Mounted from spring-petclinic-vets-service
f5aa38537736: Mounted from spring-petclinic-vets-service
d2210512edb4: Mounted from spring-petclinic-vets-service
8e87ff28f1b5: Mounted from spring-petclinic-vets-service
local: digest: sha256:3601c6e7f58224001946058fb0400483fbb8f1b0ea8a6dbaf403c62b4c1908be size: 3042
The containers should now be stored in the local repository, let’s confirm by checking the catalog:
To see the changes in effect, we need to redeploy the services, First, let’s change the location of the images from the external repo to the local one by running the following script:
. ~/workshop/petclinic/scripts/set_local.sh
Script execution completed. Modified content saved to /home/splunk/workshop/petclinic/petclinic-local.yaml
The result is a new file on disk called petclinic-local.yaml. Switch to the local versions by using the new version of the deployment YAML. First delete the old containers from the original deployment with:
deployment.apps/config-server created
service/config-server created
deployment.apps/discovery-server created
service/discovery-server created
deployment.apps/api-gateway created
service/api-gateway created
service/api-gateway-external created
deployment.apps/customers-service created
service/customers-service created
deployment.apps/vets-service created
service/vets-service created
deployment.apps/visits-service created
service/visits-service created
deployment.apps/admin-server created
service/admin-server created
service/petclinic-db created
deployment.apps/petclinic-db created
configmap/petclinic-db-initdb-config created
deployment.apps/petclinic-loadgen-deployment created
configmap/scriptfile created
This will cause the containers to be replaced with the local version, you can verify this by checking the containers:
However, as we only patched the deployment before, the new deployment does not have the right annotations for the automatic discovery and configuration, so let’s fix that now by running the patch command again:
Note
There will be no change for the admin-server, config-server and discovery-server as they are already annotated.
kubectl get deployments -l app.kubernetes.io/part-of=spring-petclinic -o name | xargs -I % kubectl patch % -p "{\"spec\": {\"template\":{\"metadata\":{\"annotations\":{\"instrumentation.opentelemetry.io/inject-java\":\"default/splunk-otel-collector\"}}}}}"
deployment.apps/config-server patched (no change)
deployment.apps/admin-server patched (no change)
deployment.apps/customers-service patched
deployment.apps/visits-service patched
deployment.apps/discovery-server patched (no change)
deployment.apps/vets-service patched
deployment.apps/api-gateway patched
Check the api-gateway container (again if you see two api-gateway containers, it’s the old container being terminated so give it a few seconds):
kubectl describe pods api-gateway | grep Image:
The resulting output will show the local api gateway version localhost:9999 and the auto-instrumentation container:
In order to see logs click on the Log Observer in the left-hand menu. Once in Log Observer please ensure Index on the filter bar is set to splunk4rookies-workshop.
Next, click Add Filter and search for the field deployment.environment, select your workshop instance and click = (to include). You will now see only the log messages from your PetClinic application.
Next search for the field service_name, select the value customers-service and click = (to include). Now the log entries will be reduced to show the entries from your customers-service only.
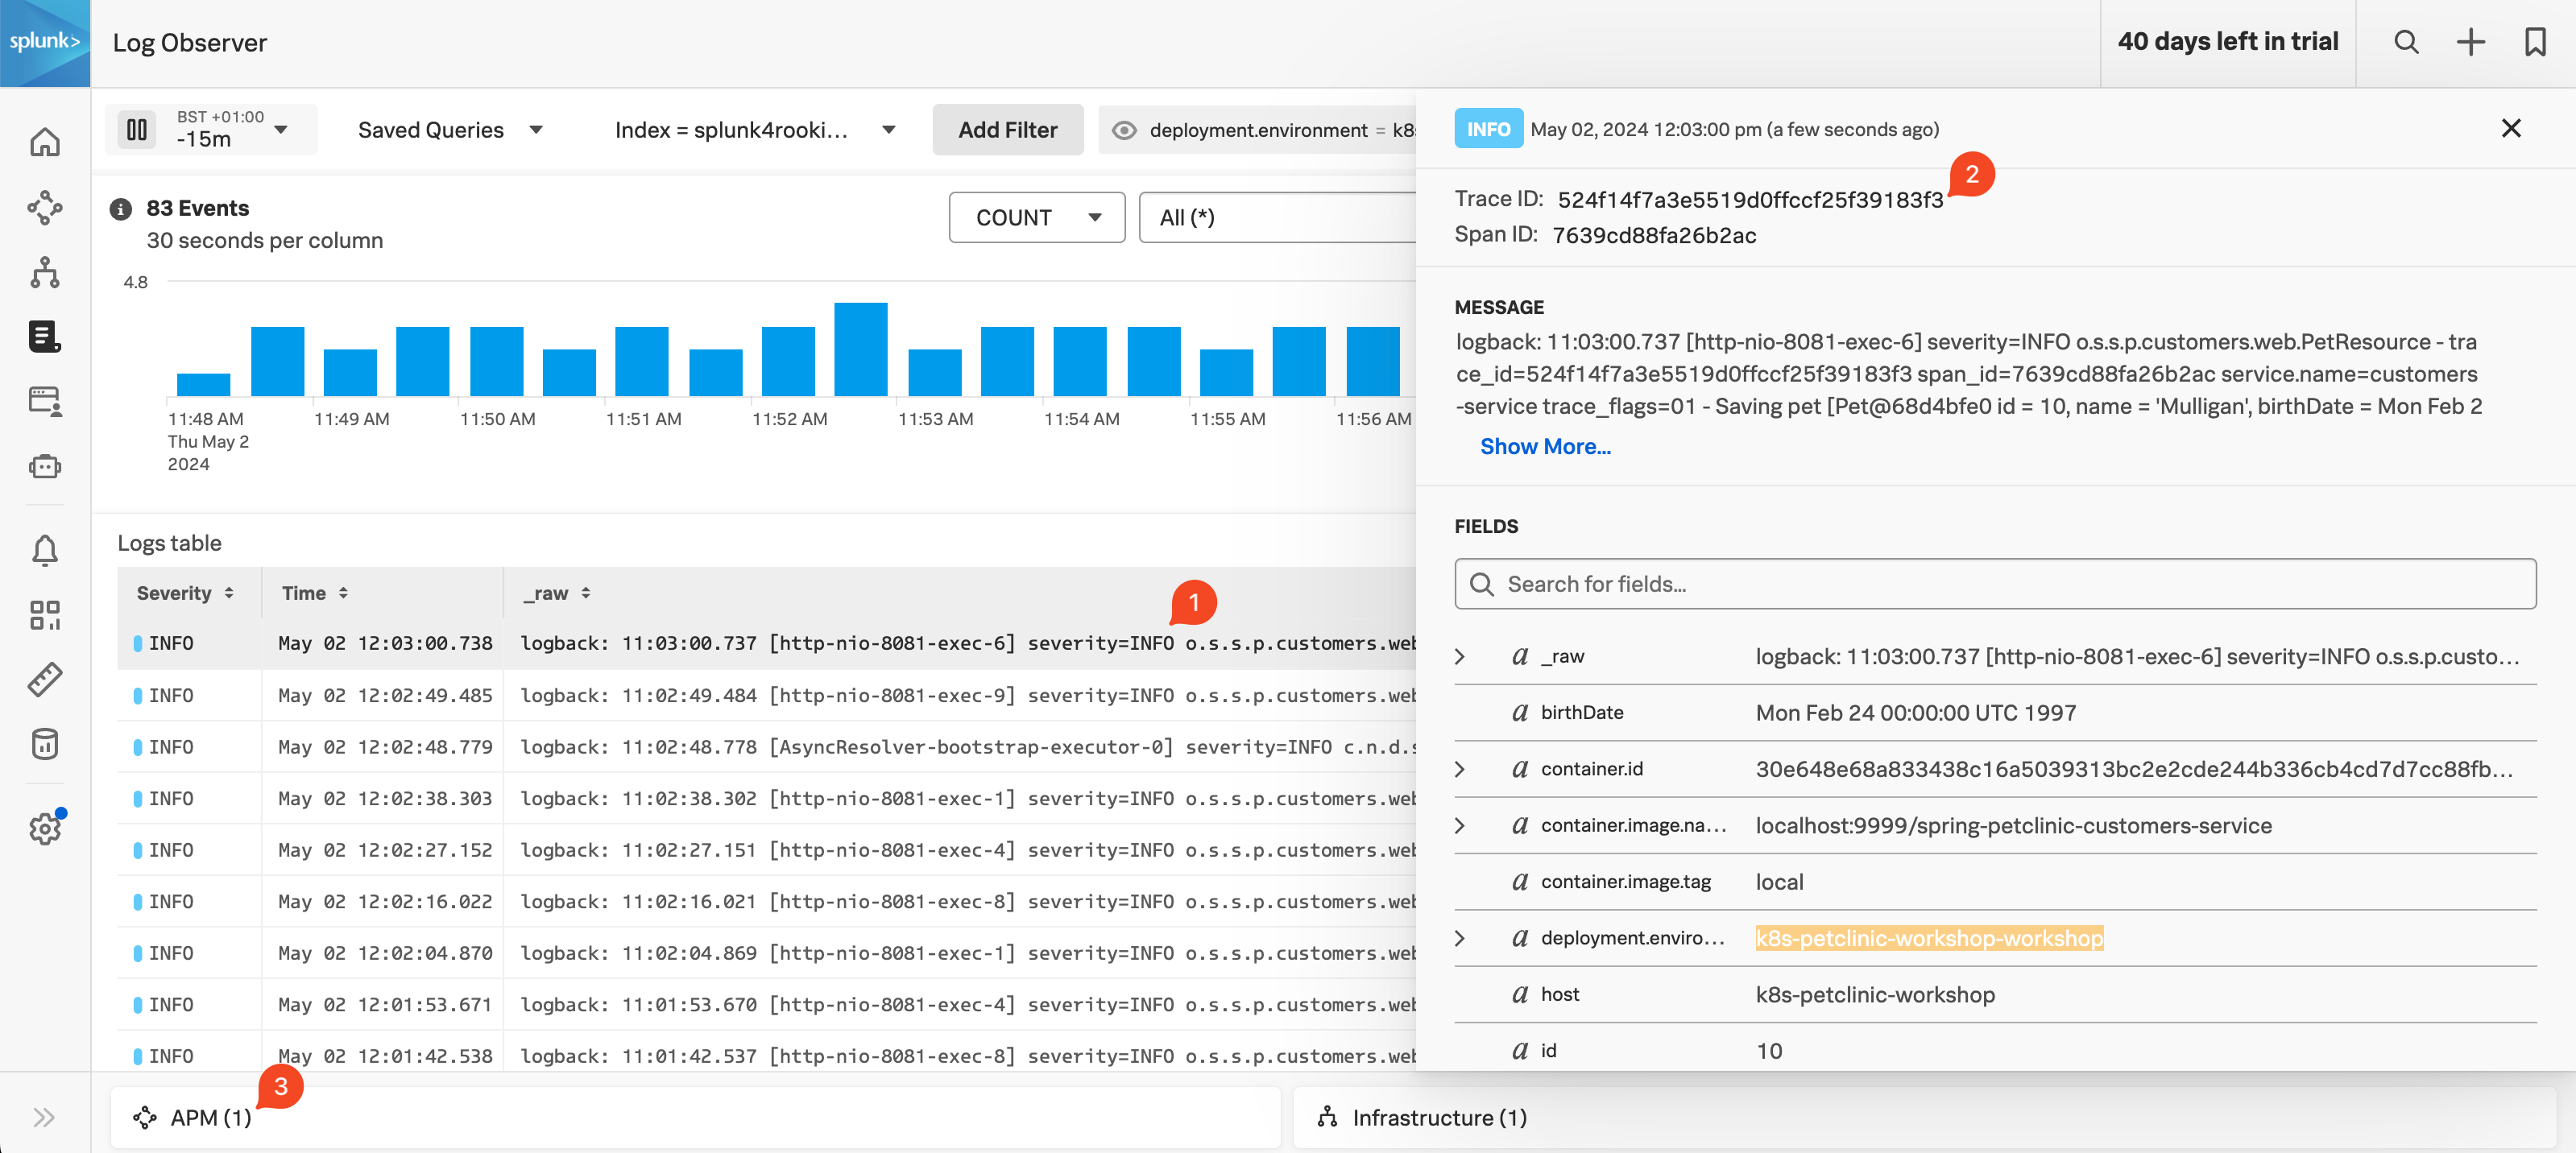
In the log entry you will see the message is formatted as per the pattern we configured for logback eariler (1):
Click on an entry with an injected trace_id (1). A side pane will open where you can see the detailed information, including the relevant trace and span IDs (2).
Related Content
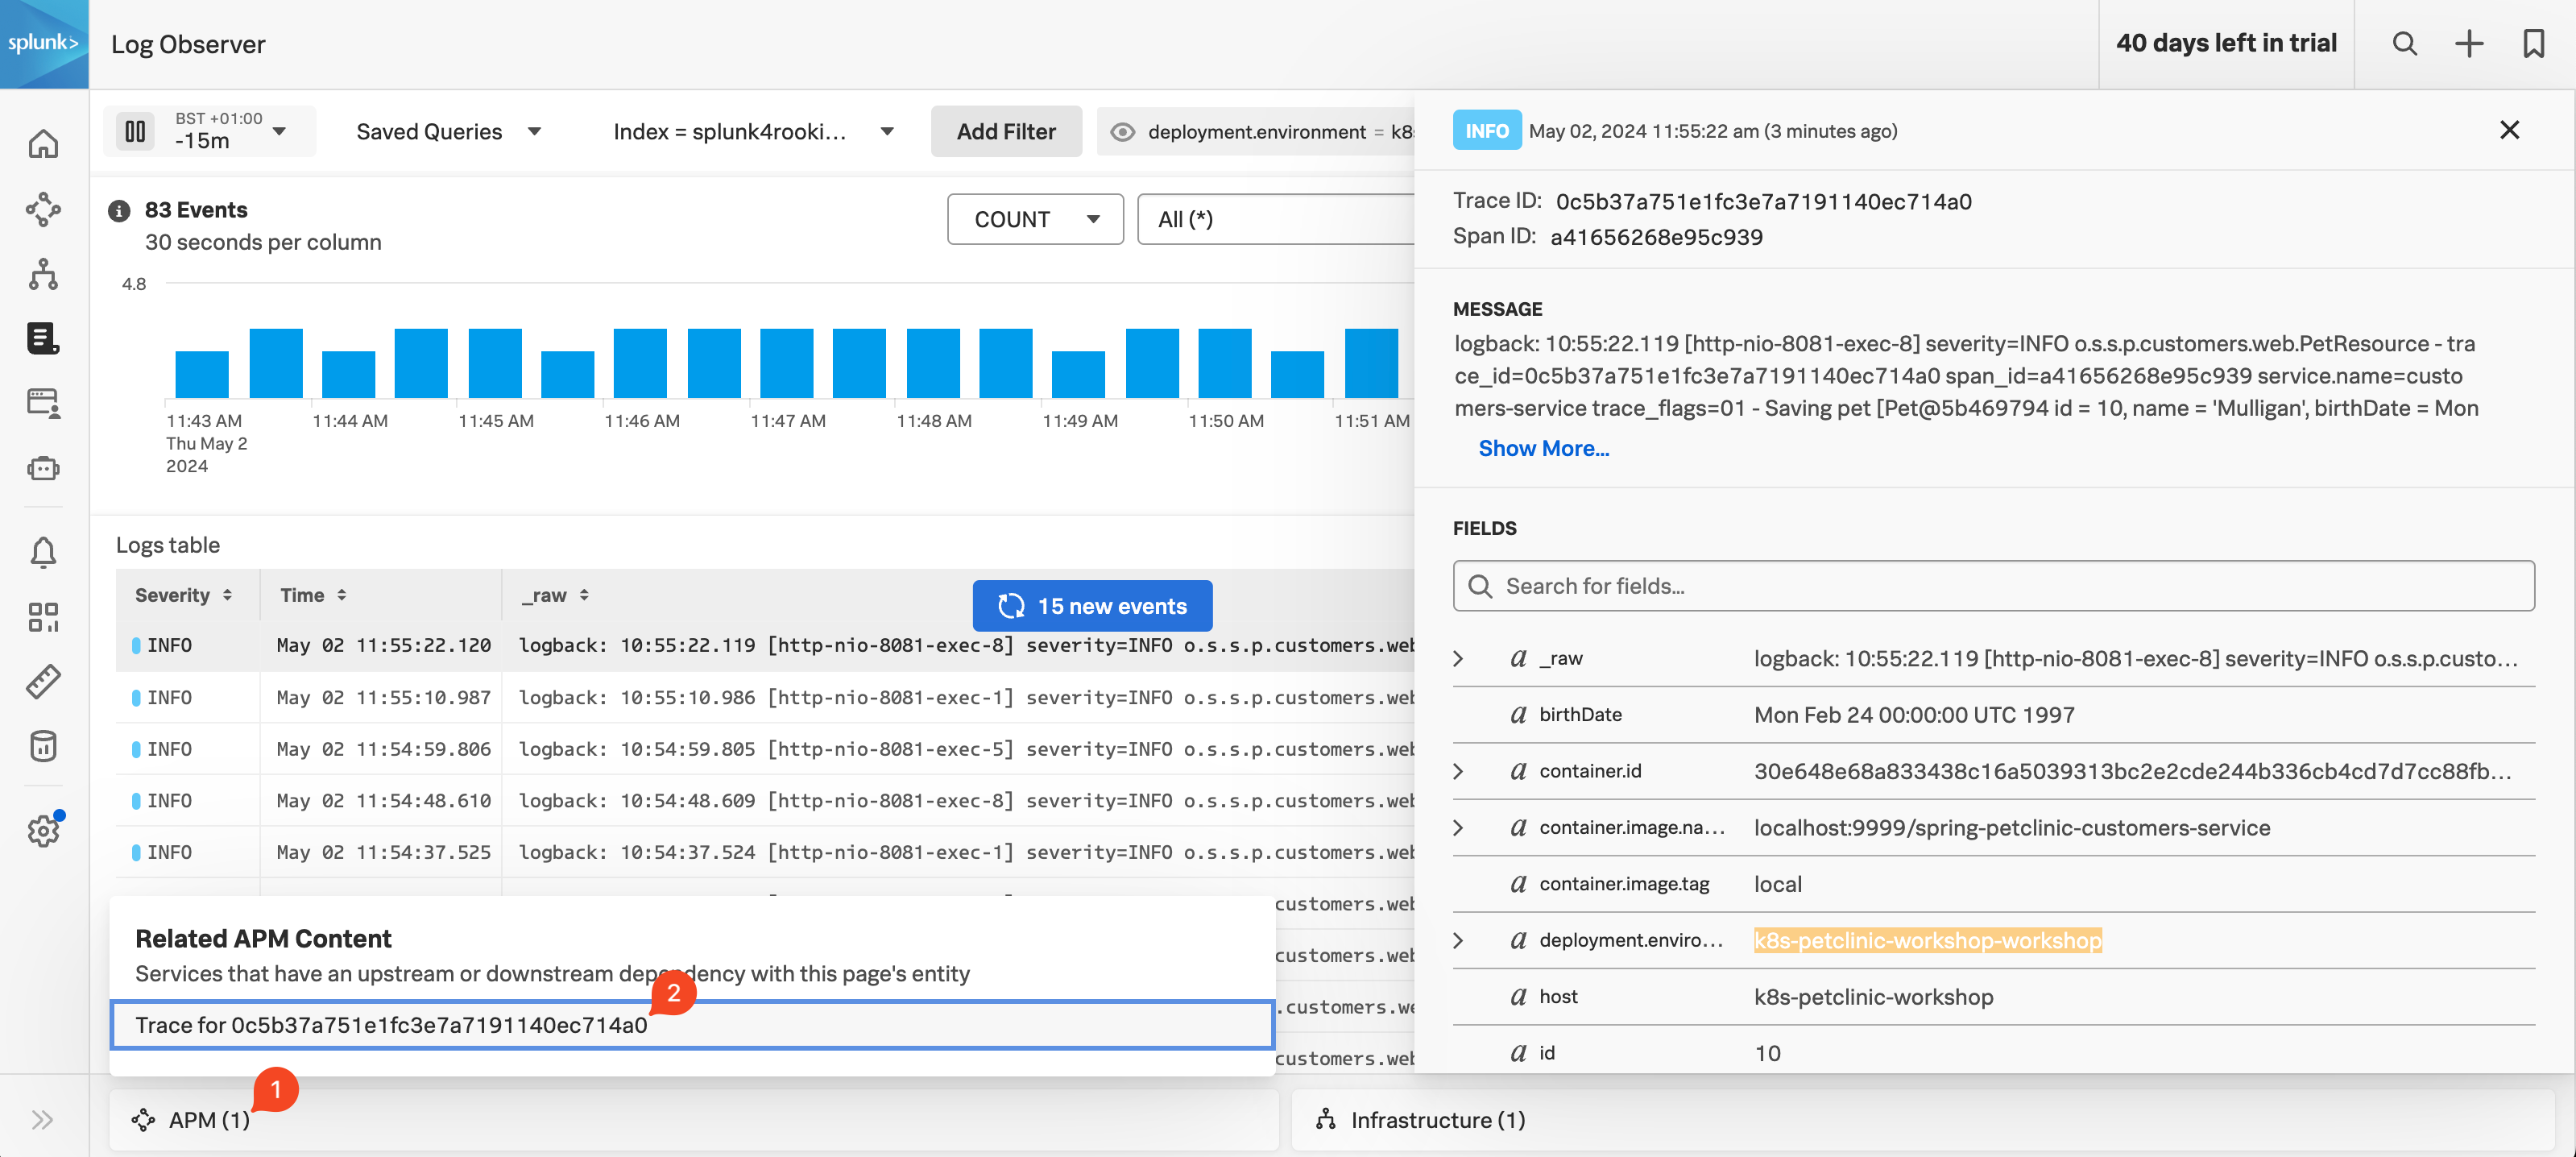
In the bottom pane is where any related content will be reported. In the screenshot below you can see that APM has found a trace that is related to this log line (1):
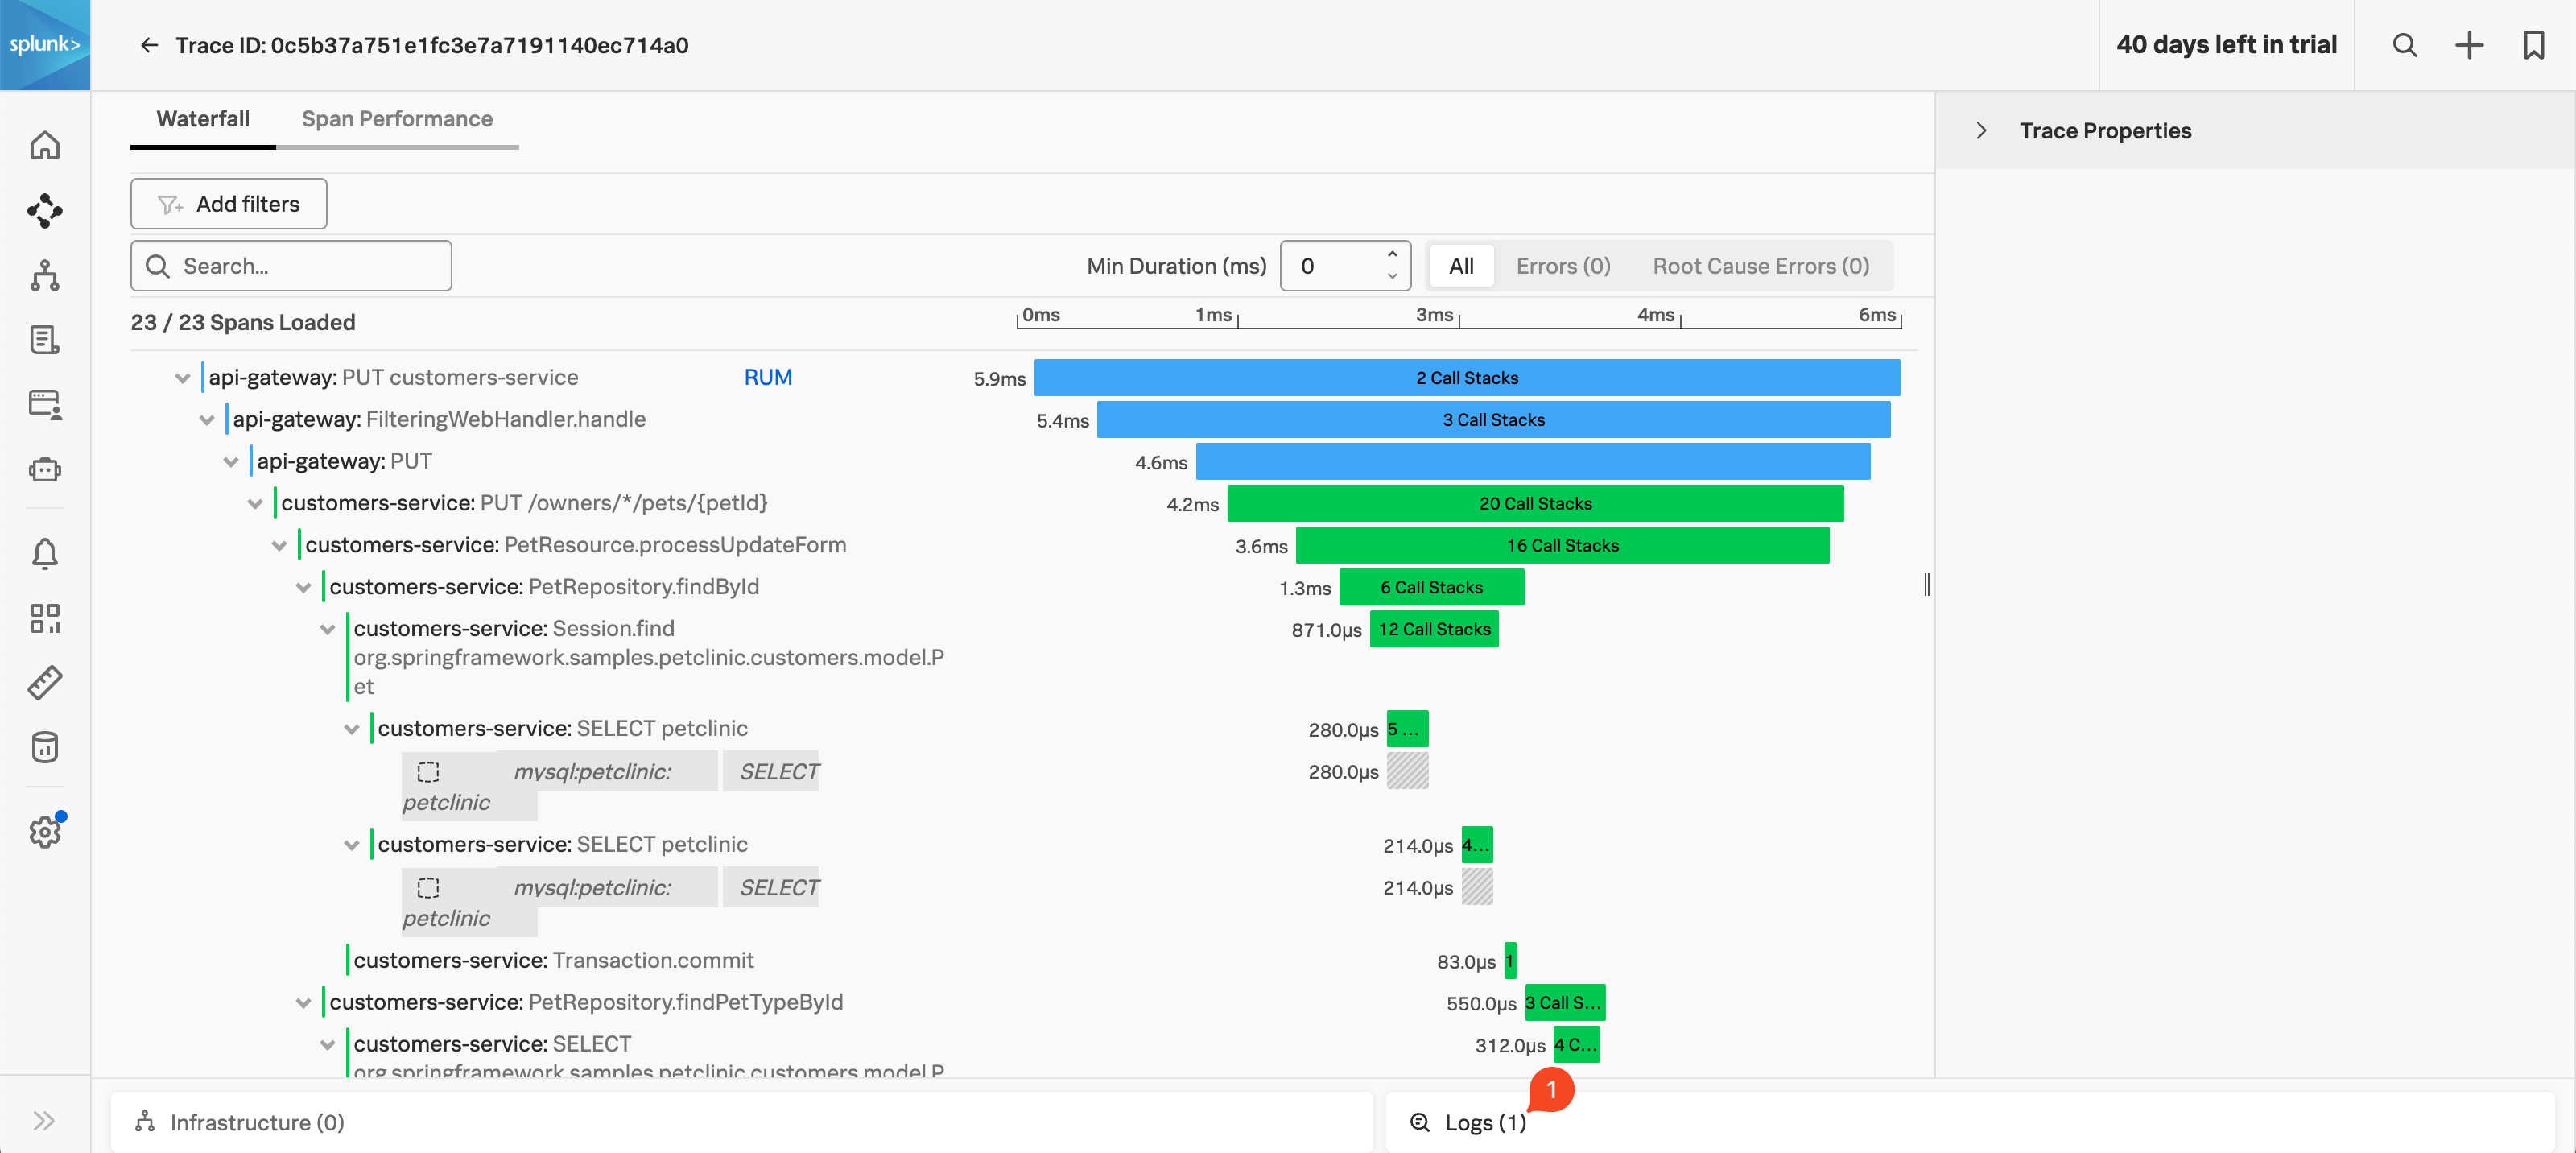
By clicking on Trace for 0c5b37a751e1fc3e7a7191140ex714a0(2) will take us to the waterfall in APM for this specific trace that this log line was generated from:
Note that you now have Related Content pane for Logs appear (1). Clicking on this will take you back to Log Observer and will display all the log lines that are part of this trace.