Use Tags with Dashboards
5 minutesDashboards
Navigate to Metric Finder, then type in the name of the tag, which is credit_score_category (remember that the dots in the tag name were replaced by underscores when the Monitoring MetricSet was created). You’ll see that multiple metrics include this tag as a dimension:
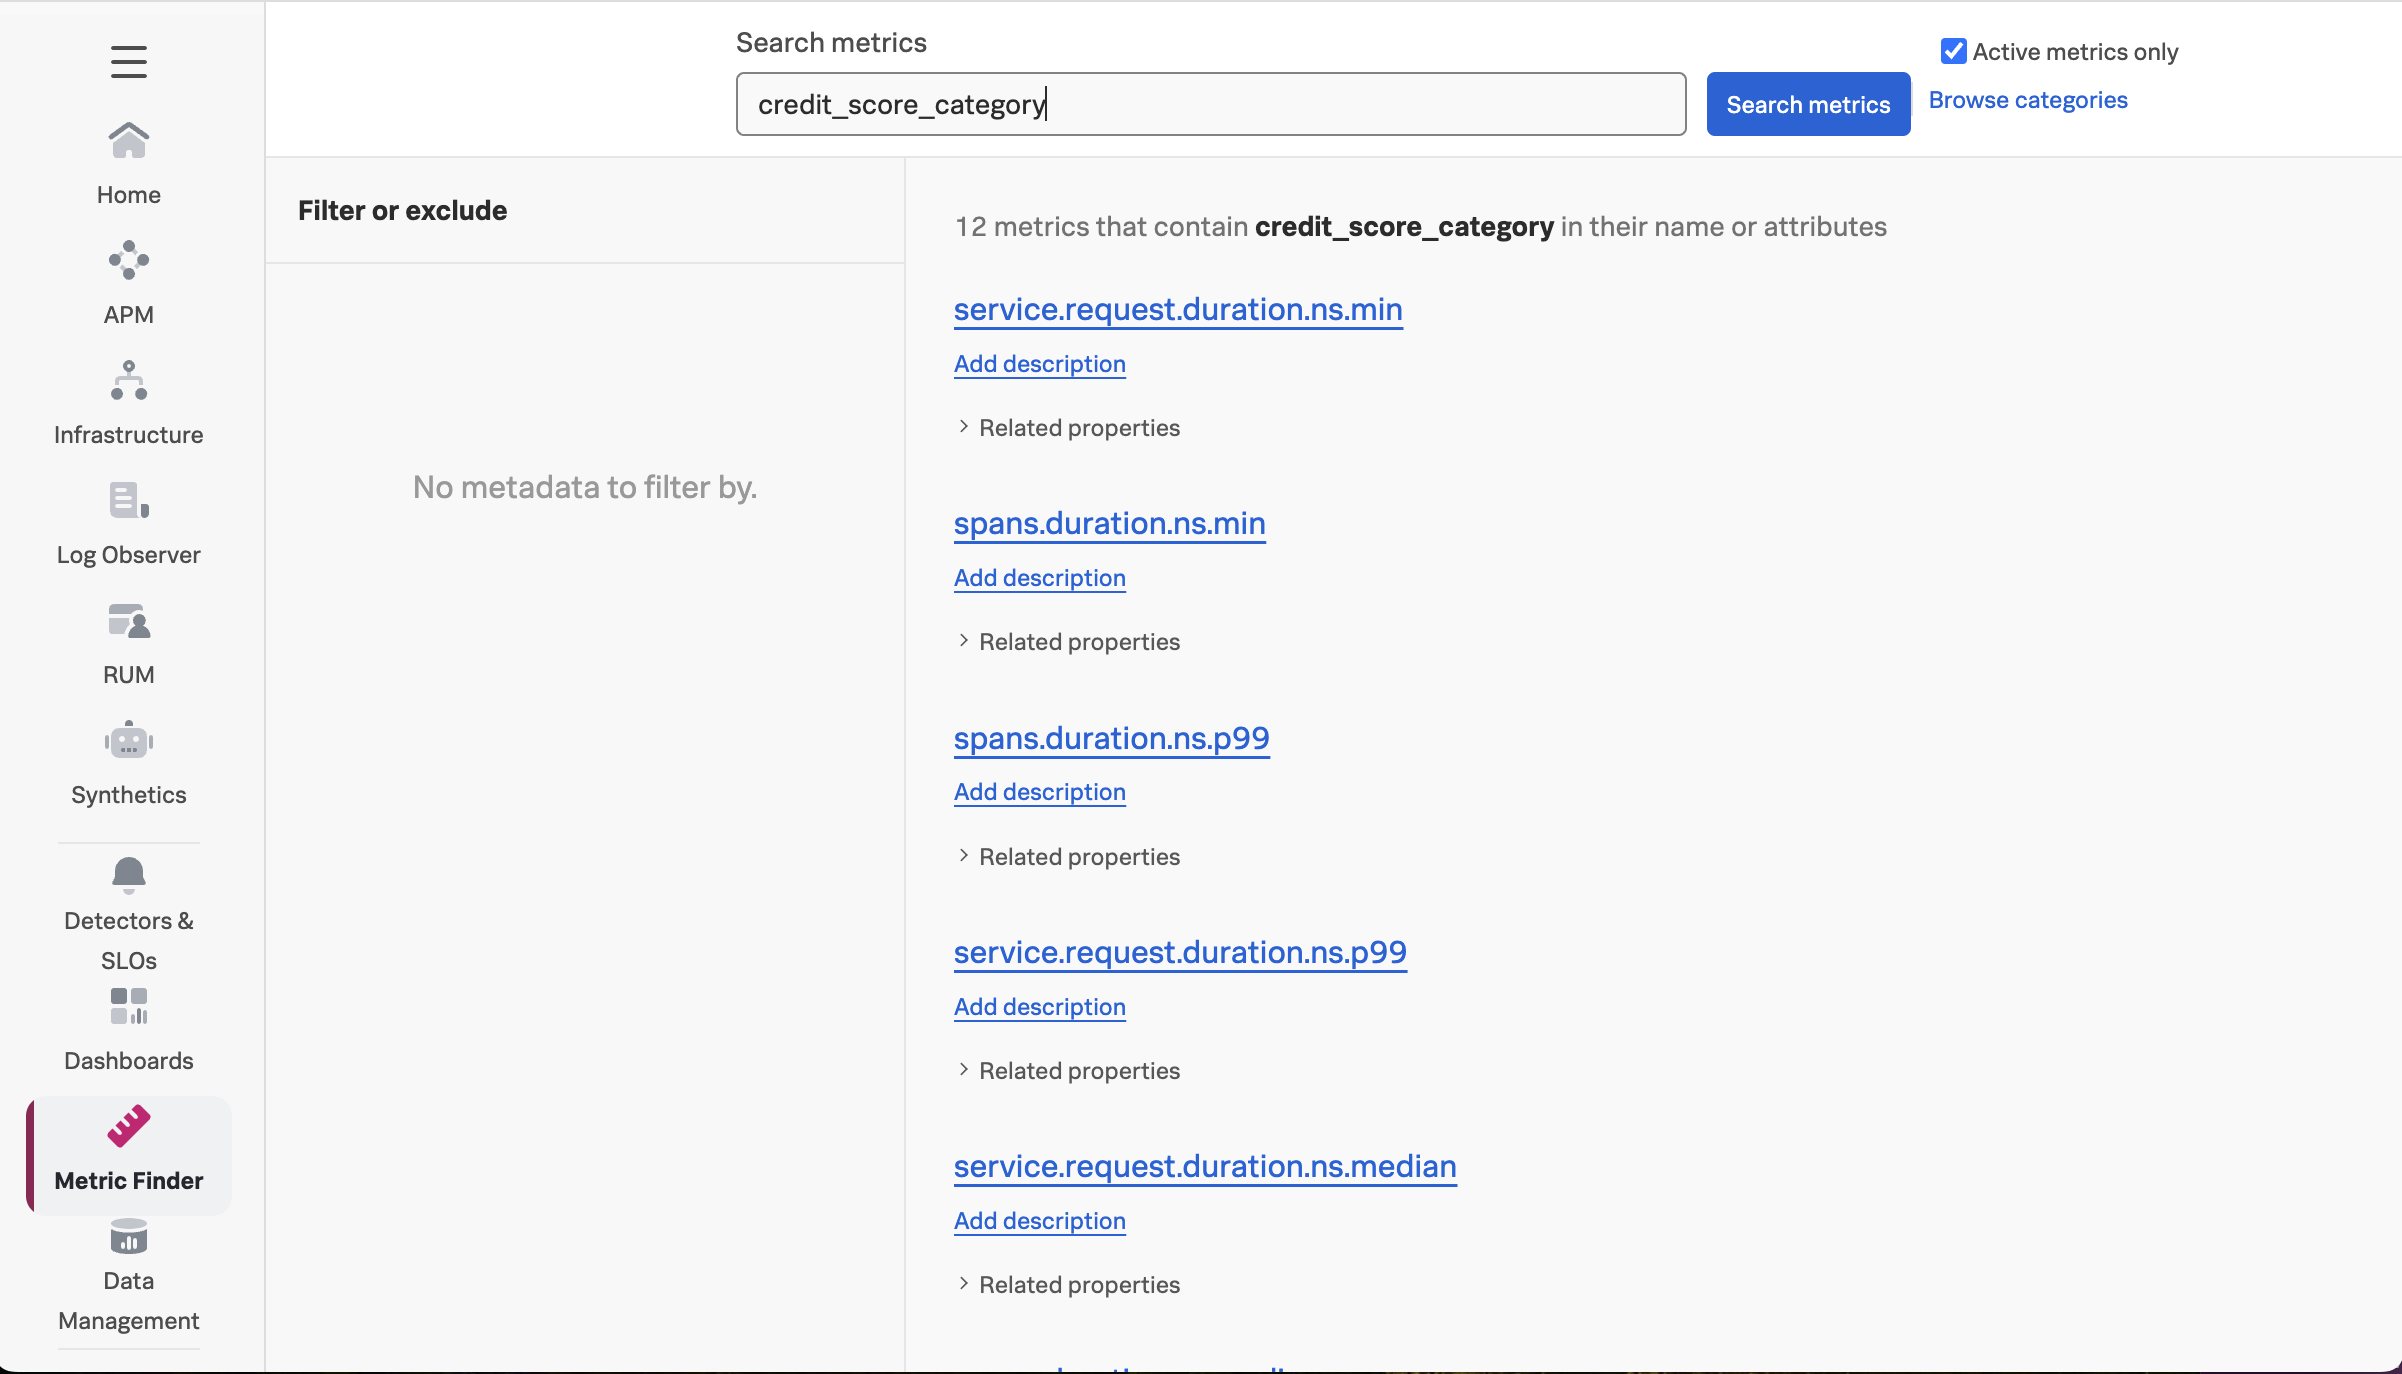
By default, Splunk Observability Cloud calculates several metrics using the trace data it receives. See Learn about MetricSets in APM for more details.
By creating an MMS, credit_score_category was added as a dimension to these metrics, which means that this dimension can now be used for alerting and dashboards.
To see how, let’s click on the metric named service.request.duration.ns.p99, which brings up the following chart:
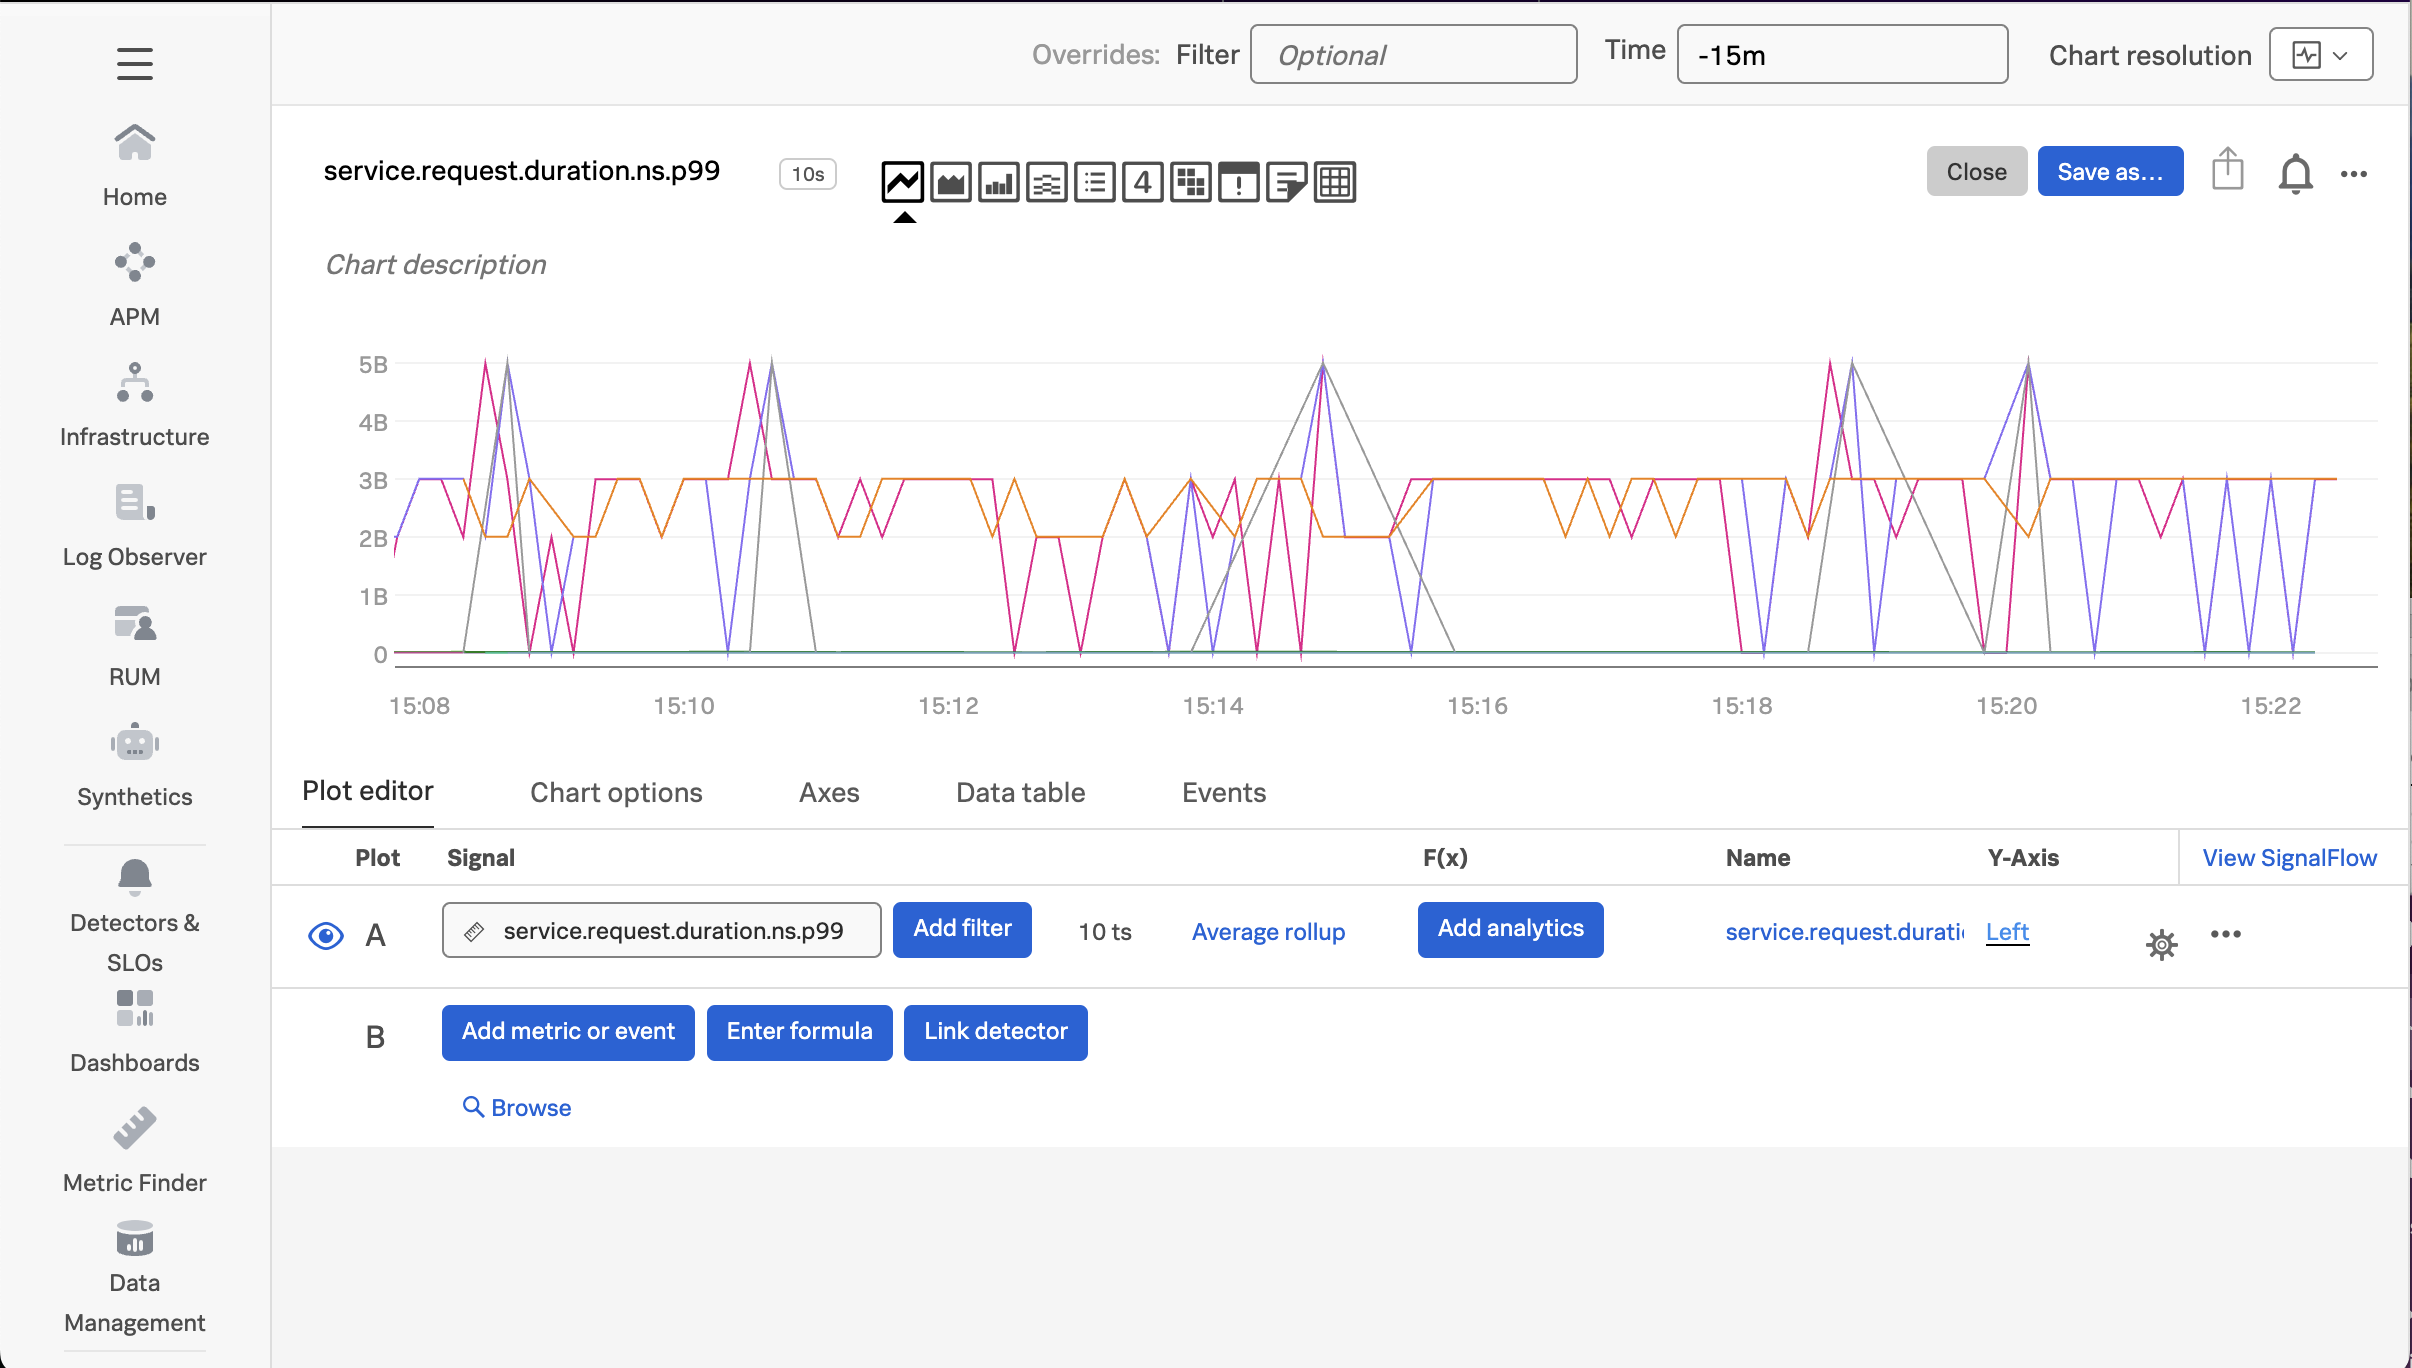
Add filters for sf_environment, sf_service, and sf_dimensionalized. Then set the Extrapolation policy to Last value and the Display units to Nanosecond:
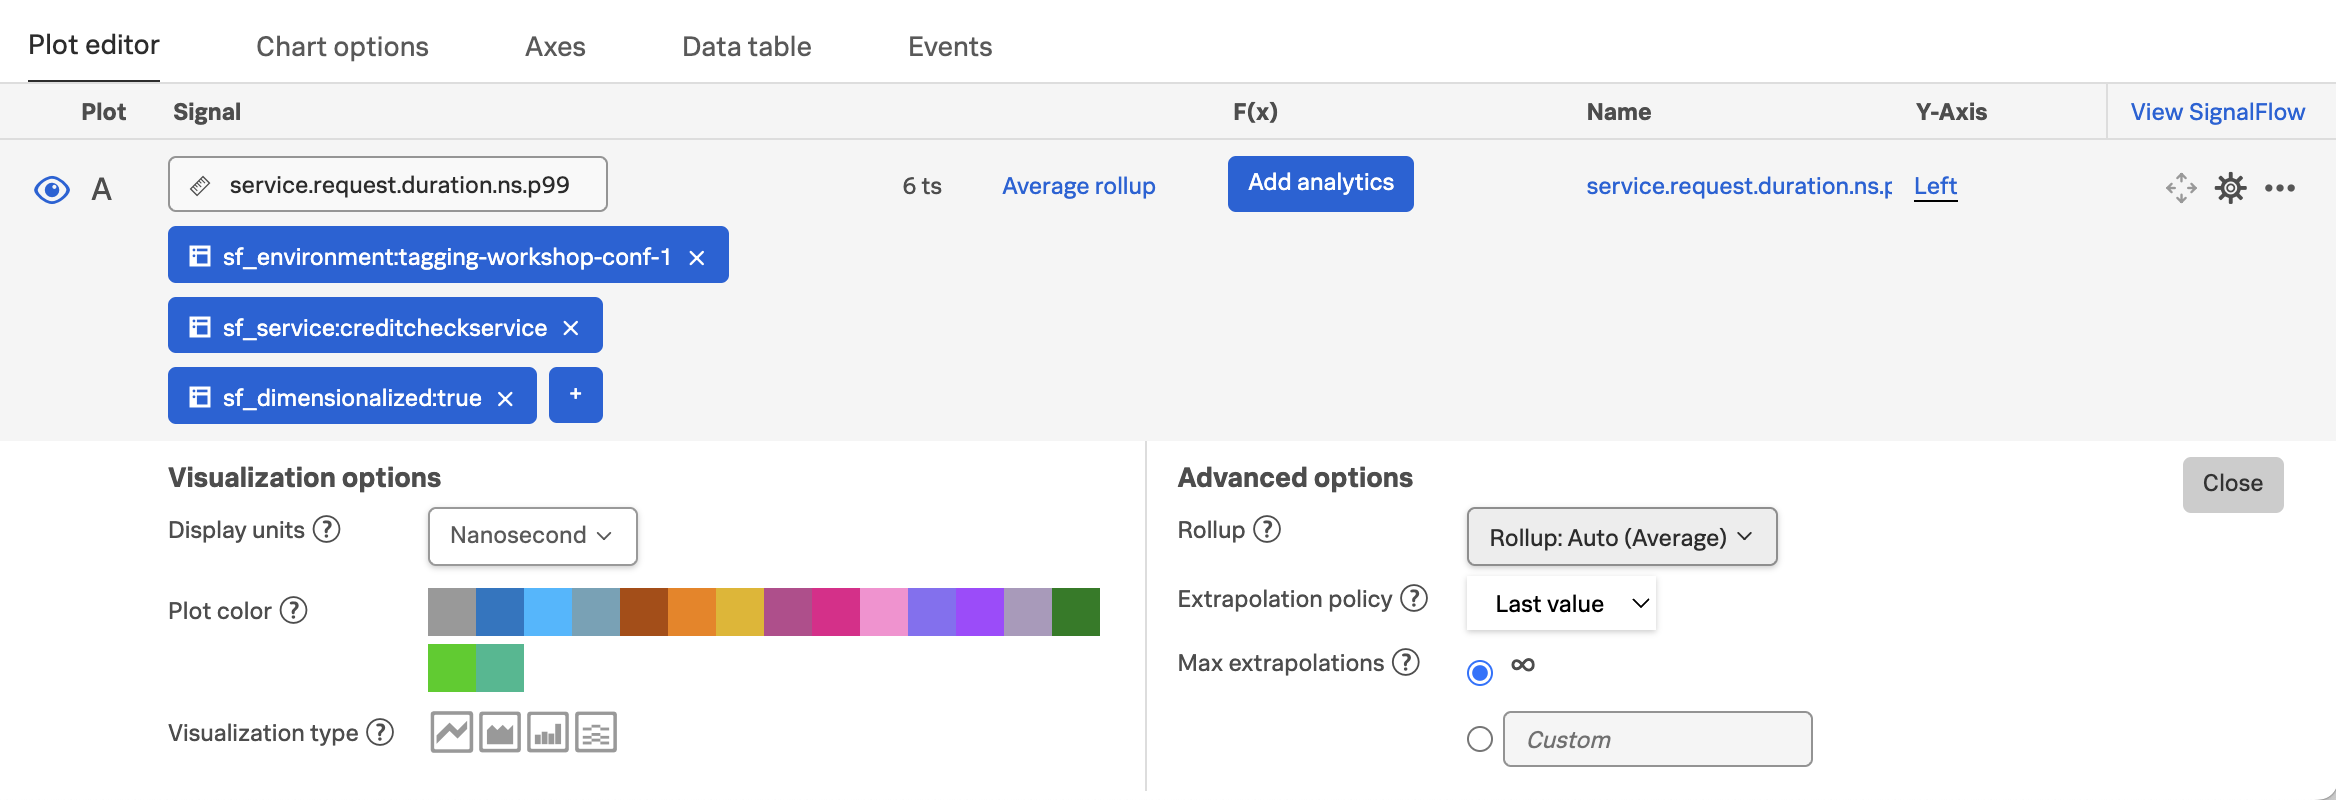
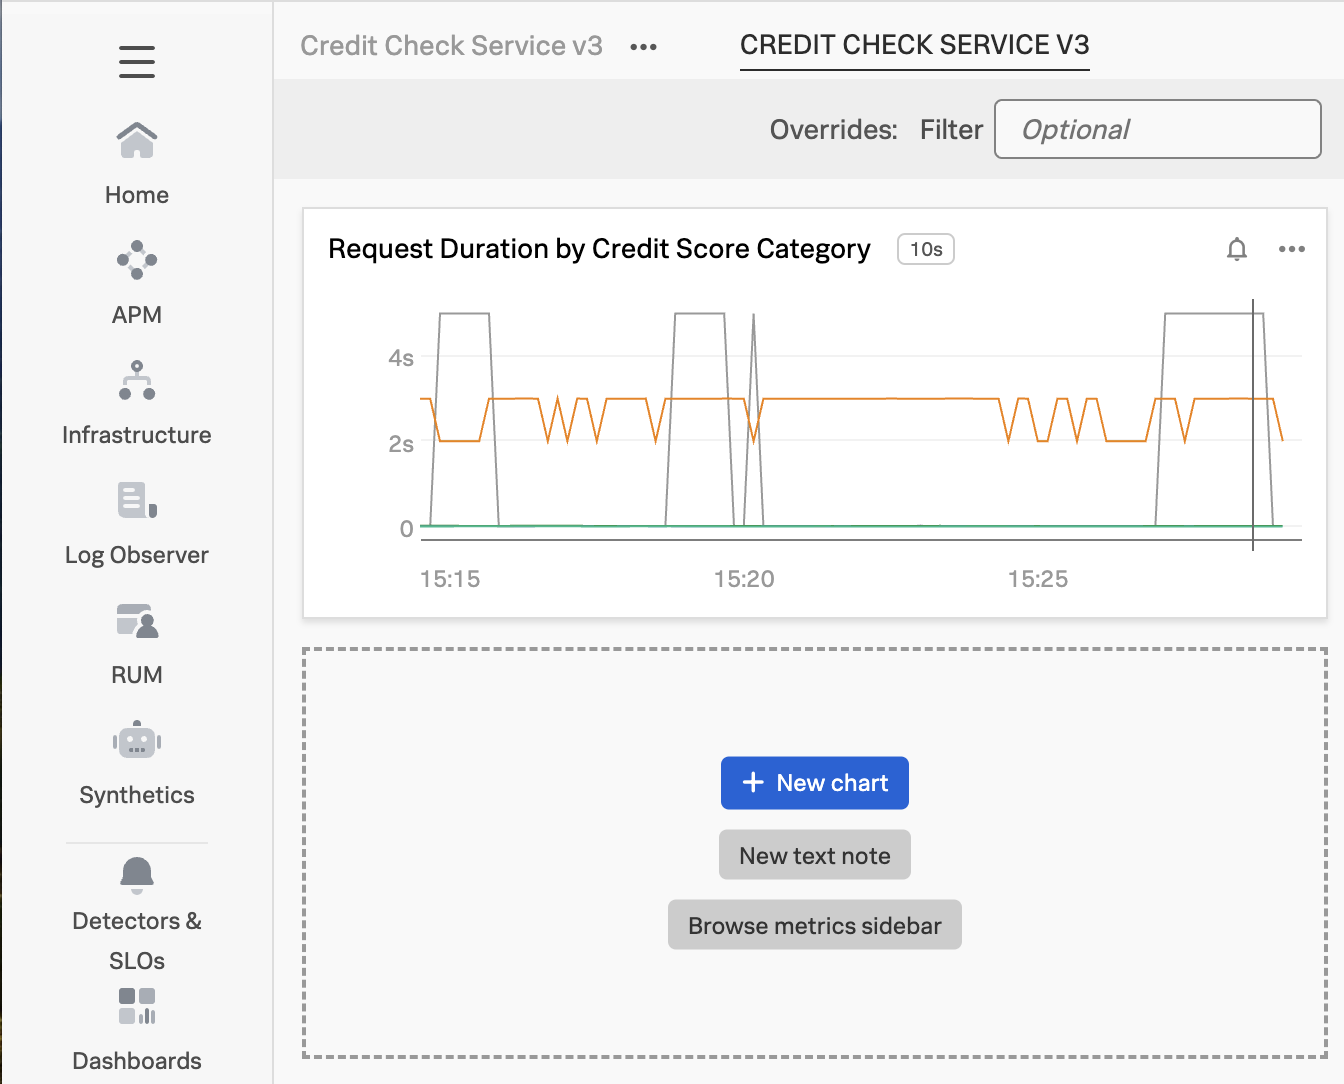
With these settings, the chart allows us to visualize the service request duration by credit score category:
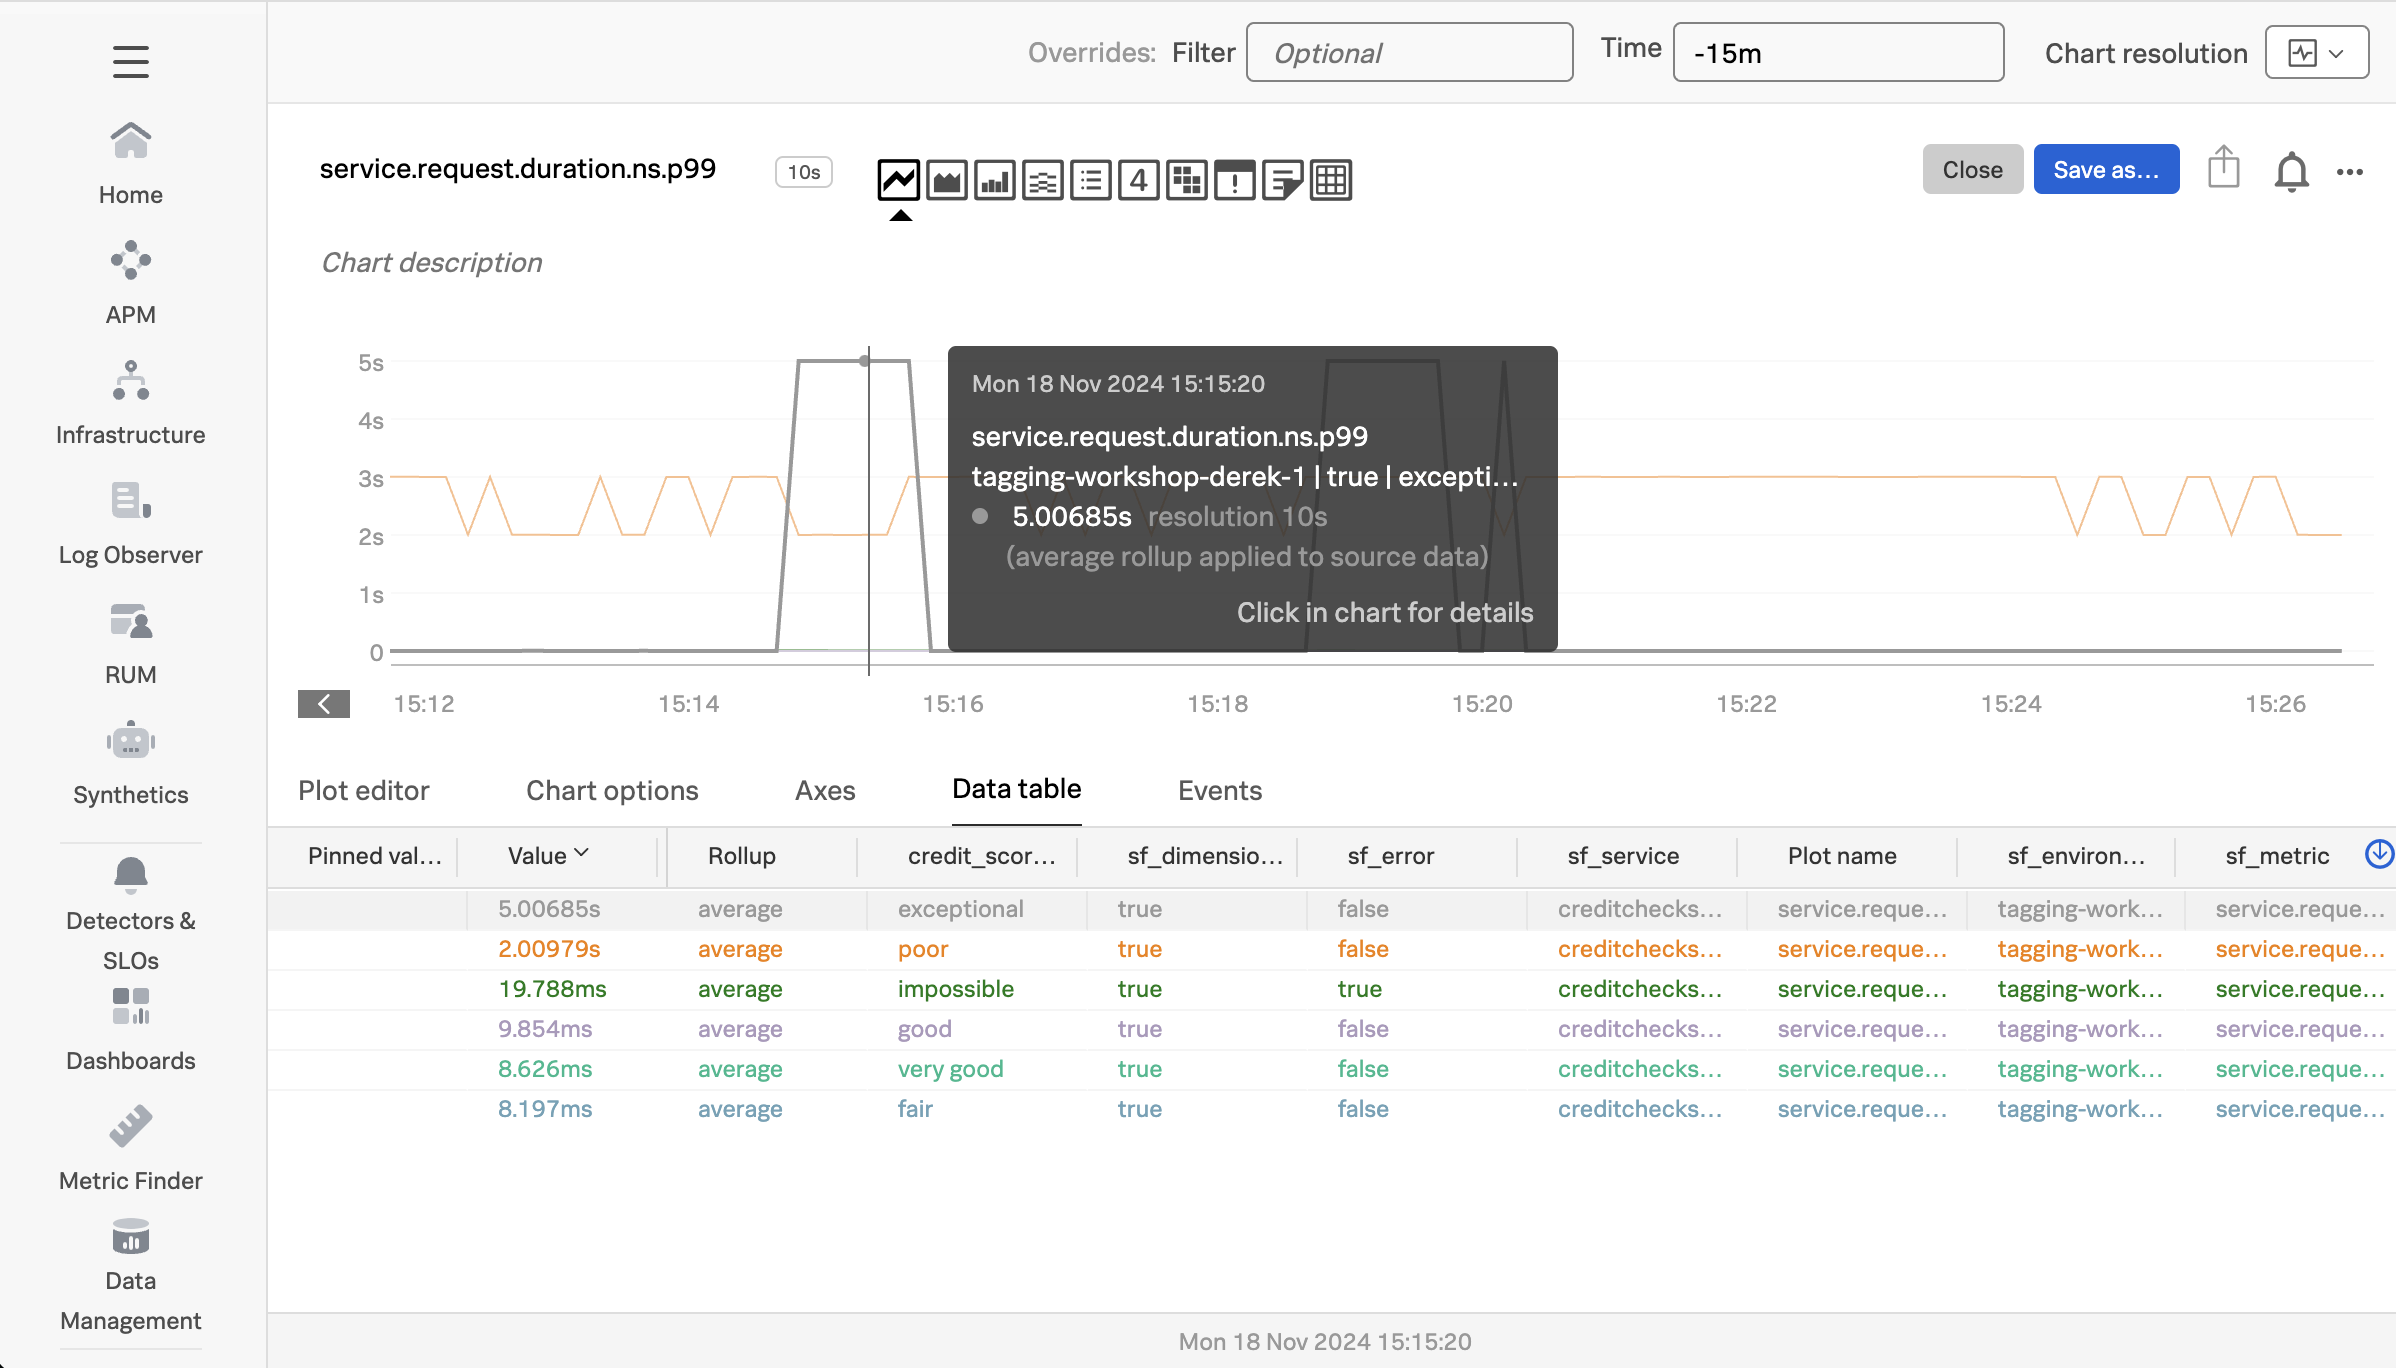
Now we can see the duration by credit score category. In my example, the red line represents the exceptional category, and we can see that the duration for these requests sometimes goes all the way up to 5 seconds.
The orange represents the very good category, and has very fast response times.
The green line represents the poor category, and has response times between 2-3 seconds.
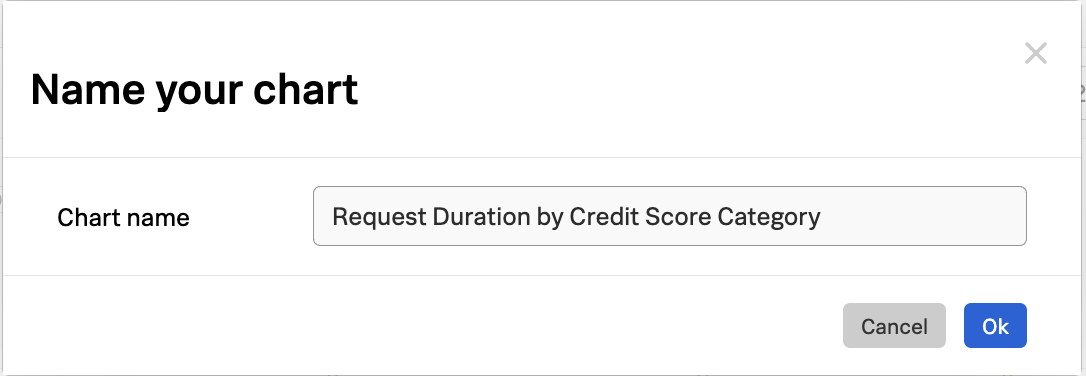
It may be useful to save this chart on a dashboard for future reference. To do this, click on the Save as… button and provide a name for the chart:
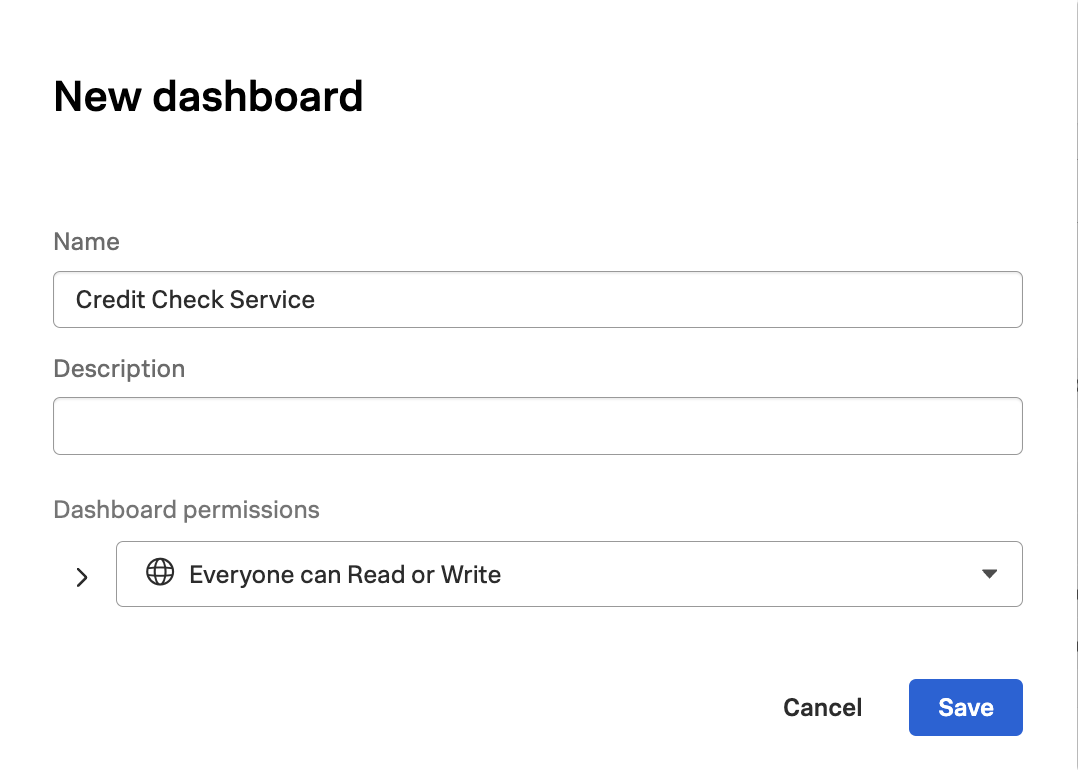
When asked which dashboard to save the chart to, let’s create a new one named Credit Check Service - Your Name (substituting your actual name):
Now we can see the chart on our dashboard, and can add more charts as needed to monitor our credit check service: