Analyzing RUM Sessions
- Dive into RUM Session information in the RUM UI
- Identify Javascript errors in the Span of an user interaction
1. Again select the cart URL
After you have focussed the time slot with the time selector, you need to reselect the cart url from Url Name view, as shown below:
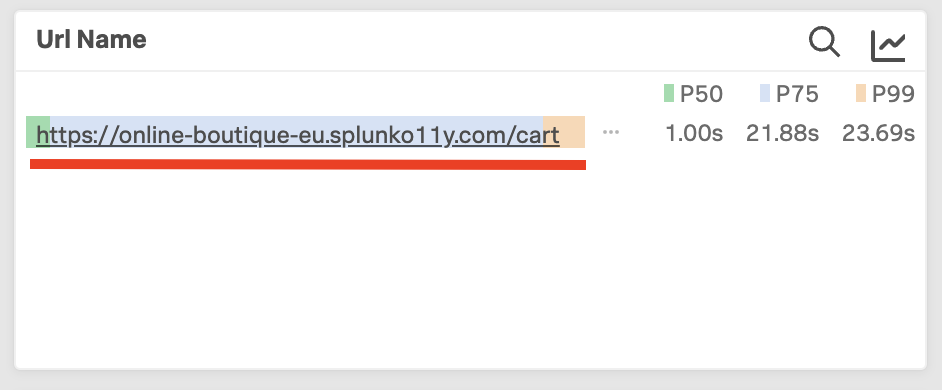
In the example above we selected http://34.246.124.162:81/cart
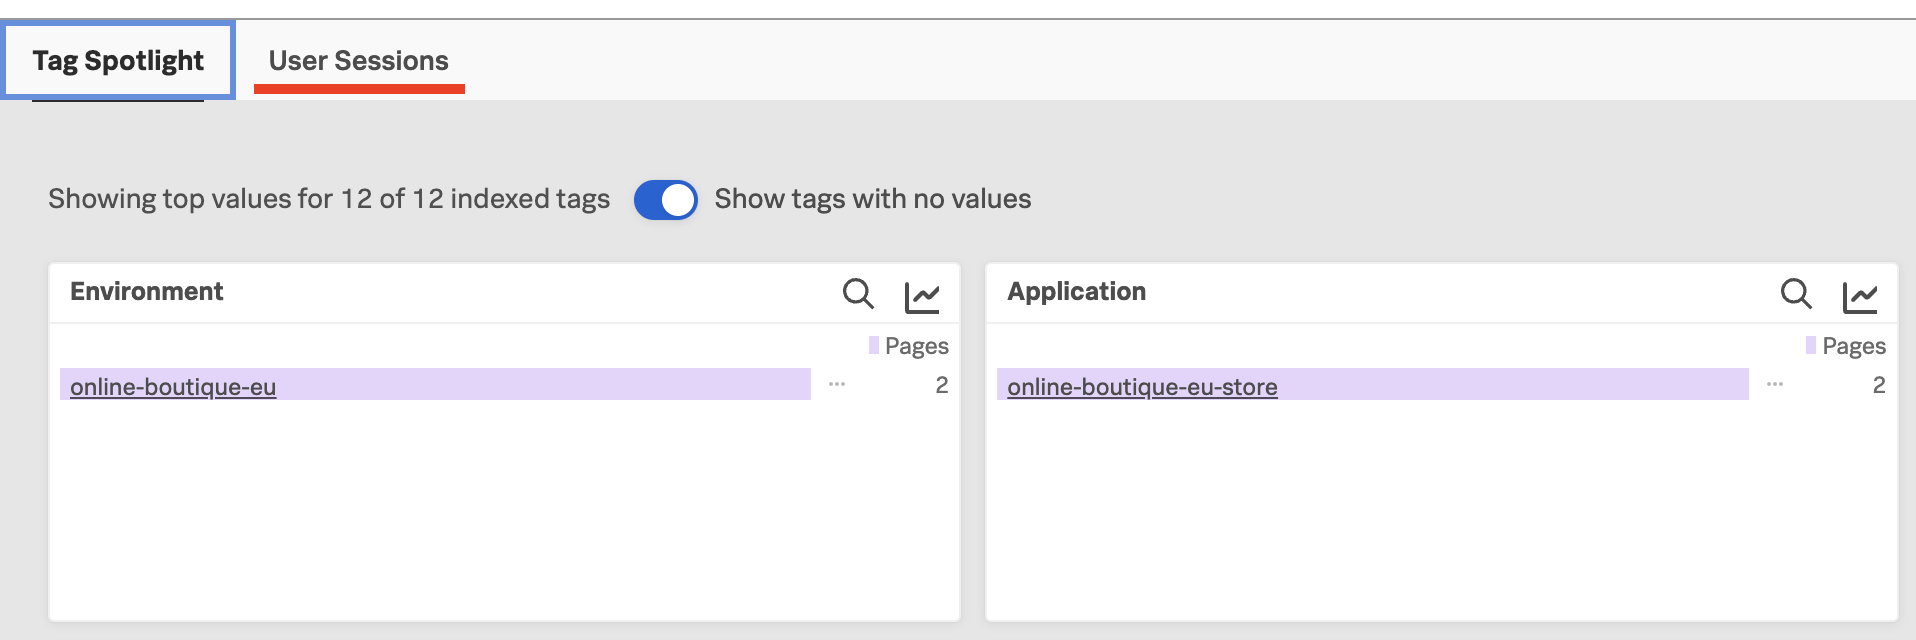
2. Drill down in the Sessions
After you have analyzed the information and drilled down via the Tag Spotlight to a subset of the traces, you can view the actual session as it was run by the end-user’s browser.
You do this by clicking on the link User Sessions as shown below:
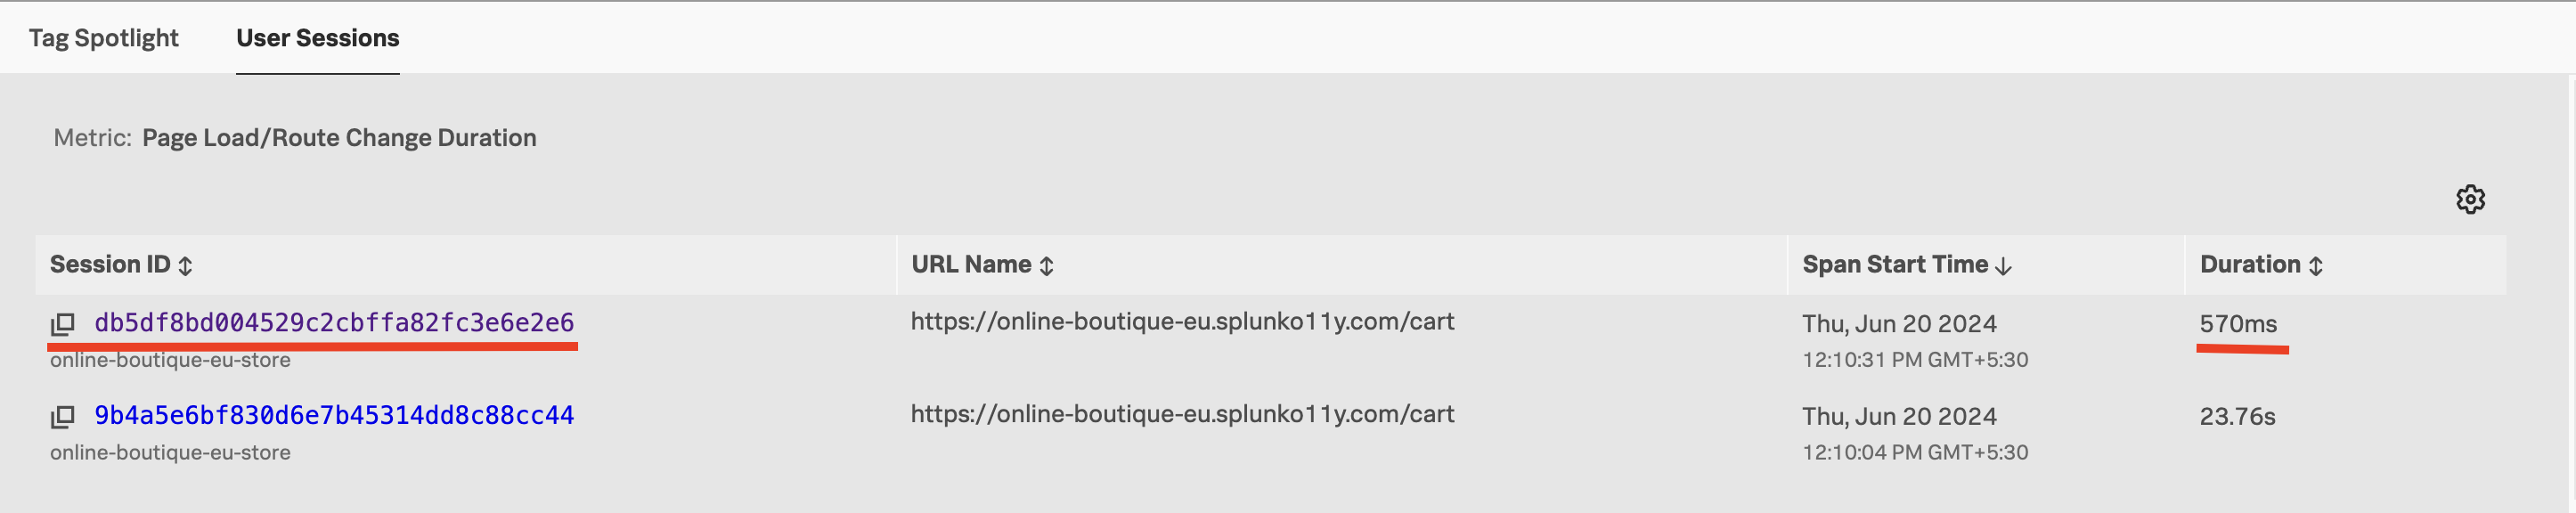
This will give you a list of sessions that matched both the time filter and the subset selected in the Tag Profile.
Select one by clicking on the session ID, It is a good idea to select one that has the longest duration (preferably over 500 ms).
Once you have selected the session, you will be taken to the session details page. As you are selecting a specific action that is part of the session, you will likely arrive somewhere in the middle of the session, at the moment of the interaction.
You can see the URL https://online-boutique-eu.splunko11y.com/cart, the one you selected earlier, is where we are focusing on in the session stream.

Scroll down a little bit on the page, so you see the end of the operation as shown below.

You can see that we have received a few Javascript Console errors that may not have been detected or visible to the end users. To examine these in more detail click on the middle one that says: Cannot read properties of undefined (reading 'Prcie')

This will cause the page to expand and show the Span detail for this interaction, It will contain a detailed error.stack you can pass on the developer to solve the issue. You may have noticed when buying in the Online Boutique that the final total always was $0.00.
