

Analyze user behavior
Feature adoption
Remember seeing the “Ask AI” feature on Astronomy Shop product detail pages? We want to understand how our customers are using that feature, including the quick prompts provided below the text input field.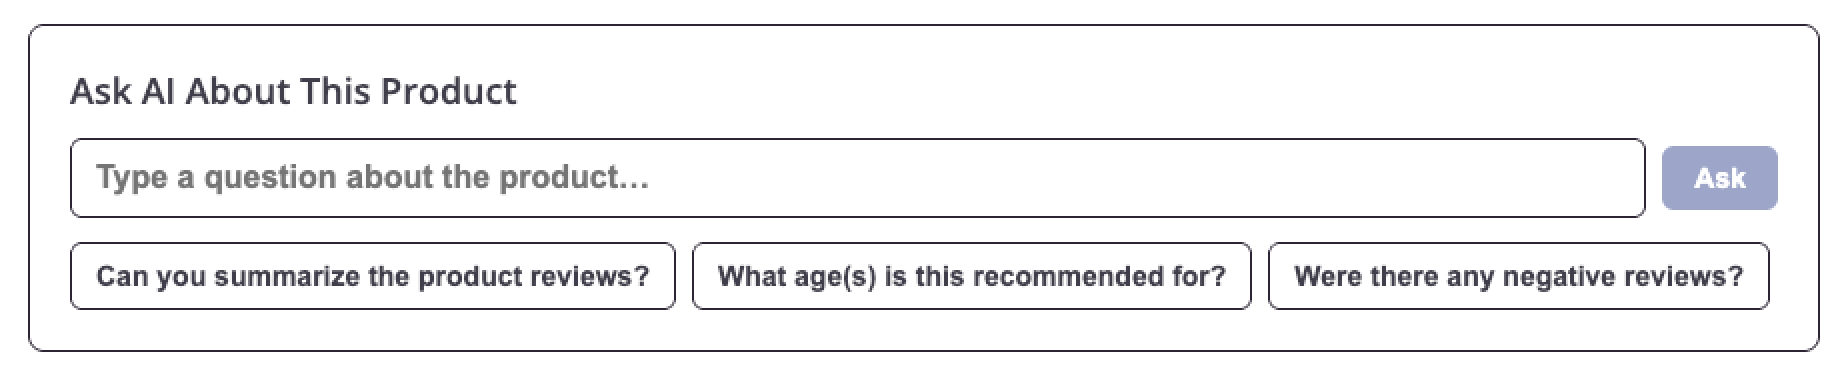
Navigate to the analyses tab of the DXA project, and click into the timeseries AI feature adoption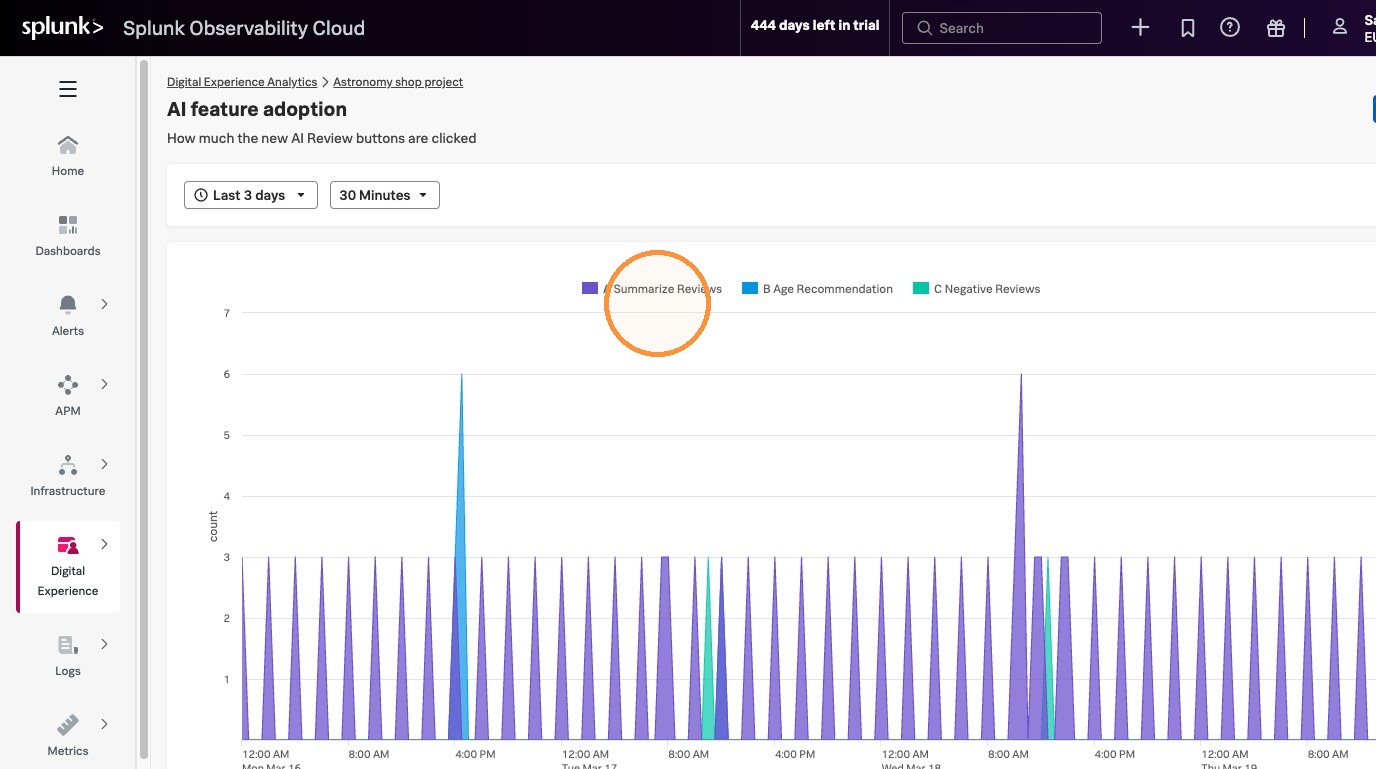
- Are all of the AI quick prompts used equally? Is there a least popular one?
- Why might this chart be useful?
- Prompt popularity will depend on your workshop classmates’ interactions!
- Having a time series to show when users are actually interacting with an app feature allows us to better understand if it’s successful, if we need to change something to make it work better, or if we need to revisit this feature entirely.
Click into a point on the chart to load the relevant session replays, click into a session replay, and watch the playback.
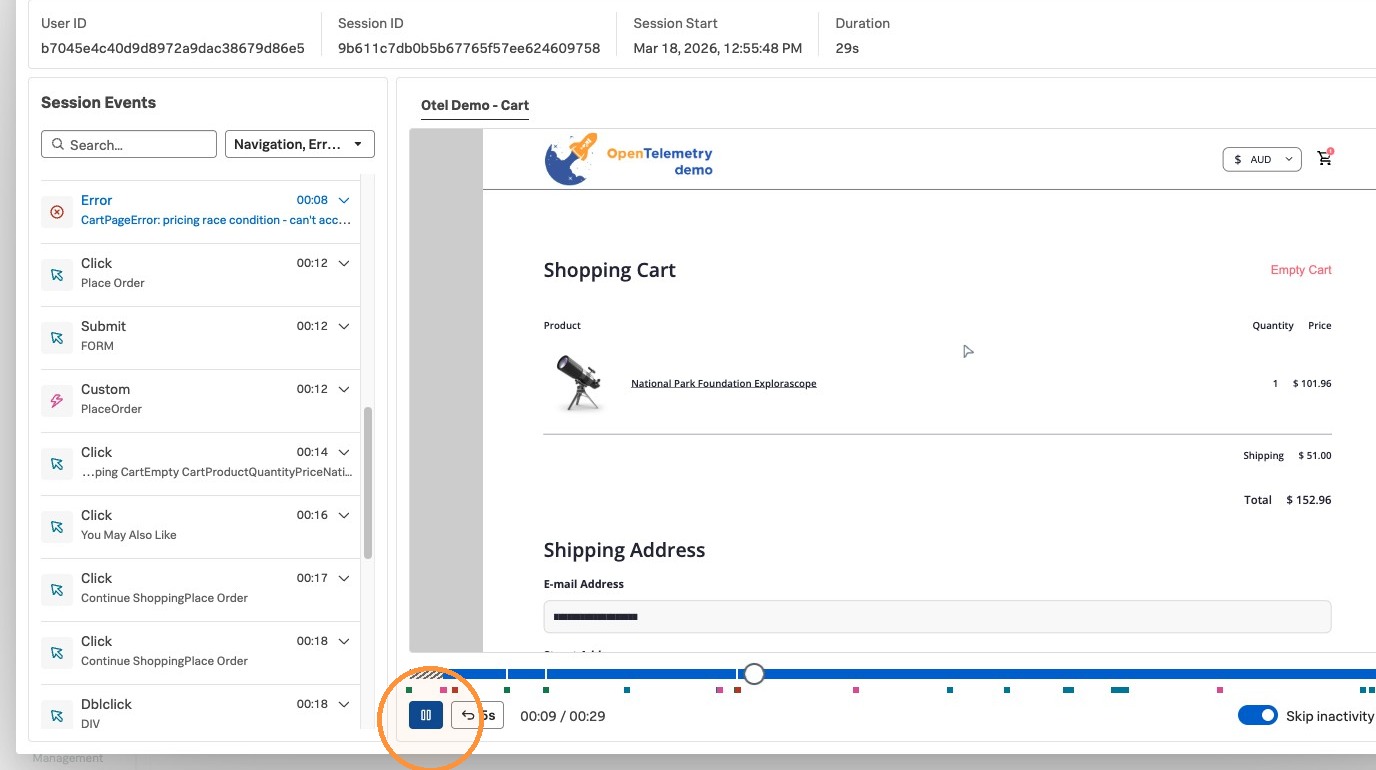
- What do you see in the replay?
- What value do you think is in the session replay for feature adoption?
- Session details are at the top, interactions are in both the timeline on the left and on the playback bar, while the pane on the right recreates what the end user saw and experienced.
- Watching the replay can tell us what’s happening if the feature is not being adopted as we expect. For example, are users just scrolling past it, or is it hidden by another element or popup.