

Monitor user sessions in RUM
User Sessions
In Splunk RUM, a session is a continuous period of user activity on your app (up to four hours, ending after inactivity or when the app closes). RUM sessions inform analyses like funnels and feature adoption timeseries.
Session details show metadata, replay events, and a waterfall of spans (loads, requests, custom events, web vitals, errors). See Key concepts in Splunk RUM for more info.
Use the user session you already have open, or open a new one.
On session details, note the summary: Session ID, start time, duration, and client/OS.
In Session Events, click through a few events and watch the event list and replay stay in sync.
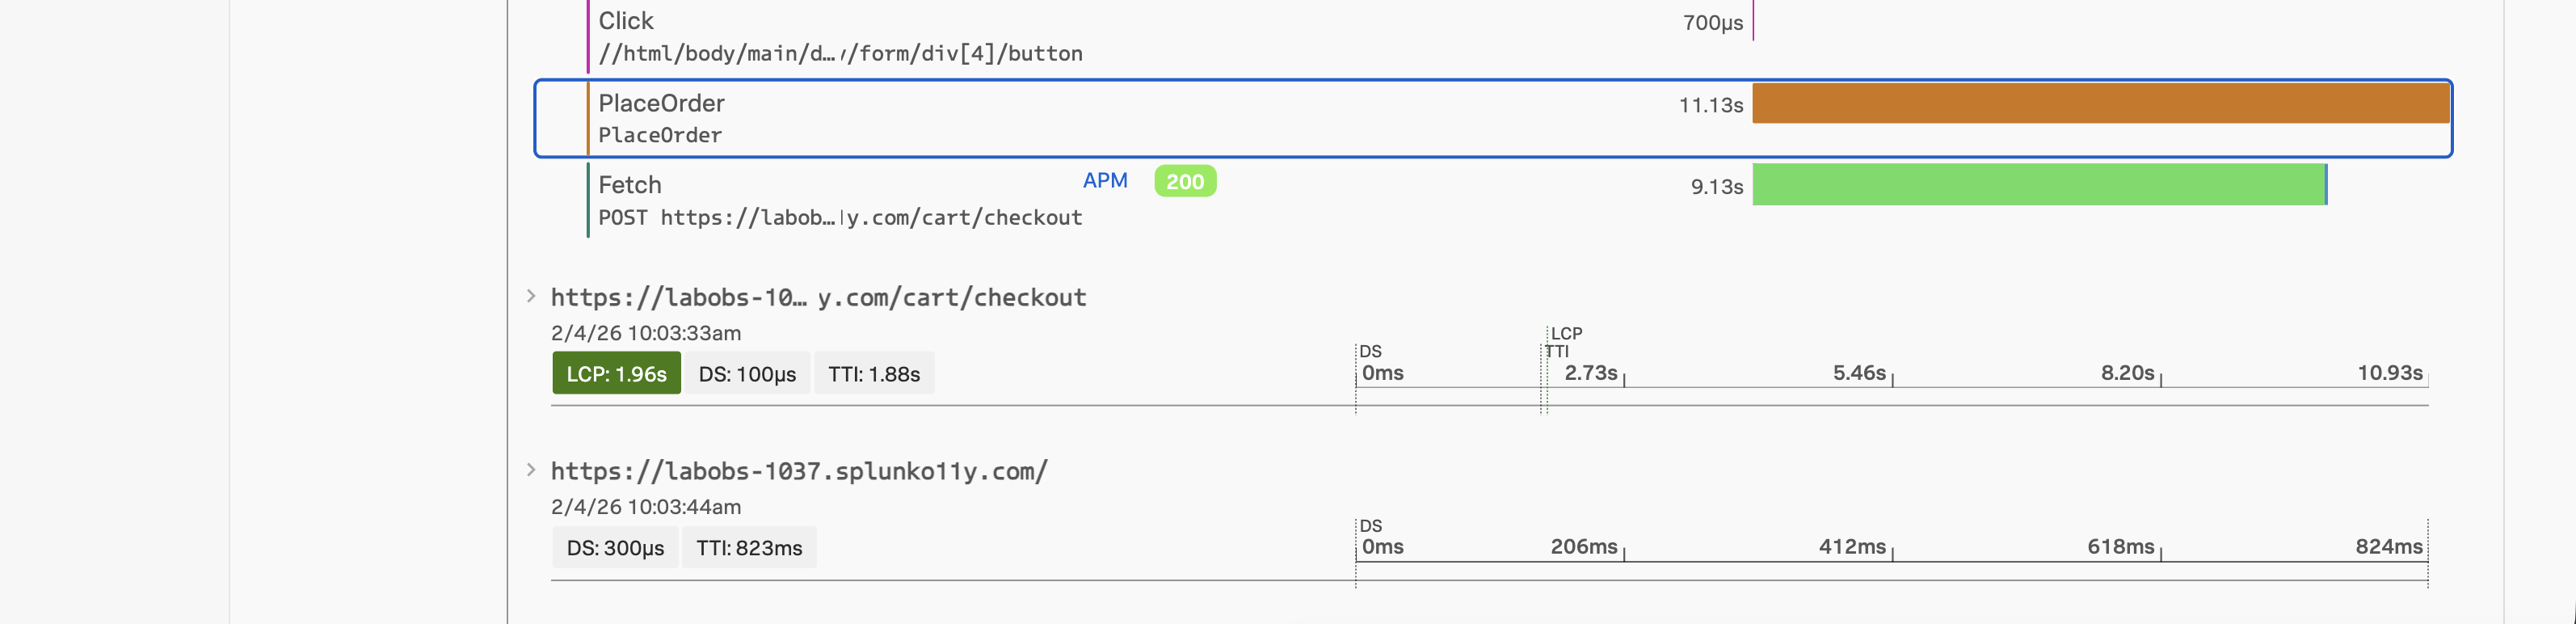
Select the event where the user Place order (or the longest page). In the span list, find examples of:
- a document load or page span,
- a fetch/XHR (network request) span,
- a custom event span (like PlaceOrder),
- and any error or slow span.
Click one span and toggle Parsed vs Raw:
- Parsed — curated tags and values for quick reading.
- Raw — full detail for that span.
Let’s see how RUM Sessions roll up to give us an understanding of our application health and user experience!