Monitor user sessions in RUM
RUM Application Overview
At the top of the session page, click the breadcrumb link to the workshop app. Alternatively, you can hover over the “Digital Experience” menu item on the left, click into the Overview for Real User Monitoring, and click the name of the workshop app on that page.
You will now see a dashboard breaking down RUM metrics by User Experience, Front-end Health, Back-end Health, Custom Workflows, Pages, Network Requests, and a Map View. Current metrics are compared to historic metrics (1 hour by default).
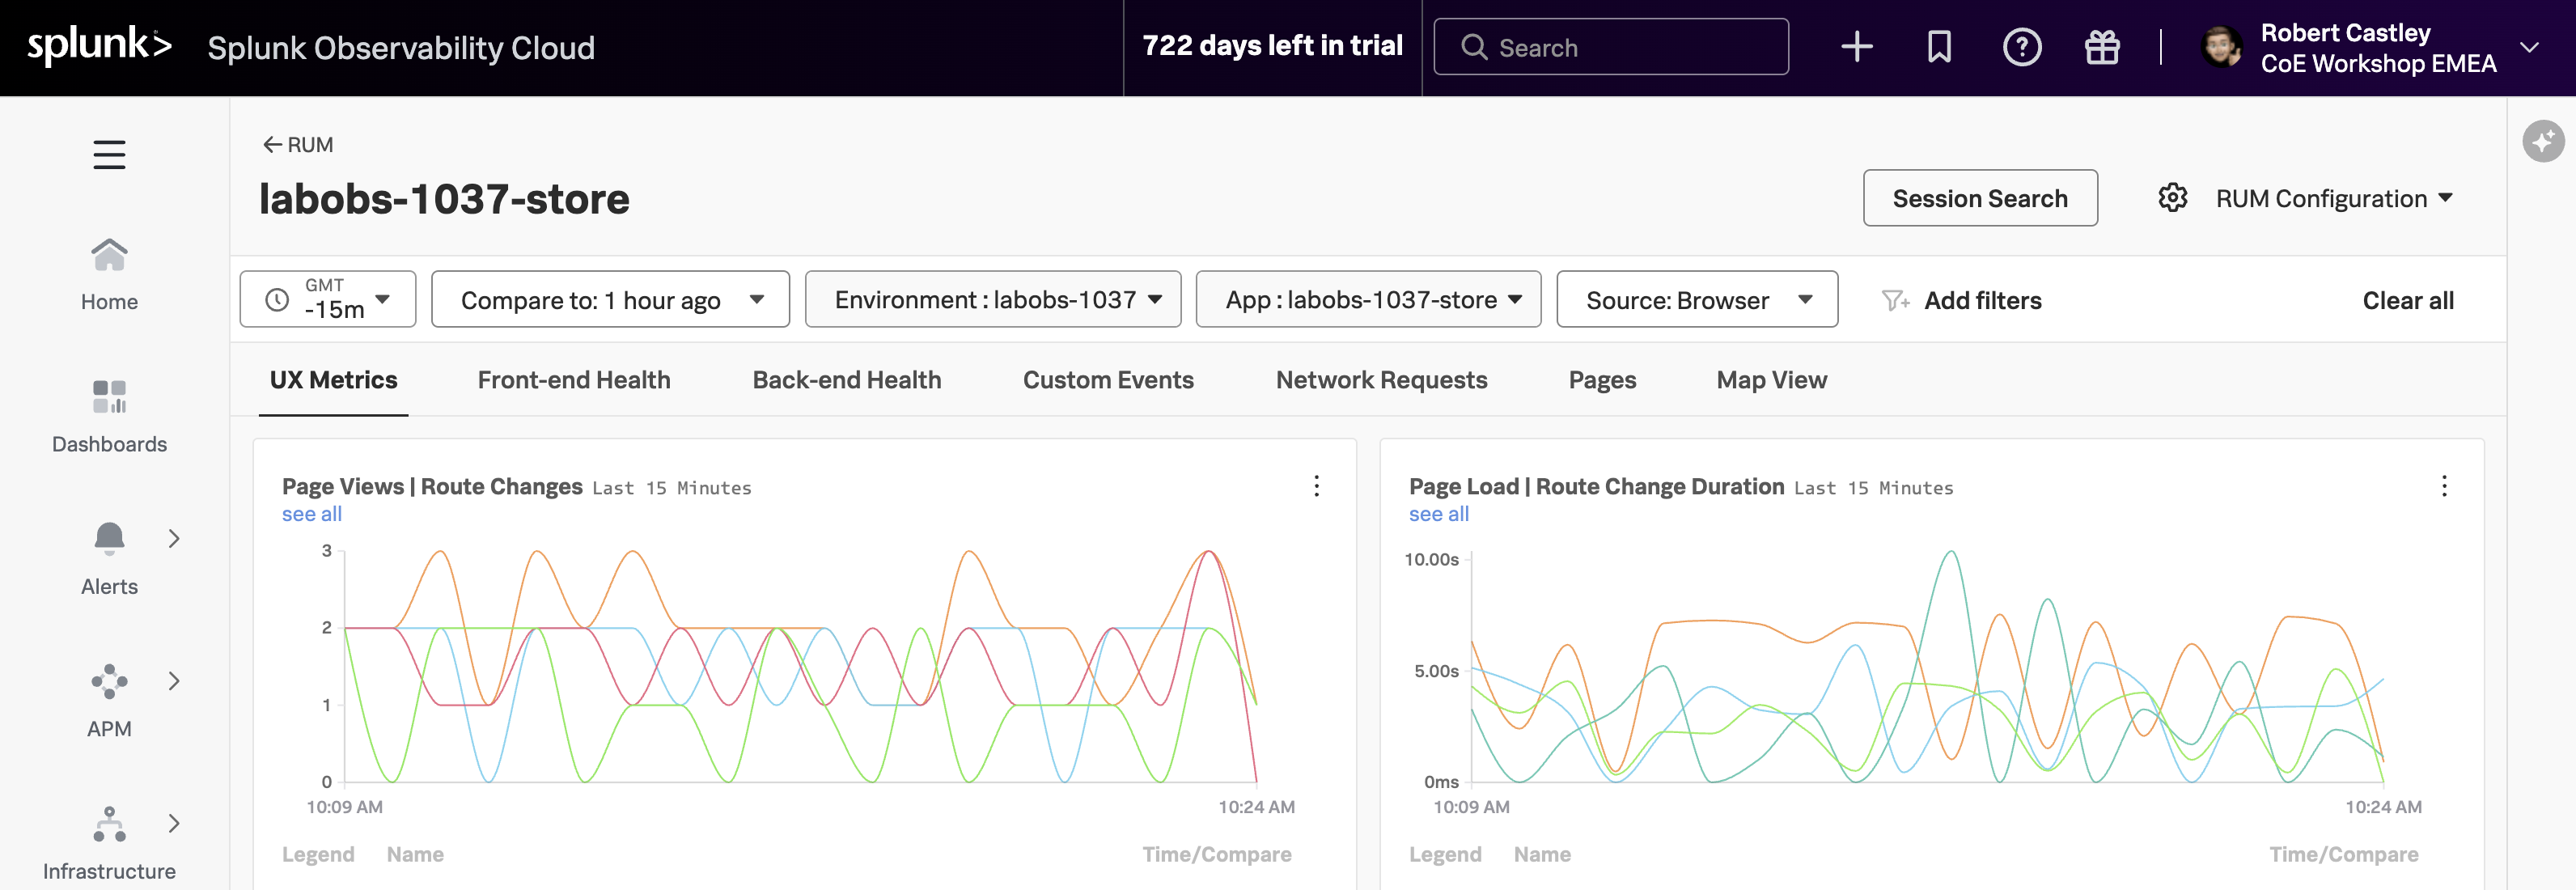
Click through each of the tabs and examine the data.
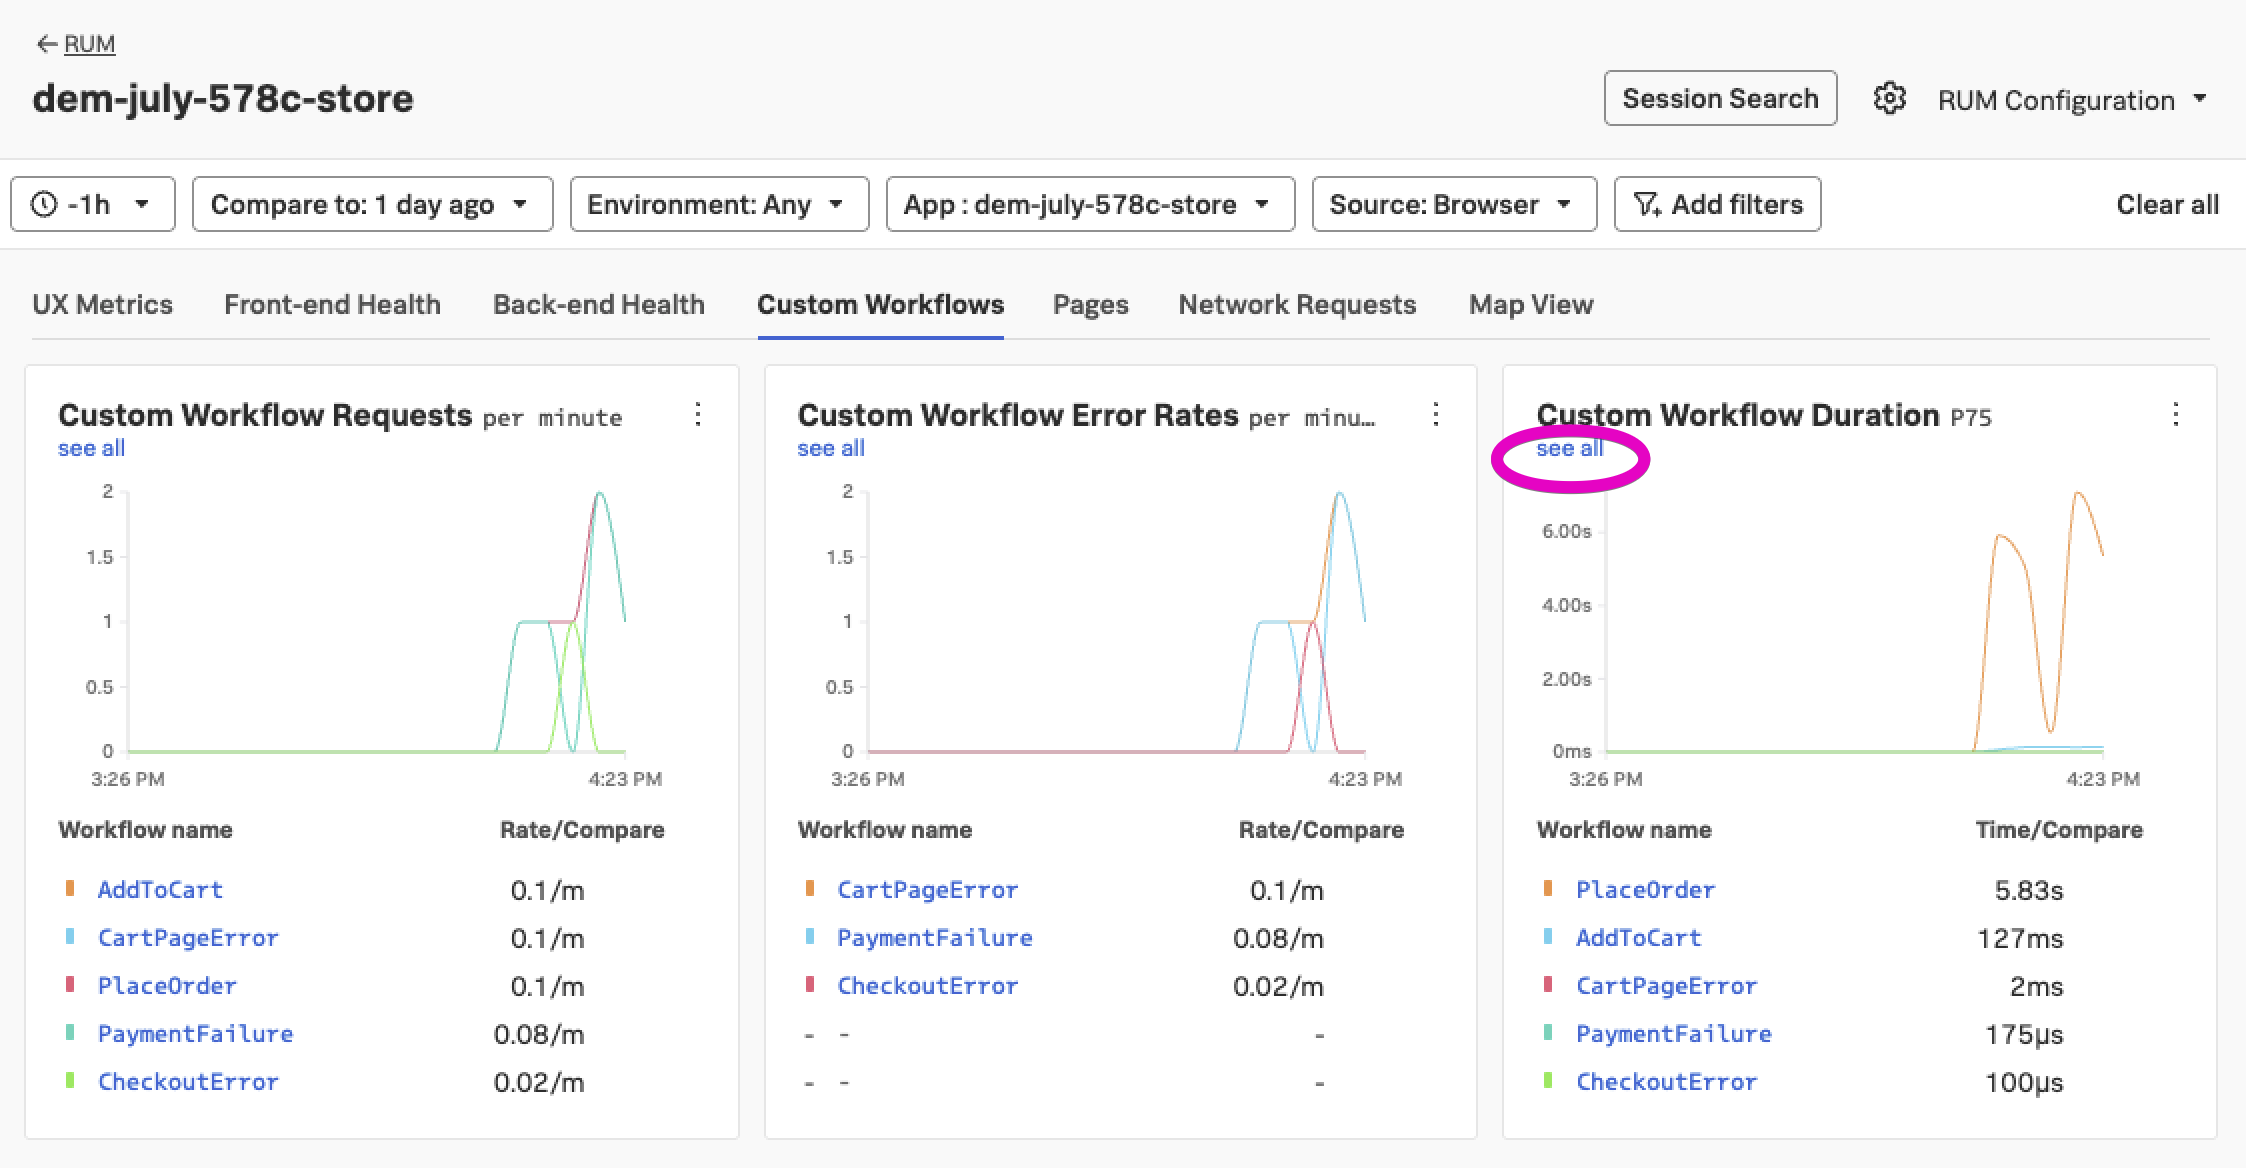
- If you examine the charts in the Custom Workflows tab, what chart shows the latency for
PlaceOrder? - Geographically, where is user traffic coming from?
- Custom Workflow Duration
- US, UK, France, and Germany (see the
Map Viewtab)
Make sure you are on the Custom Workflows tab:
- To identify problematic user sessions, we will use the latency spikes in the Custom Workflow Latency chart.
- In the Custom Workflow Duration chart click on the see all (1) link under the chart title.