Creating Alerts in ITSI
Configuring a Basic Alert in Splunk ITSI
This section guides you through configuring a basic alert in Splunk IT Service Intelligence (ITSI). We’ll set up an alert that triggers when our previously created Service breaches a KPI threshold.
Depending on the Service You Created, the KPI we use for this alert will change. In the instruction steps below replace Service Name and KPI appropriately
- PaymentService2: Business Workflow Error Rate
- AD-Ecommerce2: Availability
Steps:
Navigate to the KPI:
- In ITSI, go to “Configuration” -> “Correlation Searches”
- Click “Create New Search”
Configure the new search:
- Search Title: Service Name KPI Critical
- Description: Service Name KPI Critical
- Search:
- Time Range: Last 15 minutes
- Service: Service Name
- Entity Lookup Field: itsi_service_id
- Run Every: minutes
- Notable Event Title: Service Name KPI Critical
- Severity: Critical
- Notable Event Identified Fields: source
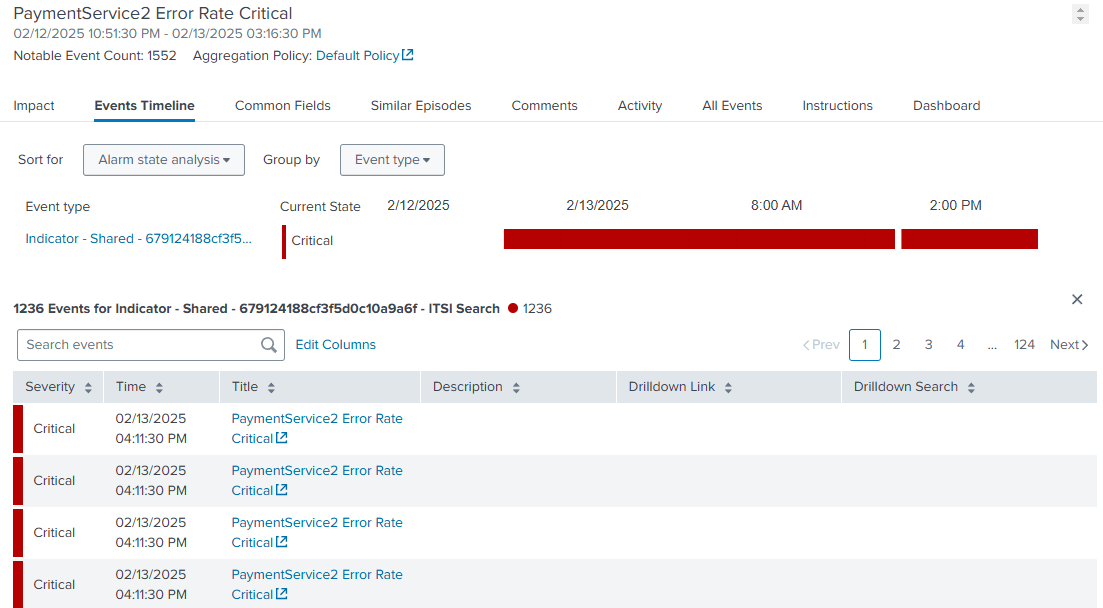
After Creating the Alert:
- You will need to wait 5-10 minutes for the alert to run
- The alert will be listed in the “Alerts and Episodes” Pane in ITSI.
Important Considerations:
- Alert Fatigue: Avoid setting up too many alerts or alerts with overly sensitive thresholds. This can lead to alert fatigue, where people become desensitized to alerts and might miss critical issues.