Review Metrics, Traces, and Logs
10 minutesView Trace Data in Splunk Observability Cloud
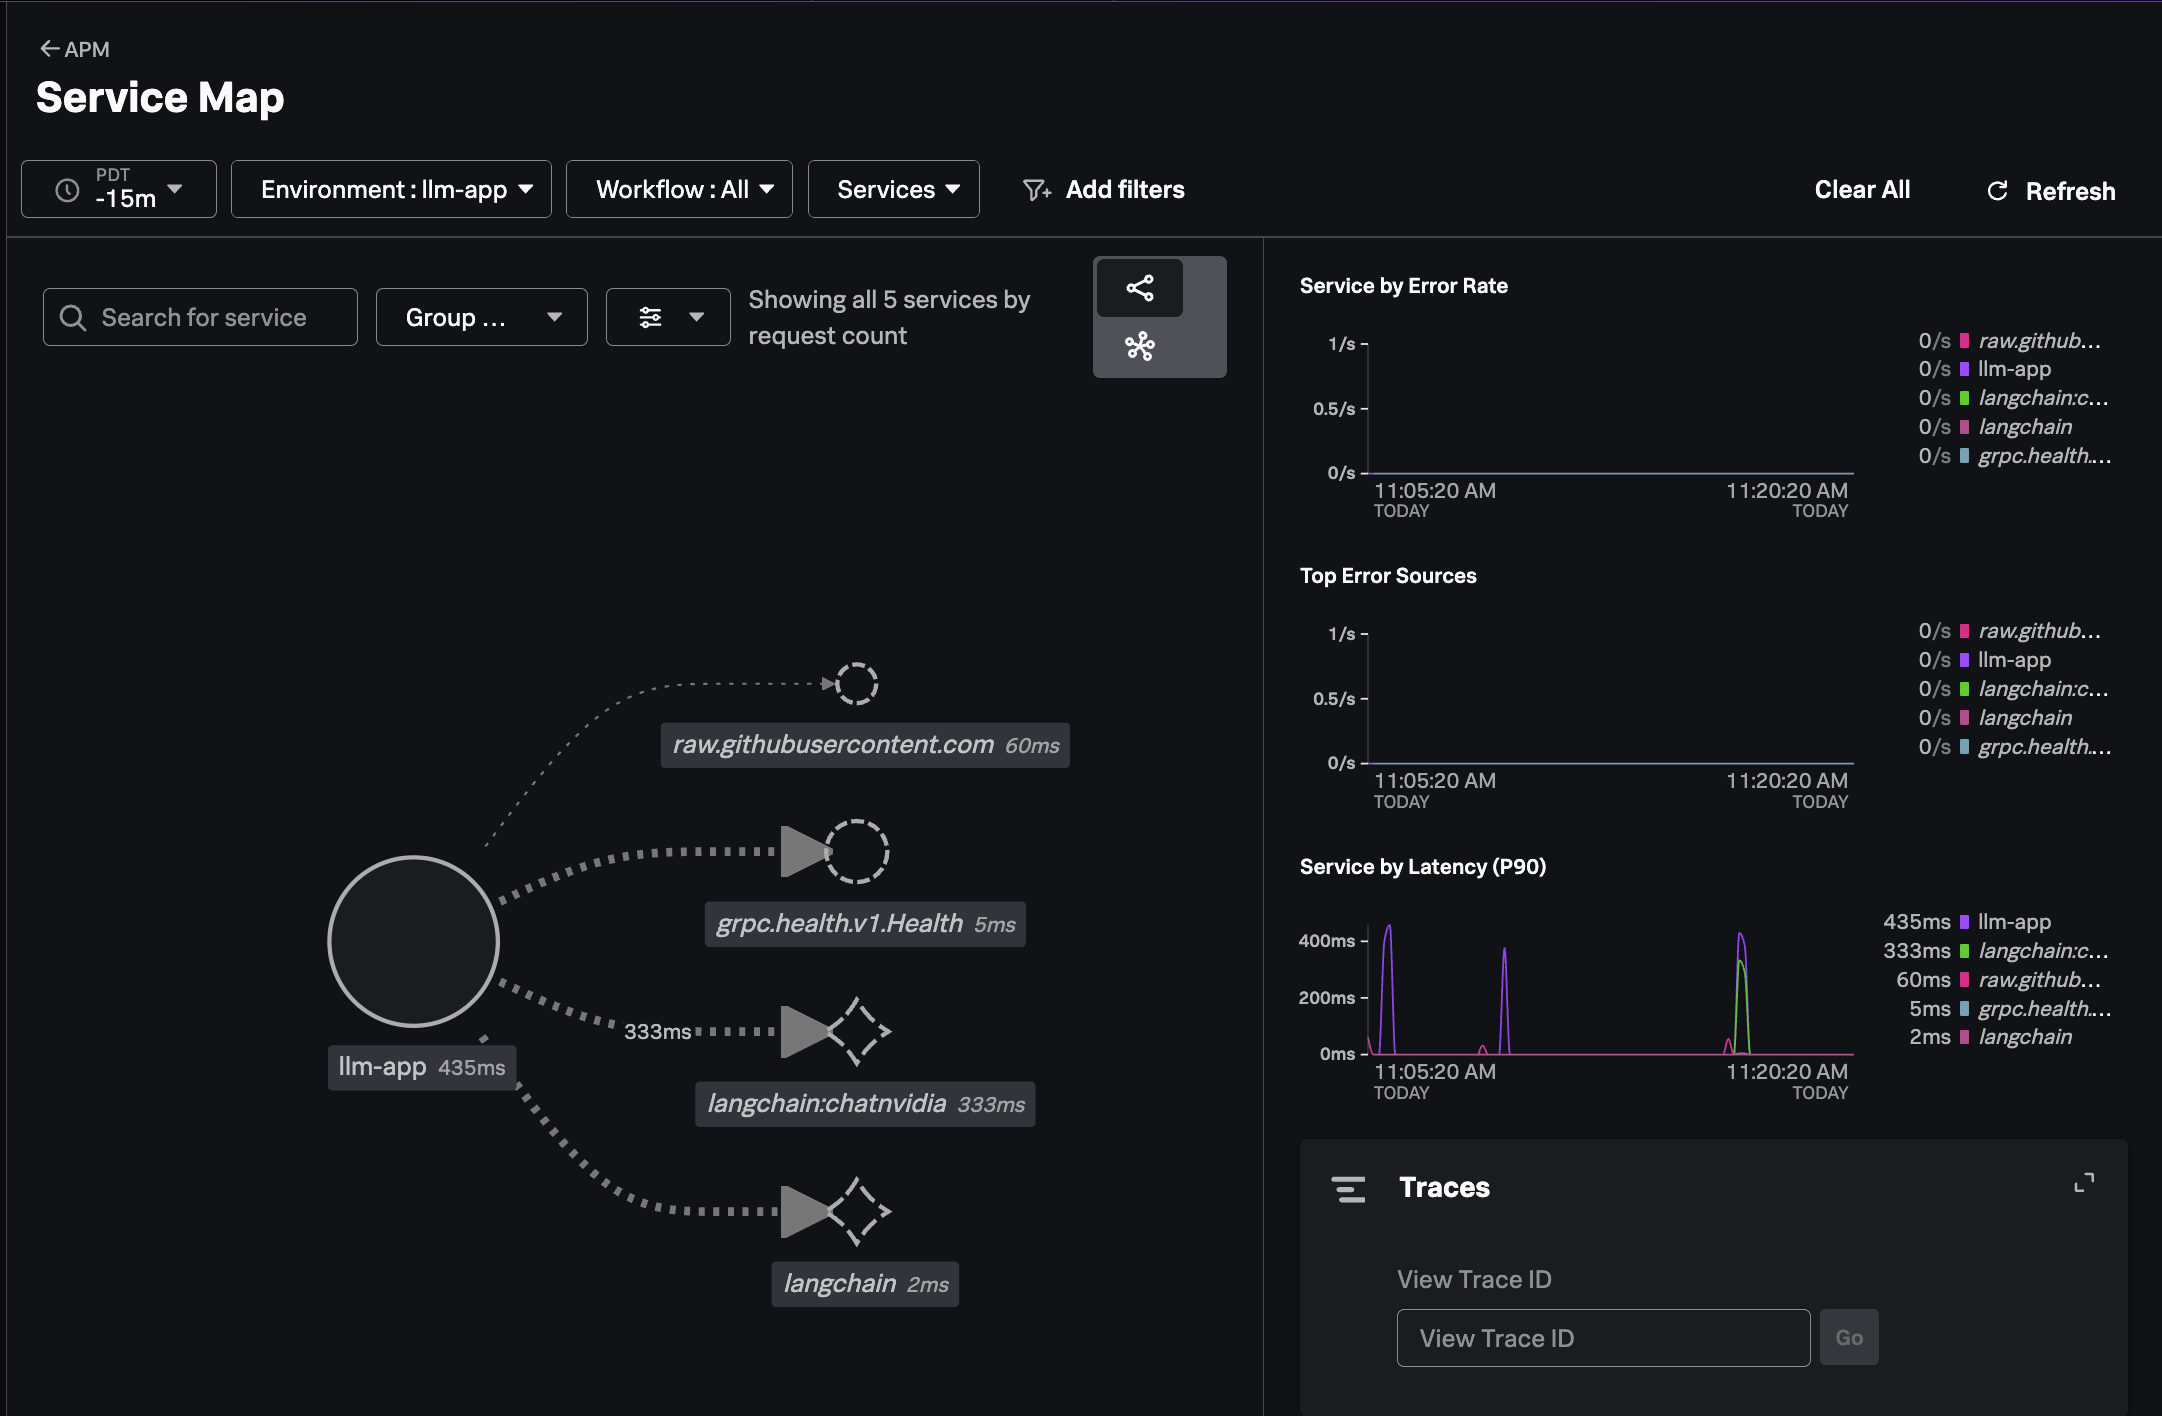
In Splunk Observability Cloud, navigate to APM and then select Service Map.
Ensure your environment name is selected (e.g. ai-pod-workshop-participant-1).
You should see a service map that looks like the following:
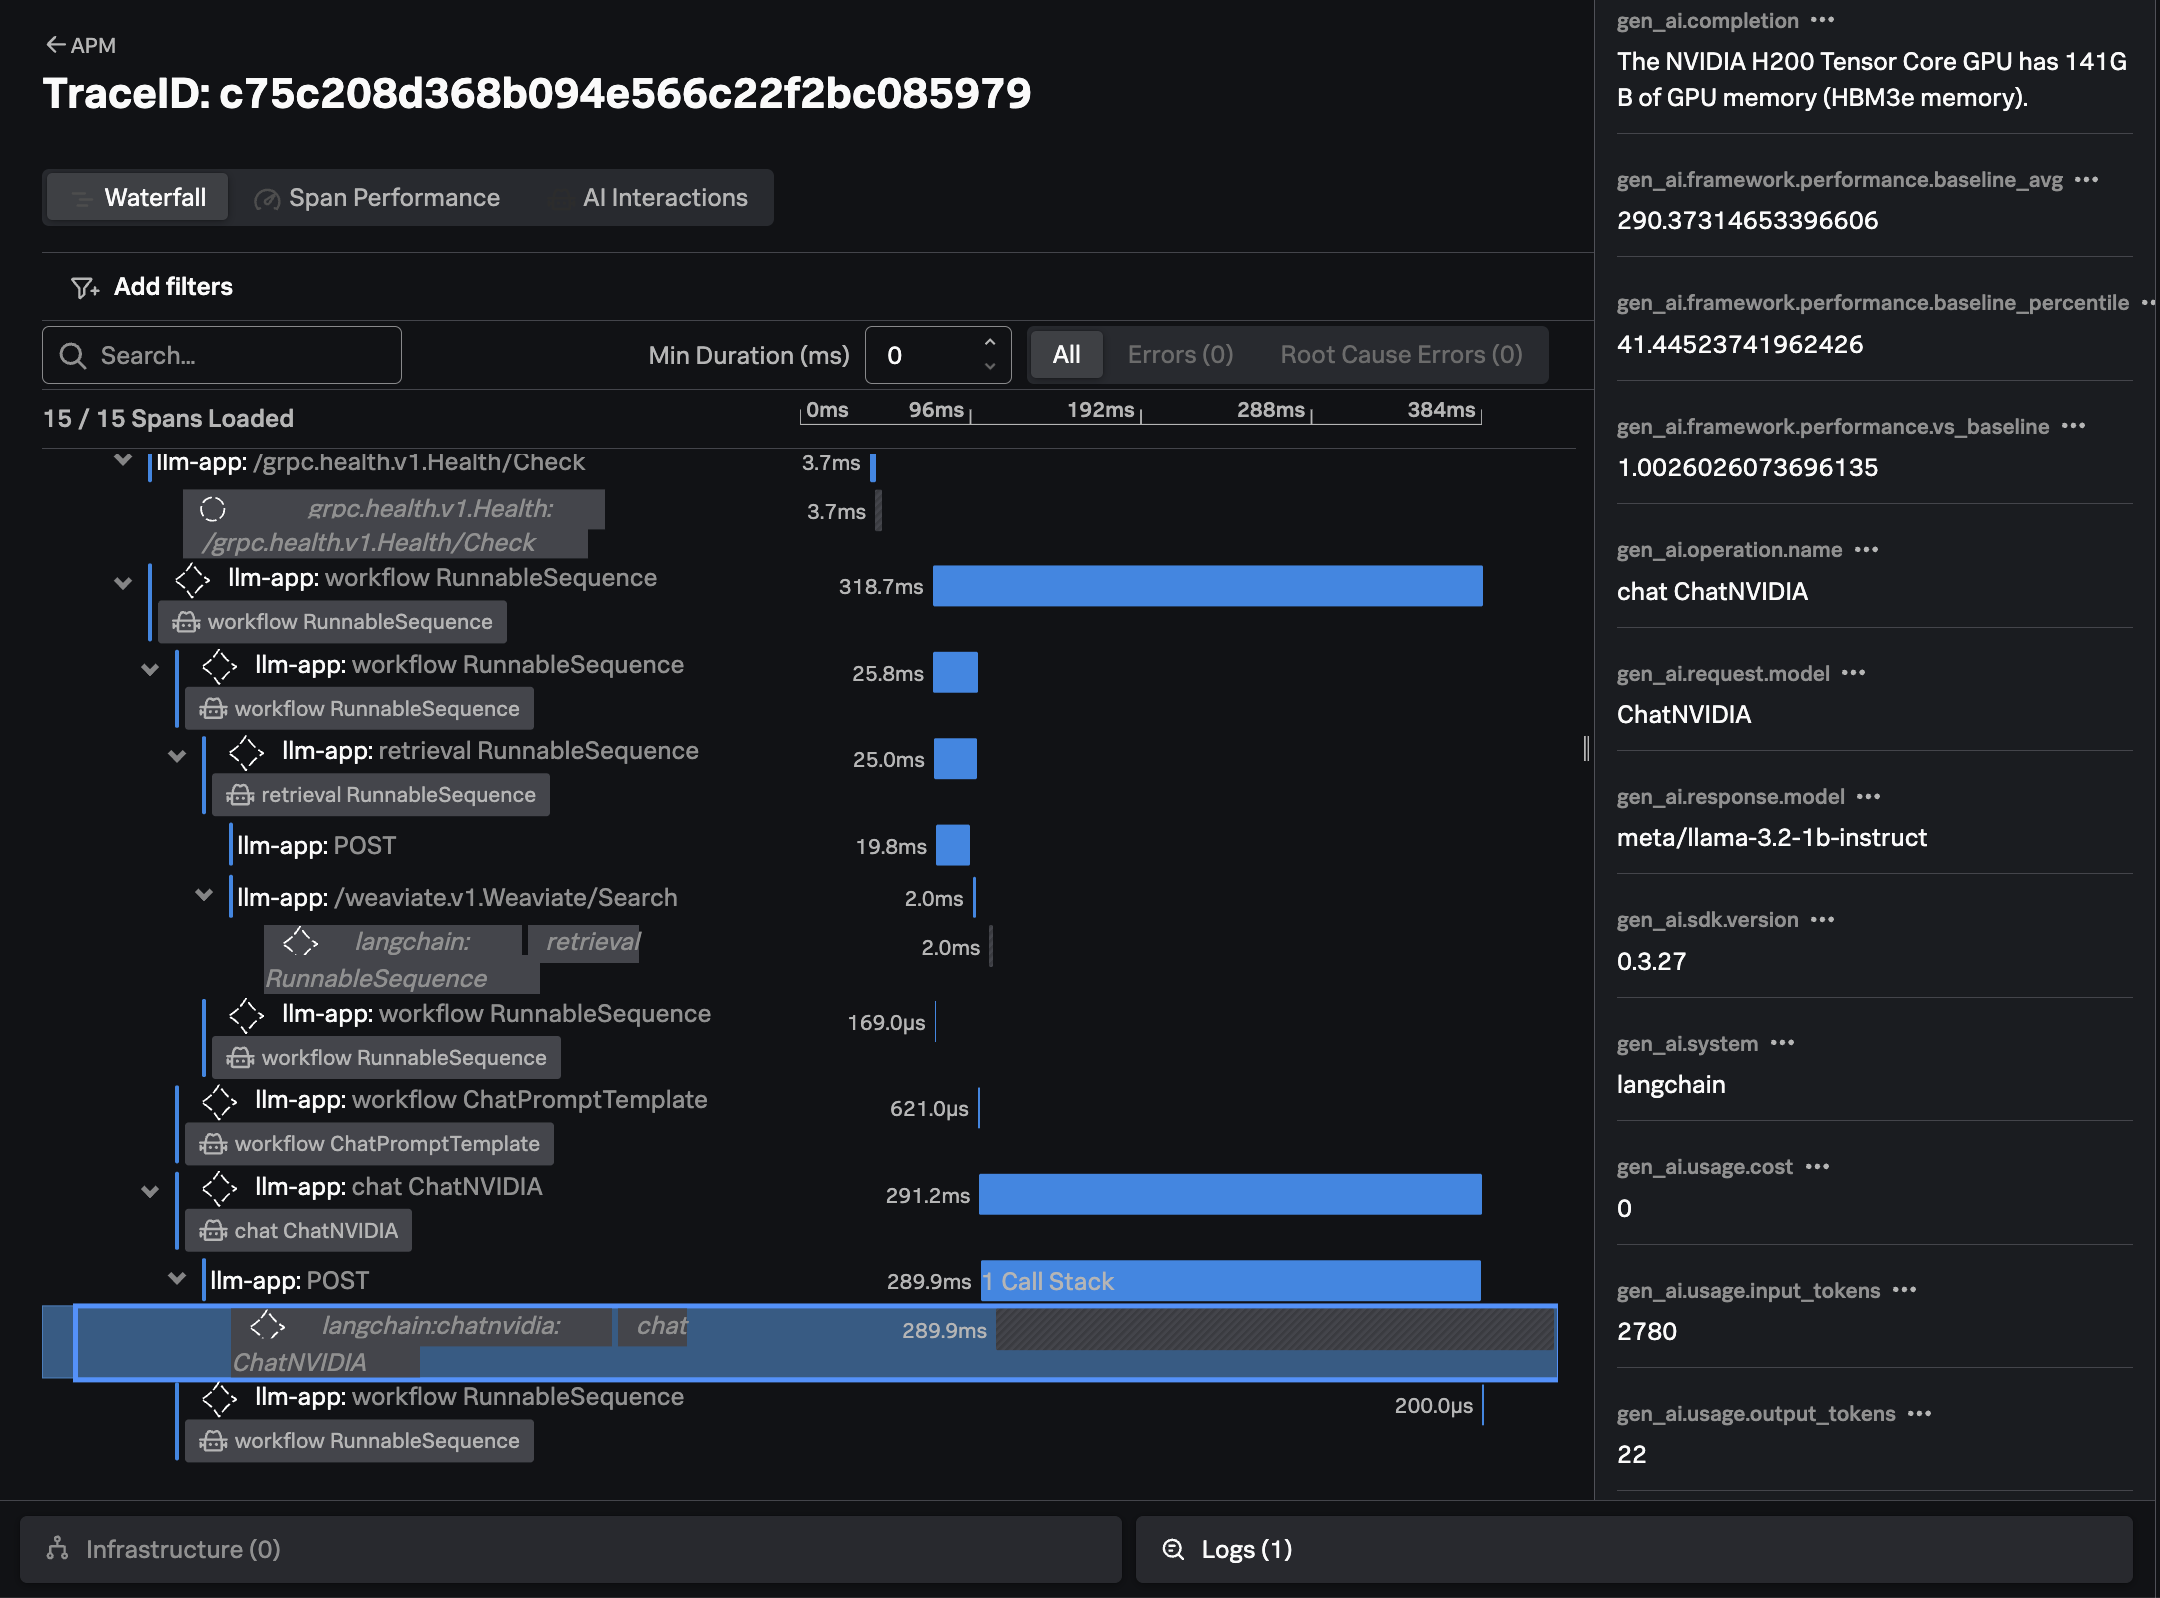
Click on Traces on the right-hand side menu. Then select one of the slower running
traces. It should look like the following example:
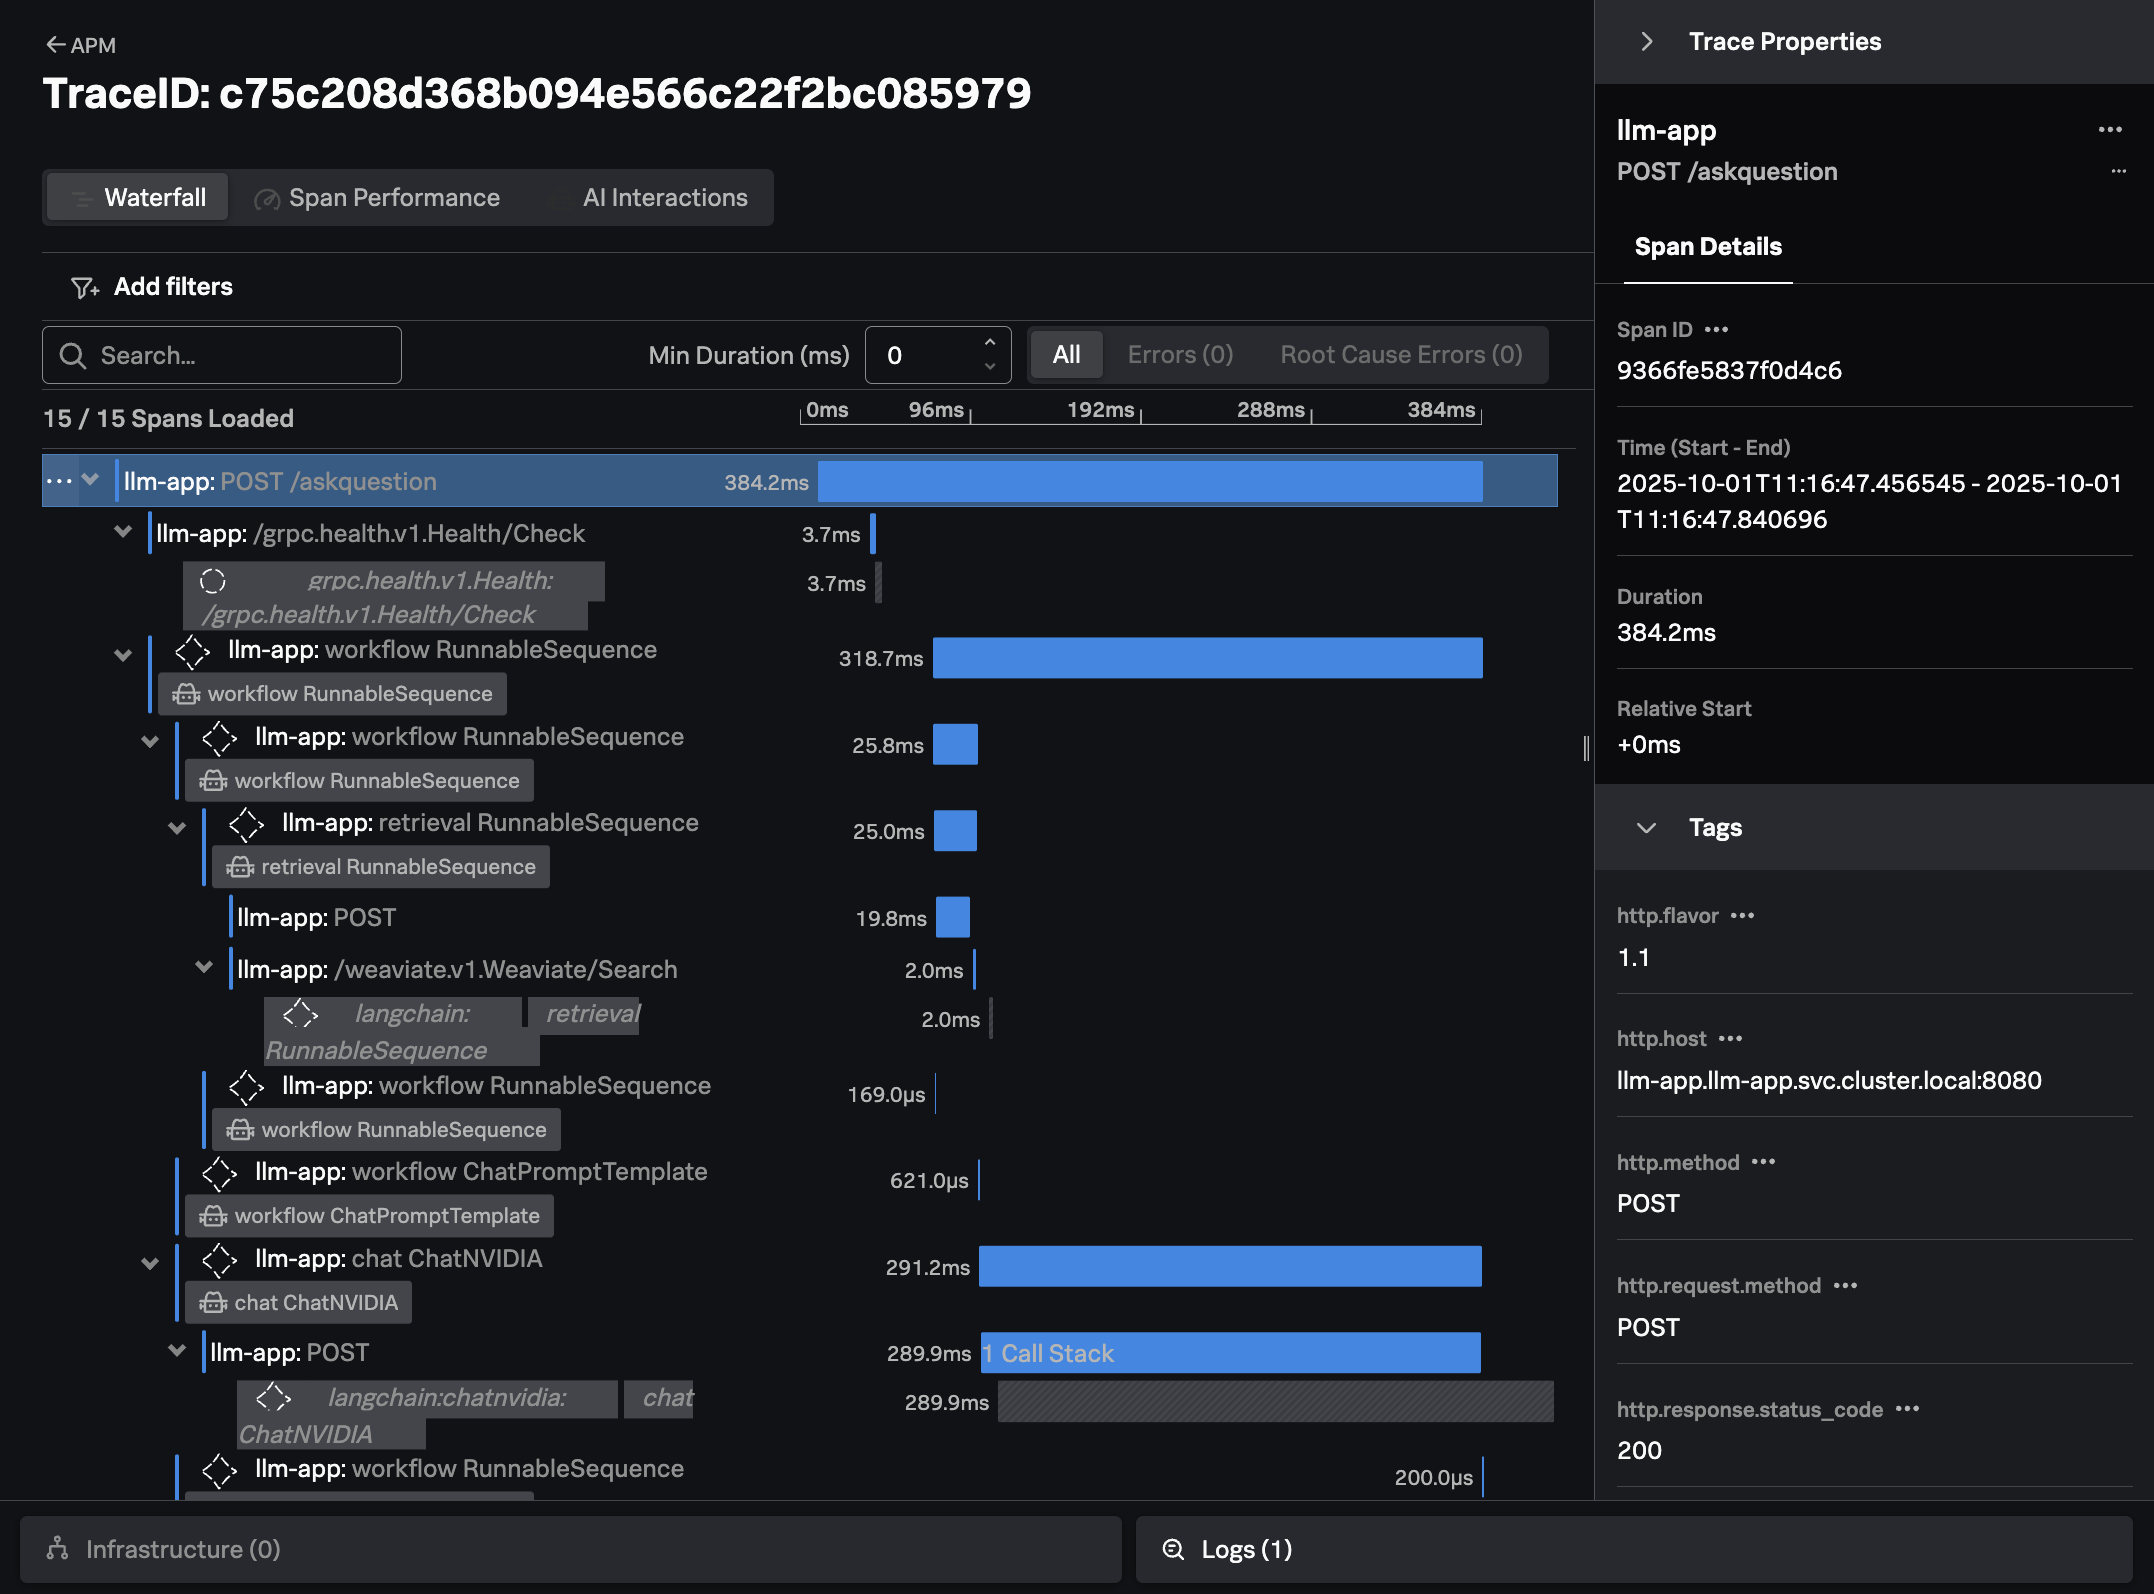
The trace shows all the interactions that our application executed to return an answer to the users question (i.e. “How much memory does the NVIDIA H200 have?”)
For example, we can see where our application performed a similarity search to look for documents related to the question at hand in the Weaviate vector database.
We can also see how the application created a prompt to send to the LLM, including the context that was retrieved from the vector database:
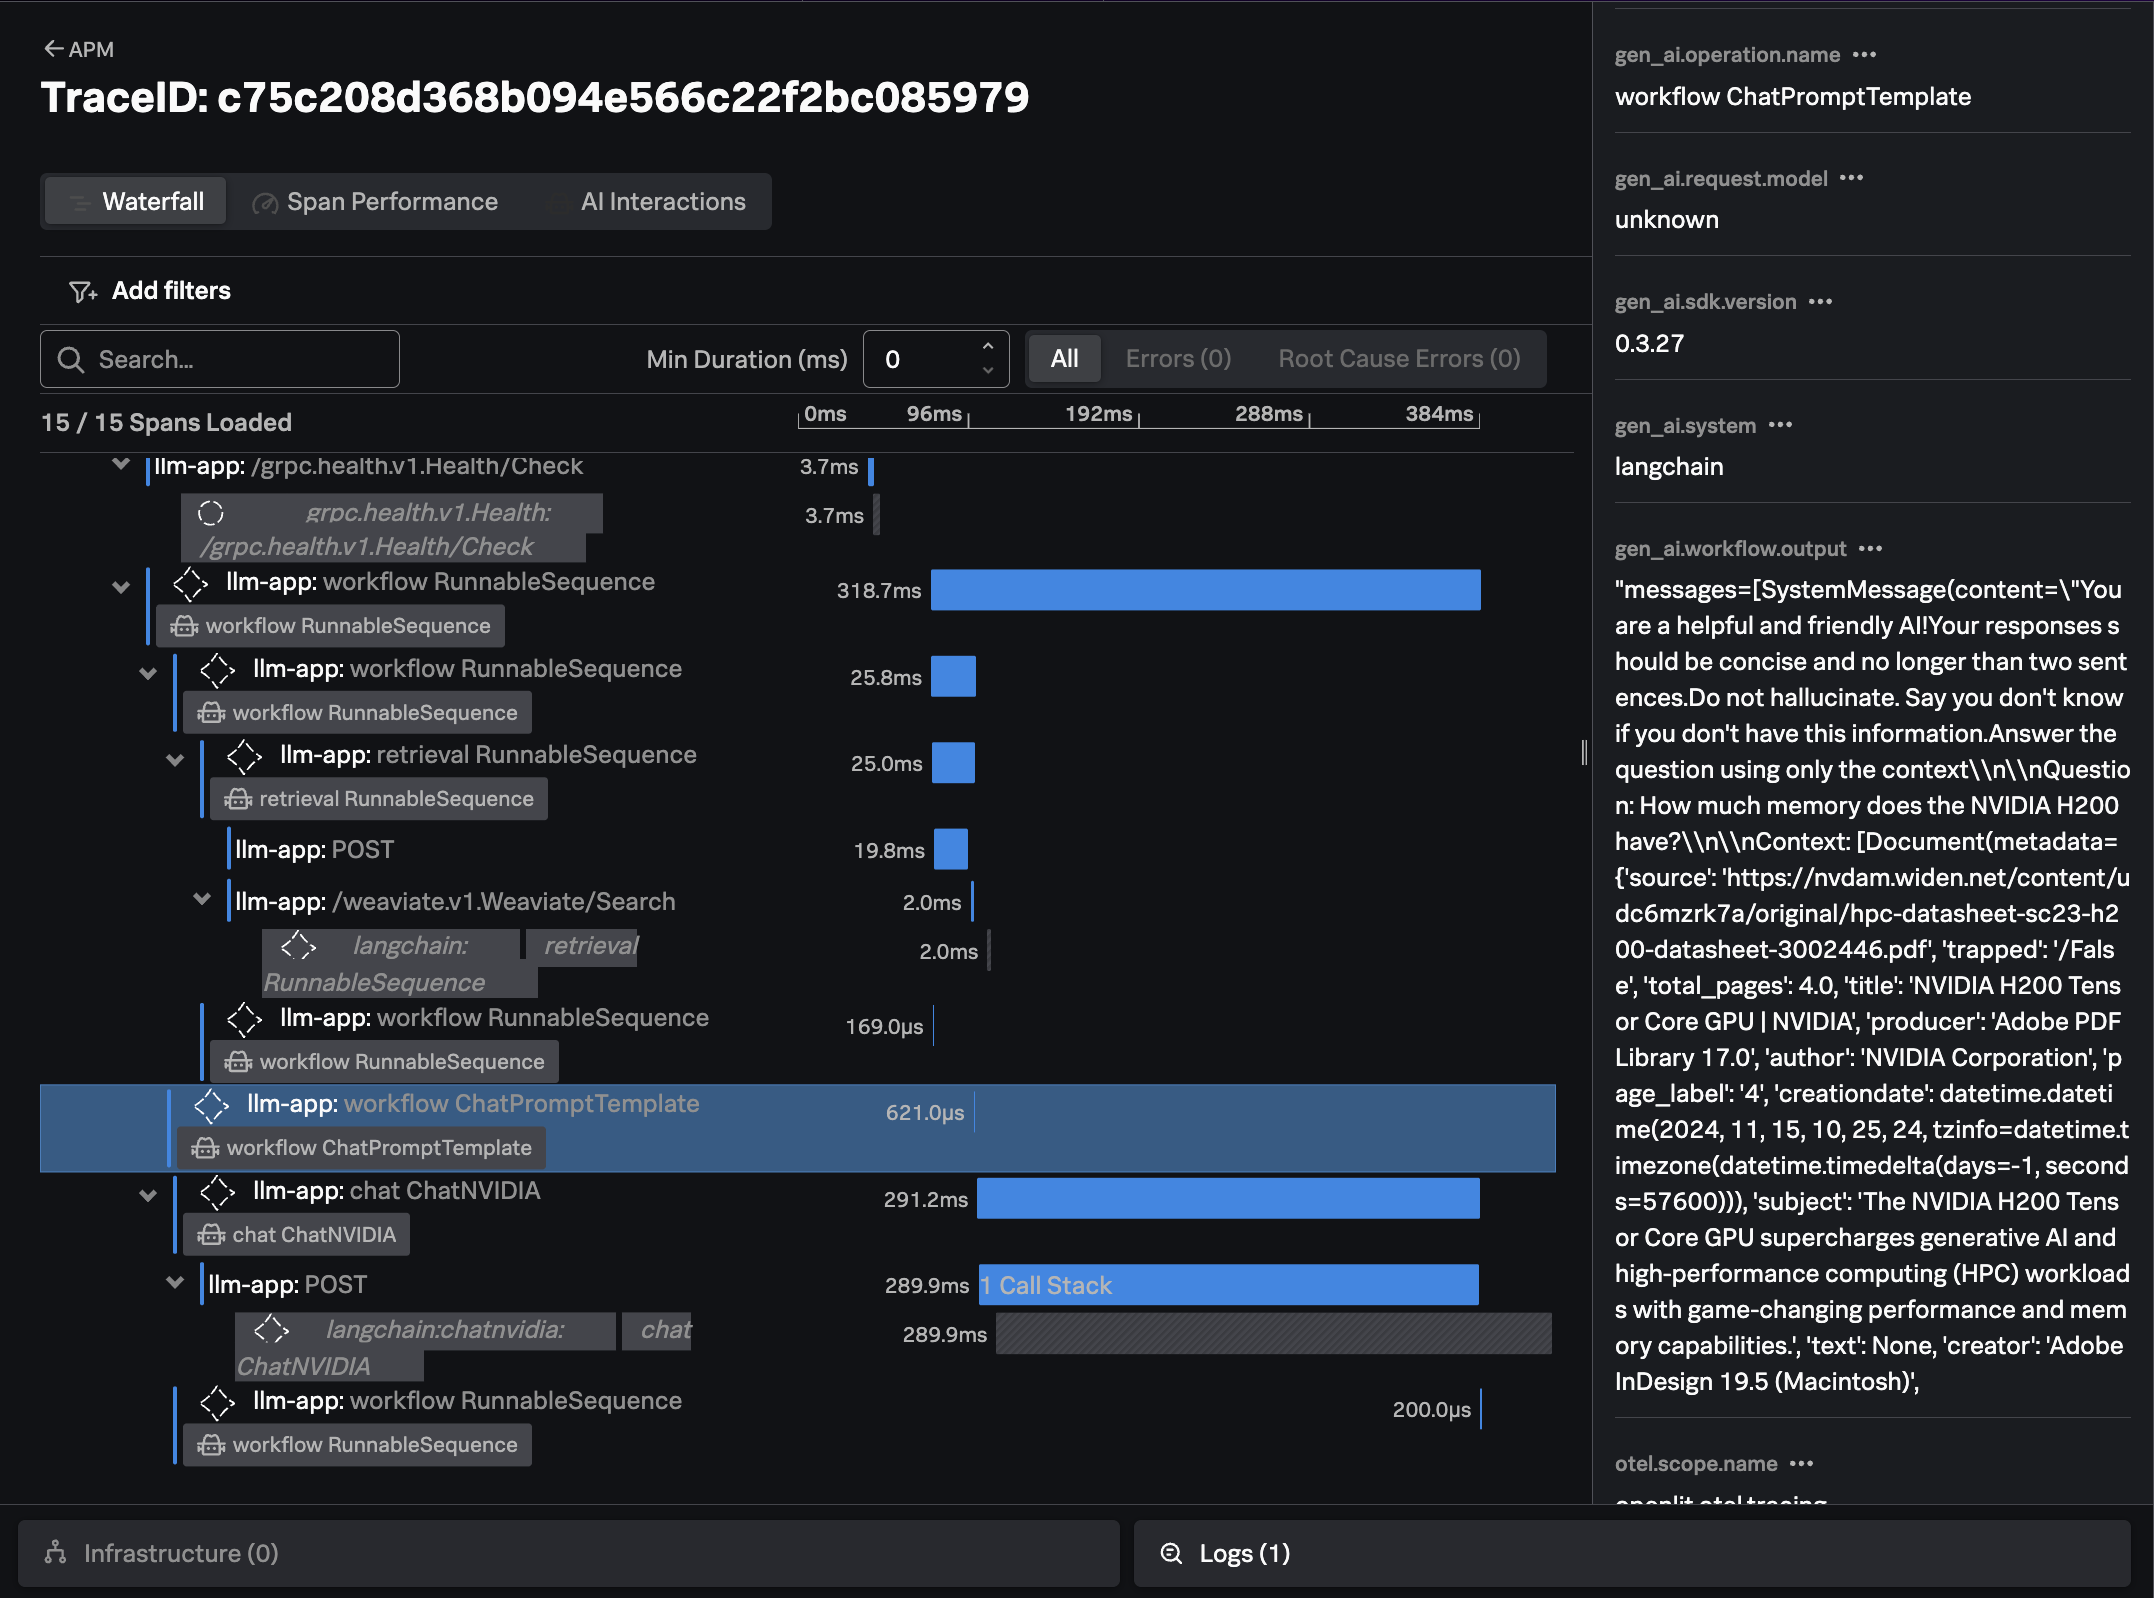
Note: if you don’t see the
chatandinvoke_workflowAI interactions in the trace waterfall view, or you don’t see theAI detailstab on the right-hand side, ask your instructor about the superpowers which need to be enabled.
Finally, we can see the response from the LLM, the time it took, and the number of input and output tokens utilized:
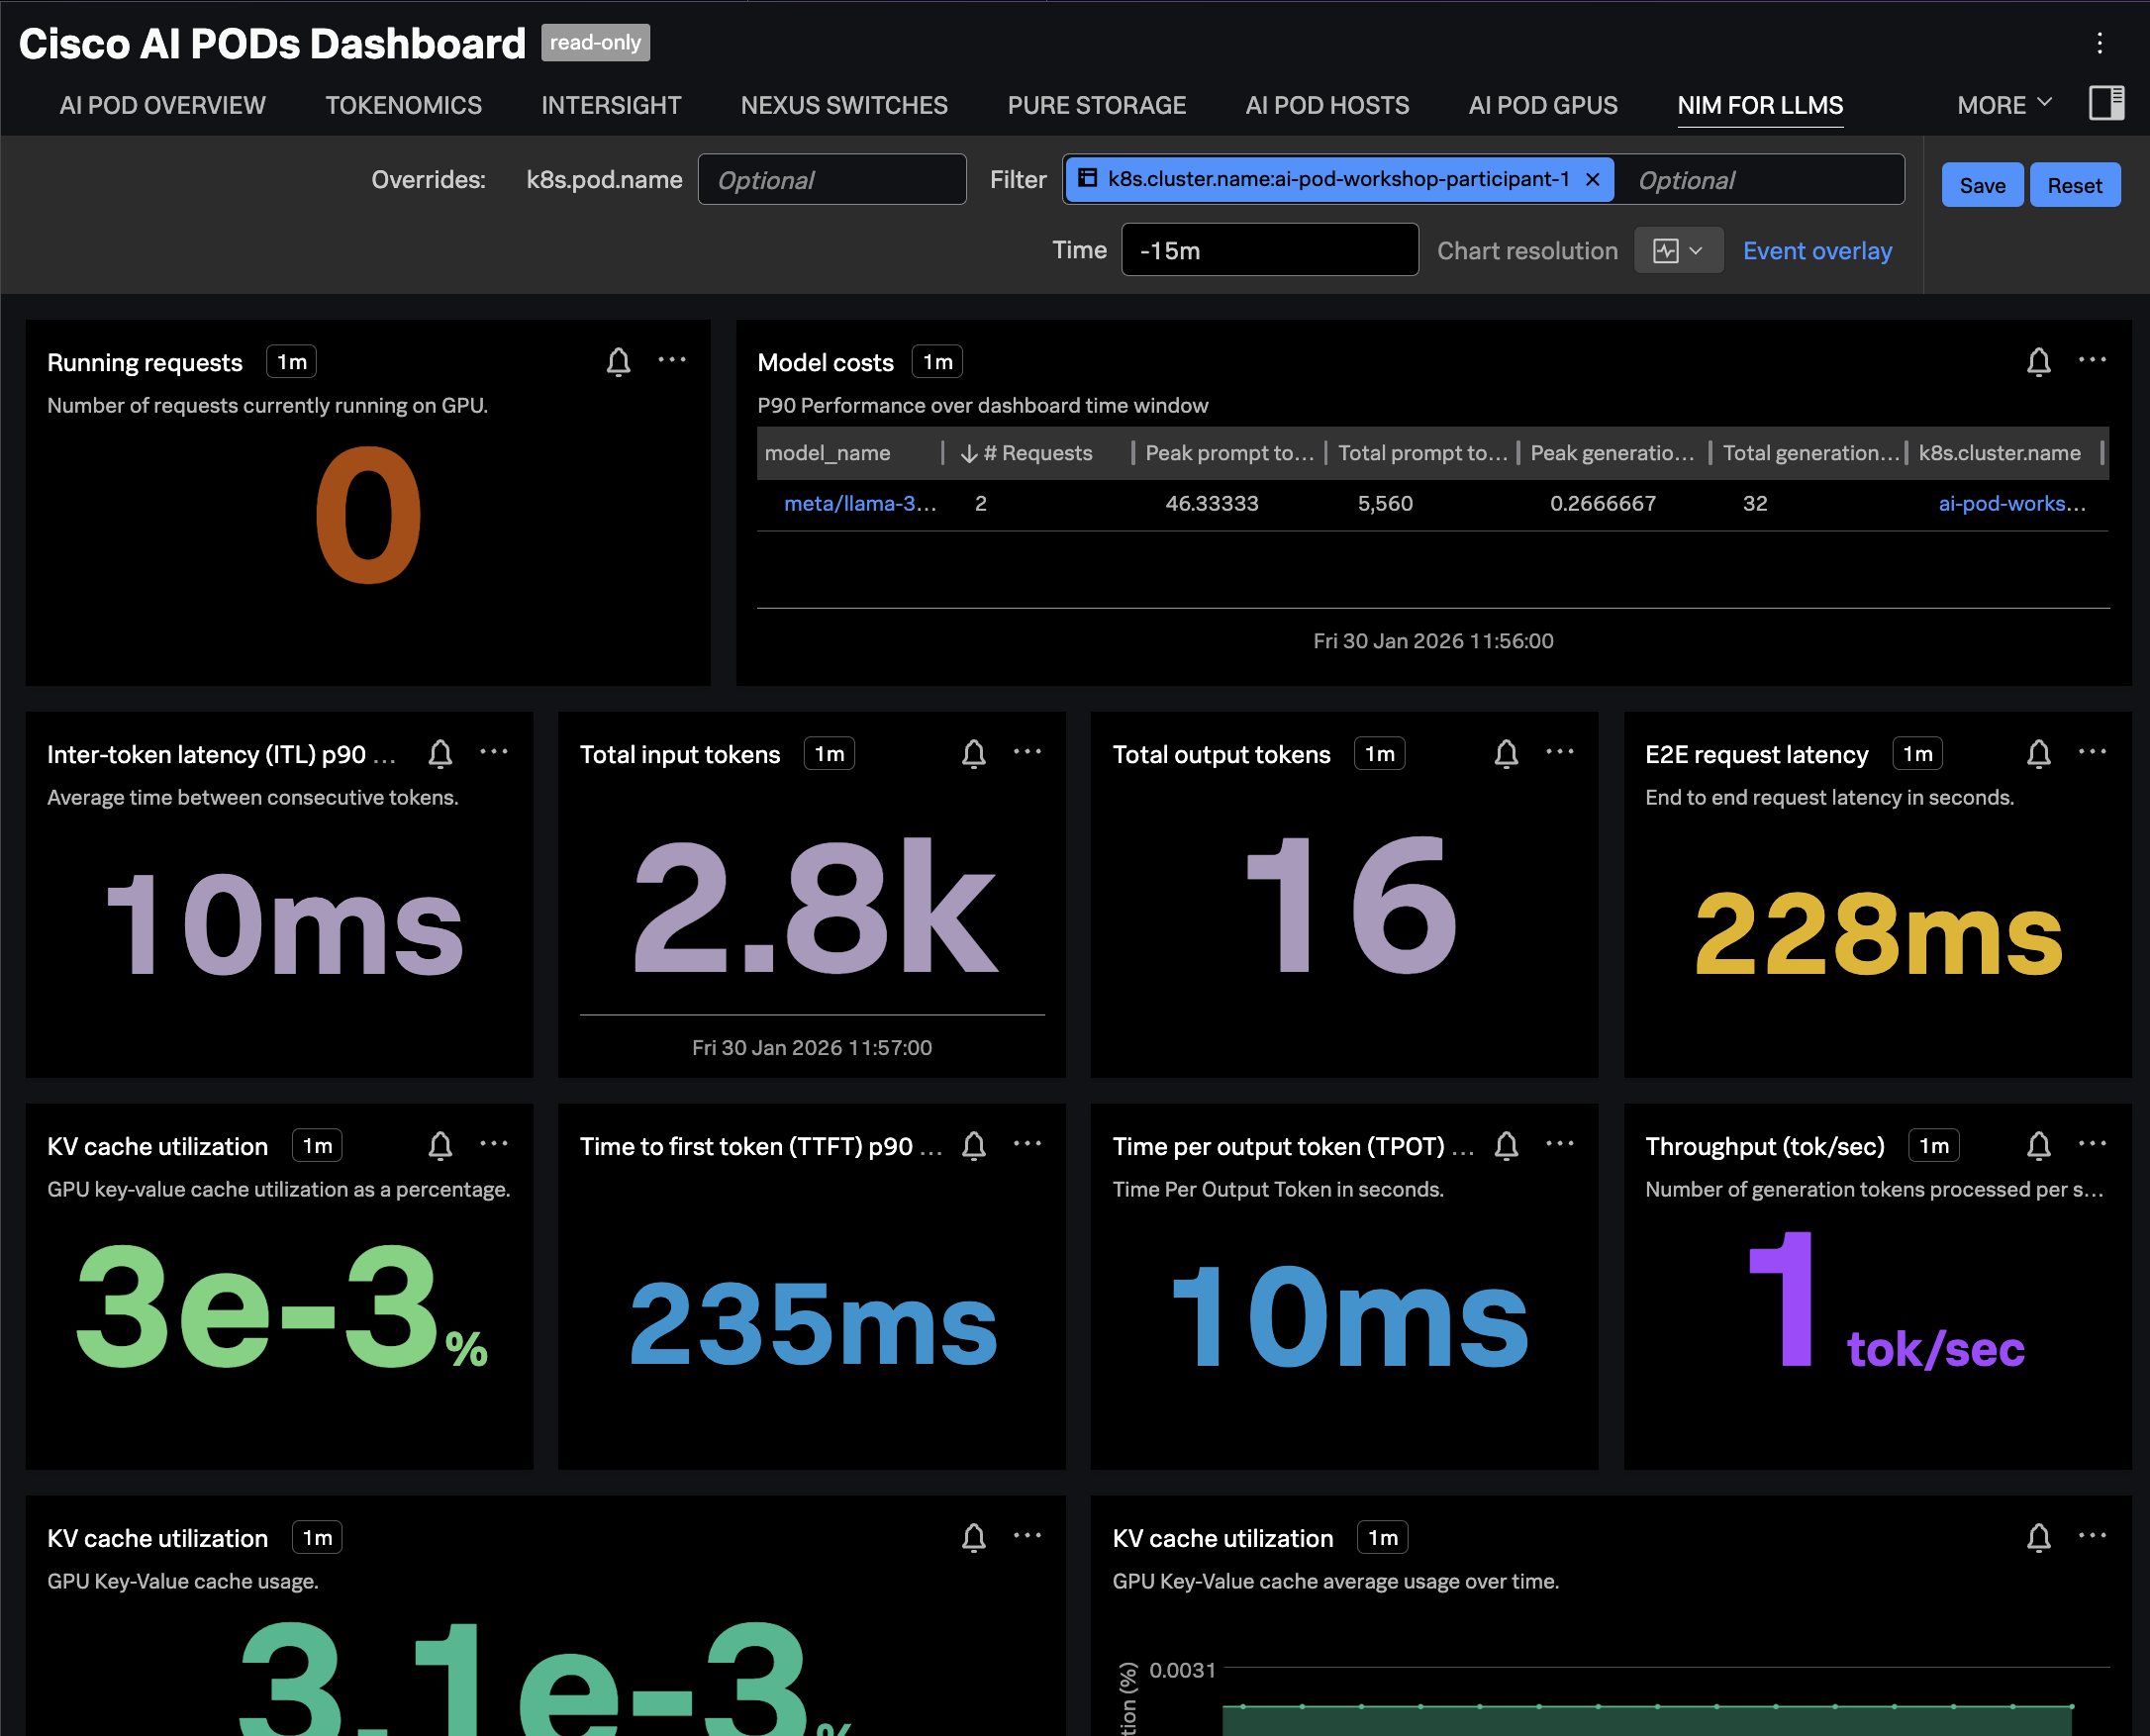
Confirm Metrics are Sent to Splunk
Navigate to Dashboards in Splunk Observability Cloud, then search for the
Cisco AI PODs Dashboard, which is included in the Built-in dashboard groups.
Navigate to the NIM FOR LLMS tab and ensure the dashboard is filtered
on your OpenShift cluster name. The charts should be populated as in the
following example: