Deploy the OpenTelemetry Collector 10 minutes
In this section we’ll deploy the OpenTelemetry Collector in our OpenShift namespace,
which gathers metrics, logs, and traces from the infrastructure and applications
running in the cluster, and sends the resulting data to Splunk Observability Cloud.
Deploy the OpenTelemetry Collector Ensure Helm is installed:
It should return something like the following:
version.BuildInfo{Version:"v3.19.4", GitCommit:"7cfb6e486dac026202556836bb910c37d847793e", GitTreeState:"clean", GoVersion:"go1.24.11"}If it’s not installed, execute the following commands:
sudo apt-get install curl gpg apt-transport-https --yes
curl -fsSL https://packages.buildkite.com/helm-linux/helm-debian/gpgkey | gpg --dearmor | sudo tee /usr/share/keyrings/helm.gpg > /dev/null
echo "deb [signed-by=/usr/share/keyrings/helm.gpg] https://packages.buildkite.com/helm-linux/helm-debian/any/ any main" | sudo tee /etc/apt/sources.list.d/helm-stable-debian.list
sudo apt-get update
sudo apt-get install helm
Add the Splunk OpenTelemetry Collector for Kubernetes’ Helm chart repository:
helm repo add splunk-otel-collector-chart https://signalfx.github.io/splunk-otel-collector-chart Ensure the repository is up-to-date:
Review the file named ./otel-collector/otel-collector-values.yaml as we’ll be using it
to install the OpenTelemetry collector.
Set environment variables to configure the Splunk environment you’d like
the collector to send data to:
Note: add your workshop participant number before running the command below
export USER_NAME = workshop-participant-<number>
export CLUSTER_NAME = ai-pod-$USER_NAME
export ENVIRONMENT_NAME = ai-pod-$USER_NAME
export SPLUNK_INDEX = splunk4rookies-workshopNavigate to the workshop directory:
cd ~/workshop/cisco-ai-podsThen install the collector in your namespace using the following command:
helm install splunk-otel-collector \
= "clusterName= $CLUSTER_NAME " \
= "environment= $ENVIRONMENT_NAME " \
= "splunkObservability.accessToken= $ACCESS_TOKEN " \
= "splunkObservability.realm= $REALM " \
= "splunkPlatform.endpoint= $HEC_URL " \
= "splunkPlatform.token= $HEC_TOKEN " \
= "splunkPlatform.index= $SPLUNK_INDEX " \
\
$USER_NAME \
Run the following command to confirm that the collector pods are running:
oc get pods
NAME READY STATUS RESTARTS AGE
splunk-otel-collector-agent-58rwm 1/1 Running 0 6m40s
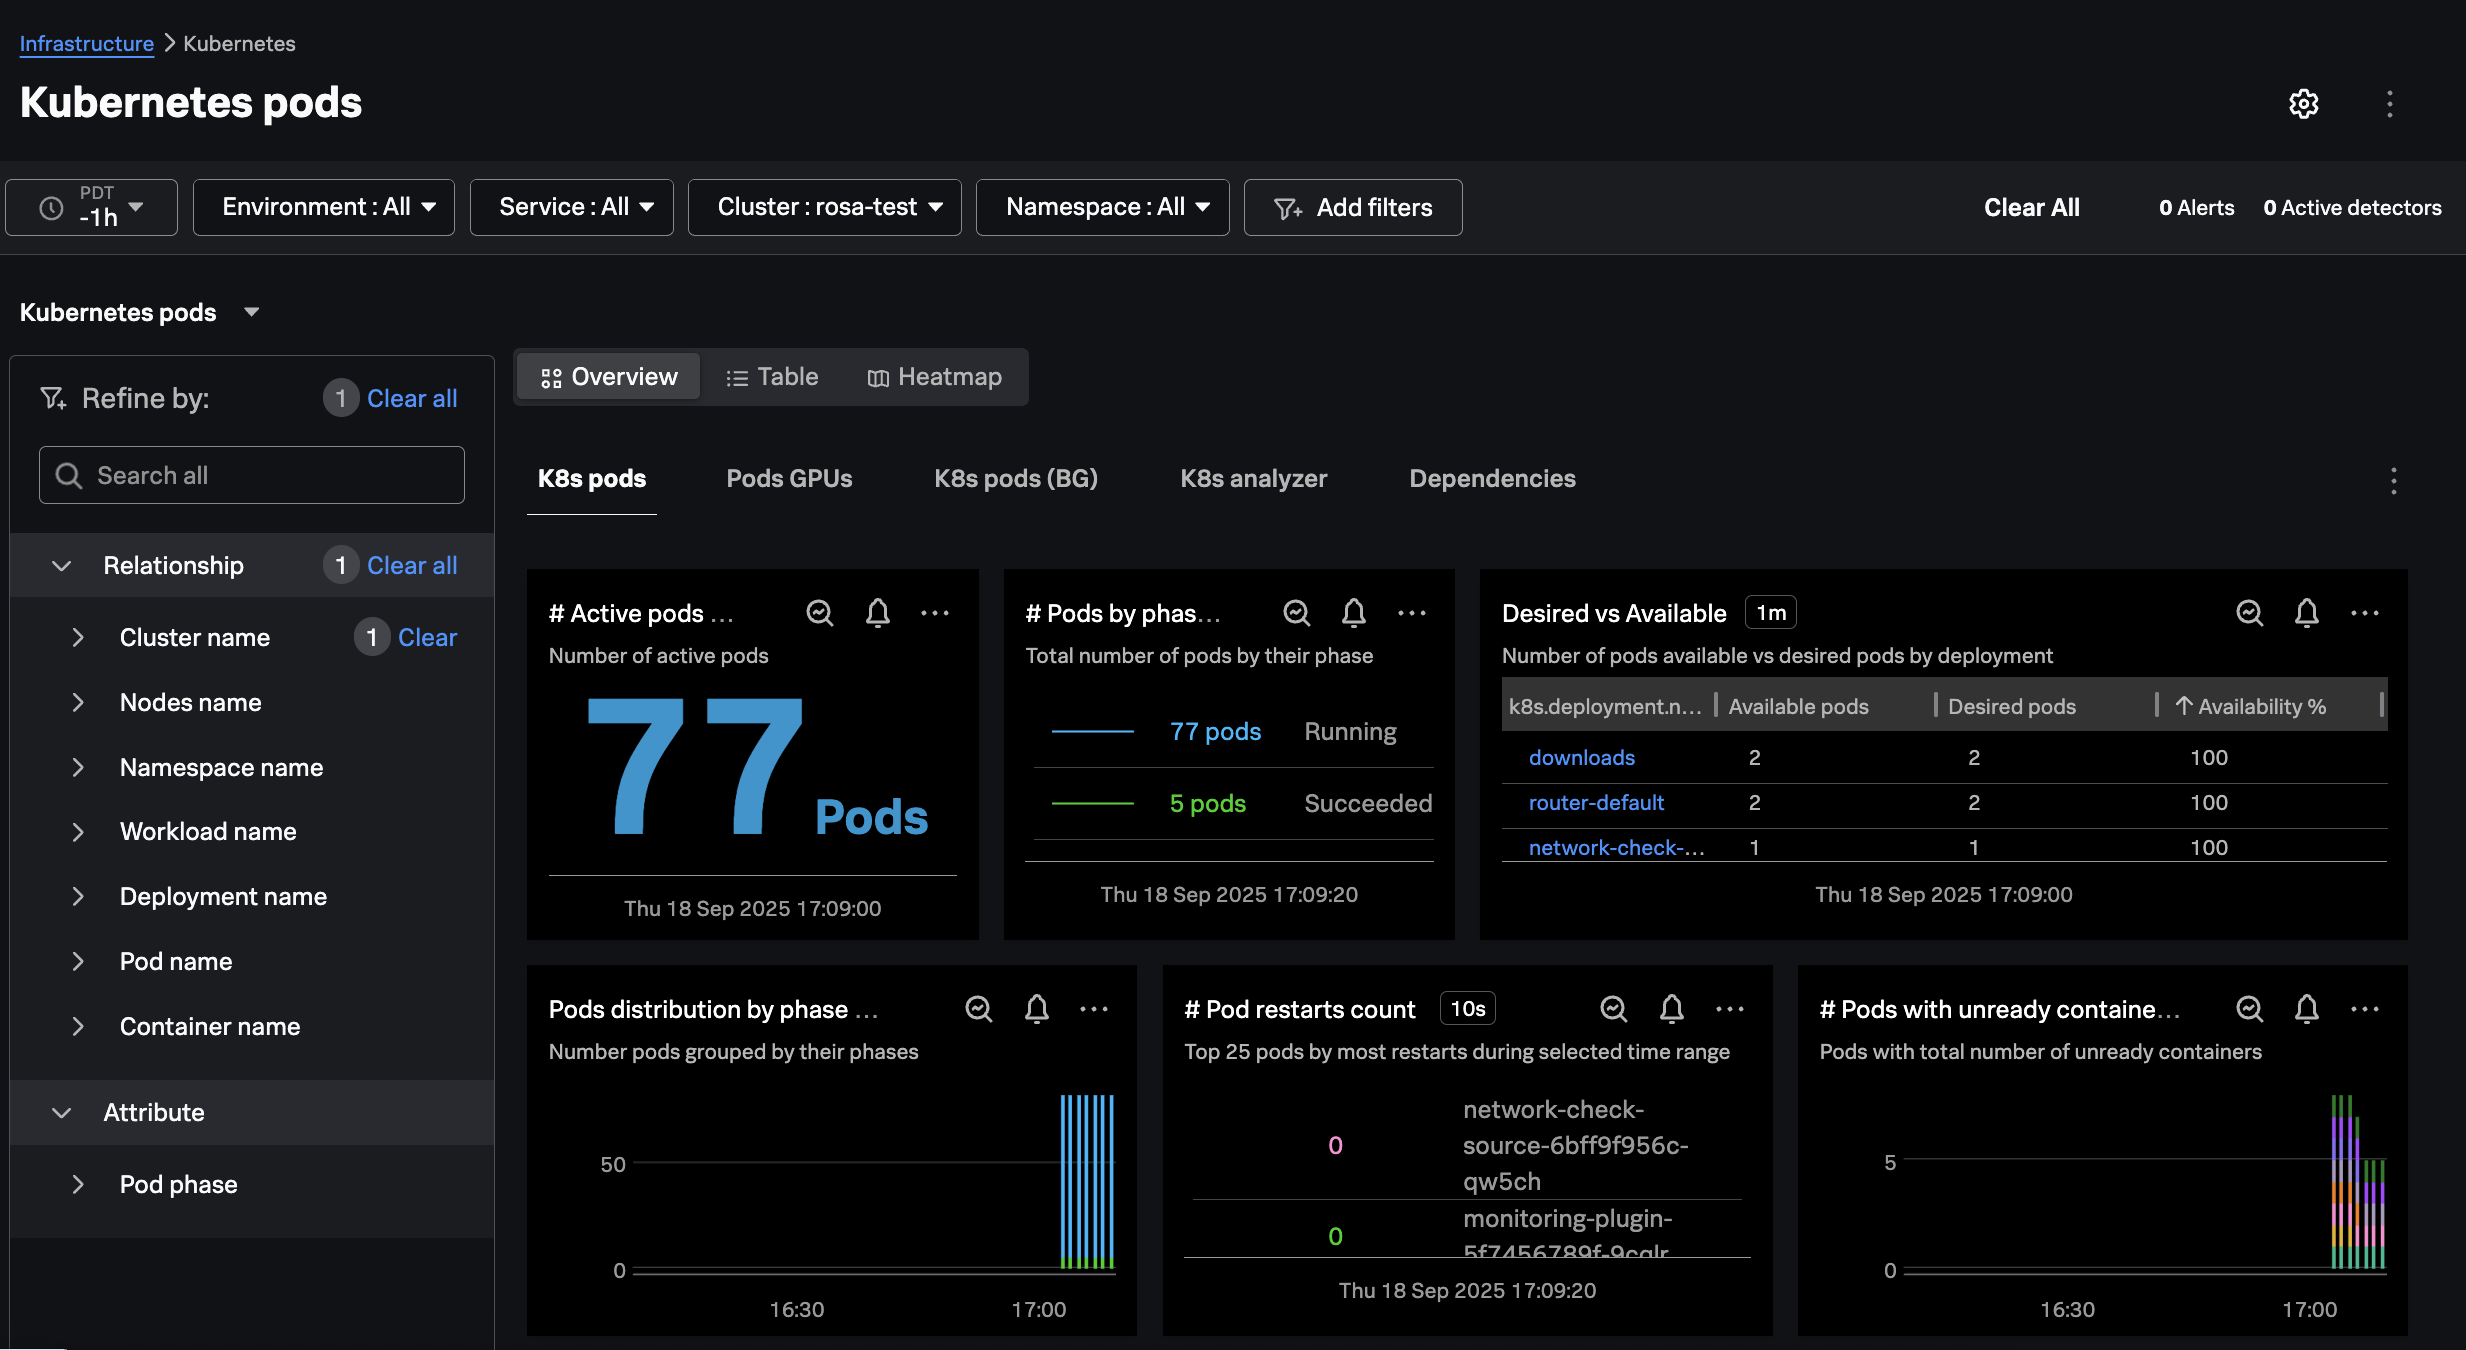
splunk-otel-collector-agent-8dndr 1/1 Running 0 6m40sConfirm that you can see the cluster in Splunk Observability Cloud by navigating to
Infrastructure Monitoring -> Kubernetes -> Kubernetes Clusters and then filtering on your
cluster name: