Monitor the Vector Database
10 minutesIn this step, we’ll configure the Prometheus receiver to monitor the Weaviate vector database.
What is a Vector Database?
A vector database stores and indexes data as numerical “vector embeddings,” which capture the semantic meaning of information like text or images. Unlike traditional databases, they excel at similarity searches, finding conceptually related data points rather than exact matches.
How is a Vector Database Used?
Vector databases play a key role in a pattern called Retrieval Augmented Generation (RAG), which is widely used by applications that leverage Large Language Models (LLMs).
The pattern is as follows:
- The end-user asks a question to the application
- The application takes the question and calculates a vector embedding for it
- The app then performs a similarity search, looking for related documents in the vector database
- The app then takes the original question and the related documents, and sends it to the LLM as context
- The LLM reviews the context and returns a response to the application
Capture Weaviate Metrics with Prometheus
Let’s modify the OpenTelemetry collector configuration to scrape Weaviate’s Prometheus metrics.
To do so, let’s add an additional Prometheus receiver creator section
to the otel-collector-values.yaml file:
We’ll need to ensure that Weaviate’s metrics are added to the filter/metrics_to_be_included filter
processor configuration as well:
We also want to add a Resource processor to the configuration file, with the following configuration:
This processor takes the service.instance.id property on the Weaviate metrics
and copies it into a new property called weaviate.instance.id. This is done so
that we can more easily distinguish Weaviate metrics from other metrics that use
service.instance.id, which is a standard OpenTelemetry property used in
Splunk Observability Cloud.
We’ll need to add a new metrics pipeline for Weaviate metrics as well (we
need to use a separate pipeline since we don’t want the weaviate.instance.id
metric to be added to non-Weaviate metrics):
Before applying the configuration changes to the collector, take a moment to compare the
contents of your modified otel-collector-values.yaml file with the
otel-collector-values-with-weaviate.yaml file.
Update your file as needed to ensure the contents match. Remember that indentation is important
for yaml files, and needs to be precise.
Now we can update the OpenTelemetry collector configuration by running the following Helm command:
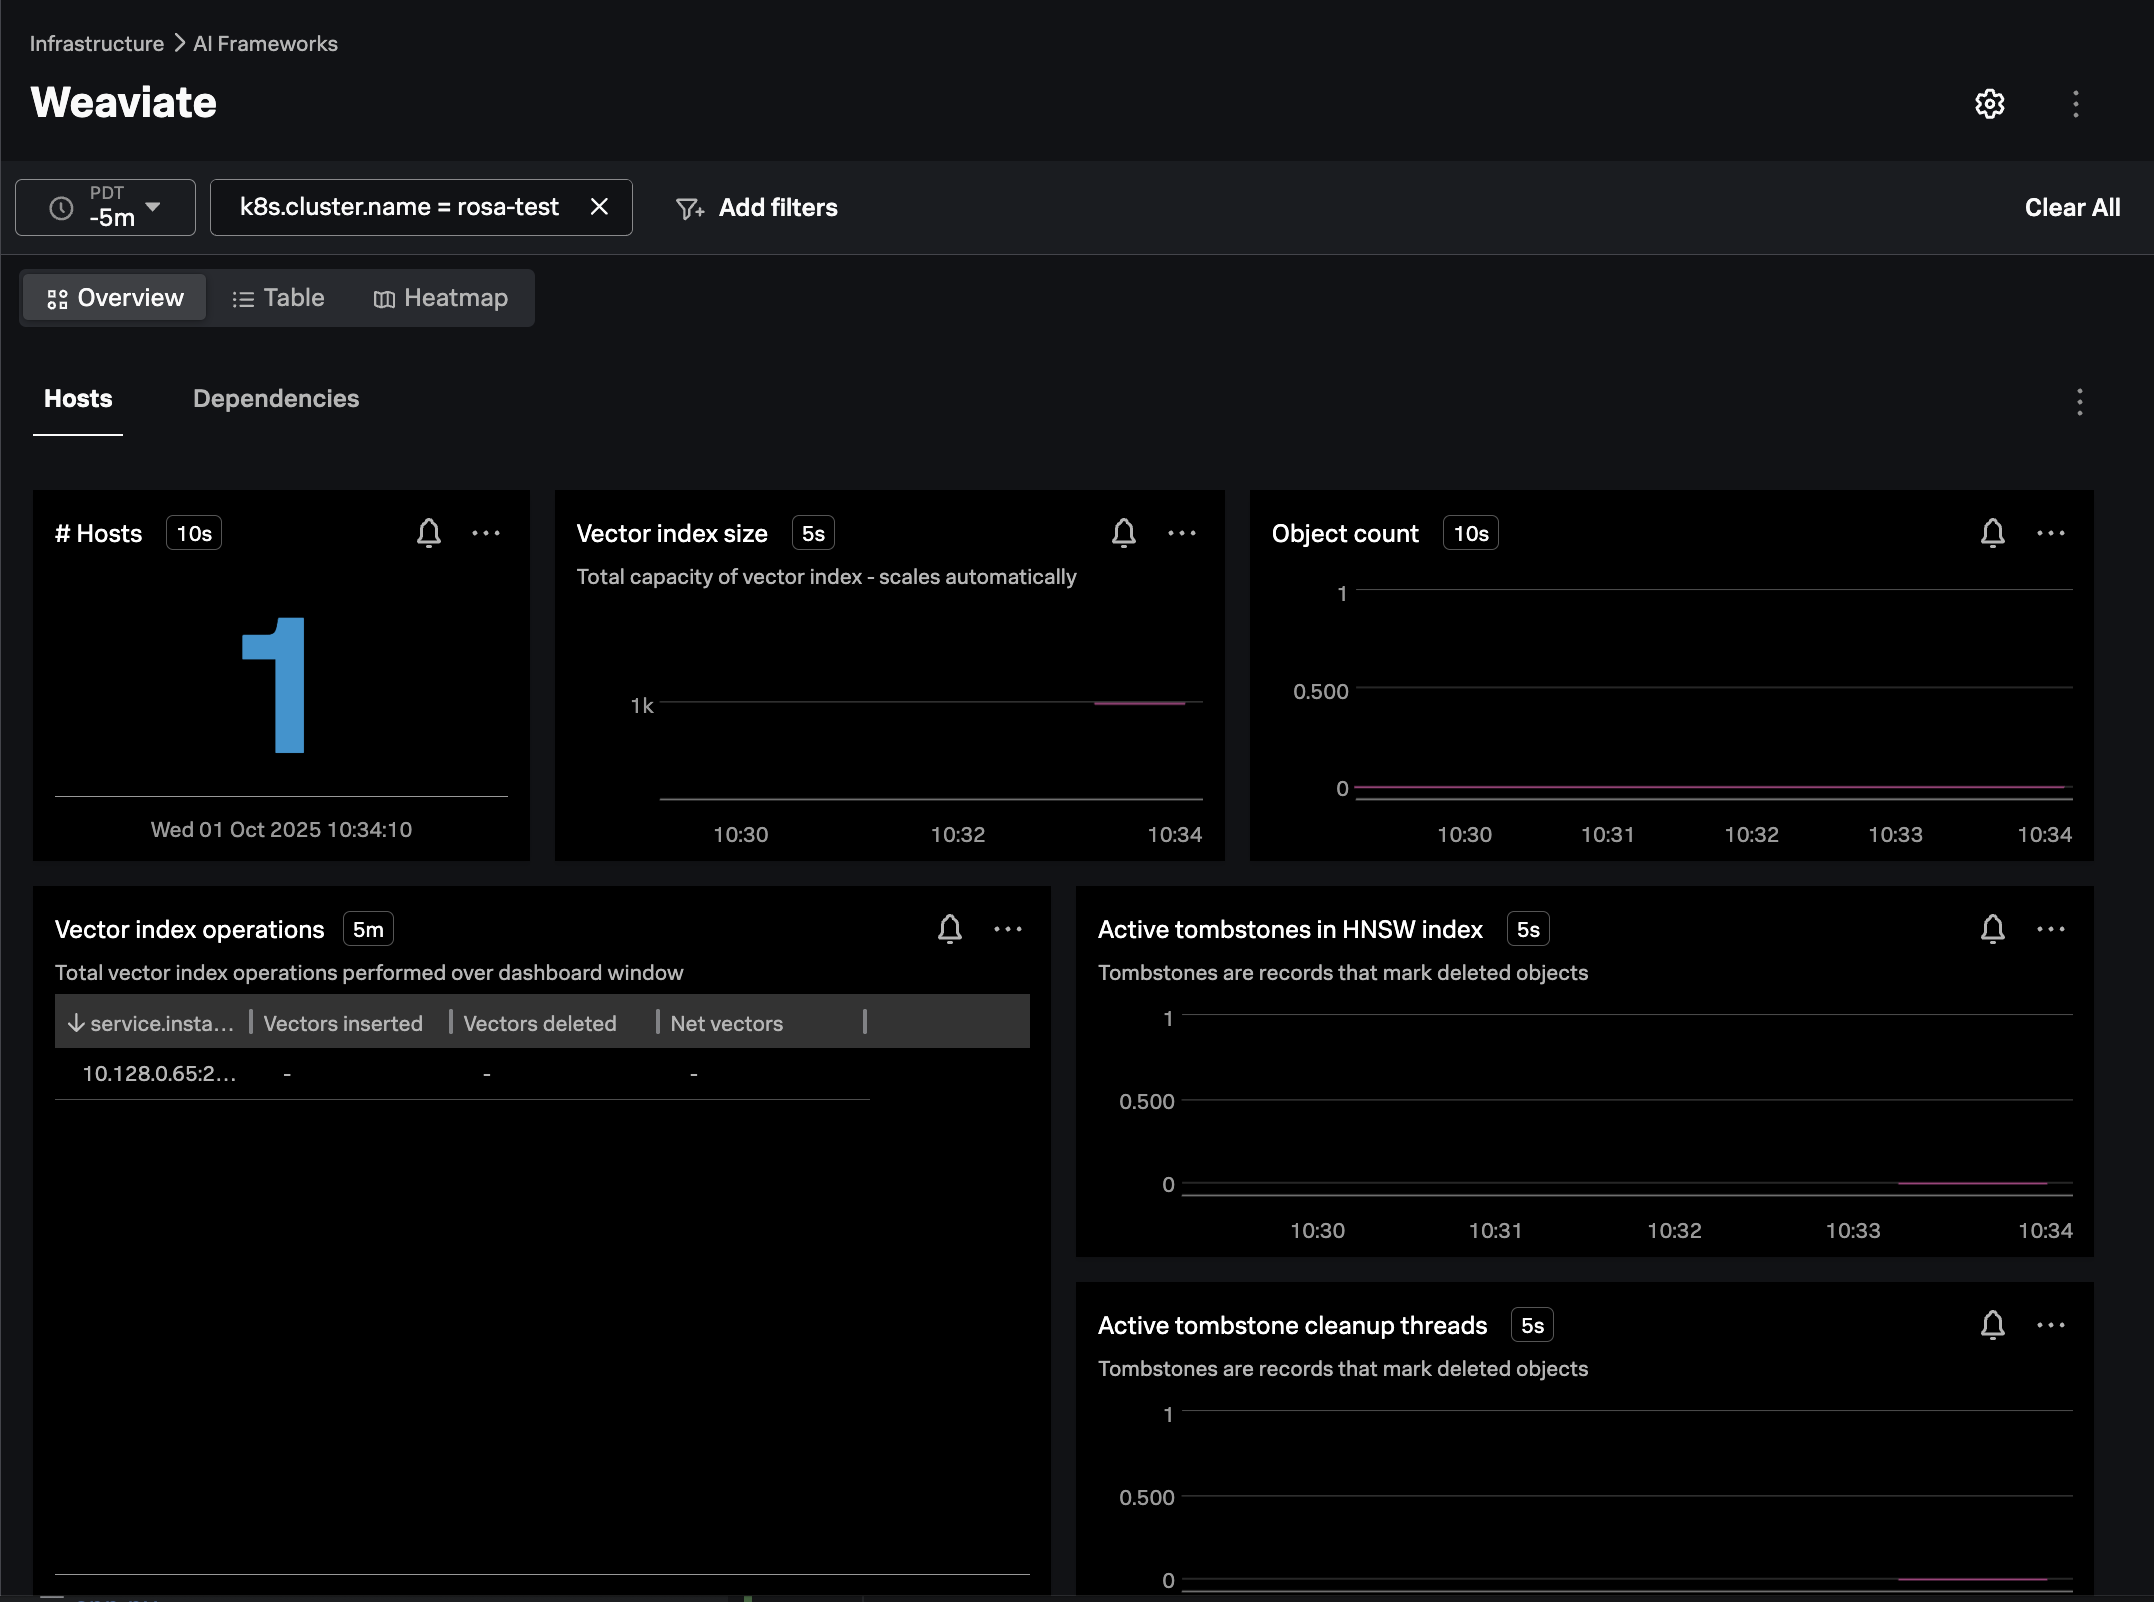
In Splunk Observability Cloud, navigate to Infrastructure -> AI Frameworks -> Weaviate.
Filter on the k8s.cluster.name of interest, and ensure the navigator is populated as in the
following example: