Monitor Storage
10 minutesIn this step, we’ll configure the Prometheus receiver to monitor the storage.
What storage do Cisco AI PODs utilize?
Cisco AI PODs have a number of different storage options, including Pure Storage, VAST, and NetApp.
The workshop will focus on Pure Storage.
How do we capture Pure Storage metrics?
Cisco AI PODs that utilize Pure Storage also use a technology called Portworx, which provides persistent storage for Kubernetes.
Portworx includes a metrics endpoint that we can scrape using the Prometheus receiver.
Capture Storage Metrics with Prometheus
Let’s modify the OpenTelemetry collector configuration to scrape Portworx metrics with the Prometheus receiver.
To do so, let’s add an additional Prometheus receiver creator section
to the otel-collector-values.yaml file:
We’ll need to ensure that Portworx metrics are added to the filter/metrics_to_be_included filter
processor configuration as well:
We’ll need to add a new metrics pipeline for Portworx metrics as well:
Before applying the configuration changes to the collector, take a moment to compare the
contents of your modified otel-collector-values.yaml file with the
otel-collector-values-with-portworx.yaml file.
Update your file as needed to ensure the contents match. Remember that indentation is important
for yaml files, and needs to be precise.
Now we can update the OpenTelemetry collector configuration by running the following Helm command:
Confirm Metrics are Sent to Splunk
Navigate to Dashboards in Splunk Observability Cloud, then search for the
Cisco AI PODs Dashboard, which is included in the Built-in dashboard groups.
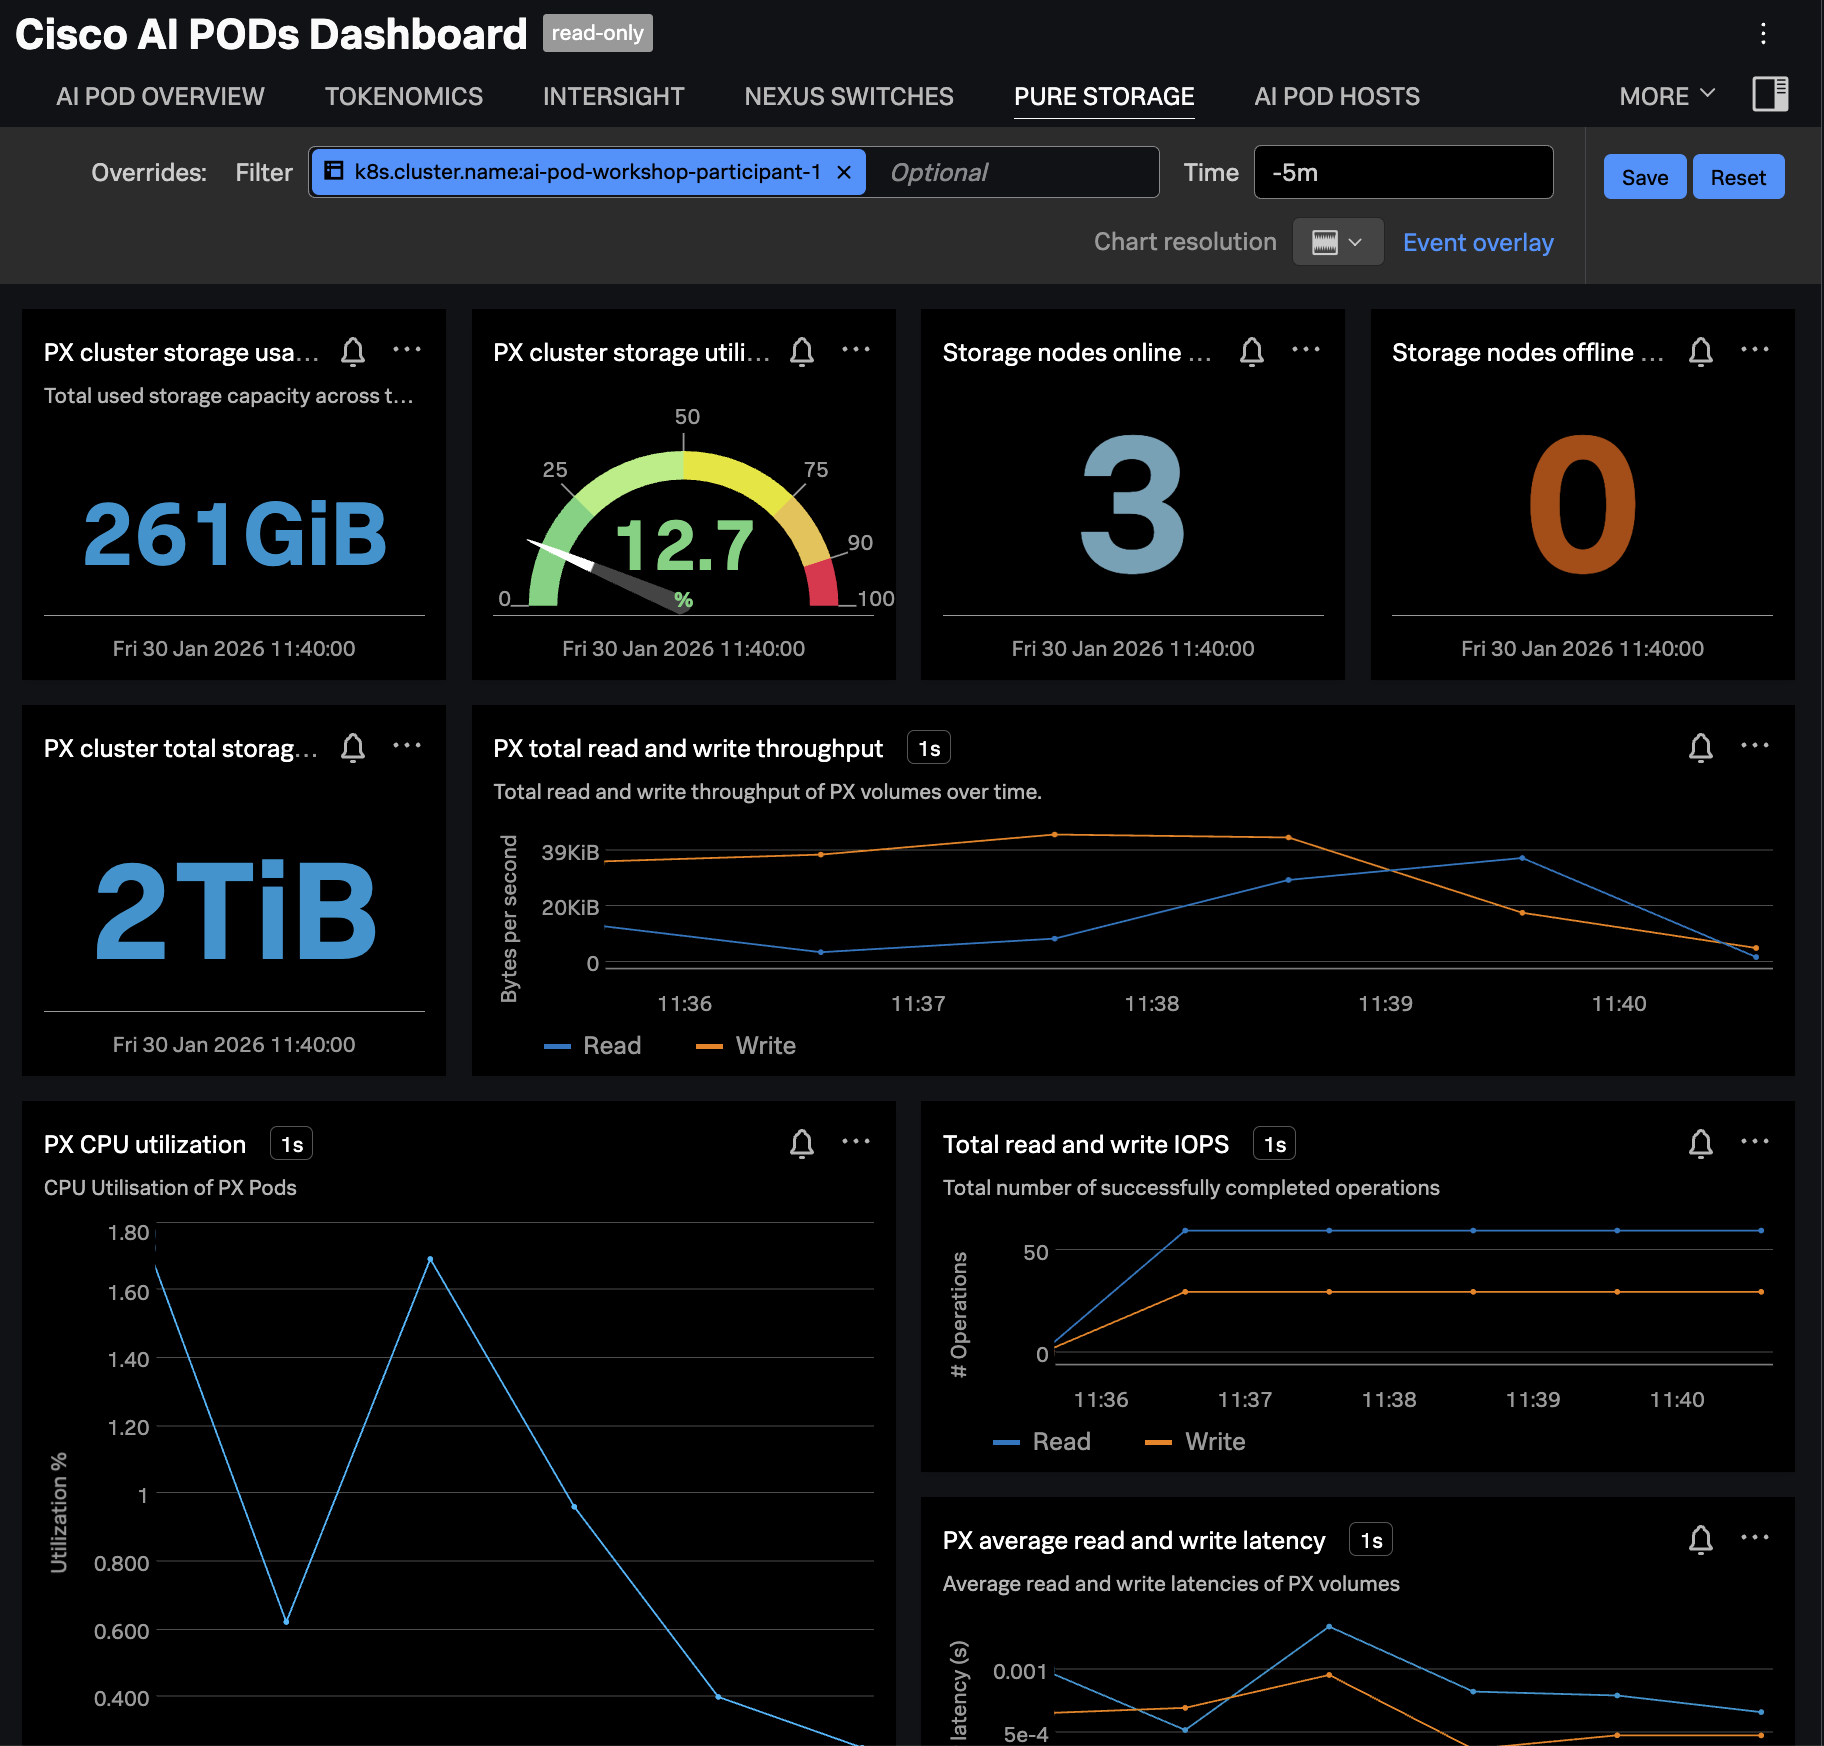
Navigate to the PURE STORAGE tab and ensure the dashboard is filtered
on your OpenShift cluster name. The charts should be populated as in the
following example: