Deploy the LLM Application
10 minutesIn the final step of the workshop, we’ll deploy an application to our OpenShift cluster that uses the instruct and embeddings models that we deployed earlier using the NVIDIA NIM operator.
Application Overview
Like most applications that interact with LLMs, our application is written in Python. It also uses LangChain, which is an open-source orchestration framework that simplifies the development of applications powered by LLMs.
Our application starts by connecting to two LLMs that we’ll be using:
meta/llama-3.2-1b-instruct: used for responding to user promptsnvidia/llama-3.2-nv-embedqa-1b-v2: used to calculate embeddings
The URL’s used for both LLMs are defined in the k8s-manifest.yaml file:
The application then defines a prompt template that will be used in interactions with the LLM:
Note how we’re explicitly instructing the LLM to just say it doesn’t know the answer if it doesn’t know, which helps minimize hallucinations. There’s also a placeholder for us to provide context that the LLM can use to answer the question.
The application uses Flask, and defines a single endpoint named /askquestion to
respond to questions from end users. To implement this endpoint, the application
connects to the Weaviate vector database, and then invokes a chain (using LangChain)
that takes the user’s question, converts it to an embedding, and then looks up similar
documents in the vector database. It then sends the user’s question to the LLM, along
with the related documents, and returns the LLM’s response.
Instrument the Application with OpenTelemetry
To capture metrics, traces, and logs from our application, we’ve instrumented it with OpenTelemetry.
This required adding the following package to the requirements.txt file (which ultimately gets
installed with pip install):
We also added the following to the Dockerfile used to build the
container image for this application, to install additional OpenTelemetry
instrumentation packages:
Then we modified the ENTRYPOINT in the Dockerfile to call opentelemetry-instrument
when running the application:
Finally, to enhance the traces and metrics collected with OpenTelemetry from this LangChain application, we added additional Splunk instrumentation packages:
Deploy the LLM Application
Use the following command to deploy this application to the OpenShift cluster:
Note: to build a Docker image for this Python application, we executed the following commands:
Test the LLM Application
Let’s ensure the application is working as expected.
Start a pod that has access to the curl command:
Then run the following command to send a question to the LLM:
View Trace Data in Splunk Observability Cloud
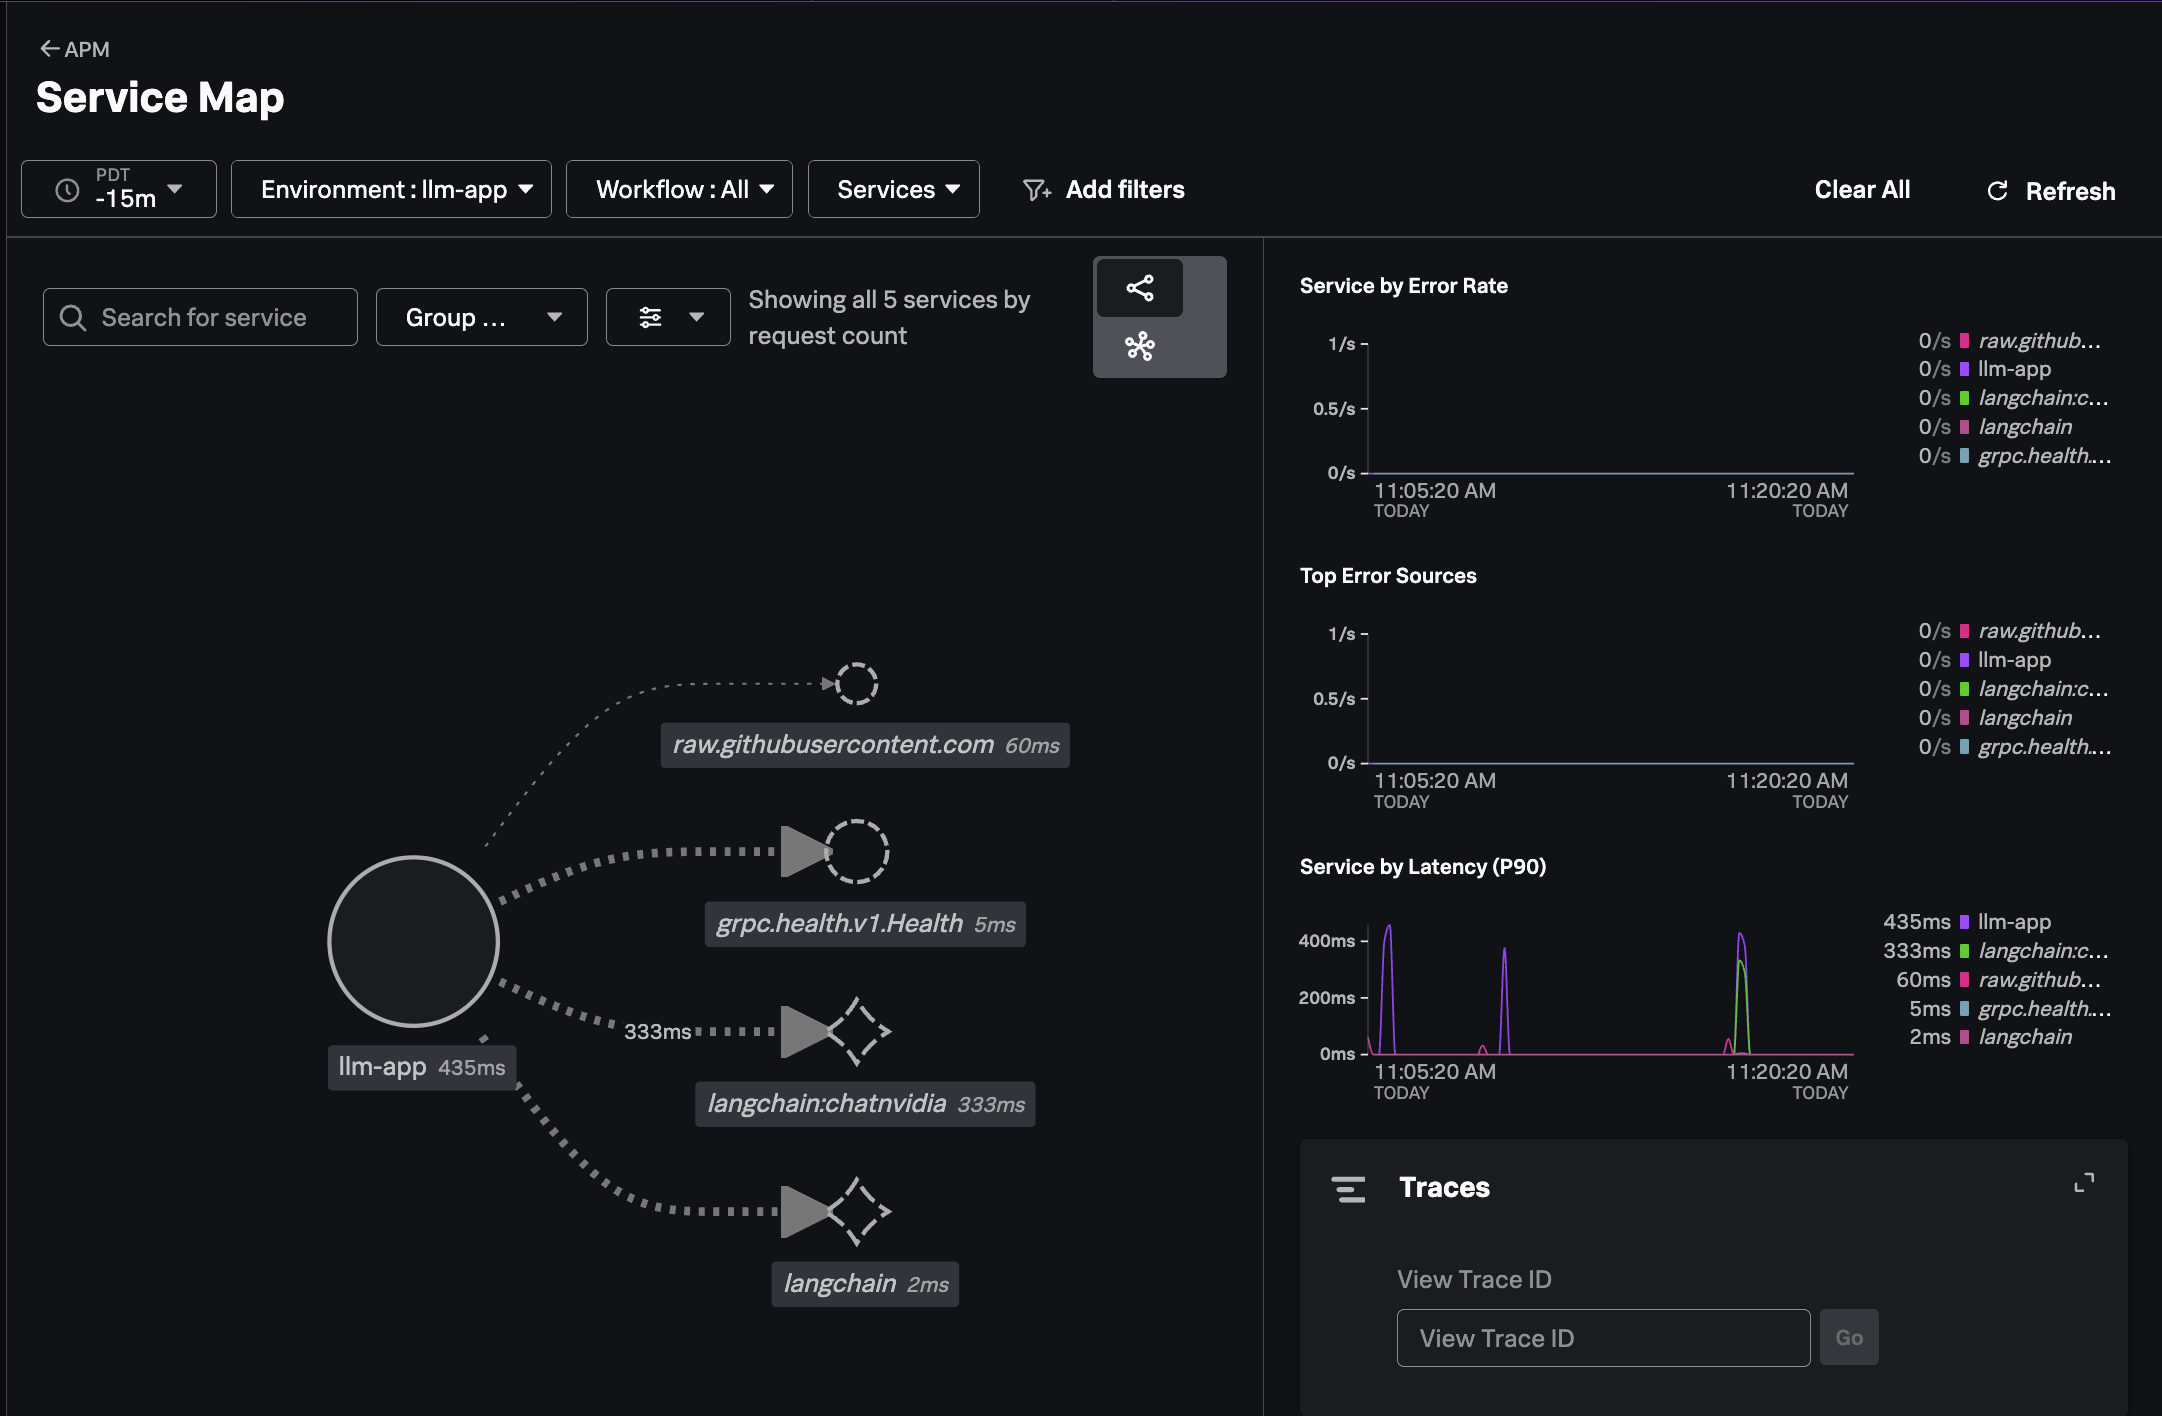
In Splunk Observability Cloud, navigate to APM and then select Service Map.
Ensure your environment name is selected (e.g. ai-pod-workshop-participant-1).
You should see a service map that looks like the following:
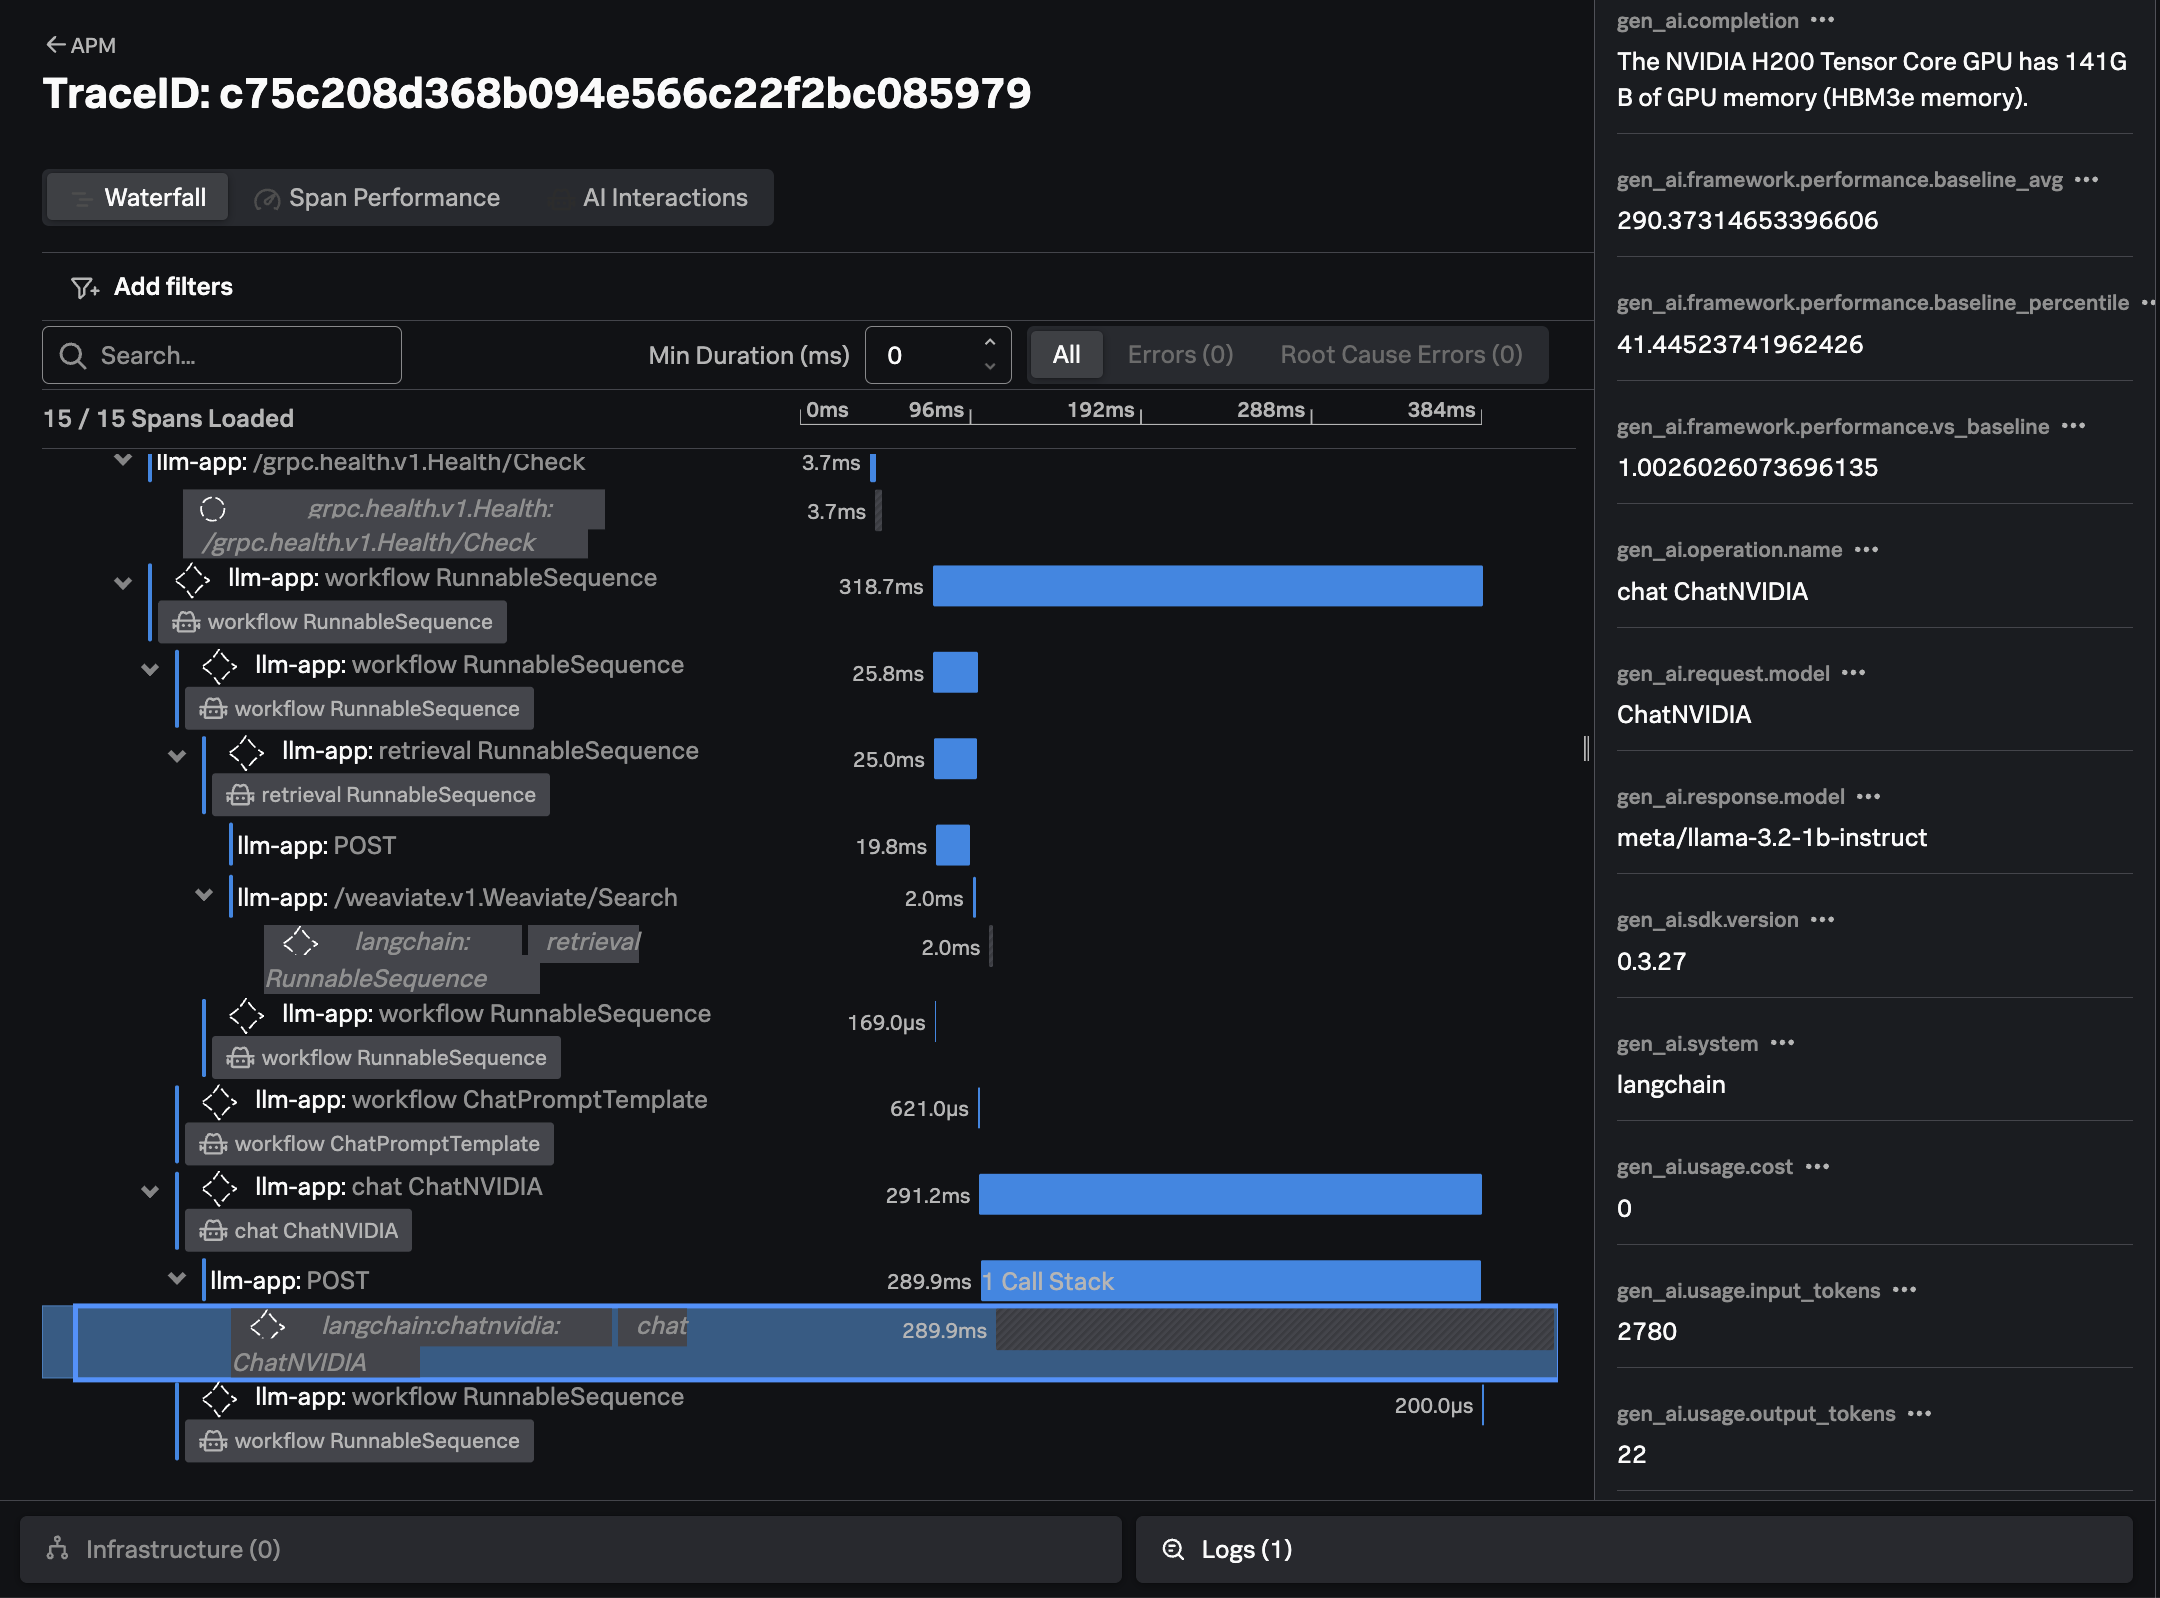
Click on Traces on the right-hand side menu. Then select one of the slower running
traces. It should look like the following example:
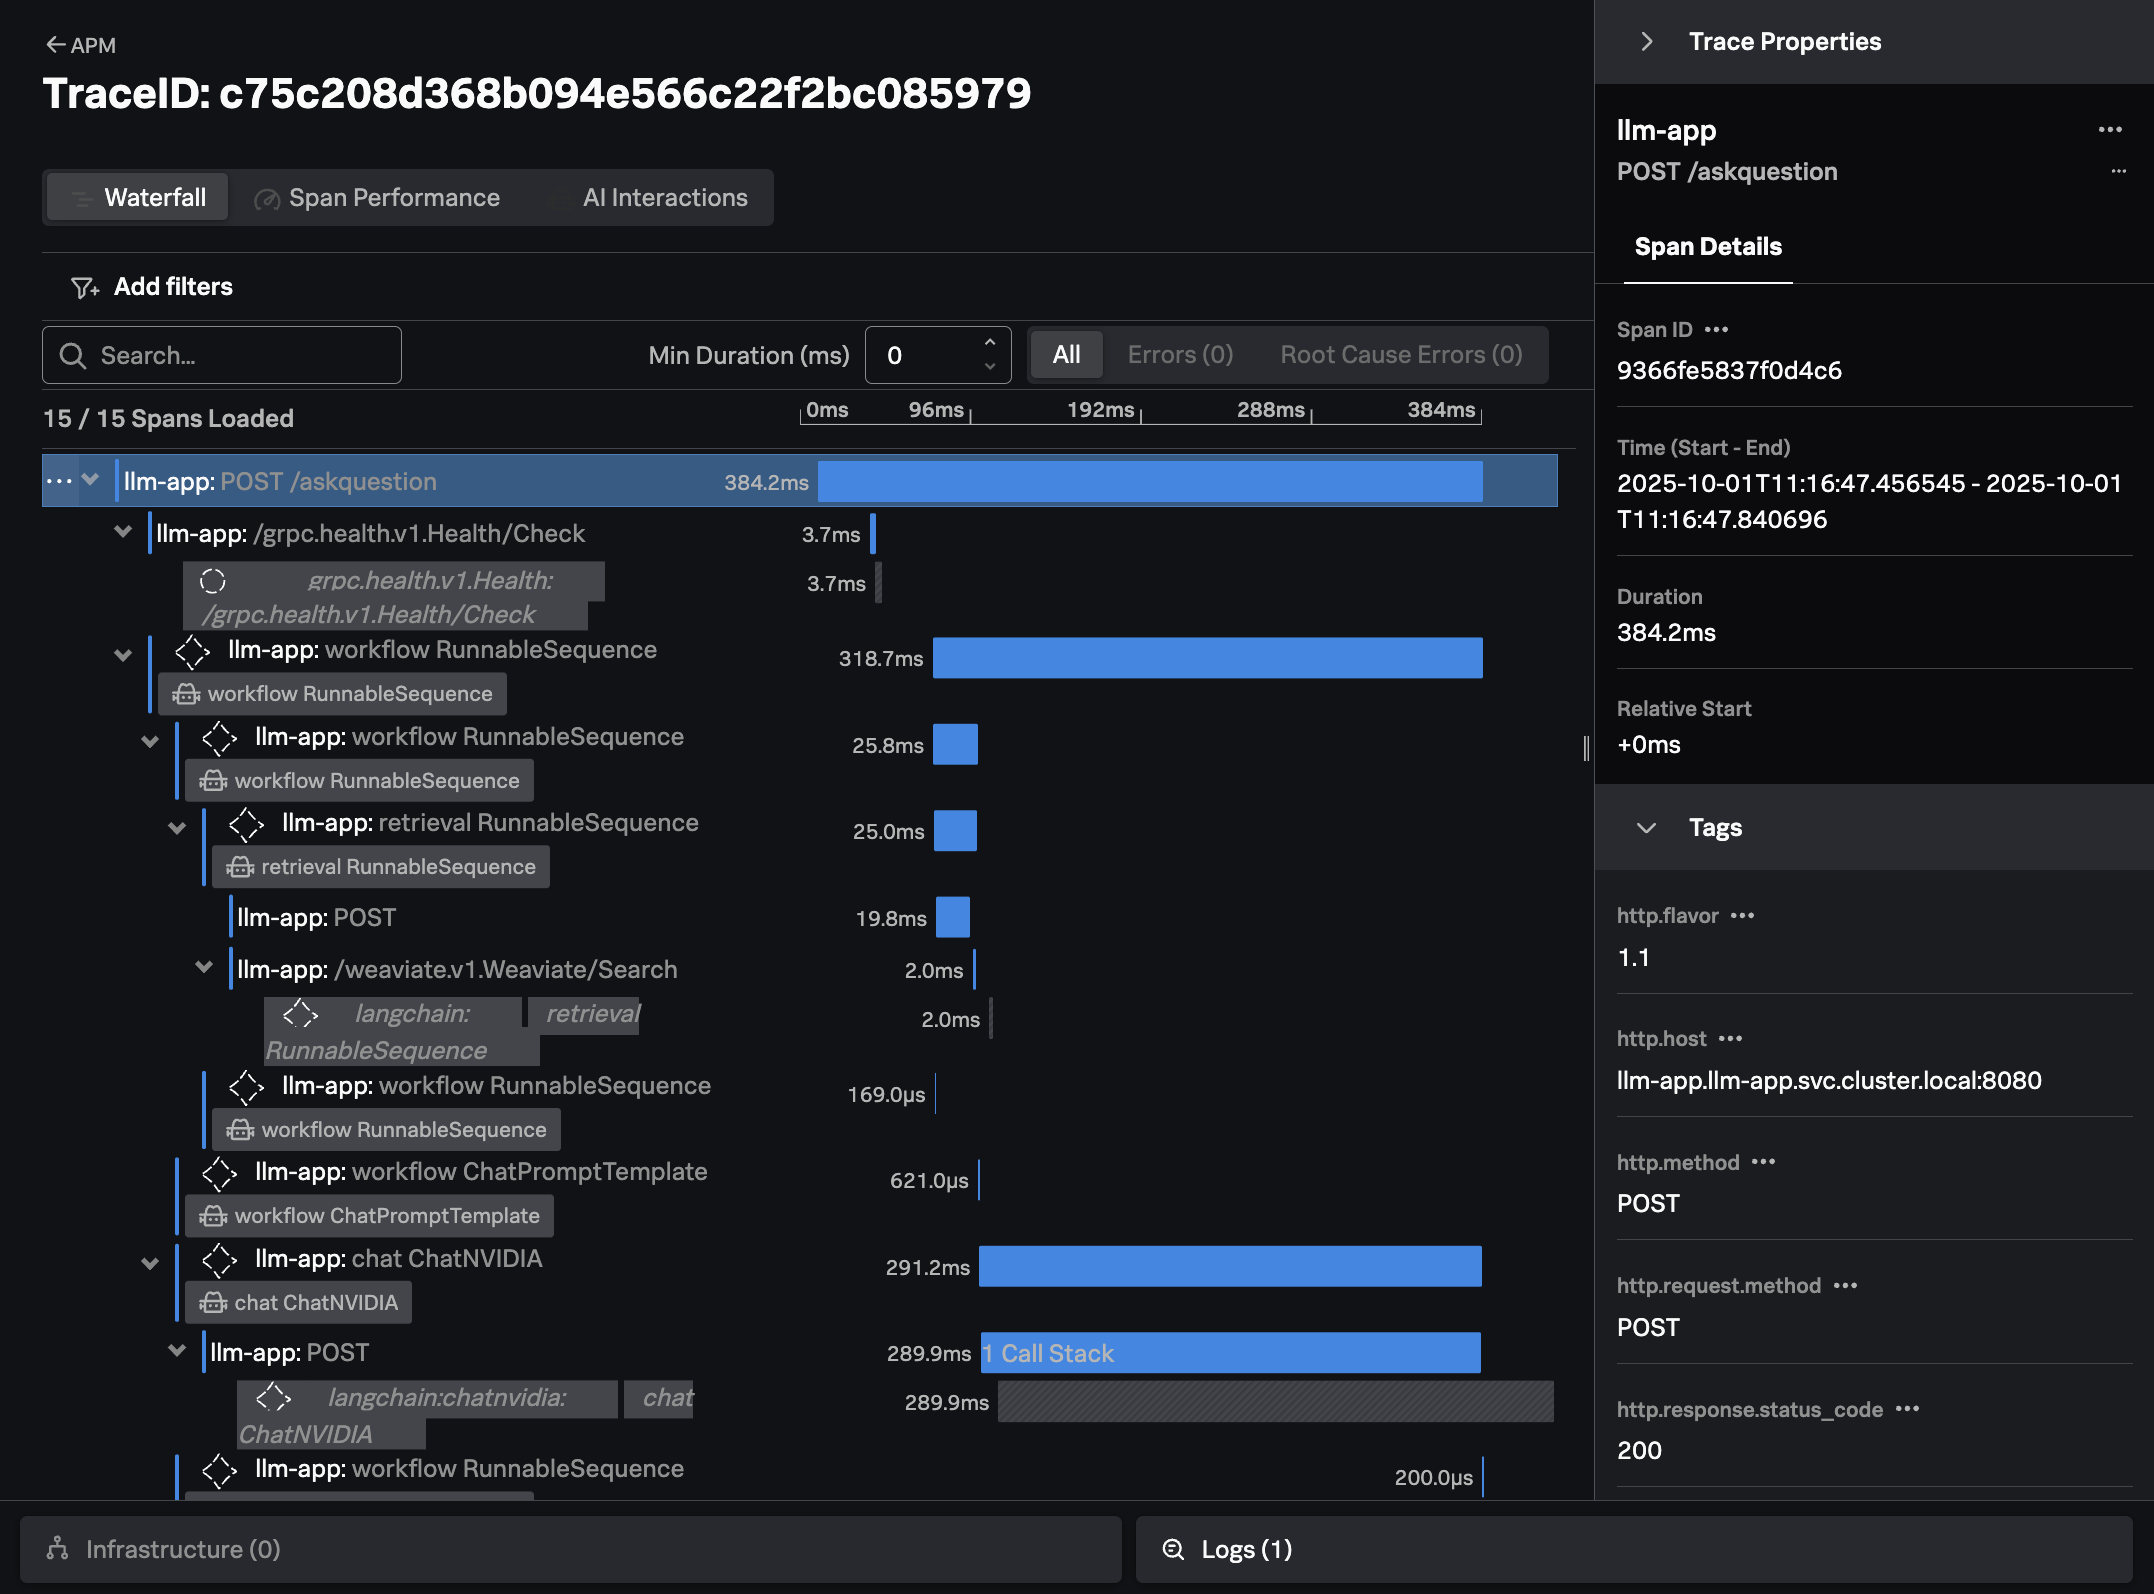
The trace shows all the interactions that our application executed to return an answer to the users question (i.e. “How much memory does the NVIDIA H200 have?”)
For example, we can see where our application performed a similarity search to look for documents related to the question at hand in the Weaviate vector database.
We can also see how the application created a prompt to send to the LLM, including the context that was retrieved from the vector database:
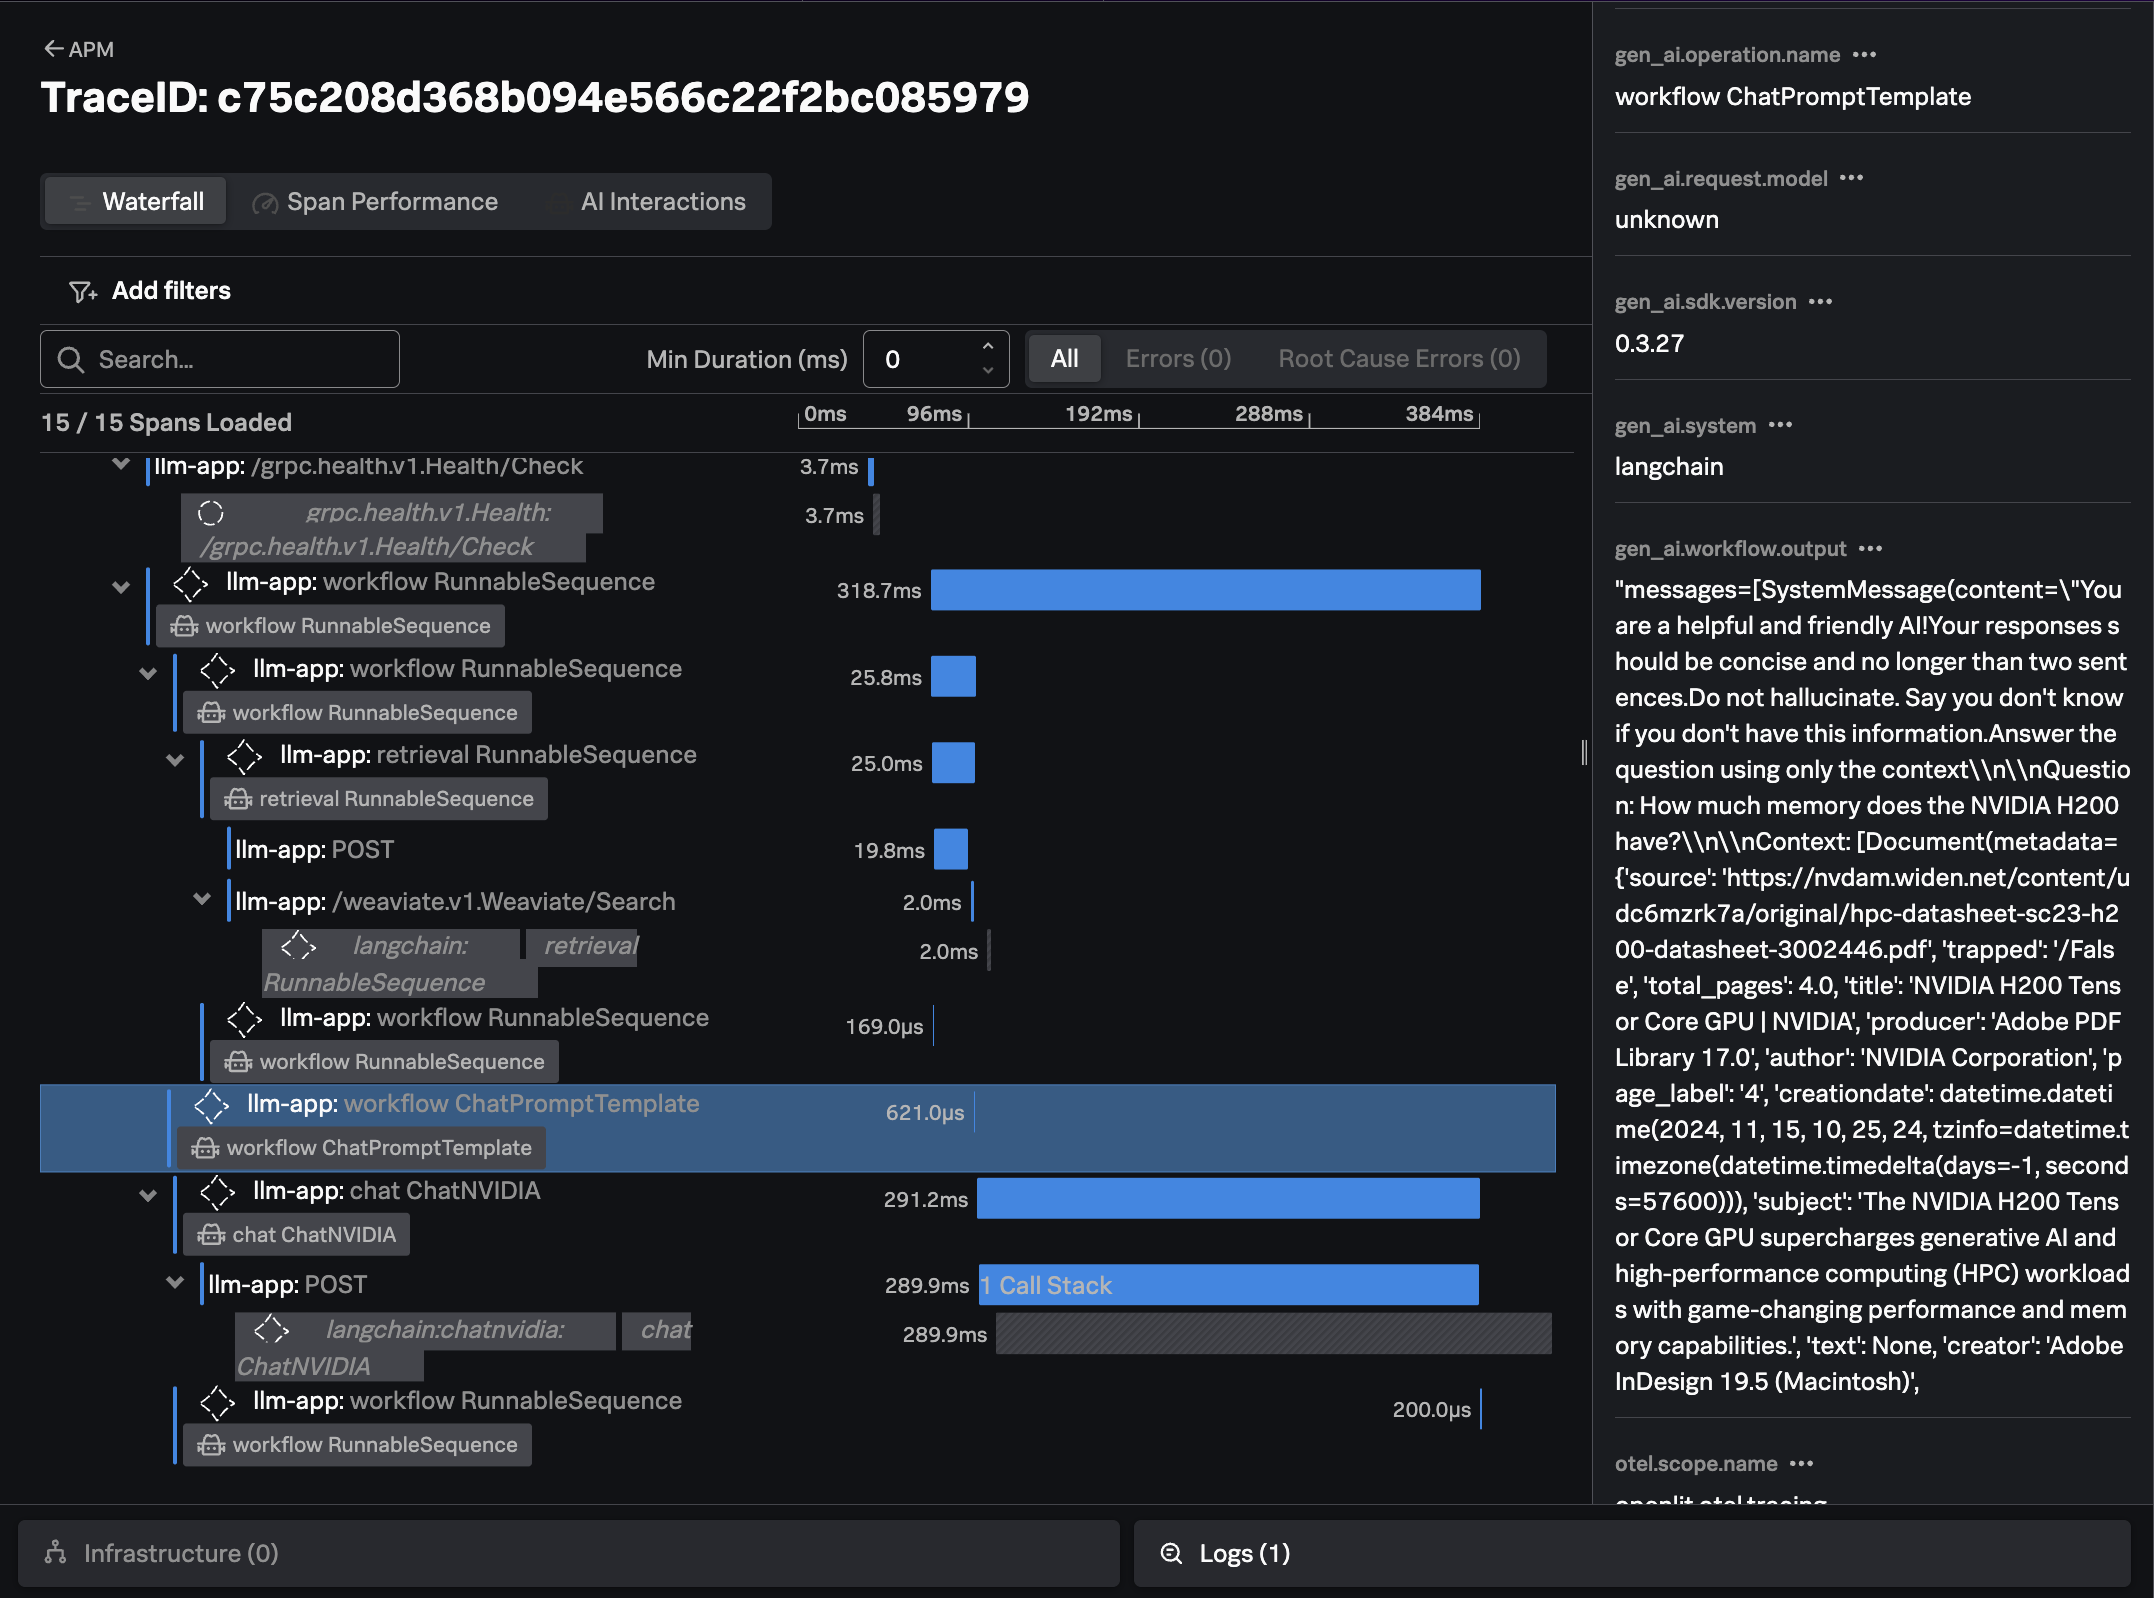
Finally, we can see the response from the LLM, the time it took, and the number of input and output tokens utilized:
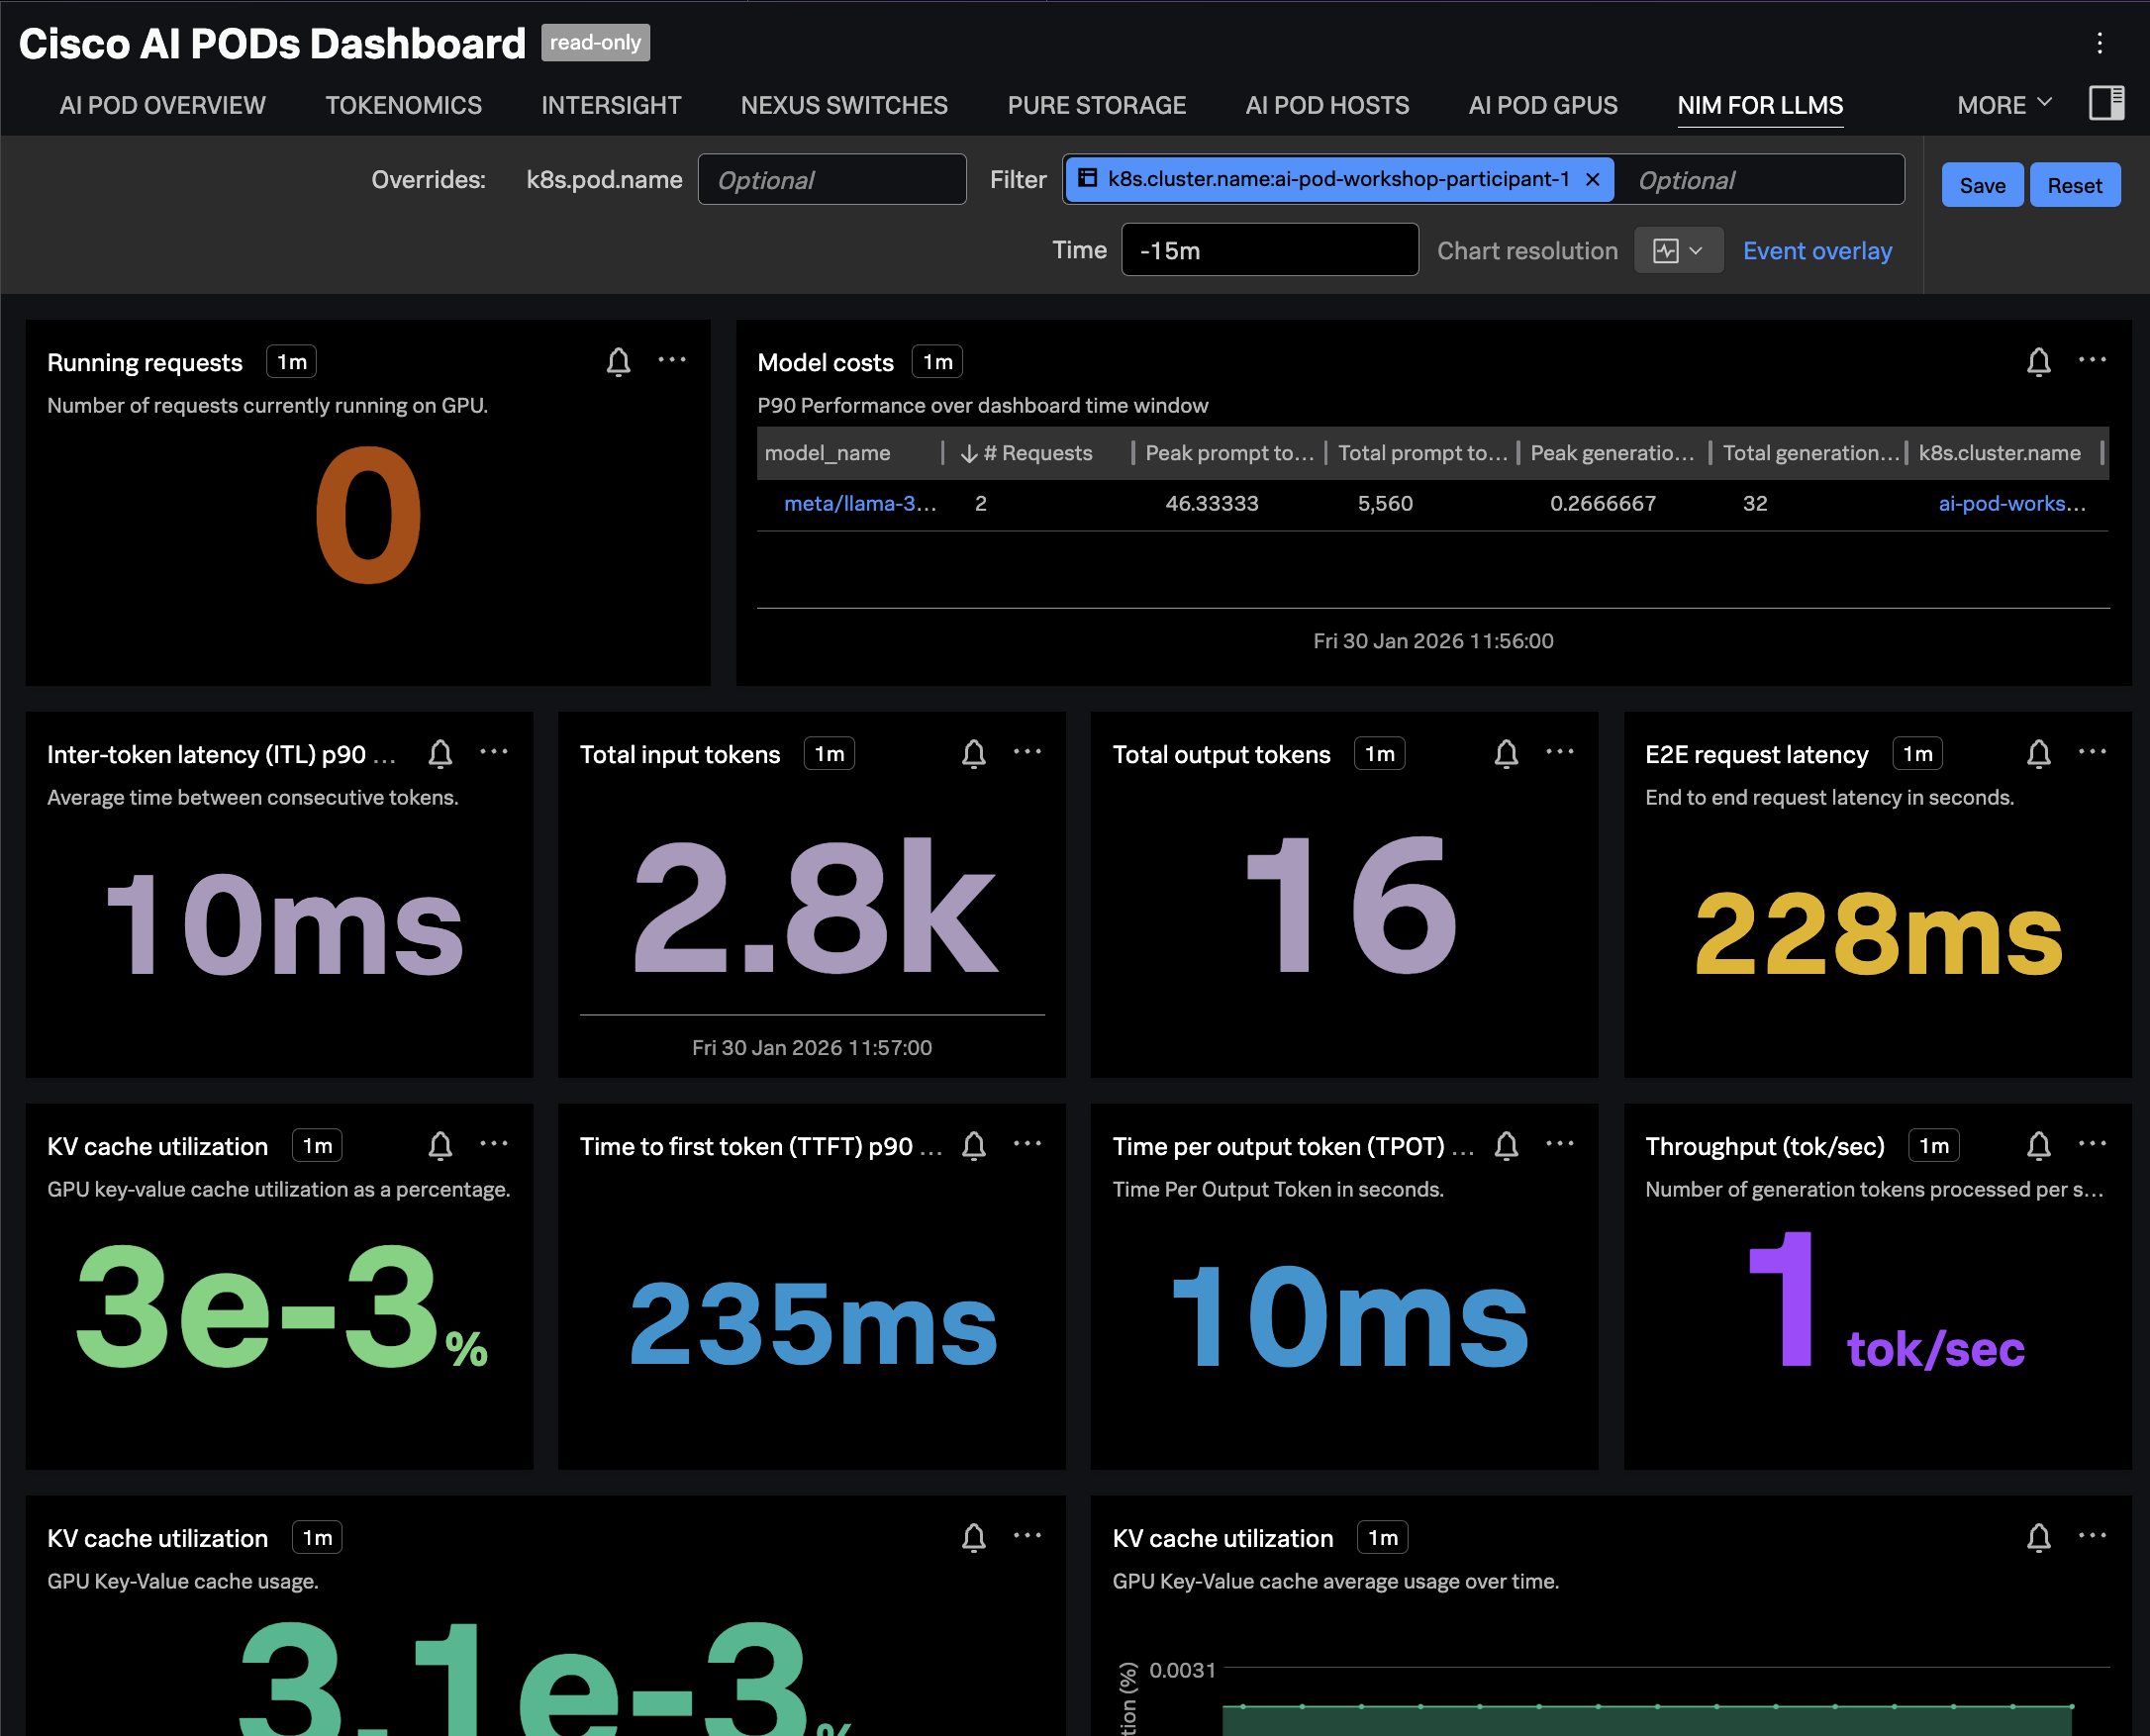
Confirm Metrics are Sent to Splunk
Navigate to Dashboards in Splunk Observability Cloud, then search for the
Cisco AI PODs Dashboard, which is included in the Built-in dashboard groups.
Navigate to the NIM FOR LLMS tab and ensure the dashboard is filtered
on your OpenShift cluster name. The charts should be populated as in the
following example: