In this Lab you learn how to use AppDynamics to monitor the health of your application services. You will need to complete this lab first before you start the other labs in this Workshop.
When you have completed this lab, you will be able to:
Download the AppDynamics Java APM Agent.
Install the AppDynamics Java APM Agent.
Initialize the sample application with load.
Understand the core concepts of AppDynamics APM
Configure collection settings in the Controller.
Monitor your application’s health.
Troubleshoot application performance issues to find root cause.
Monitor alerts in AppDynamic’s monitoring service based off of data captured by AppDynamics.
Workshop Environment
The workshop environment has two hosts:
The first host runs the AppDynamics Controller and will be referred to from this point on as the Controller.
The second host runs the Supercar Trader application used in the labs. It will be the host where you will install the AppDynamics agents and will be referred to from this point on as the Application VM.
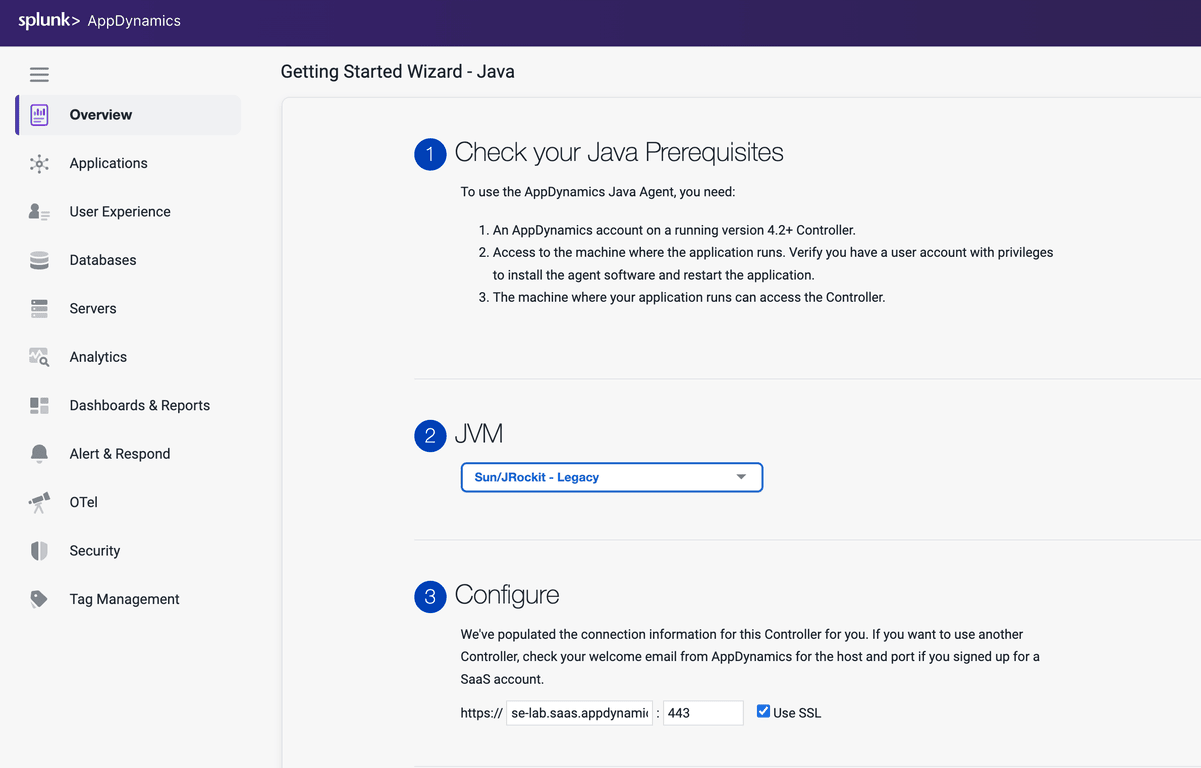
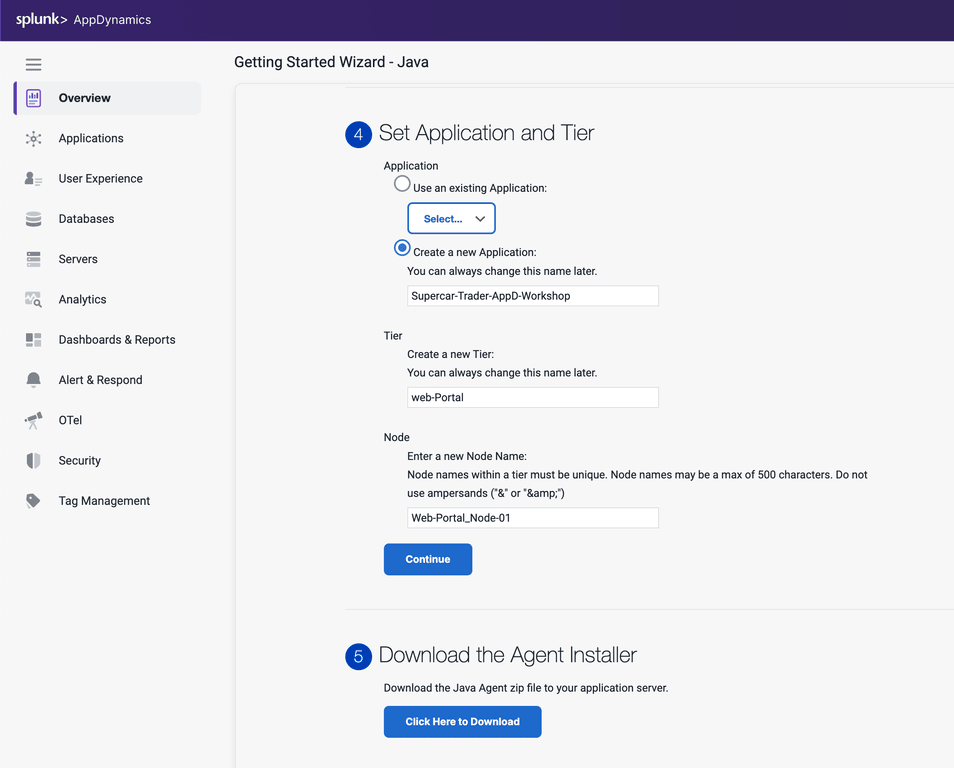
Under Set Application and Tier, select Create a new Application:
Enter Supercar-Trader-YOURINITIALS as the application name.
Enter Web Portal for the new Tier
Enter Web-Portal_Node-01 for the Node Name
Click Continue
Click Click Here to Download.
Warning
The application name must be unique, make sure to append your initials or add a unique identifier to the application name
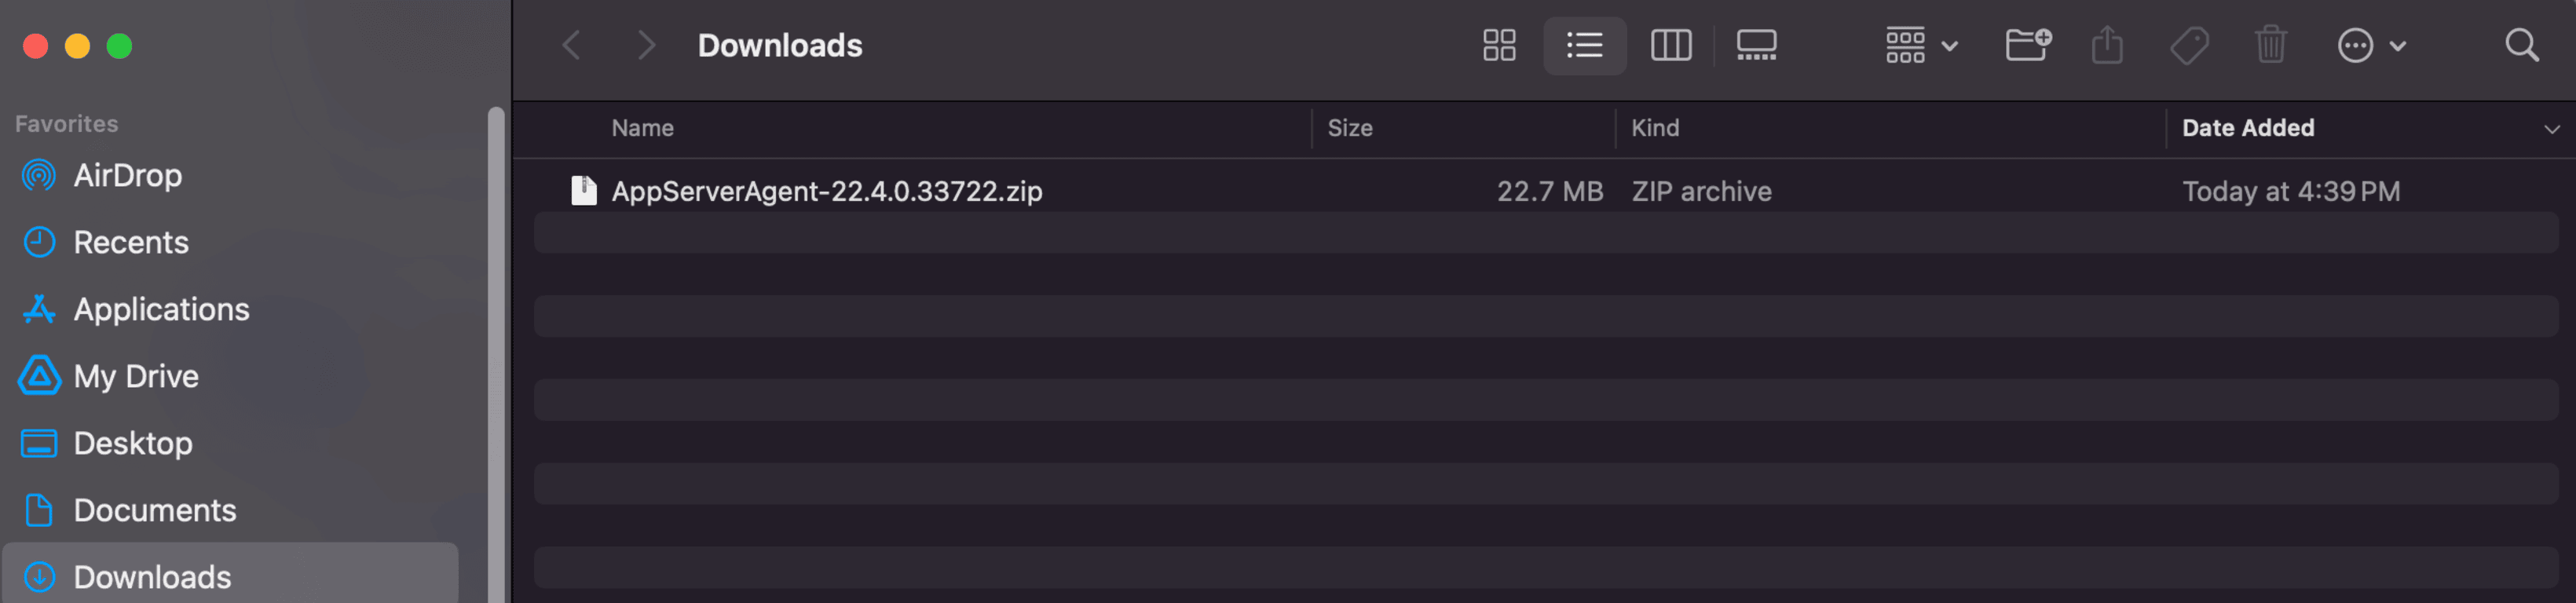
Your browser should prompt you that the agent is being downloaded to your local file system. Make sure to take note of where the file was downloaded to and the full name of it.
2. Install the Java Agent
In this exercise you will perform the following actions:
Upload the Java agent file to your EC2 instance
Unzip the file into a specific directory
Update the Java agents XML configuration file (optional)
Modify the Apache Tomcat startup script to add the Java agent
Upload Java Agent to Application VM
By this point you should have received the information regarding the EC2 instance that you will be using for this workshop. Ensure you have the IP address of your EC2 instance, username and password required to ssh into the instance .
On your local machine, open a terminal window and change into the directory where the java agent file was downloaded to. Upload the file into the EC2 instance using the following command. This may take some time to complete.
Update the IP address or public DNS for your instance.
Update the filename to match your exact version.
cd ~/Downloads
scp -P 2222 AppServerAgent-22.4.0.33722.zip splunk@i-0b6e3c9790292be66.splunk.show:/home/splunk
cd /opt/appdynamics
mkdir javaagent
cp /home/splunk/AppServerAgent-*.zip /opt/appdynamics/javaagent
cd /opt/appdynamics/javaagent
unzip AppServerAgent-*.zip
Tip
We pre-configured the Java agent using the Controller’s Getting Started Wizard. If you download the agent from the AppDynamics Portal, you will need to manually update the Java agent’s XML configuration file.
There are three primary ways to set the configuration properties of the Java agent. These take precedence in the following order:
System environment variables.
JVM properties passed on the command line.
Properties within the controller-info.xml file.
Add the Java Agent to the Tomcat Server
First we want to make sure that the Tomcat server is not running
cd /usr/local/apache/apache-tomcat-9/bin
./shutdown.sh
We will now modify the catalina script to set an environment variable with the java agent.
cd /usr/local/apache/apache-tomcat-9/bin
nano catalina.sh
Add the following line at 125 (after the initial comments) & save the file
In this exercise you will perform the following actions:
Verify the sample app is running.
Start the load generation for the sample application.
Confirm the transaction load in the Controller.
Verify that the Sample Application is Running
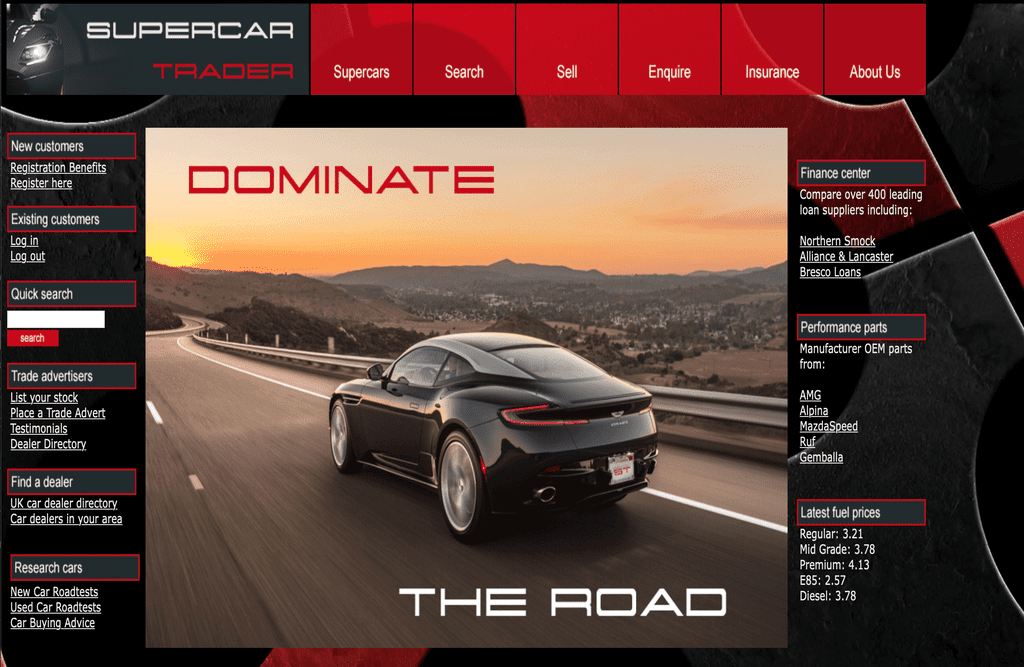
The sample application home page is accessible through your web browser with a URL in the format seen below. Enter that URL in your browser’s navigation bar, substituting the IP Address of your EC2 instance.
You should be able to see the home page of the Supercar Trader application.
Start the Load Generation
SSH into your ec2 instance and start the load generation. It may take a few minutes for all the scripts to run.
cd /opt/appdynamics/lab-artifacts/phantomjs
./start_load.sh
Cleaning up artifacts from previous load...
Starting home-init-01
Waiting for additional JVMs to initialize... 1Waiting for additional JVMs to initialize... 2Waiting for additional JVMs to initialize... 3Waiting for additional JVMs to initialize... 4Waiting for additional JVMs to initialize... 5Waiting for additional JVMs to initialize... 6Waiting for additional JVMs to initialize... 7Waiting for additional JVMs to initialize... 8Waiting for additional JVMs to initialize... 9Waiting for additional JVMs to initialize... 10Waiting for additional JVMs to initialize... 11Waiting for additional JVMs to initialize... 12Waiting for additional JVMs to initialize... 13Waiting for additional JVMs to initialize... 14Waiting for additional JVMs to initialize... 15Waiting for additional JVMs to initialize... 16Waiting for additional JVMs to initialize... 17Waiting for additional JVMs to initialize... 18Waiting for additional JVMs to initialize... 19Waiting for additional JVMs to initialize... 20Starting slow-query-01
Starting slow-query-02
Starting slow-query-03
Starting slow-query-04
Starting sessions-01
Starting sessions-02
Starting sell-car-01
Starting sell-car-02
Starting sessions-03
Starting sessions-04
Starting search-01
Starting request-error-01
Starting mem-leak-insurance
Finished starting load generator scripts 100% 22MB 255.5KB/s 01:26
Confirm transaction load in the Controller
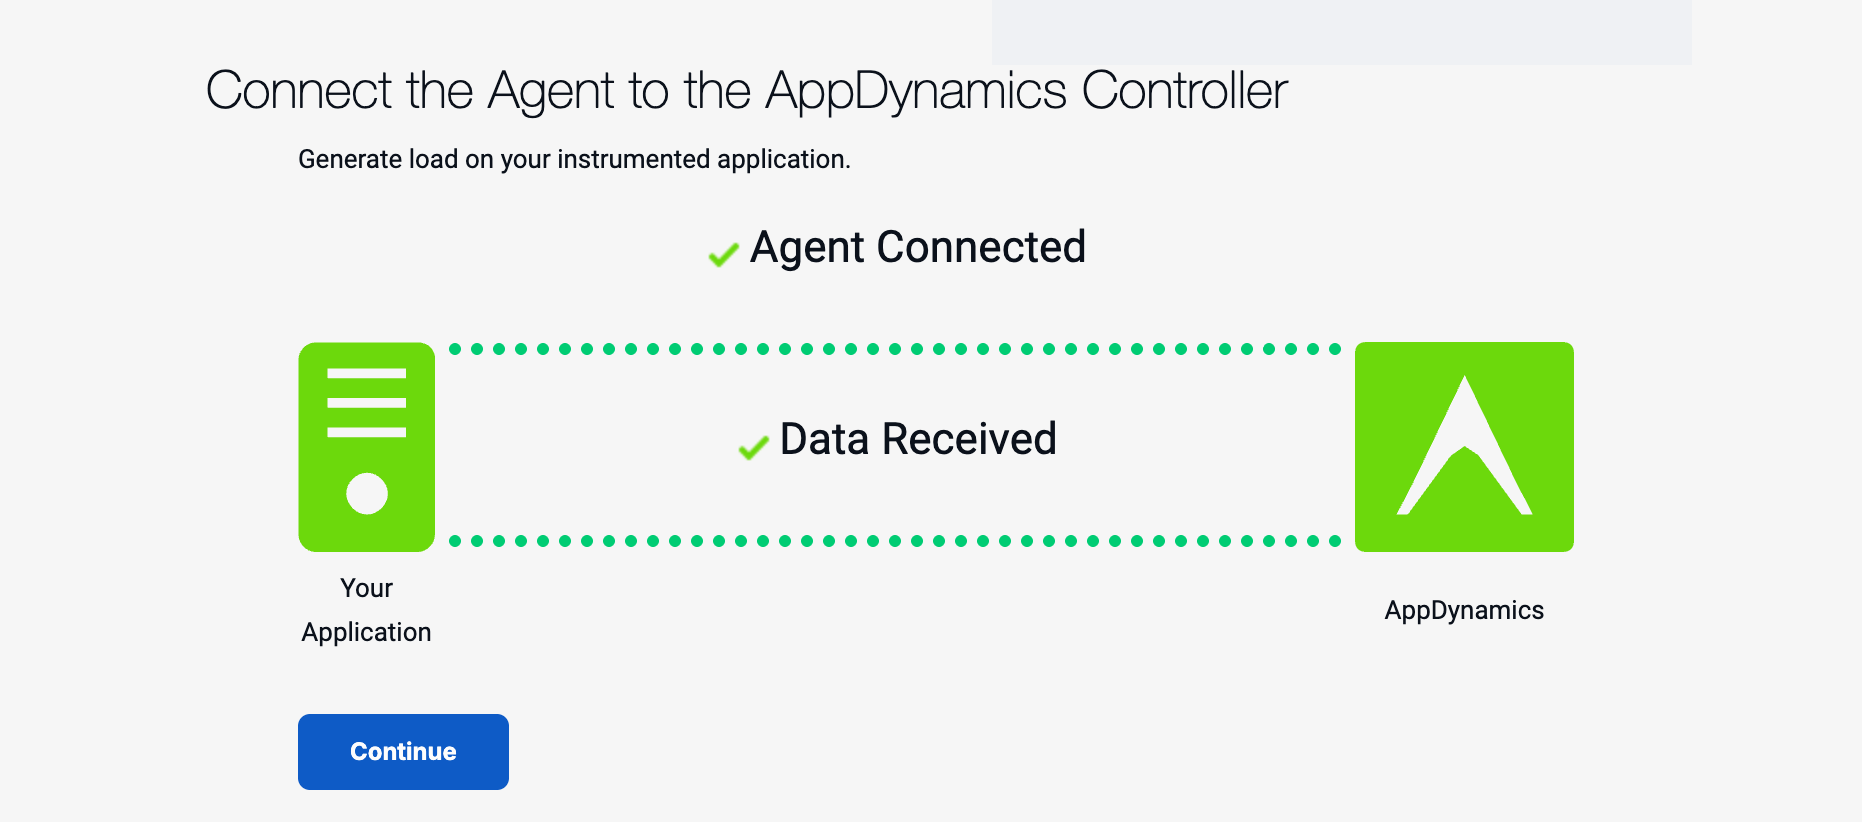
If you still have the Getting Started Wizard open in your web browser, you should see that the agent is now connected and that the Controller is receiving data.
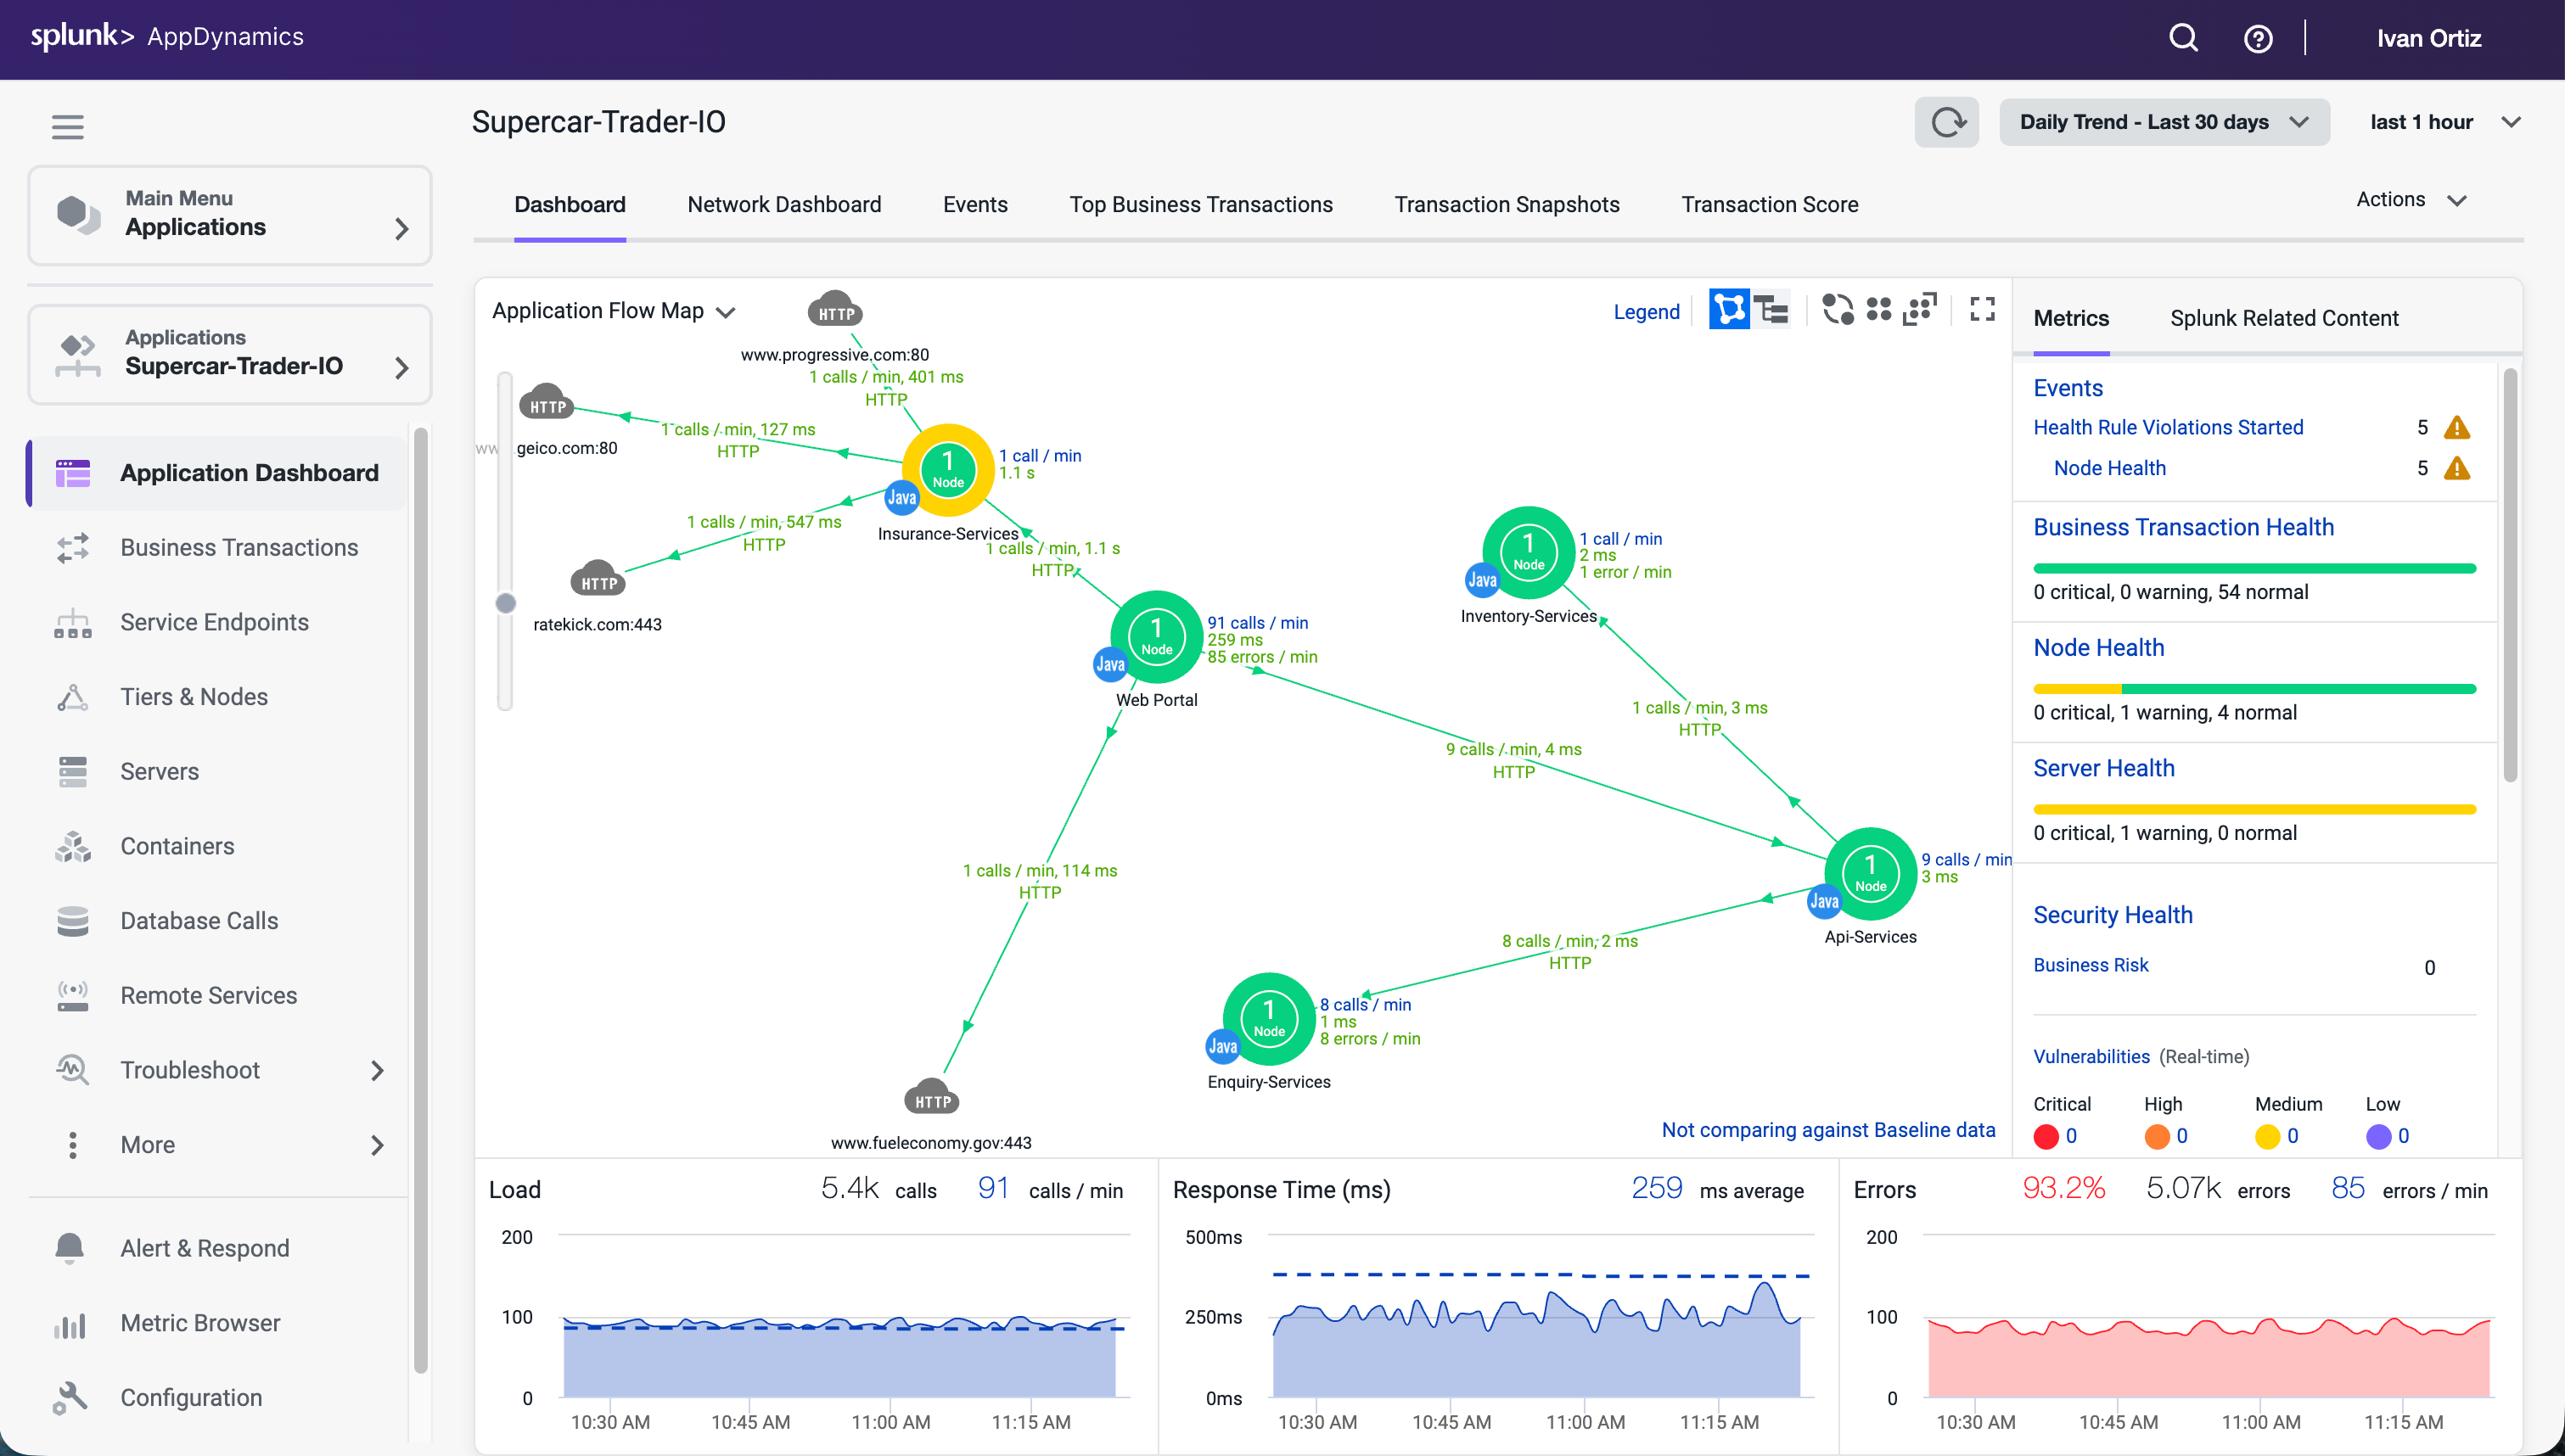
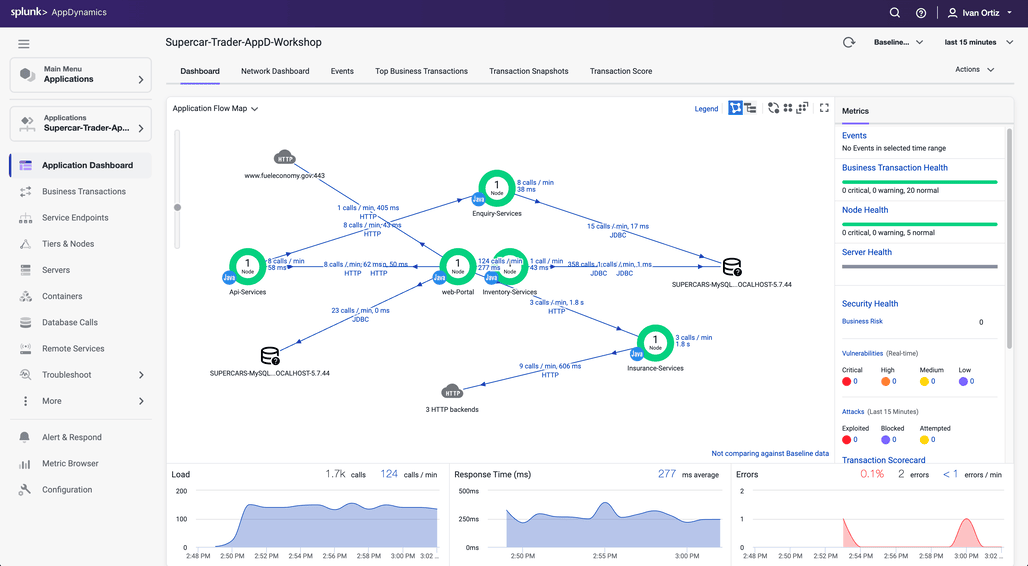
Click Continue and you will be taken to the Application Flow Map (you can jump to the Flow Map image below).
If you previously closed the Controller browser window, log back into the Controller.
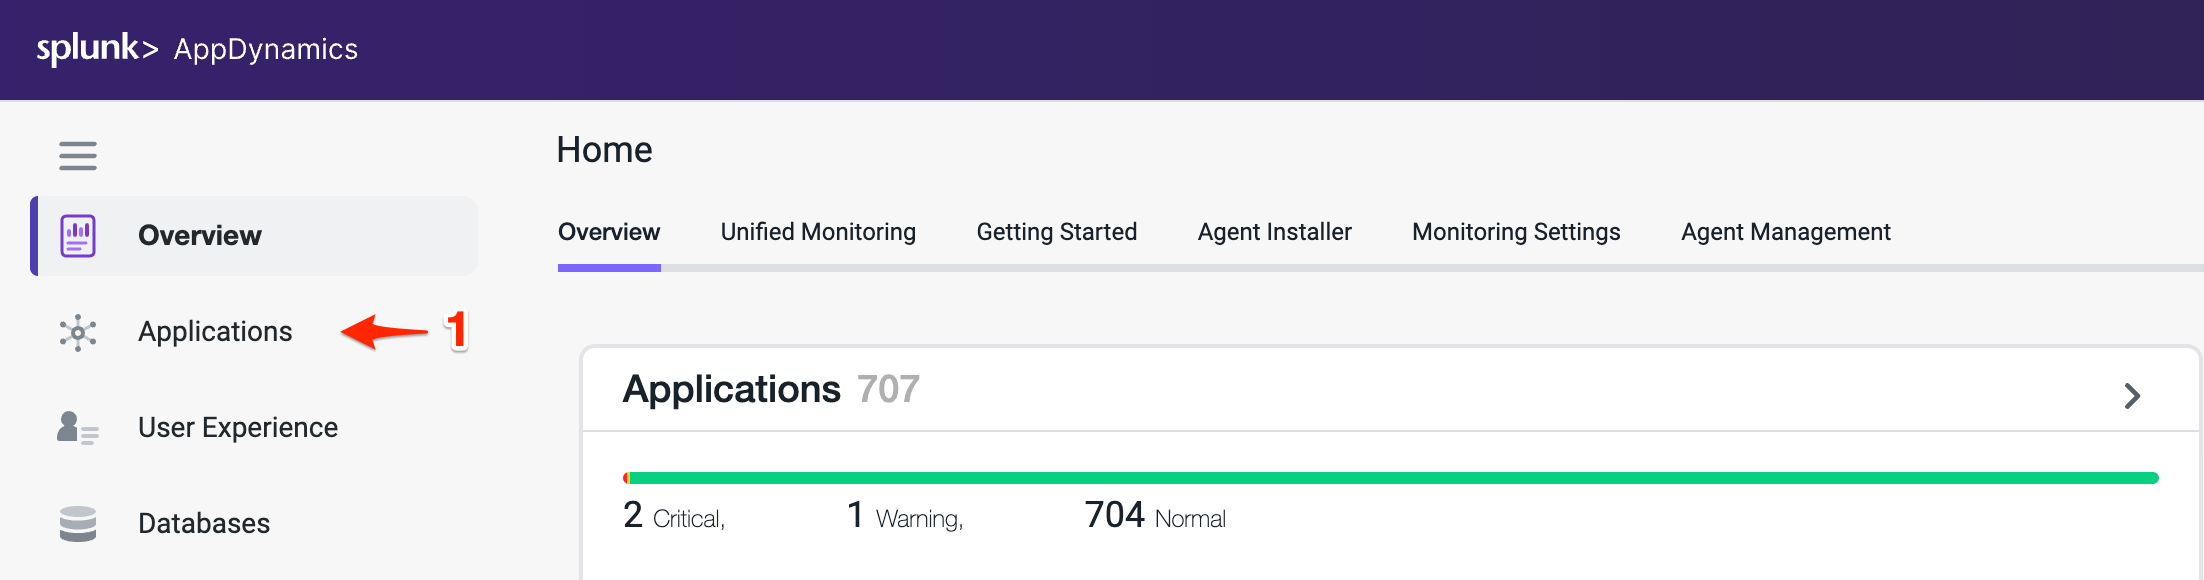
From the Overview page (Landing Page). Click on the Applications tab on the left navigation panel.
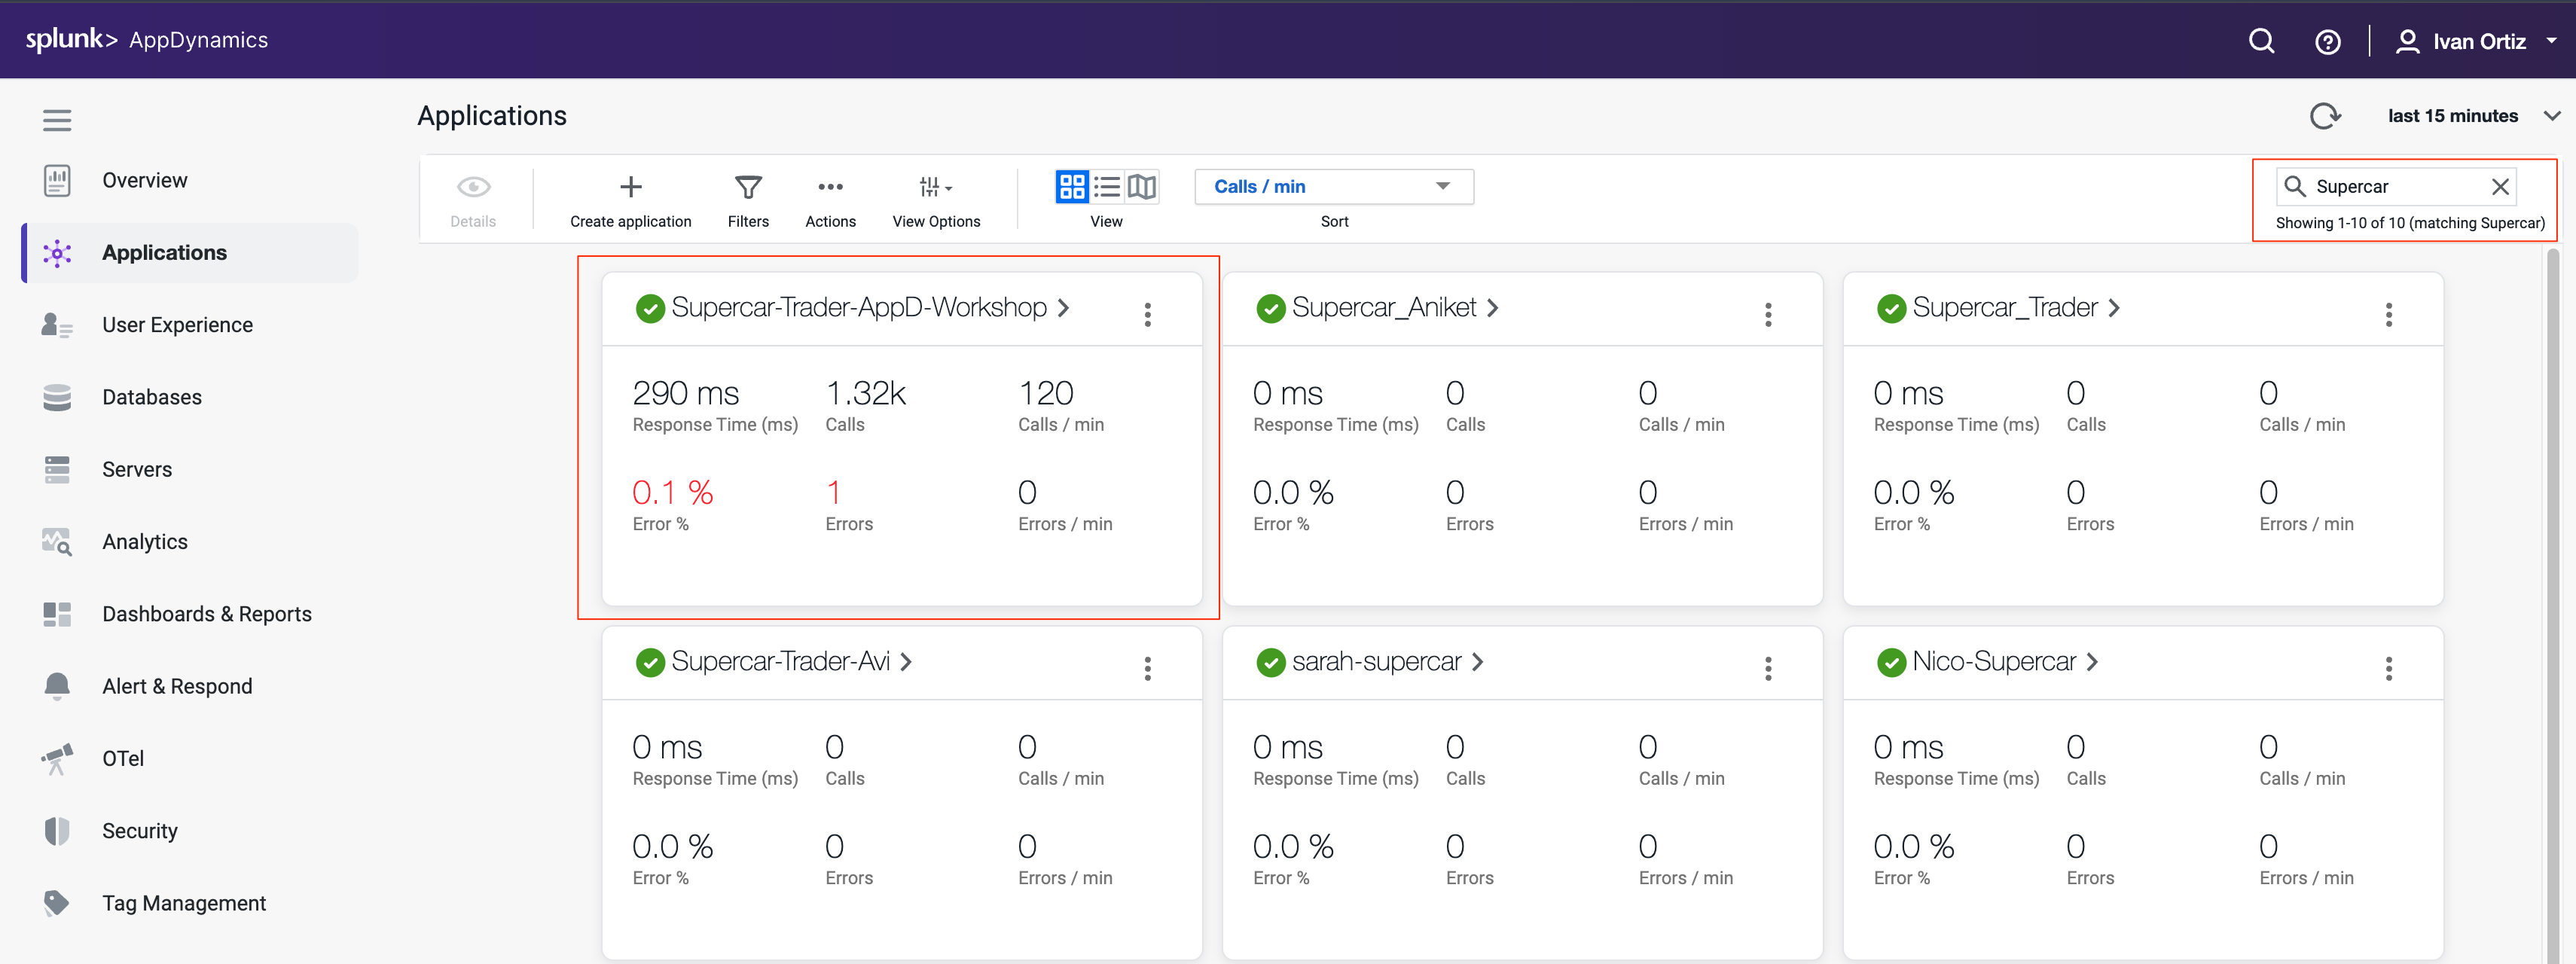
Within the Applications page you can manually search for your application or you can use the search bar in the top right corner to narrow down your search.
Click in your application’s name, this should bring you into the Application Flow Map, you should see all the application components appear after twelve minutes.
If you don’t see all the application components after twelve minutes, try waiting a few more minutes and refresh your browser tab.
During the agent download step we assigned the Tier name and Node name for the Tomcat server.
You might be wondering how the other four services had their Tier and Node name assigned. The sample application dynamically creates four additional JVMs from the initial Tomcat JVM and assigns the Tier and Node names by passing those properties into the JVM startup command as -D properties for each of the four services. Any -D properties included on the JVM startup command line will supersede the properties defined in the Java agents controller-info.xml file.
To see the JVM startup parameters used for each of the four services that were dynamically started, issue the following command in your terminal window of your ec2 instance.
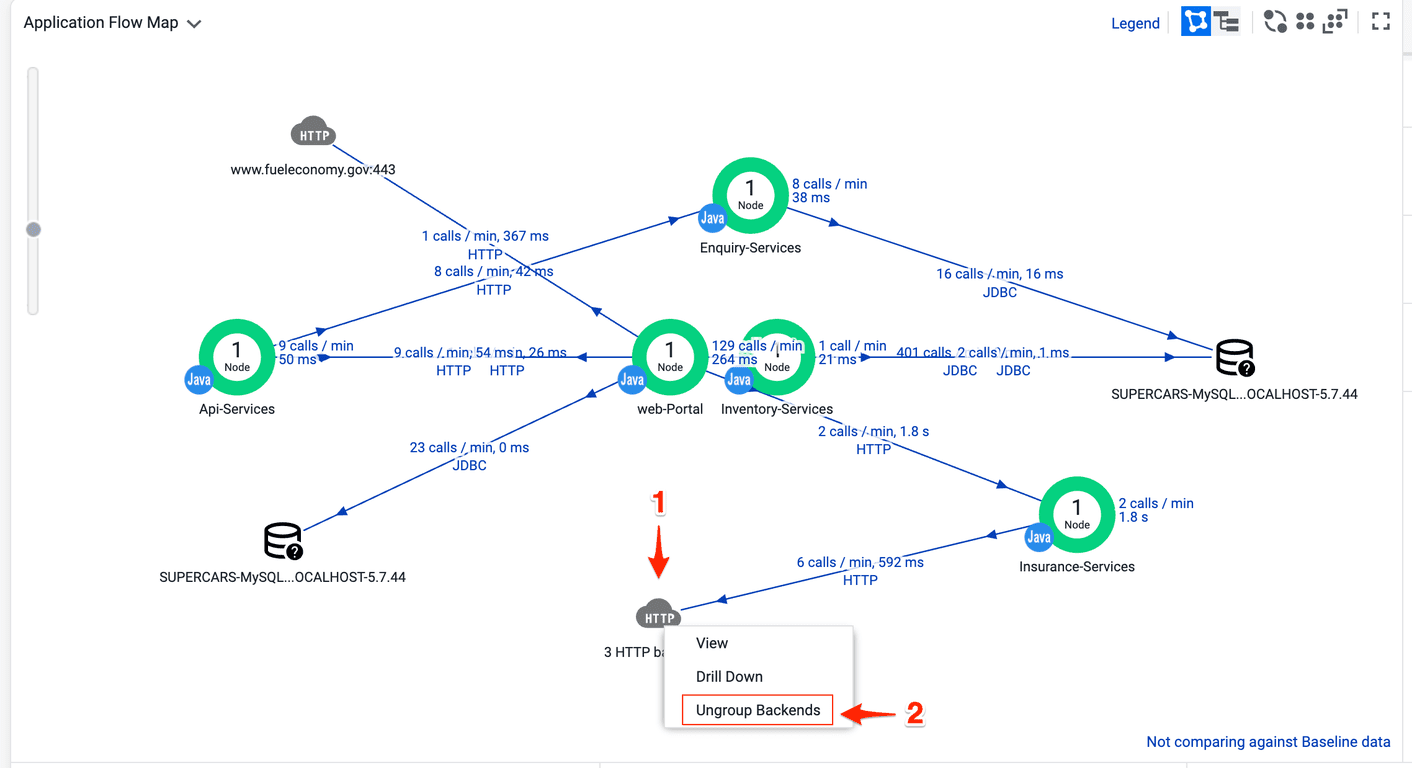
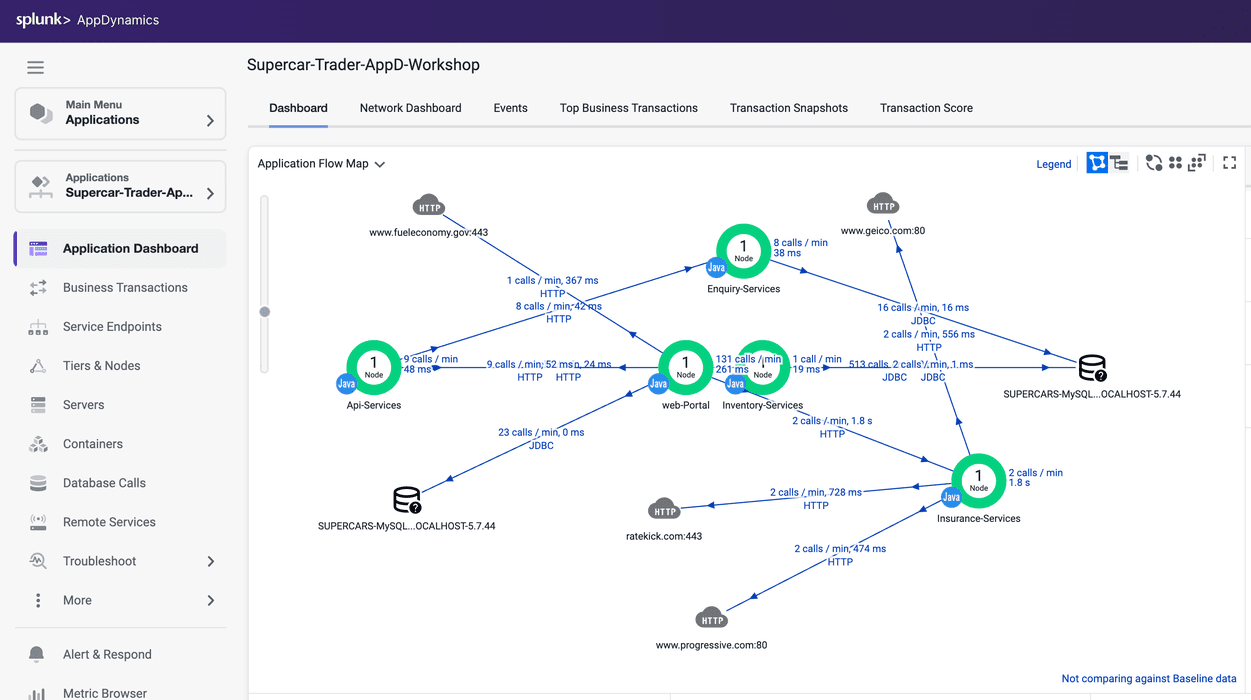
Once all of the components appear on the flow map, you should see an HTTP cloud icon that represents the three HTTP backends called by the Insurance-Services Tier.
Ungroup the the three HTTP backends by following these steps.
Right click the HTTP cloud icon labeled 3 HTTP backends
From the drop down menu, select Ungroup Backends
Once the HTTP backends have been ungrouped, you should see all three HTTP backends as shown in the following image.
4. AppDynamics Core Concepts
In this section you will learn about the core concepts of Splunk Appdynamics APM features. By the end of the section you will understand the following concepts:
Application Flow Maps
Business Transactions (BTs)
Snapshots
Call Graphs
Flow Maps
AppDynamics app agents automatically discover the most common application frameworks and services. Using built-in application detection and configuration settings, agents collect application data and metrics to build Flow Maps.
AppDynamics automatically captures and scores every transaction. Flow Maps present a dynamic visual representation of the components and activities of your monitored application environment in direct context of the time frame that you have selected.
Familiarize yourself with the some of the different features of the Flow Map.
Try using the different layout options (you can also click and drag each icon on the Flow Map to reposition it).
Try using the slider and mouse scrollwheel to adjust the zoom level.
In the AppDynamics model, a Business Transaction represents the data processing flow for a request, most often a user request. In real-world terms, many different components in your application may interact to provide services to fulfill the following types of requests:
In an e-commerce application, a user logging in, searching for items or adding items to the cart.
In a content portal, a user requests content such as sports, business or entertainment news.
In a stock trading application, operations such as receiving a stock quote, buying or selling stocks. Because AppDynamics orients performance monitoring around Business Transactions, you can focus on the performance of your application components from the user perspective. You can quickly identify whether a component is readily available or if it is having performance issues. For instance, you can check whether users are able to log in, check out or view their data. You can see response times for users, and the causes of problems when they occur.
You can read more about Business Transactions here and here
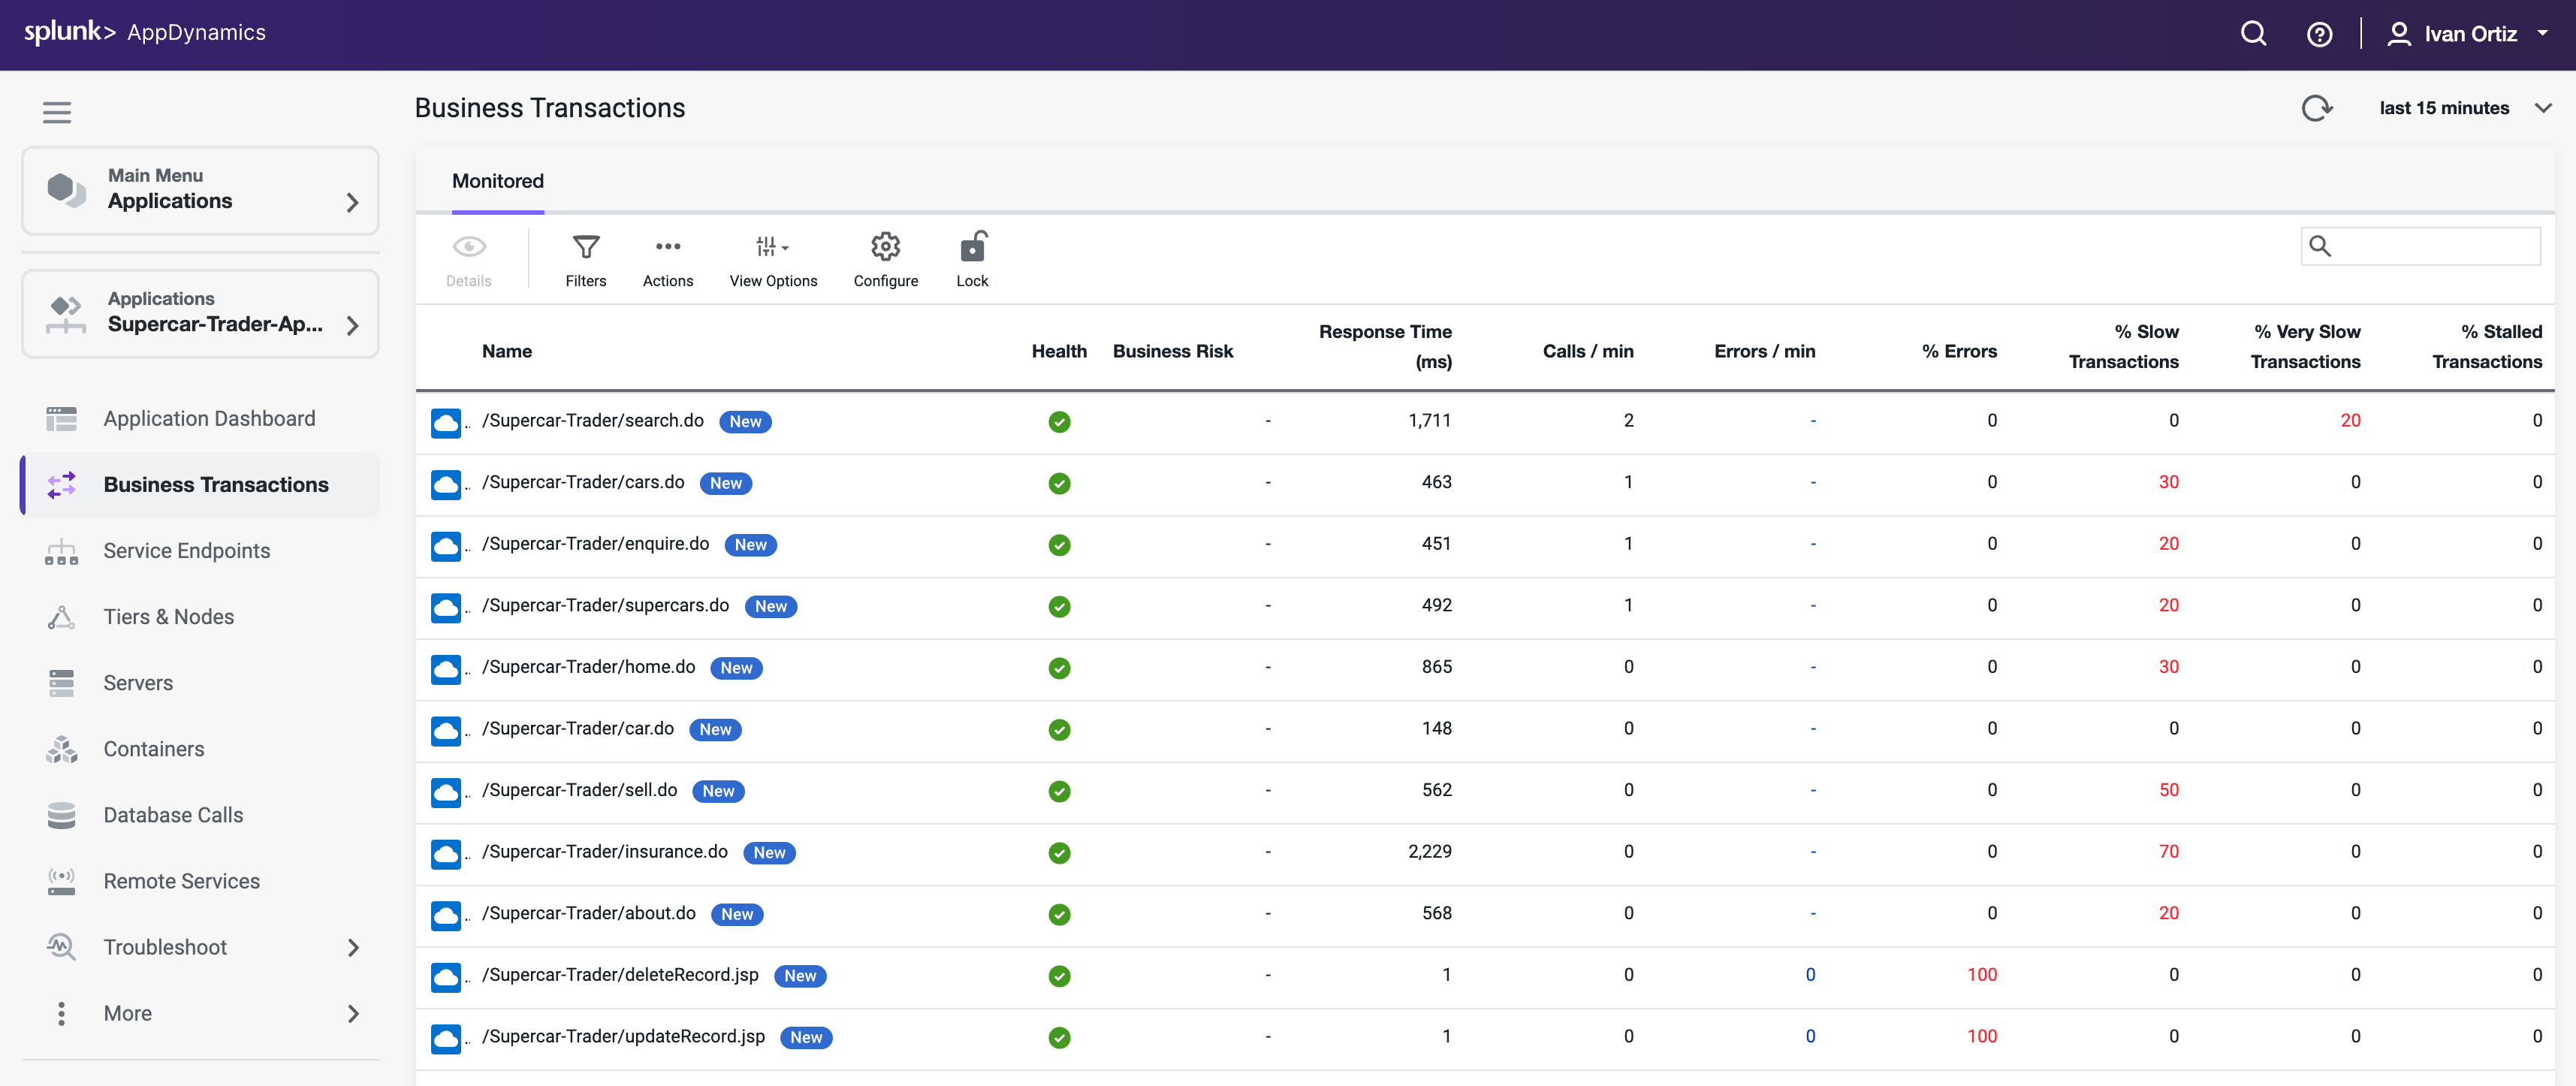
Verifying Business Transactions
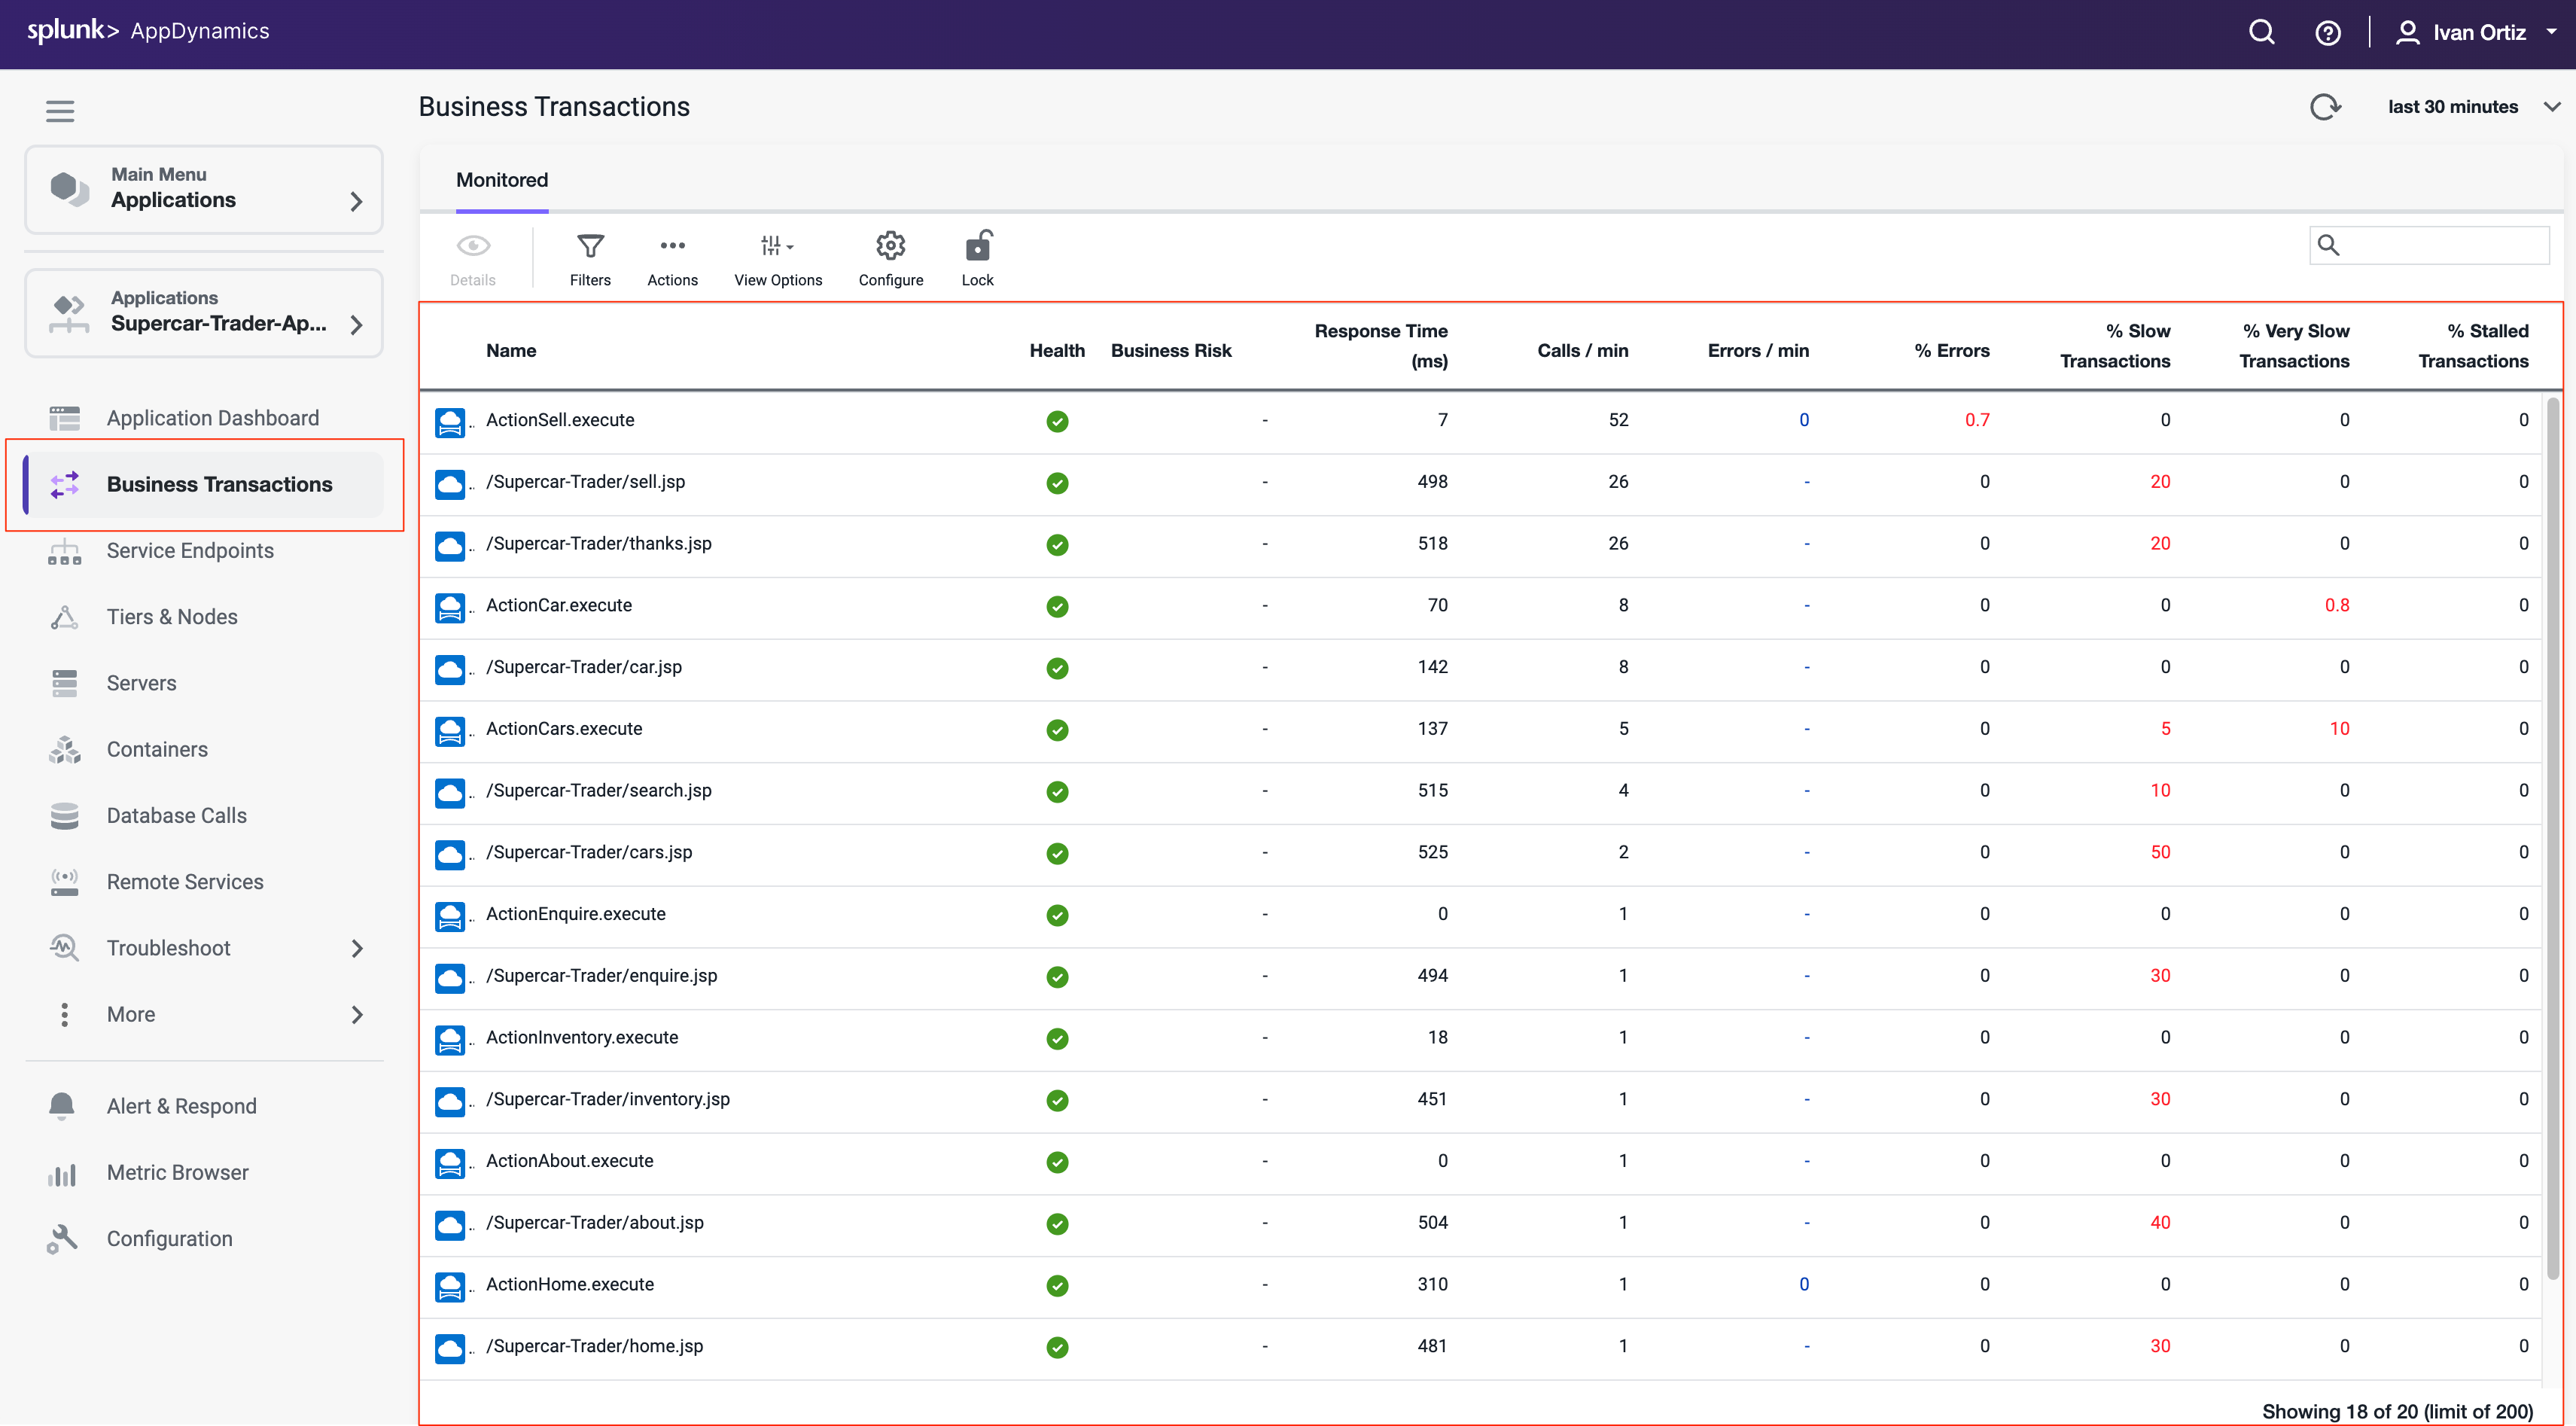
Verify that Business Transactions are being automatically detected by following these steps.
Click the Business Transactions option on the left menu.
Look at the list of Business Transactions and their performance.
Snapshots
AppDynamics monitors every execution of a Business Transaction in the instrumented environment, and the metrics reflect all such executions. However, for troubleshooting purposes, AppDynamics takes snapshots (containing deep diagnostic information) of specific instances of transactions that are having problems.
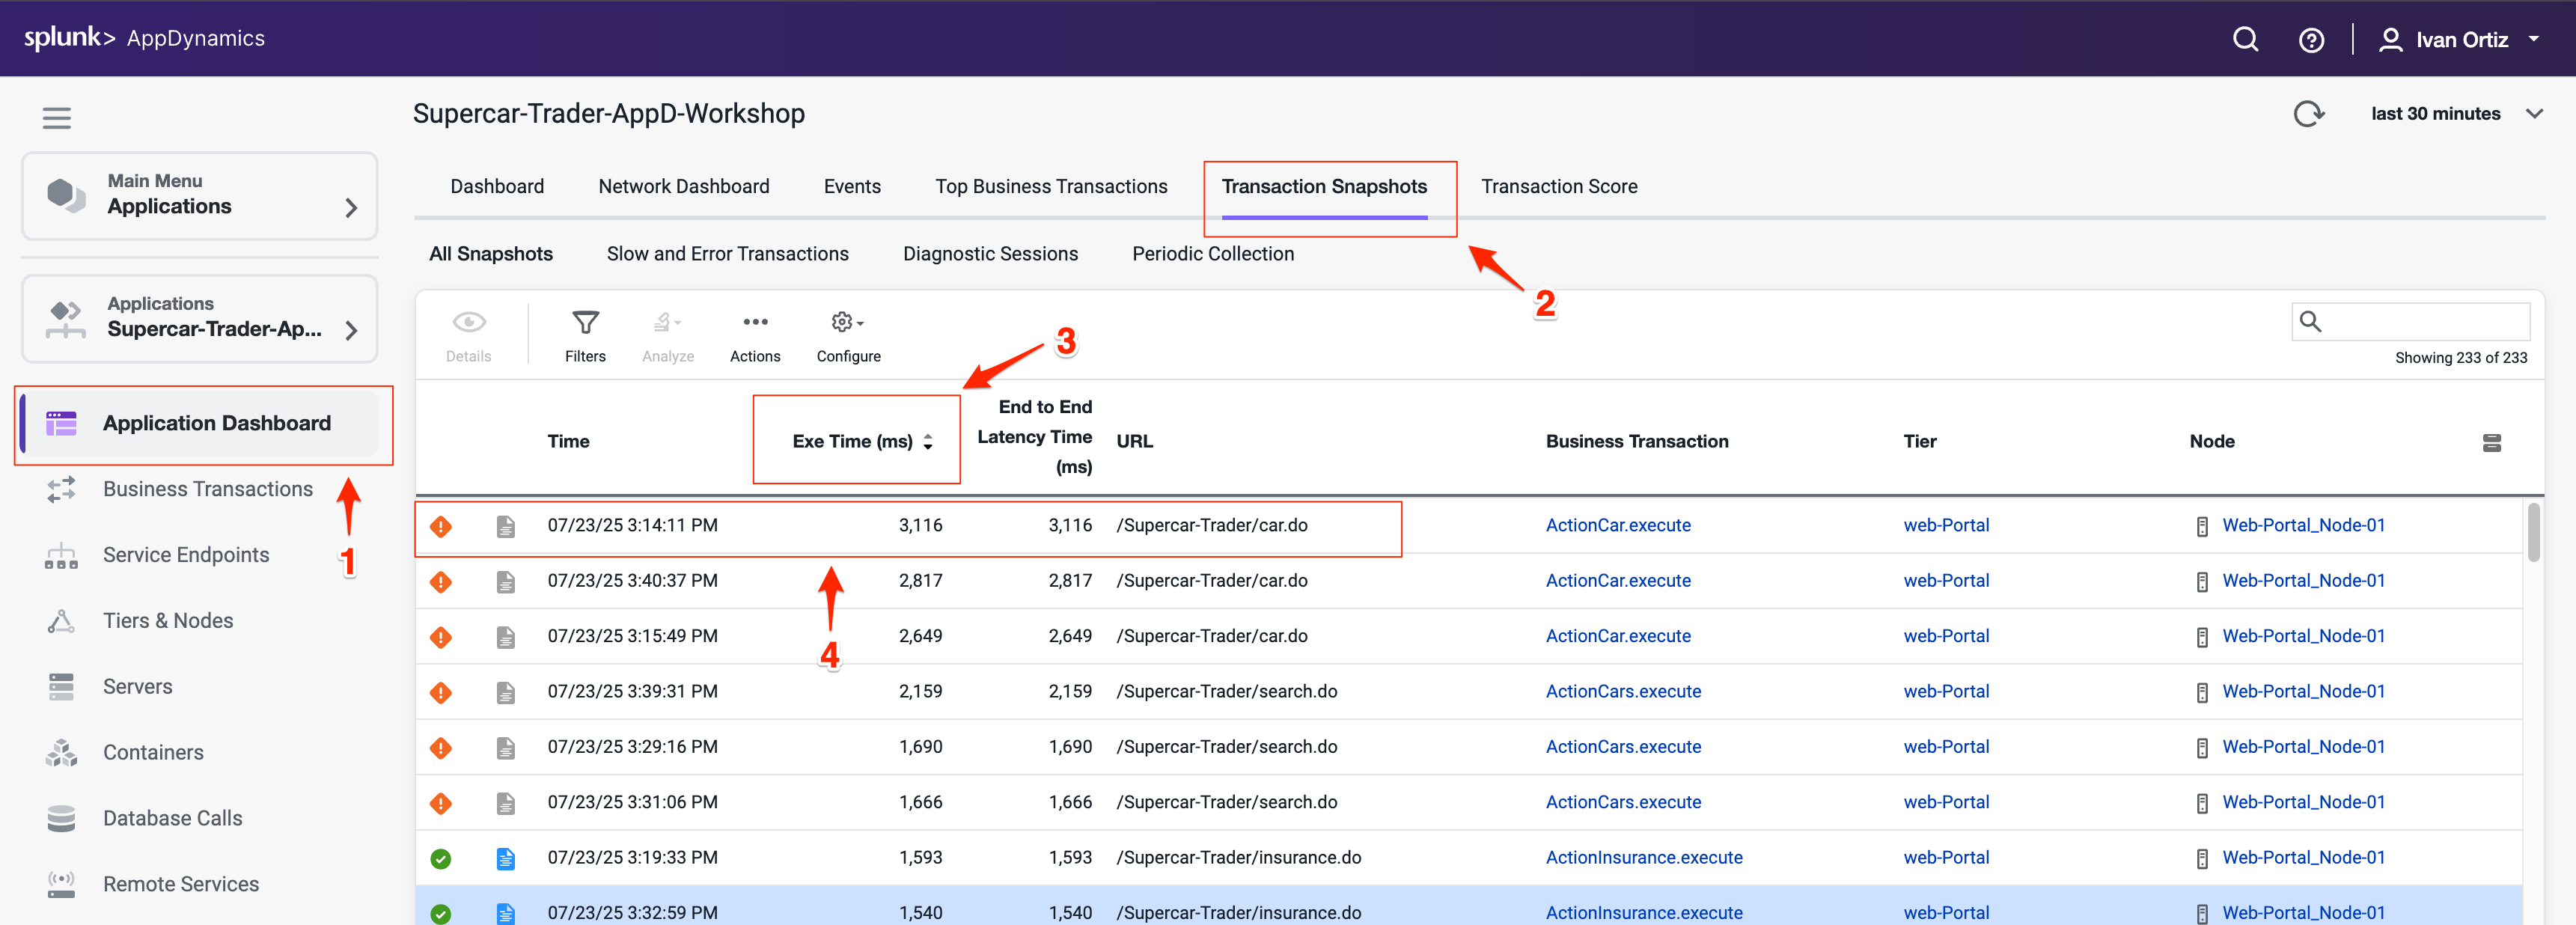
Verify that transaction snapshots are being automatically collected by following these steps.
Click the Application Dashboard option on the left menu.
Click the Transaction Snapshots tab.
Click the Exe Time (ms) column to sort the snapshots with the greatest execution time.
Double-click a Business Transaction snapshot to display the snapshot viewer
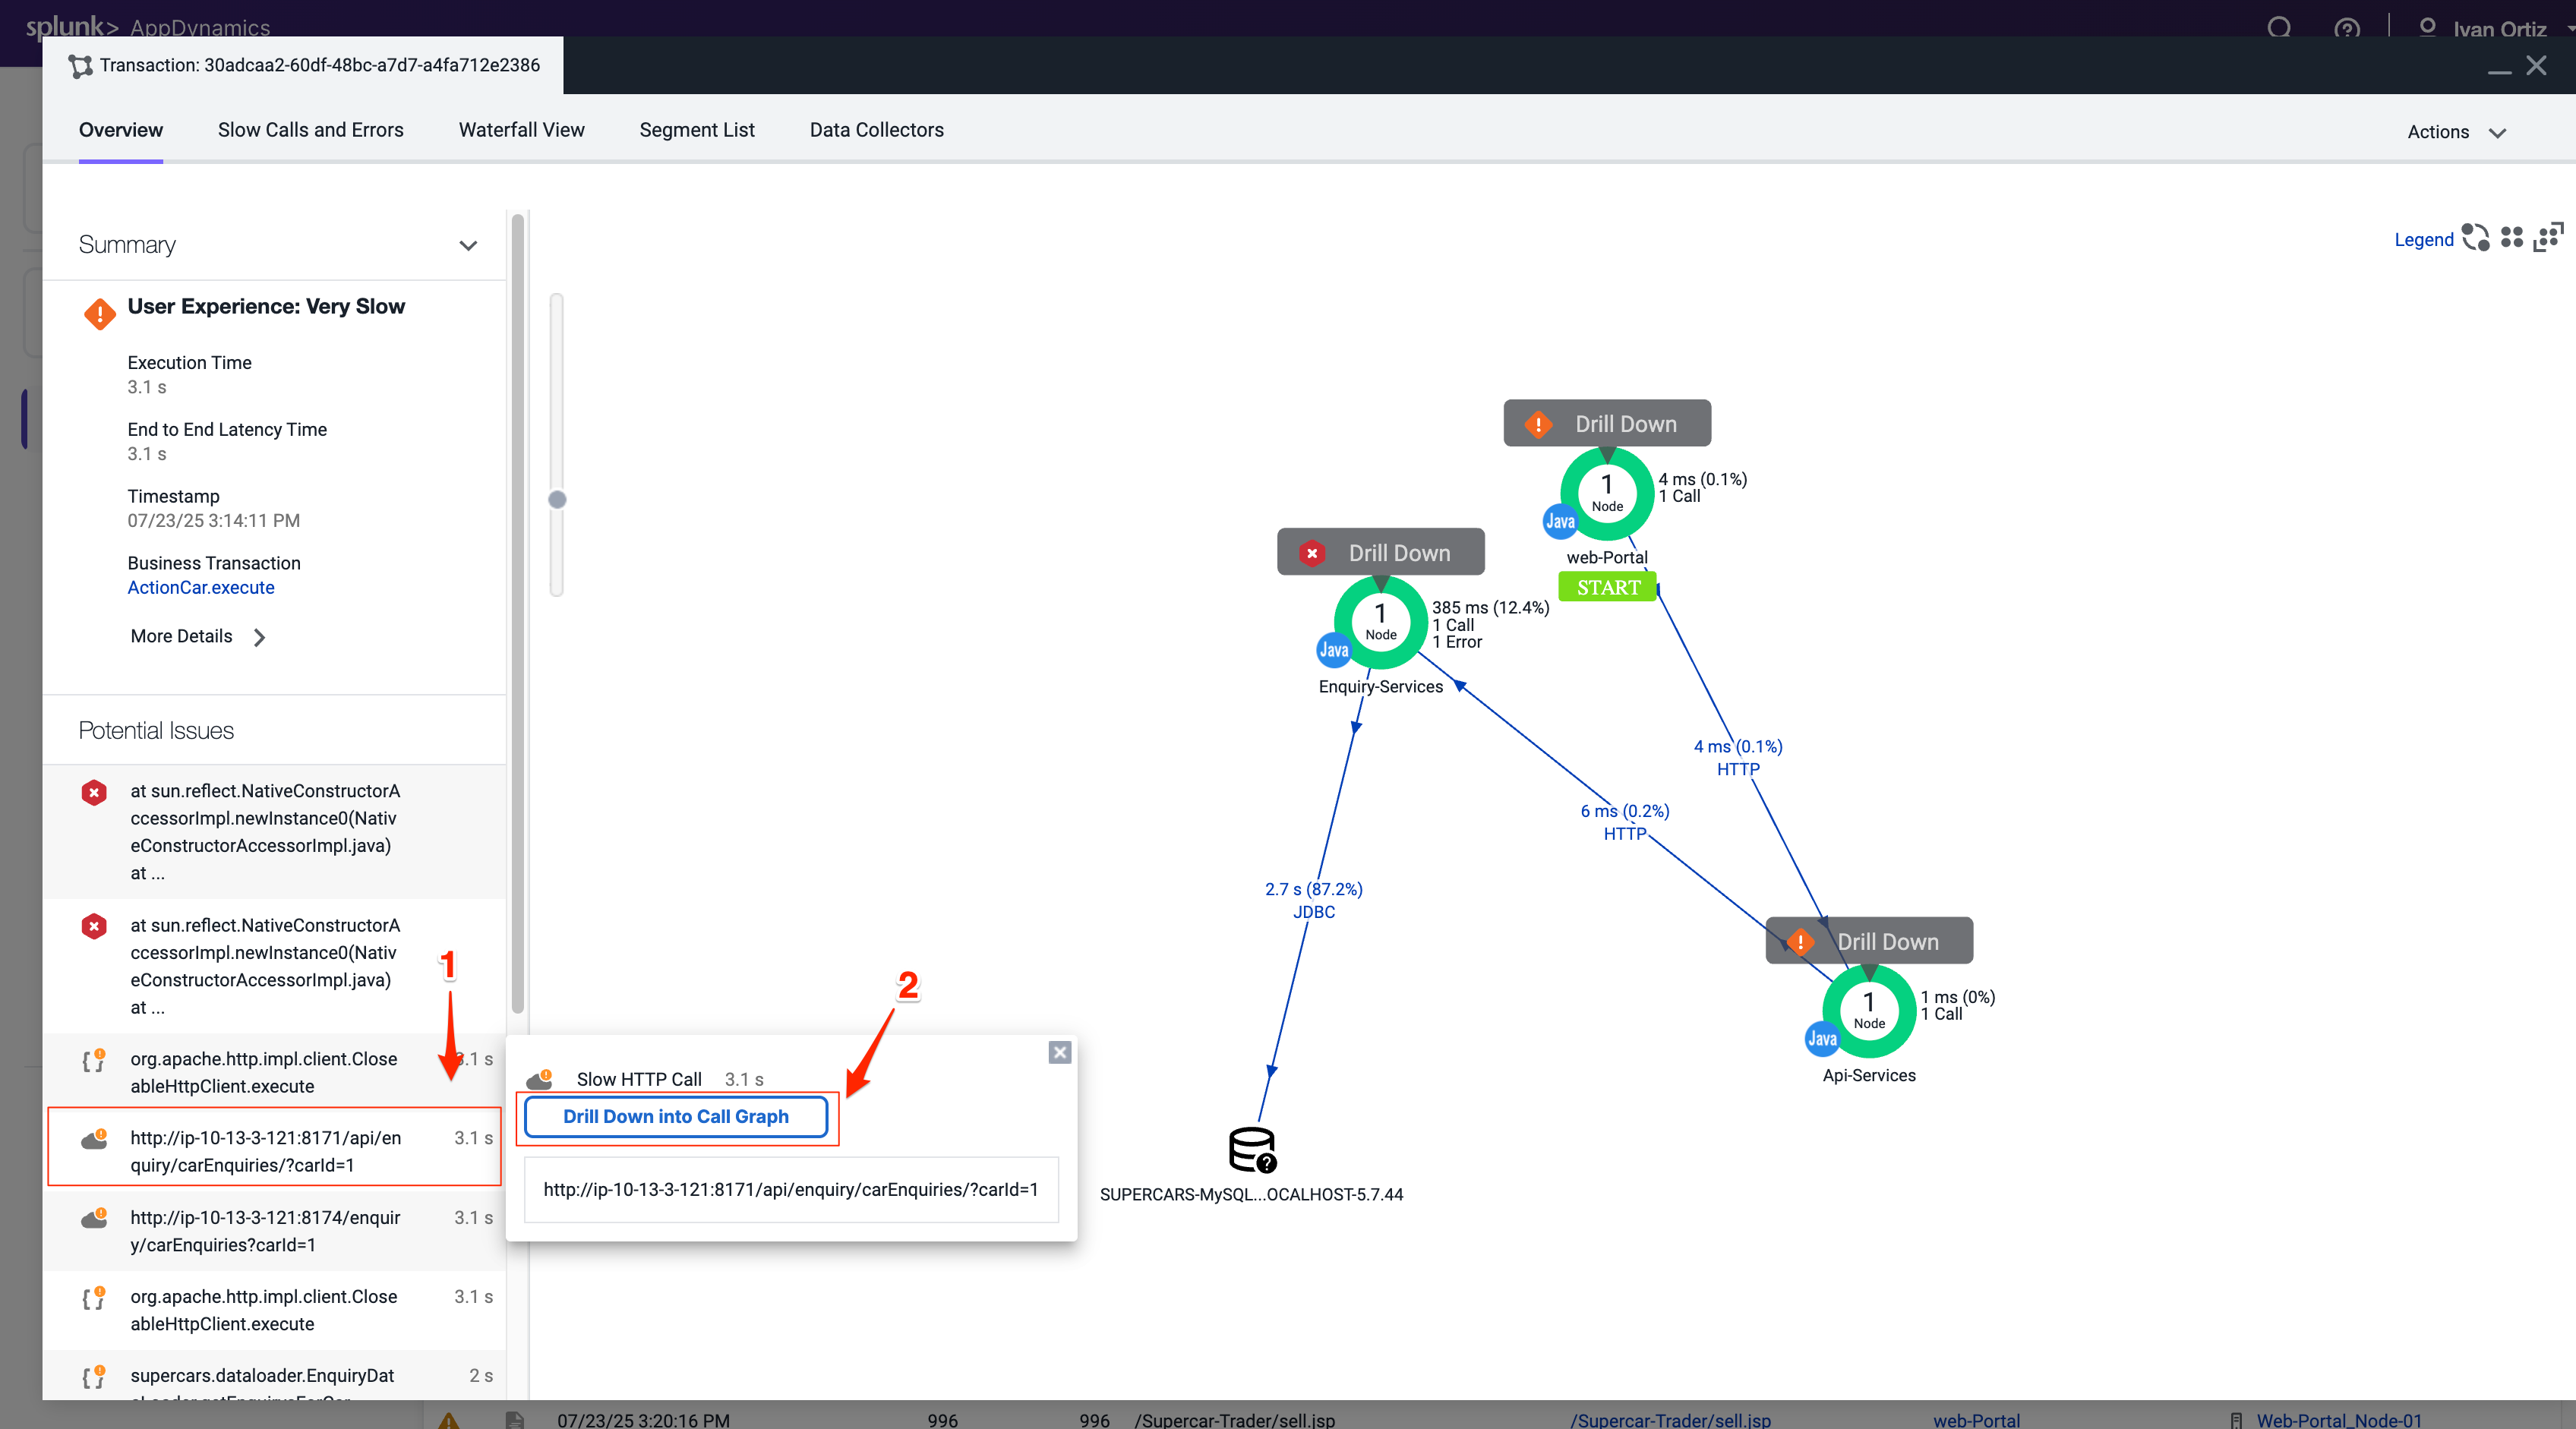
A transaction snapshot gives you a cross-tier view of the processing flow for a single invocation of a transaction.
The Potential Issues panel highlights slow methods and slow remote service calls and help you investigate the root cause for performance issues.
Drill Downs & Call Graphs
Call graphs and drill downs provide key information, including slowest methods, errors, and remote service calls for the transaction execution on a tier. A drill down may include a partial or complete call graph. Call graphs reflect the code-level view of the processing of the Business Transaction on a particular tier.
In the Flow Map for a Business Transaction snapshot, a tier with a Drill Down link indicates AppDynamics has taken a call graph for that tier.
Drill down into a call graph of the transaction snapshot by following these steps.
Click on a slow call in the Potential Issues list on the left.
Click Drill Down into Call Graph.
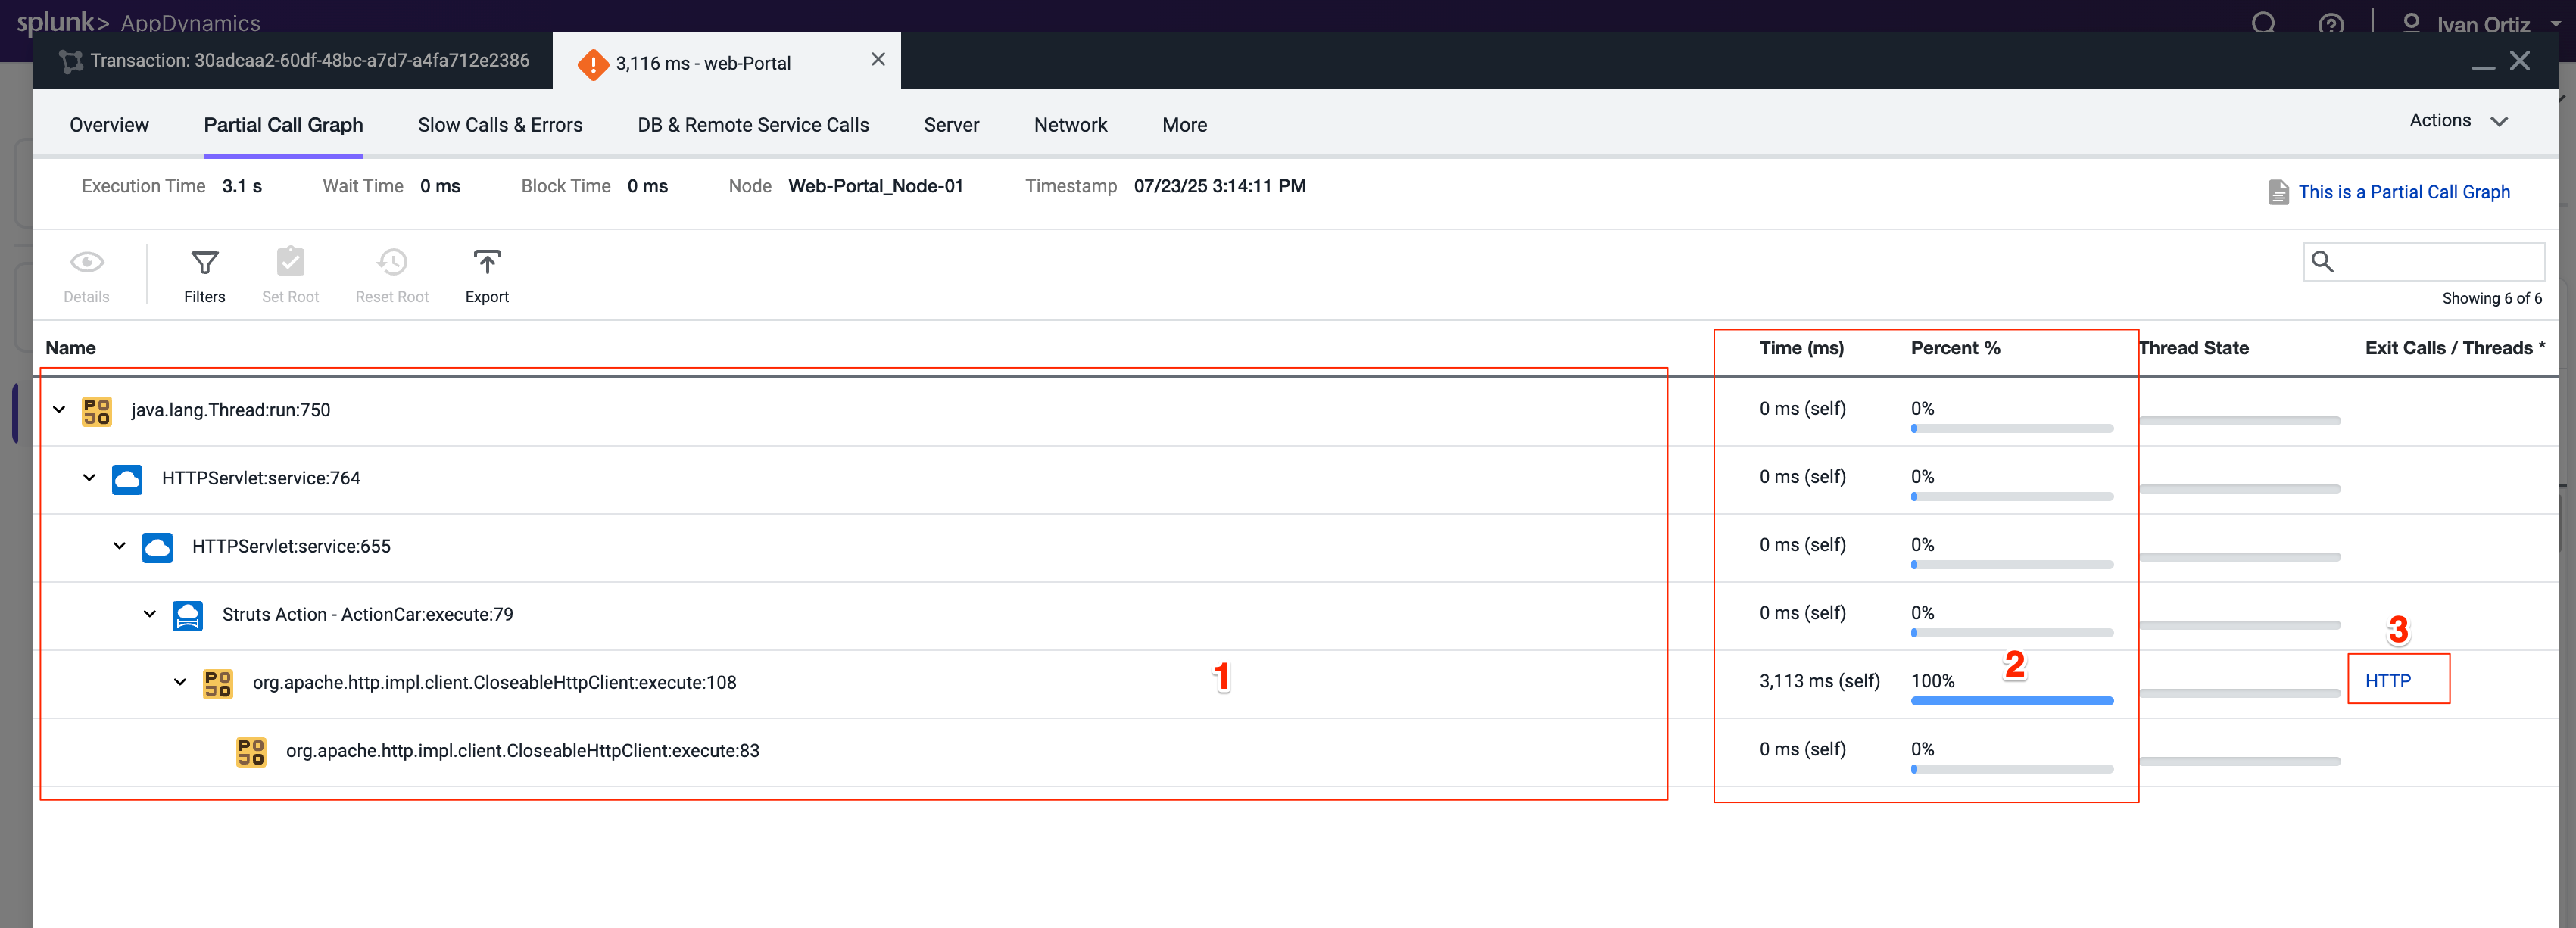
The call graph view shows you the following details.
The method execution sequence shows the names of the classes and methods that participated in processing the Business Transaction on this node, in the order in which the flow of control proceeded.
For each method, you can see the time and percentage spent processing and the line number in the source code, enabling you to pinpoint the location in the code that could be affecting the performance of the transaction.
The call graph displays exit call links for methods that make outbound calls to other components such as database queries and web service calls.
You can read more about Transaction Snapshots here
In this exercise you will complete the following tasks:
Adjust Business Transaction settings.
Adjust Call Graph settings.
Observe Business Transaction changes.
Adjust Business Transaction Settings
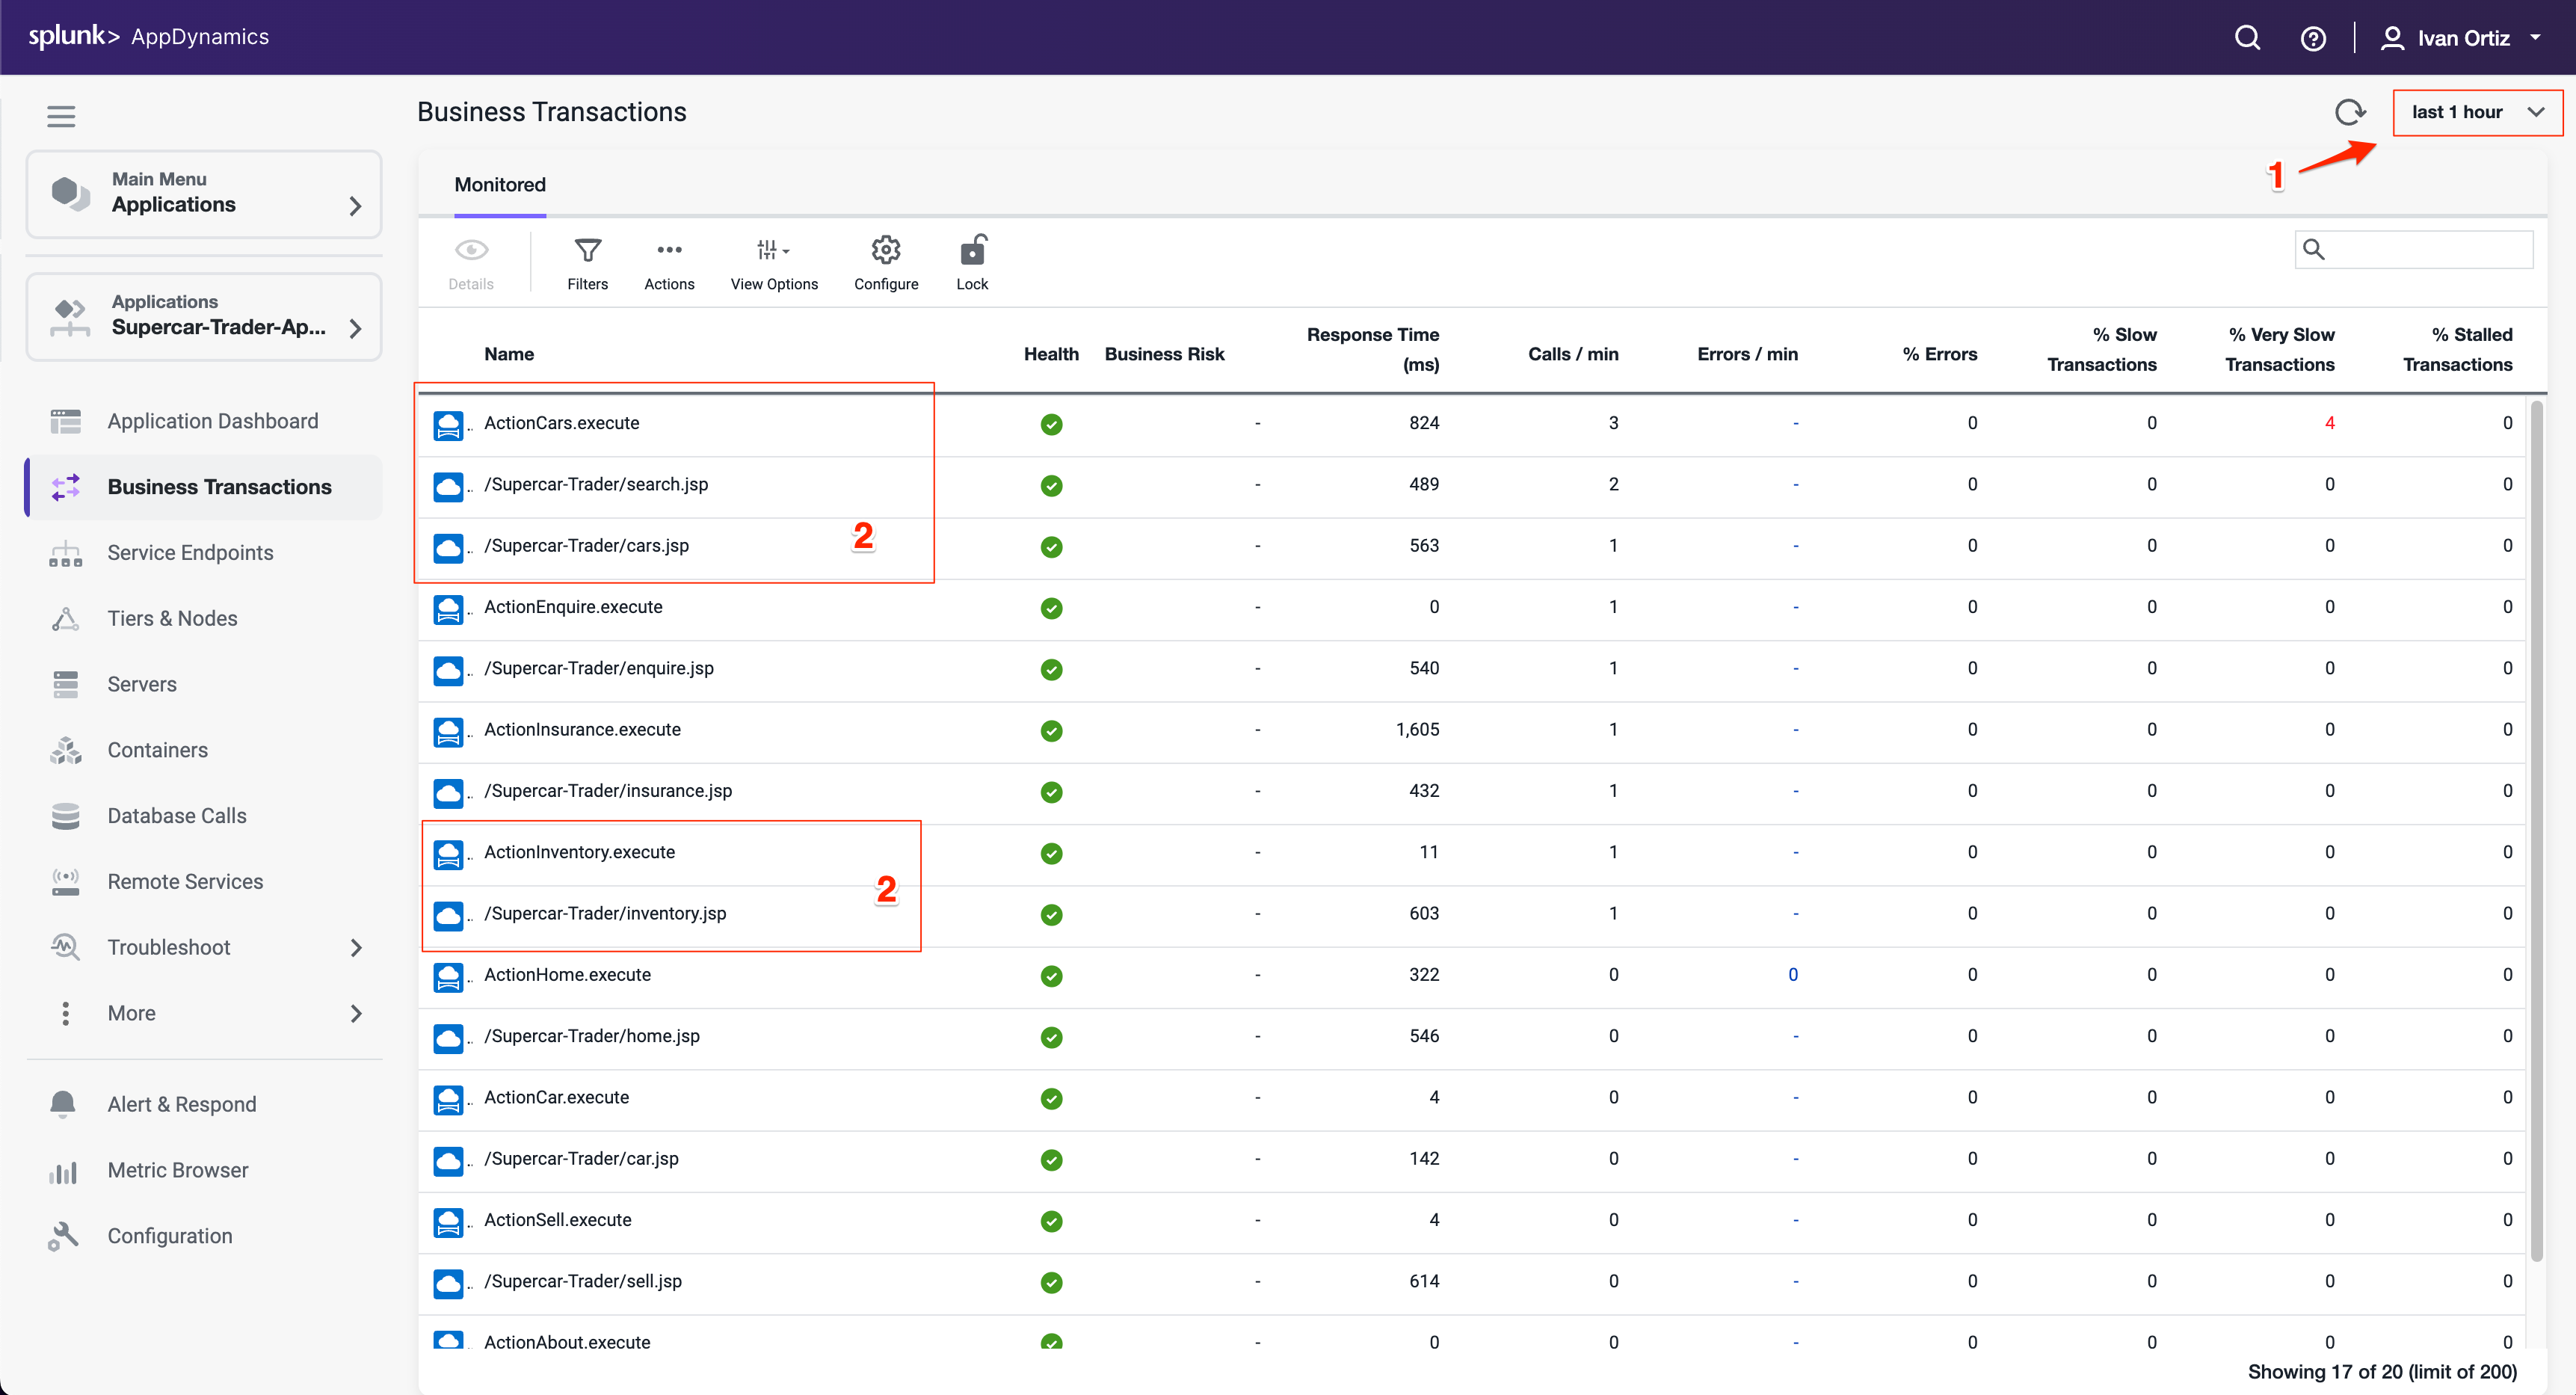
In the last exercise, you validated that Business Transactions were being auto-detected. There are times when you want to adjust the Business Transaction auto-detection rules to get them to an optimal state. This is the case with our sample application, which is built on an older Apache Struts framework.
The business transactions highlighted in the following image show that each pair has a Struts Action (.execute) and a Servlet type (.jsp). You will be adjusting the settings of the transaction detection rules so that these two types of transactions will be combined into one.
Anytime you see the time frame selector visible in the AppDynamics UI, the view you see will represents the context of the time frame selected. You can choose one of the pre-defined time frames or create your own custom time frame with the specific date and time range you want to view.
Select the last 1 hour time frame.
Use your mouse to hover over the blue icons to see the Entry Point Type of the transaction.
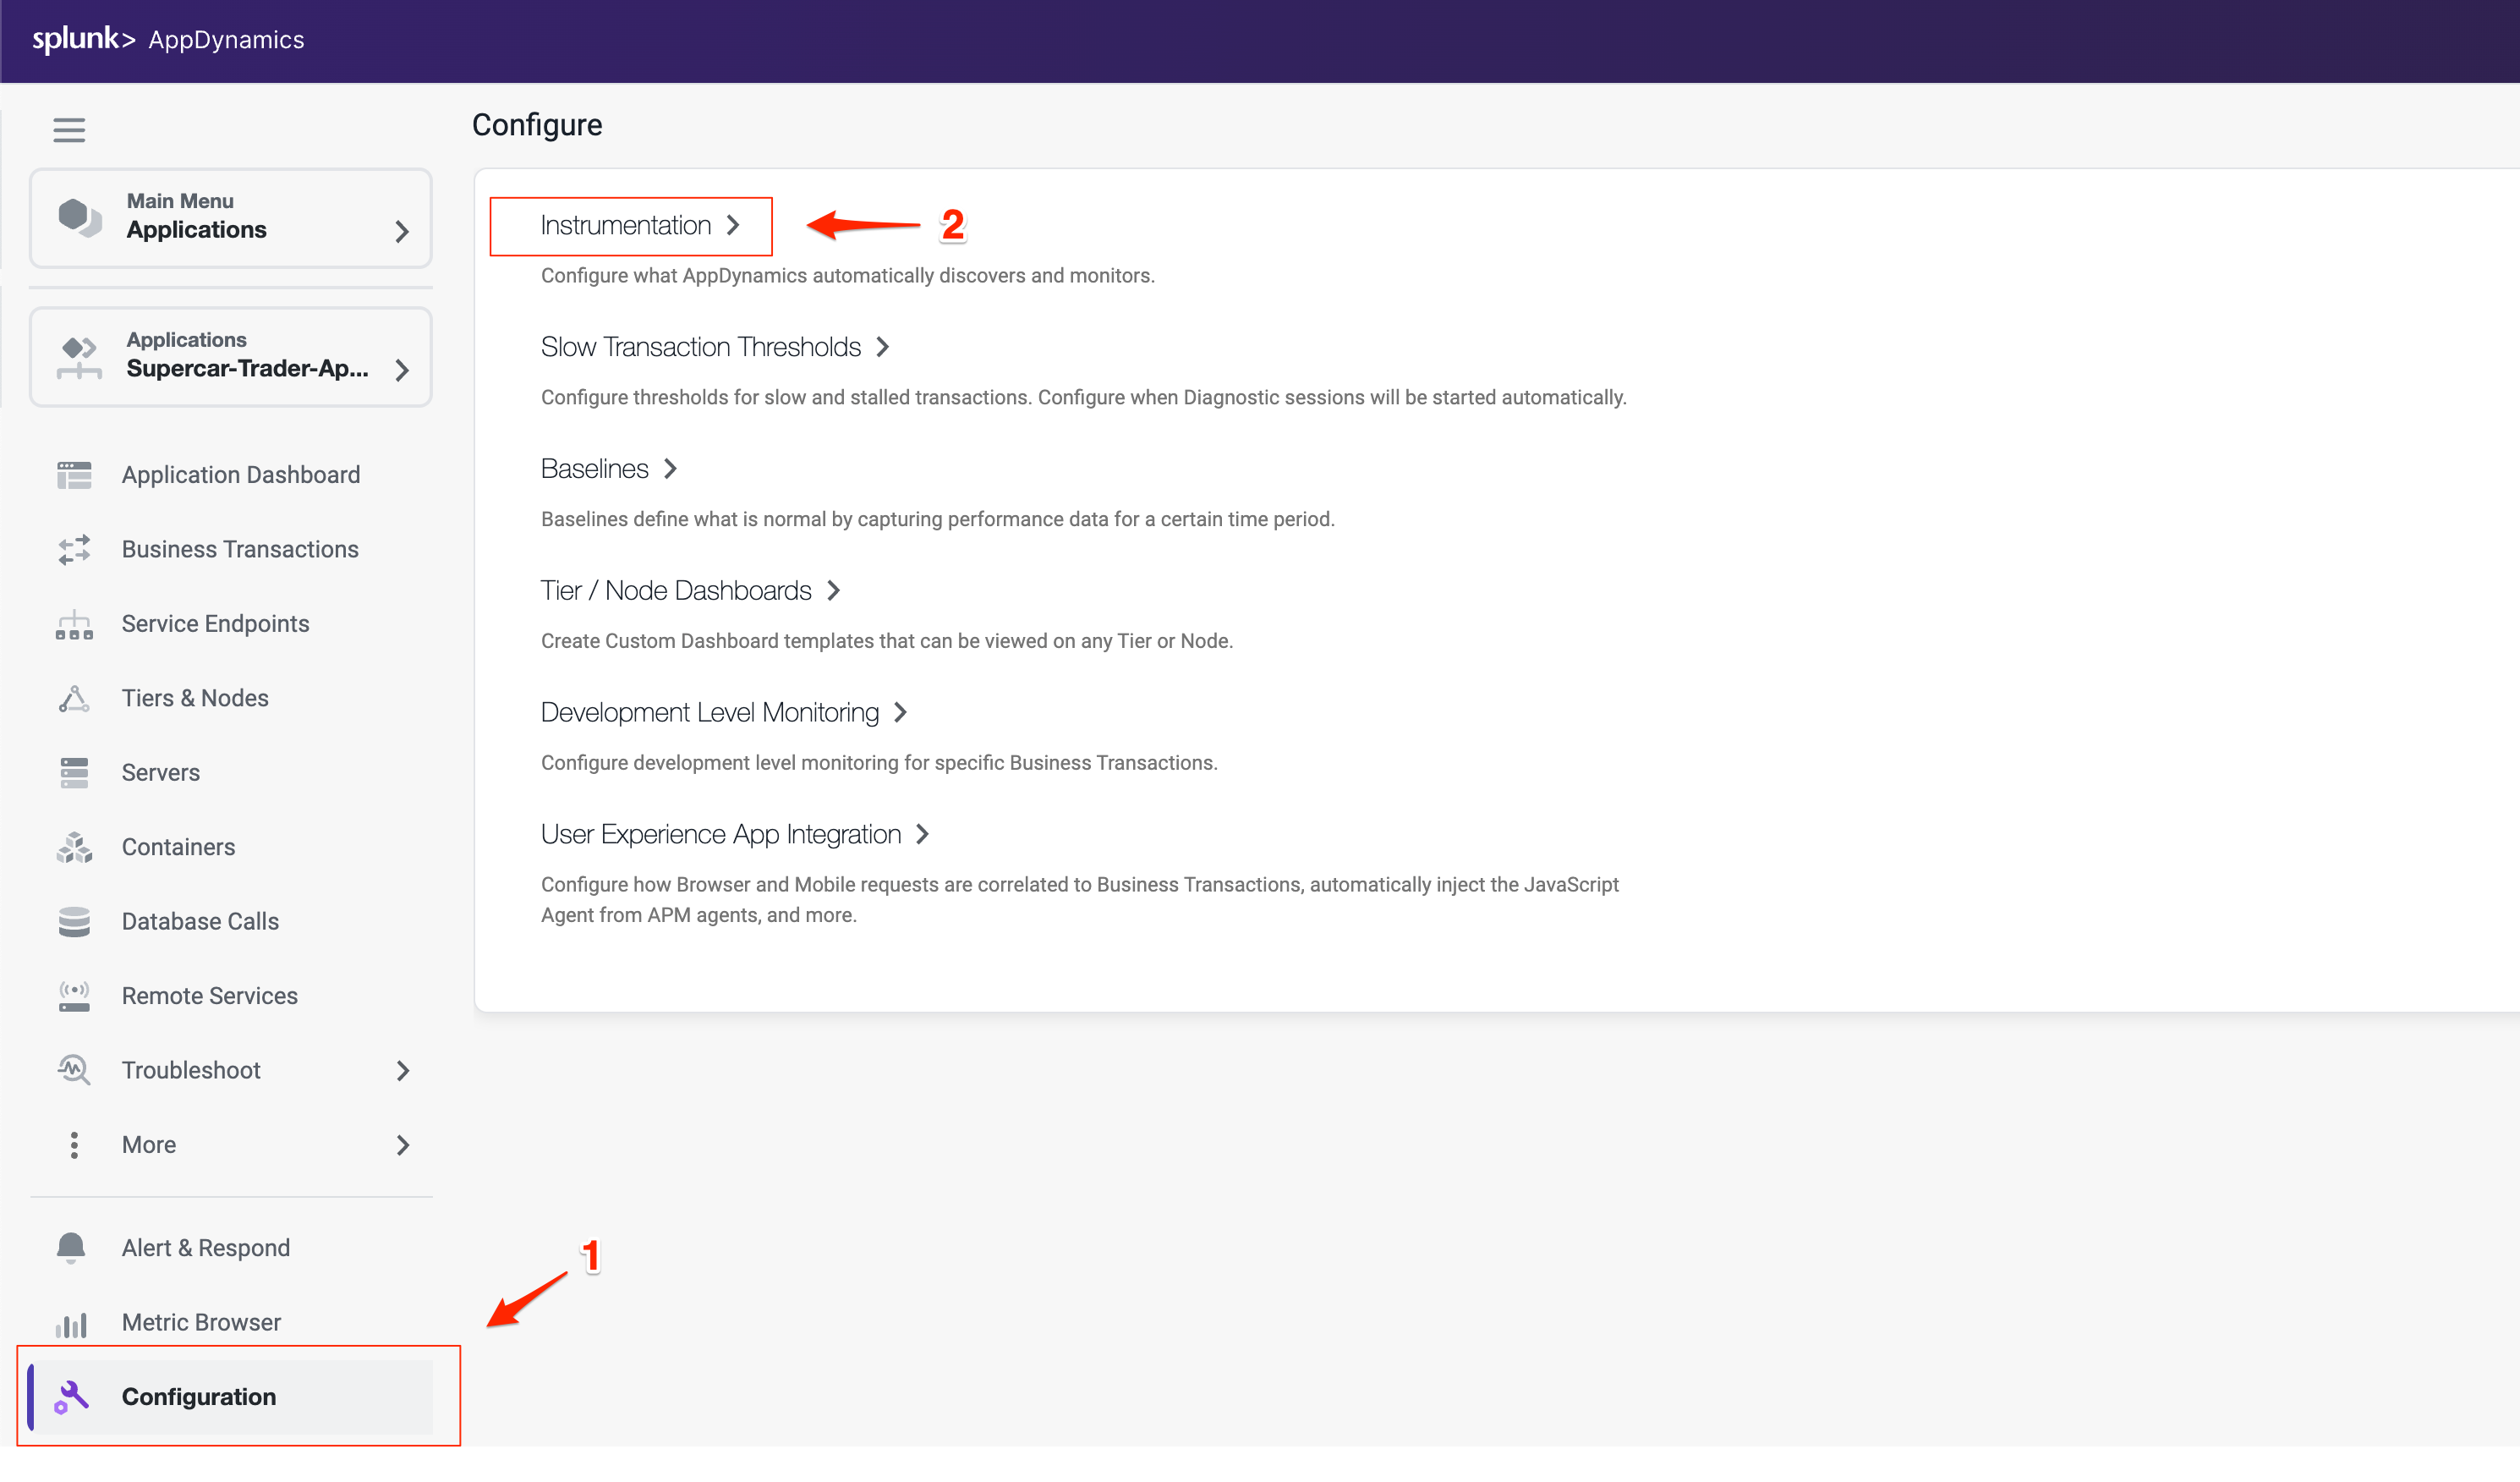
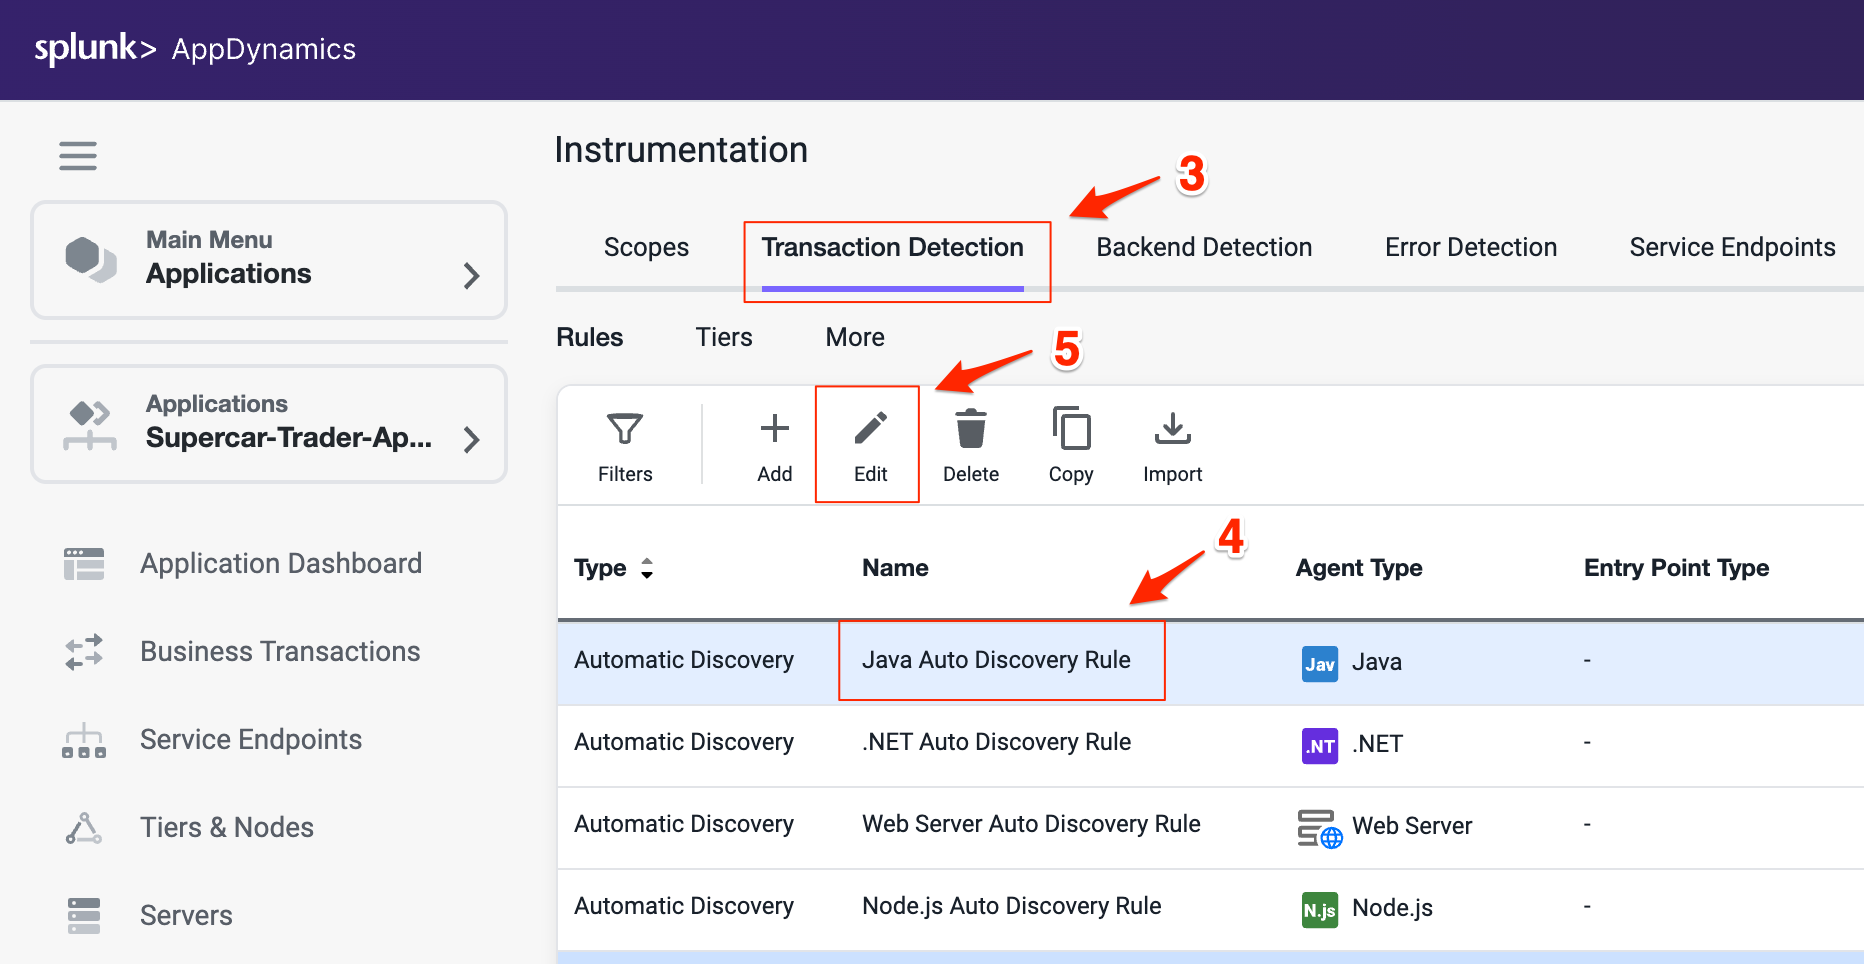
Optimize the transaction detection by following these steps:
Click the Configuration option toward the bottom left menu.
Click the Instrumentation link.
Select Transaction Detection from the Instrumentation menu.
Select the Java Auto Discovery Rule.
Click Edit.
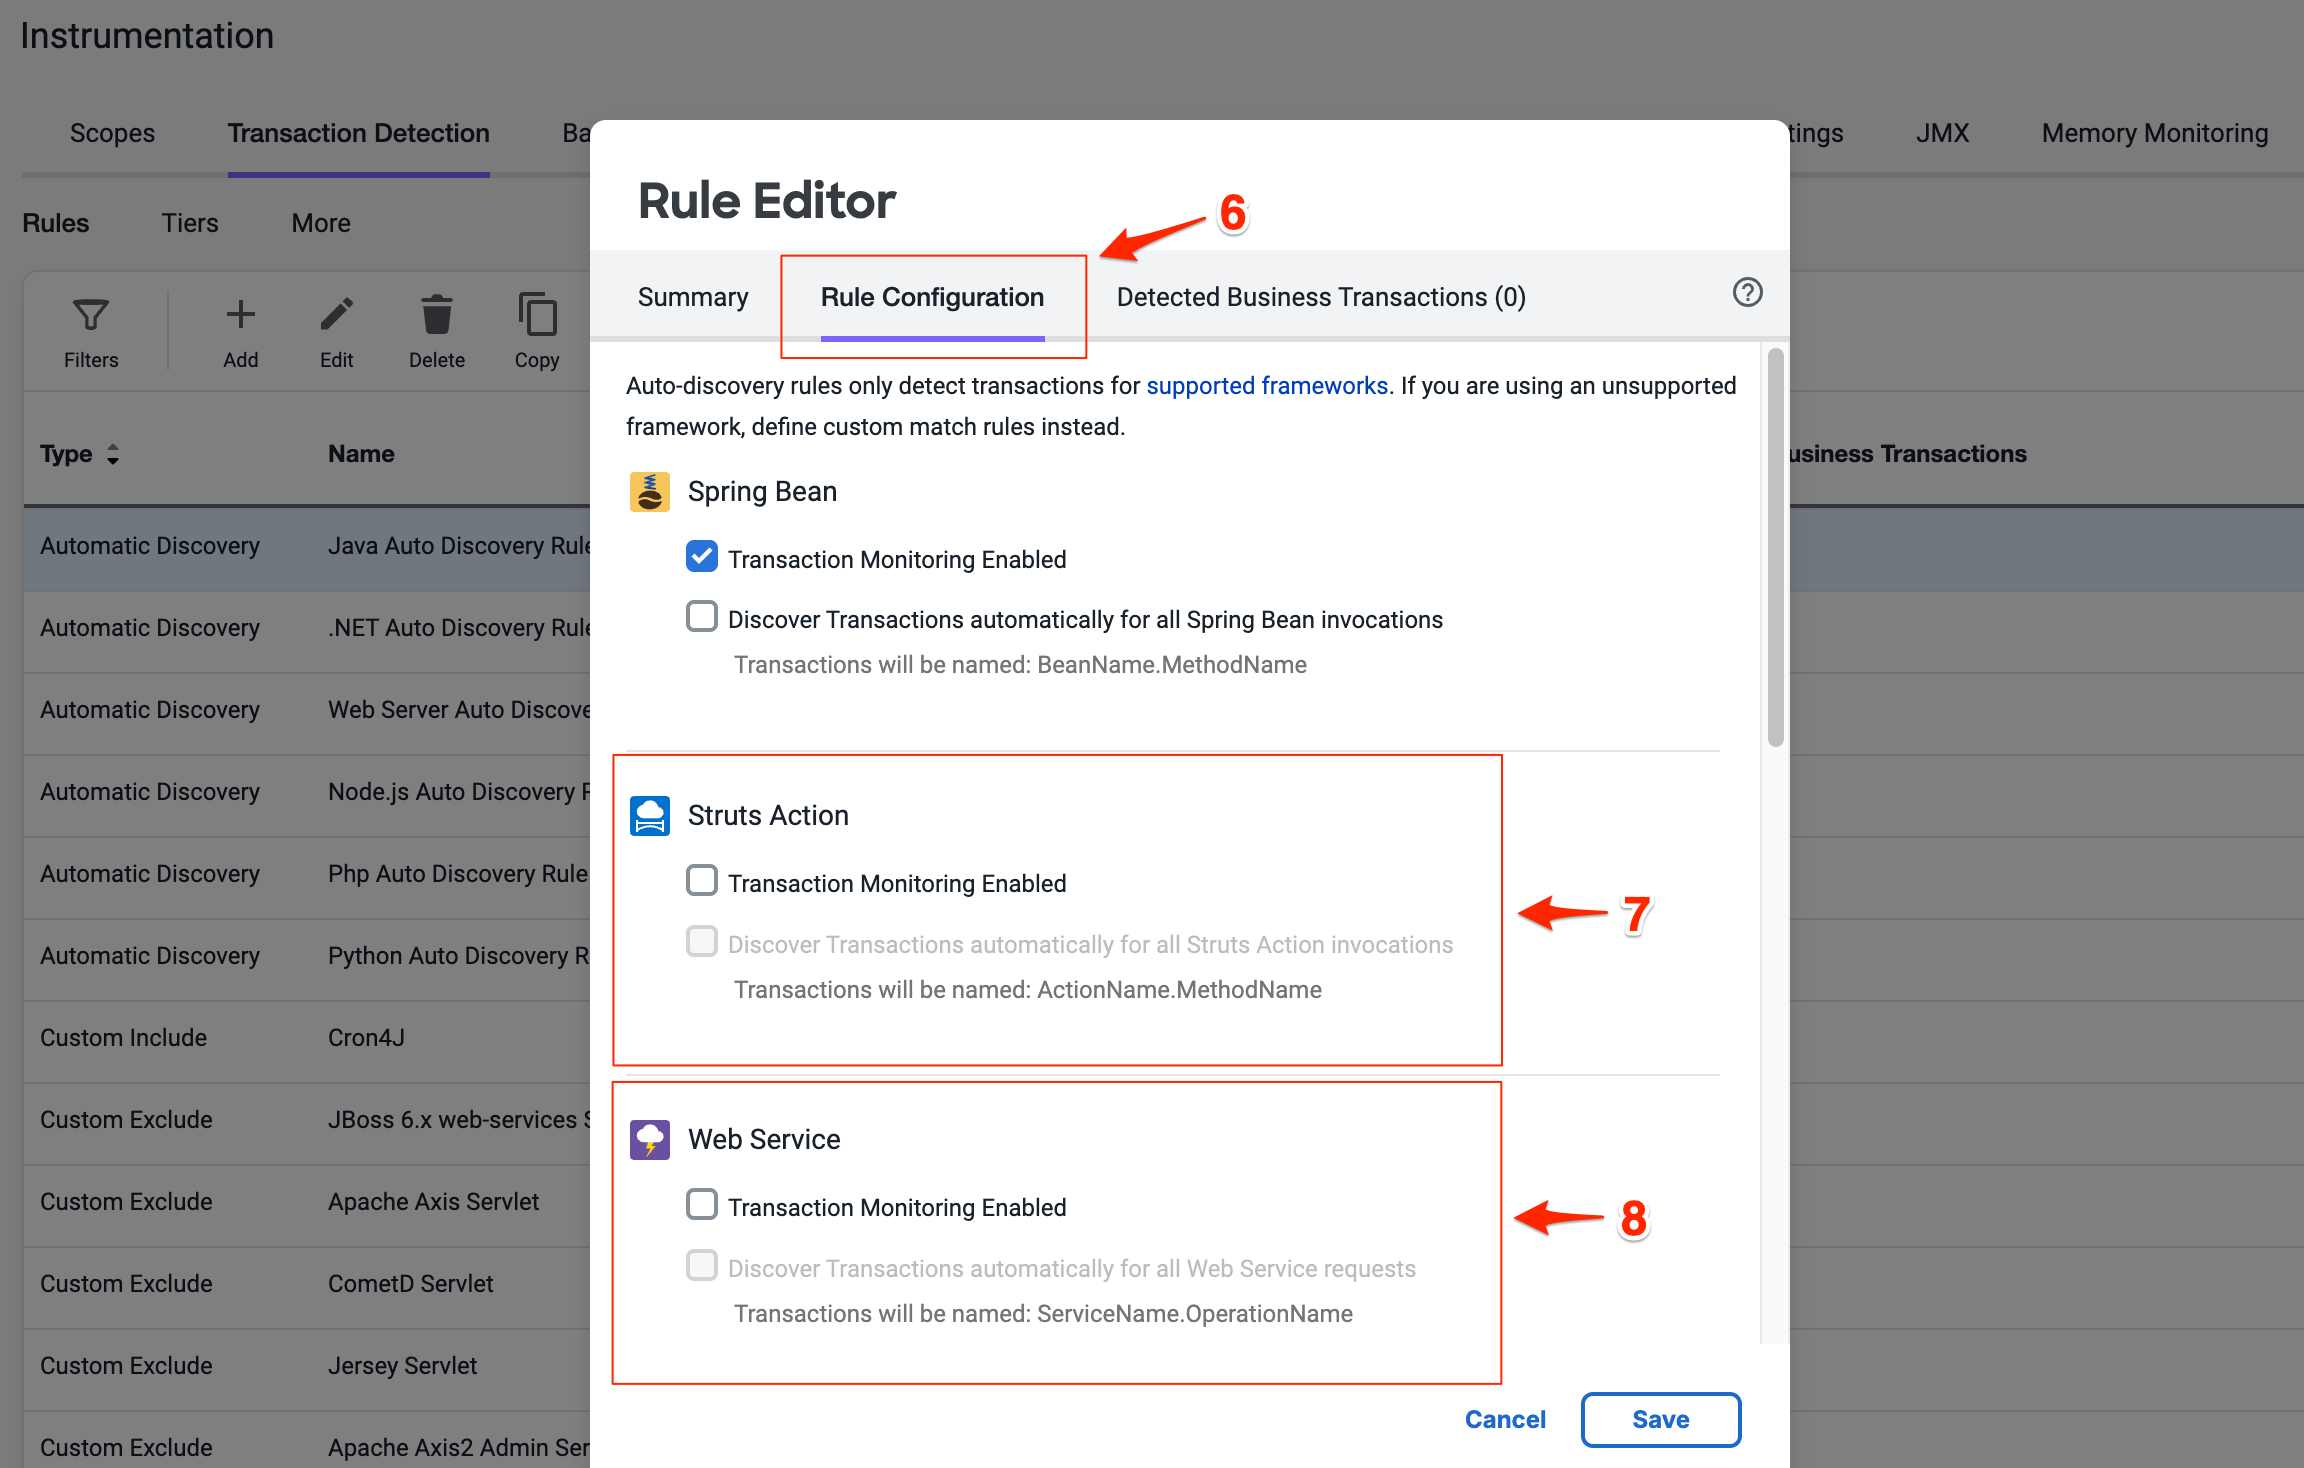
Select the Rule Configuration tab on the Rule Editor.
Uncheck all the boxes on Struts Action section.
Uncheck all the boxes on Web Service section.
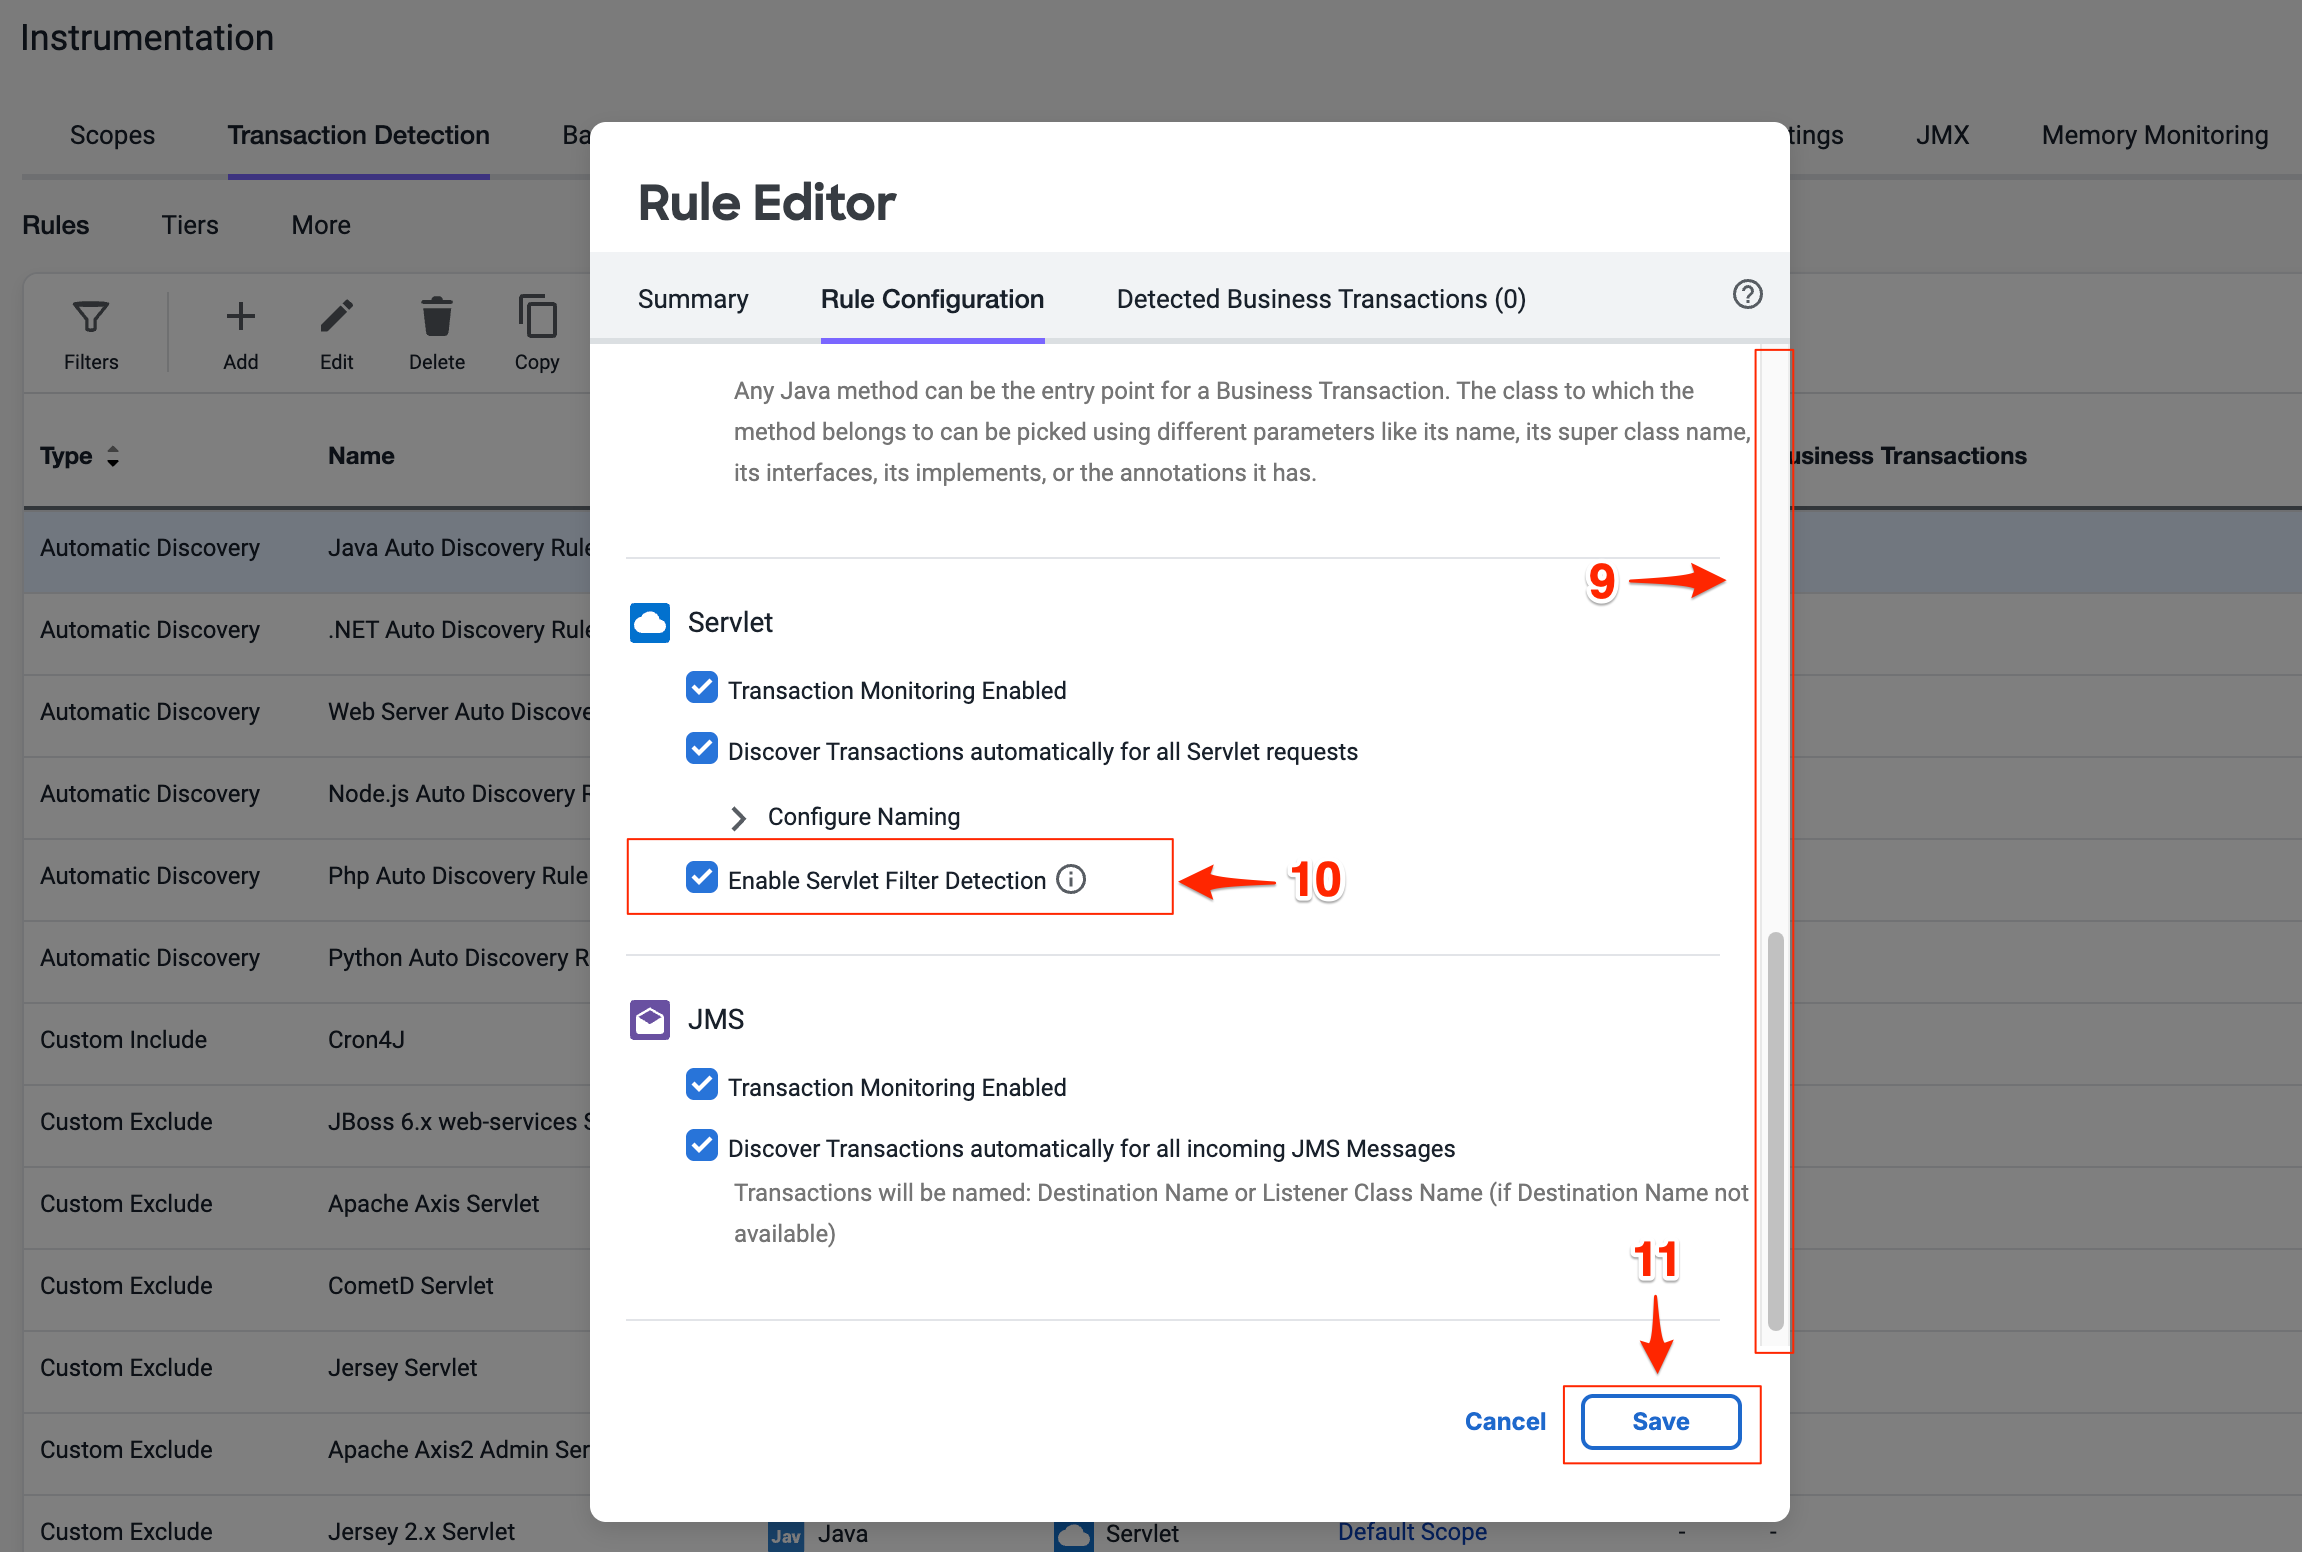
Scroll down to find the Servlet settings.
Check the box Enable Servlet Filter Detection (all three boxes should be checked on Servlet settings).
Click Save to save your changes.
You can read more about Transaction Detection Rules here.
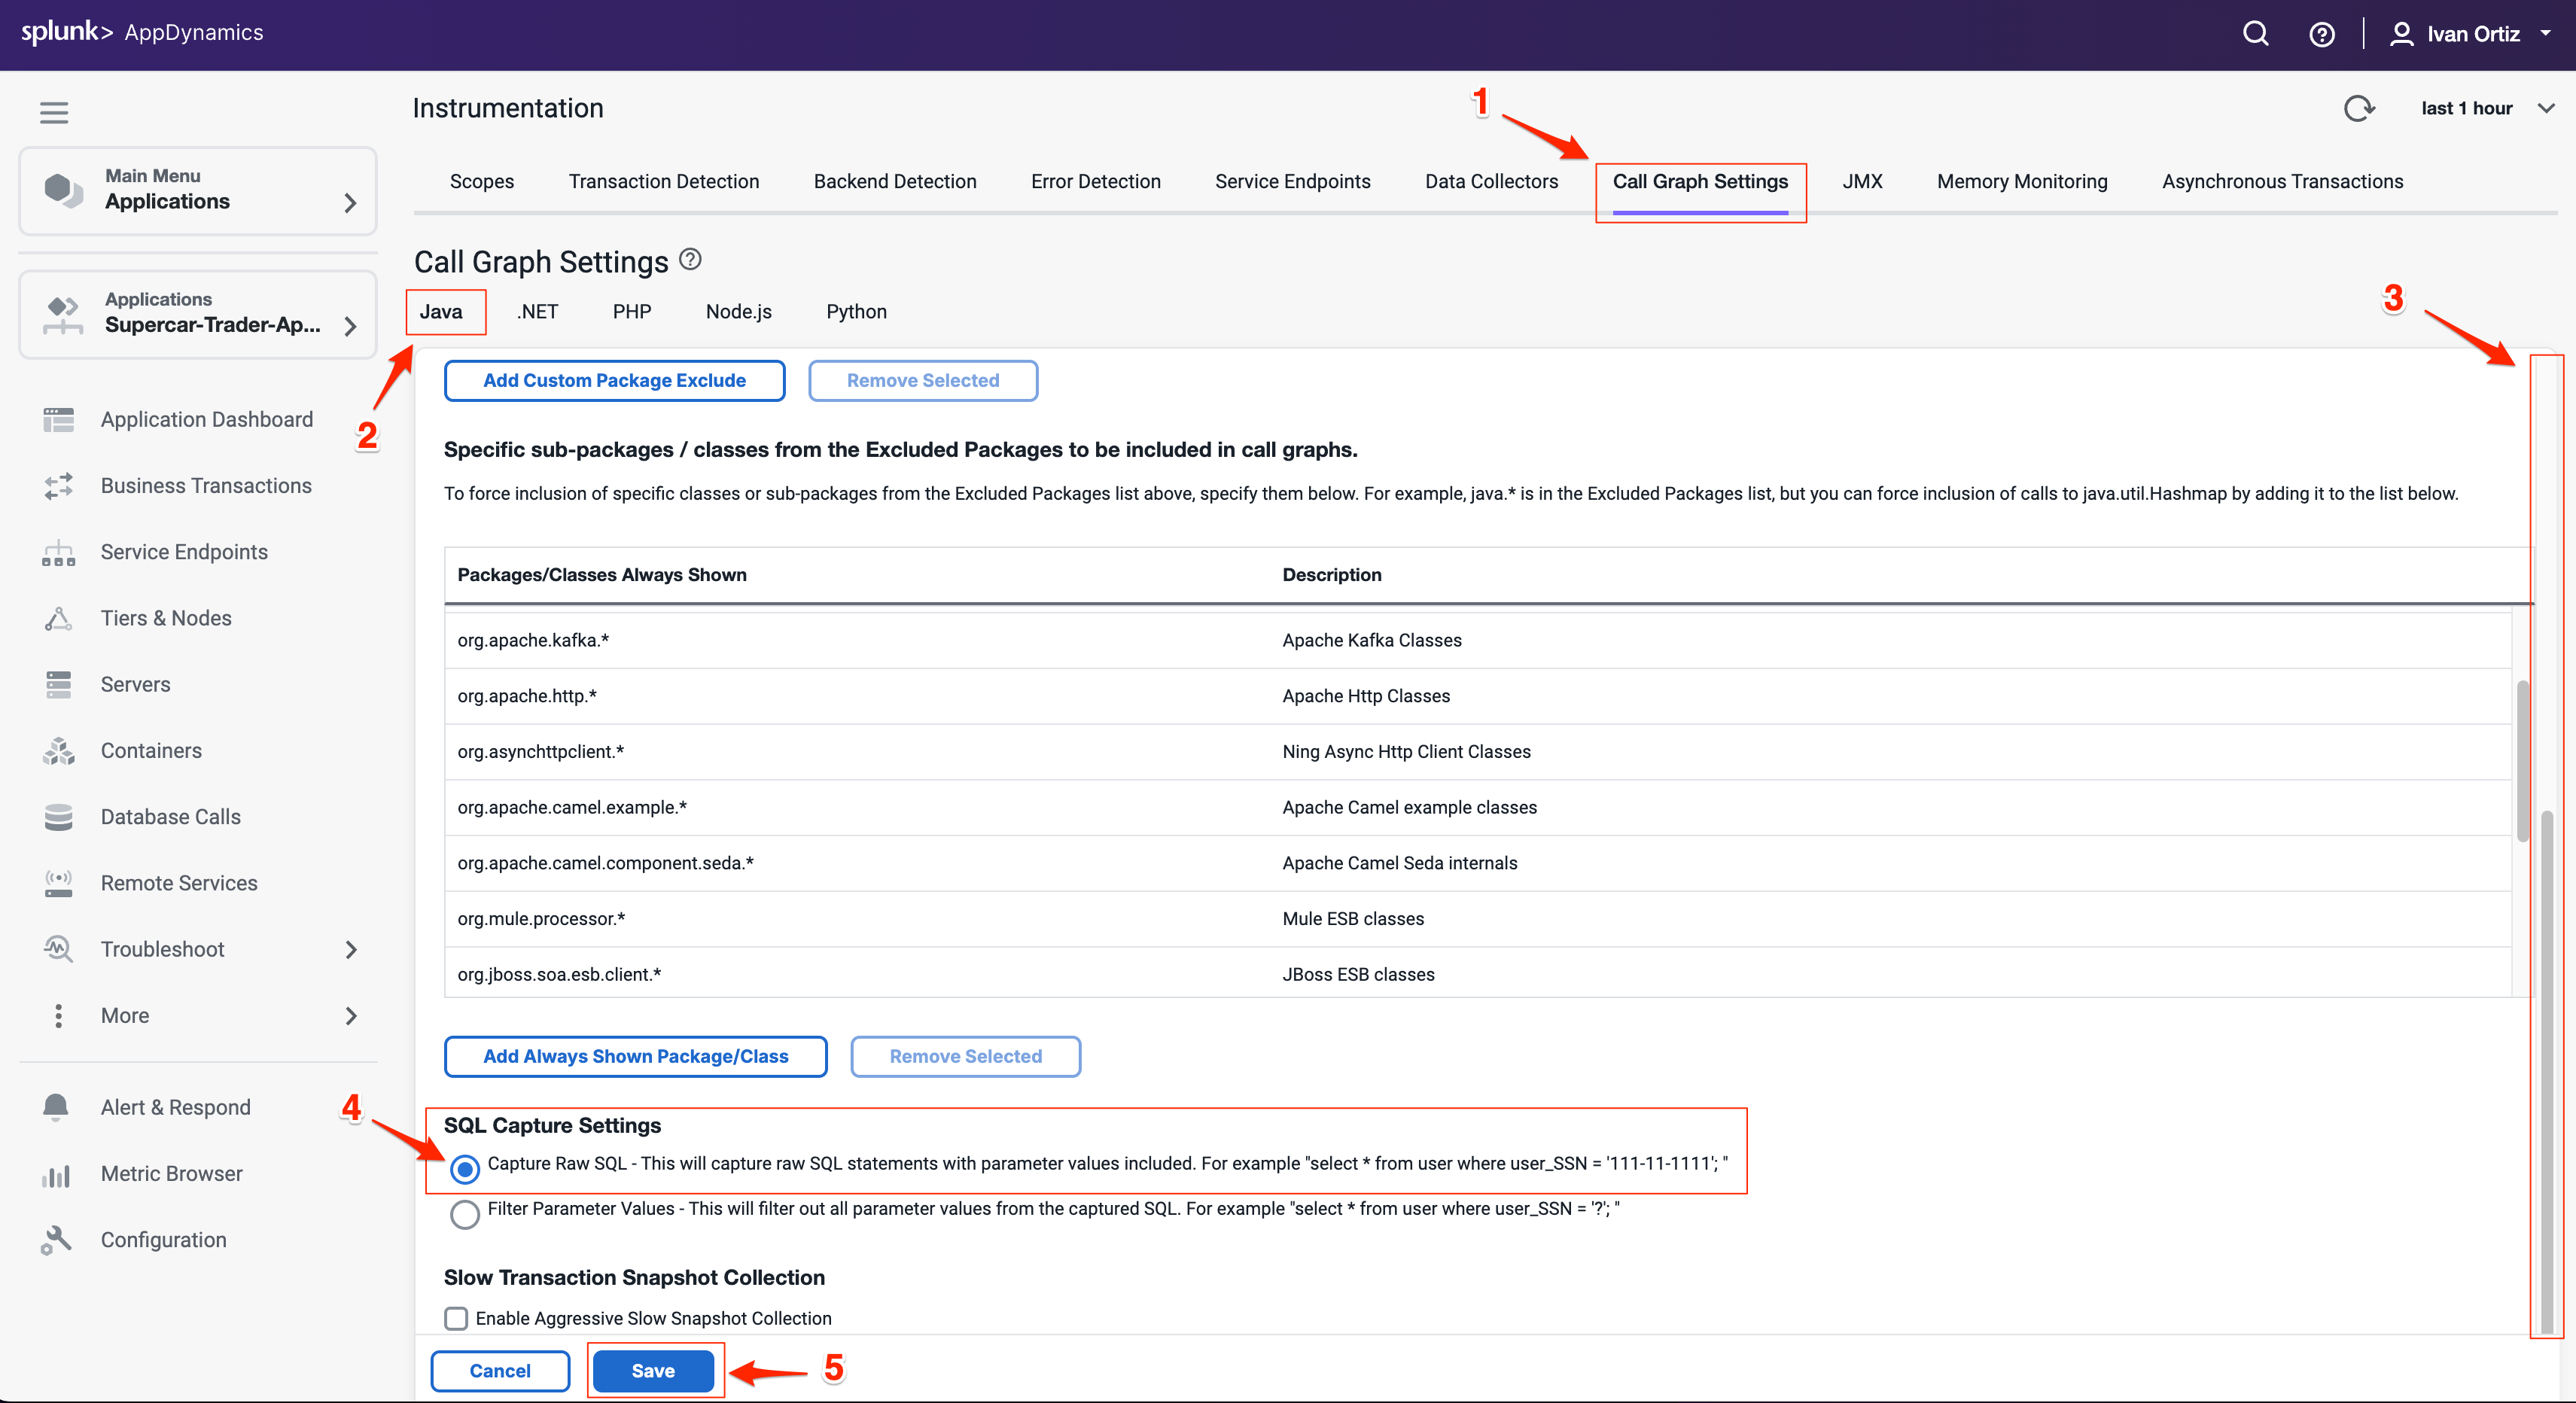
Adjust Call Graph settings
You can control the data captured in call graphs within transaction snapshots with the Call Graph Settings window seen below. In this step you will change the SQL Capture settings so the parameters of each SQL query are captured along with the full query. You can change the SQL Capture settings by following these steps.
Select the Call Graph Settings tab from the Instrumentation window. This is within the Instrumentation settings which we navigated to from the previous exercise.
Ensure you have the Java tab selected within the settings.
Scroll down until you see the SQL Capture Settings.
It may take up to 30 minutes for the new business transactions to replace the prior transactions. The list of business transactions should look like the following example after the new transactions are detected.
Click on Business Transactions on the left menu.
Adjust your time range picker to look at the last 15 minutes
6. Troubleshooting Slow Transactions
In this exercise you will complete the following tasks:
Monitor the application dashboard and flow map.
Troubleshoot a slow transaction snapshot.
Monitor the application dashboard and flow map
In the previous exercises we looked at some of the basic features of the Application Flow Map. Let’s take a deeper look at how we can use the Application Dashboard and Flow Map to immediately identify issues within the application.
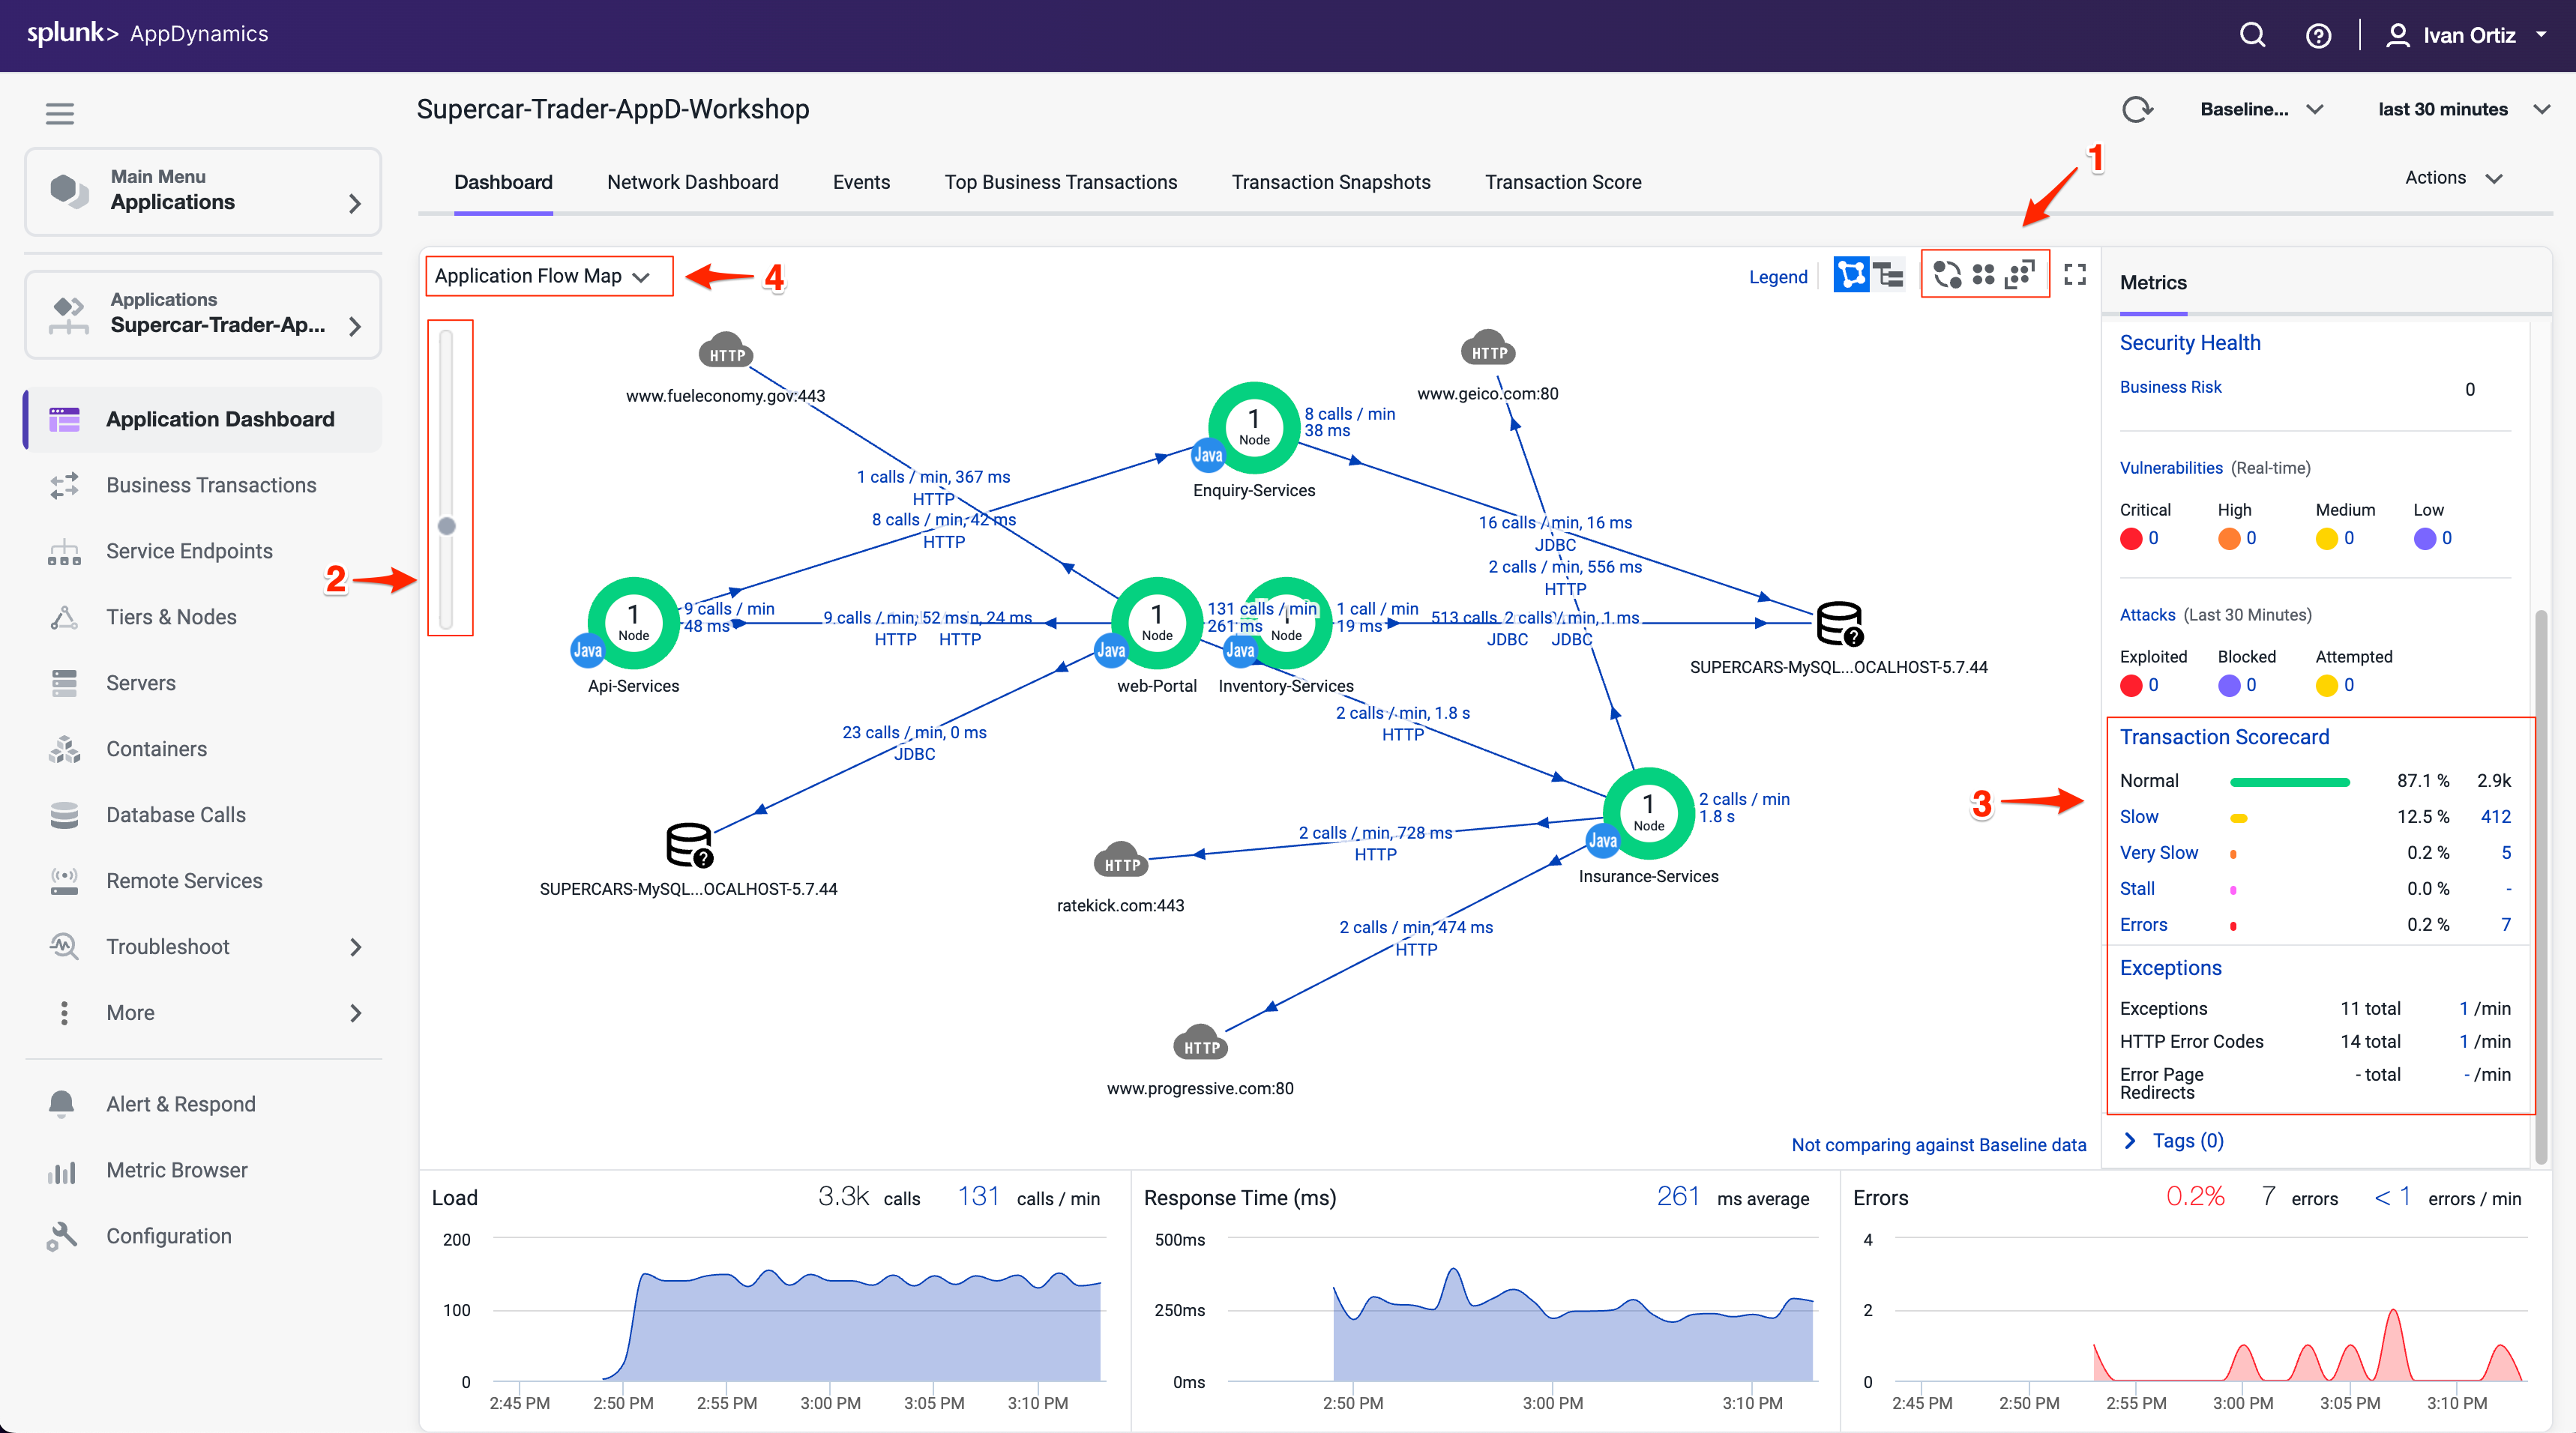
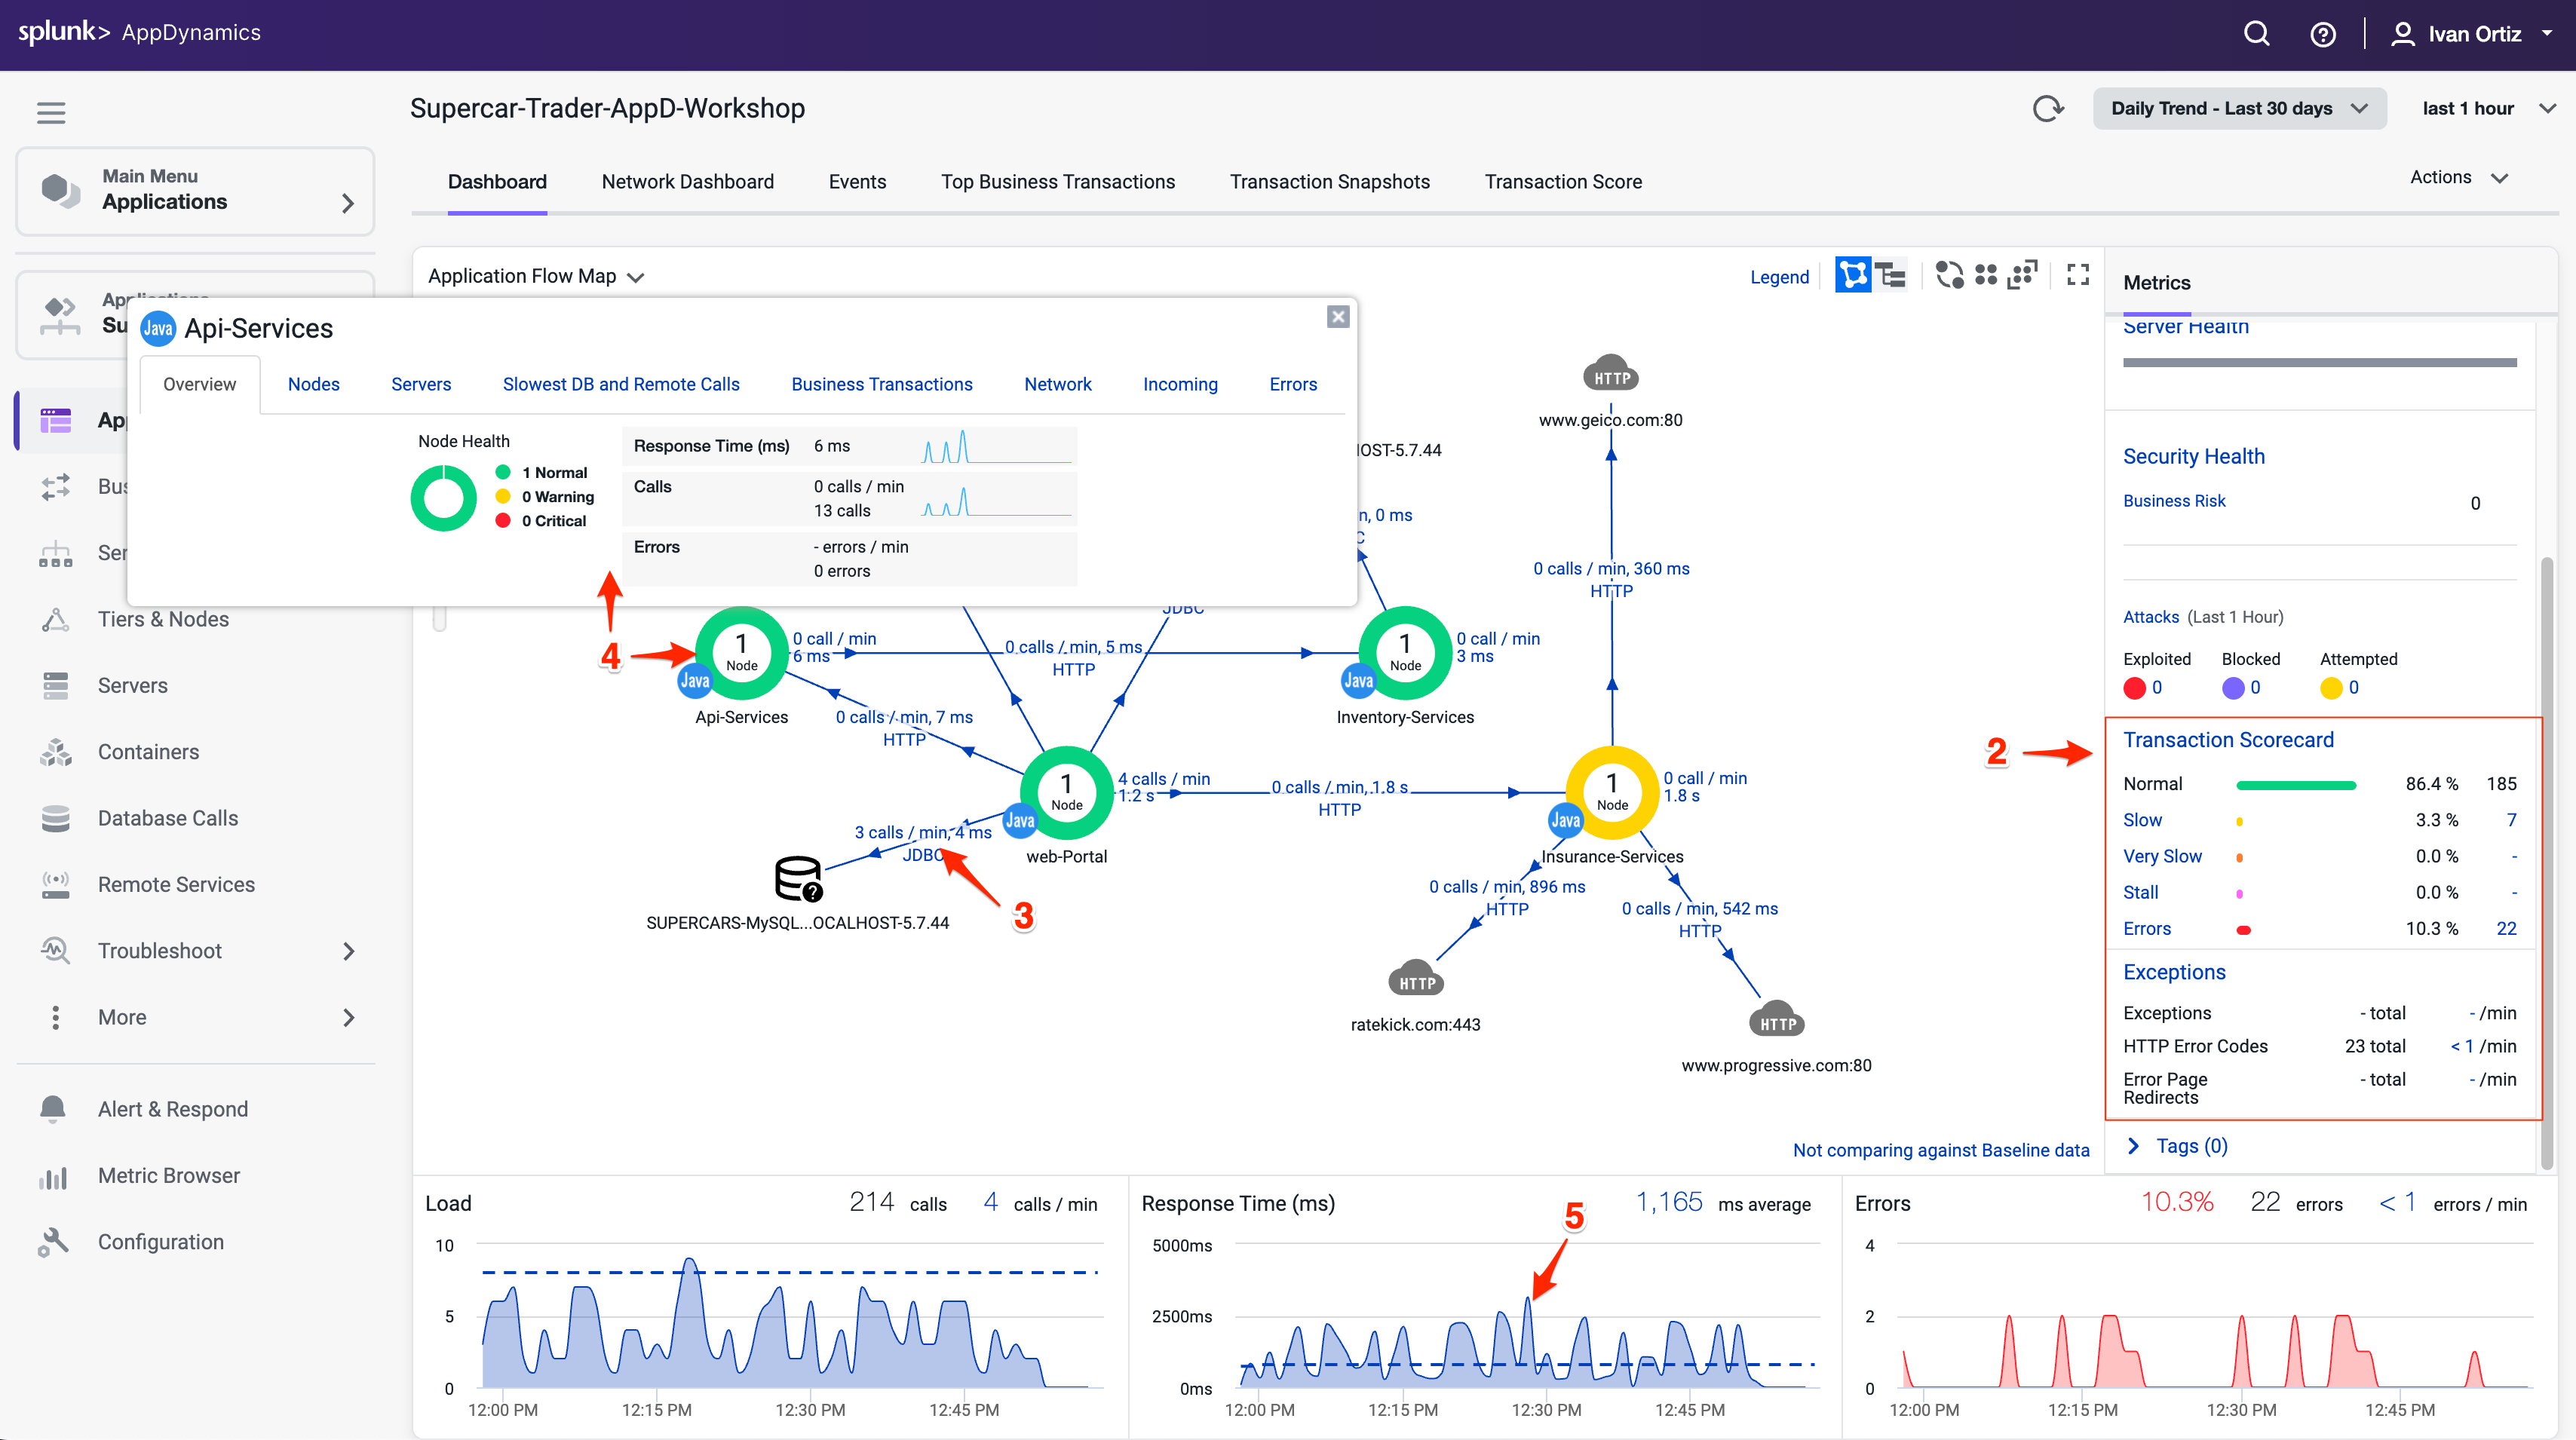
Health Rule Violations, Node Health issues, and the health of the Business Transactions will always show up in this area for the time frame you have selected. You can click the links available here to drill down to the details.
The Transaction Scorecard shows you the number and percentage of transactions that are normal, slow, very slow, stalled, and have errors. The scorecard also gives you the high level categories of exception types. You can click the links available here to drill down to the details.
Left-click (single-click) on any of the blue lines connecting the different application components to bring up an overview of the interactions between the two components.
Left-click (single-click) within the colored ring of a Tier to bring up detailed information about that Tier while remaining on the Flow Map.
Hover over the time series on one of the three charts at the bottom of the dashboard (Load, Response Time, Errors) to see the detail of the recorded metrics.
Now let’s take look at Dynamics Baselines and options for the charts at the bottom of the dashboard.
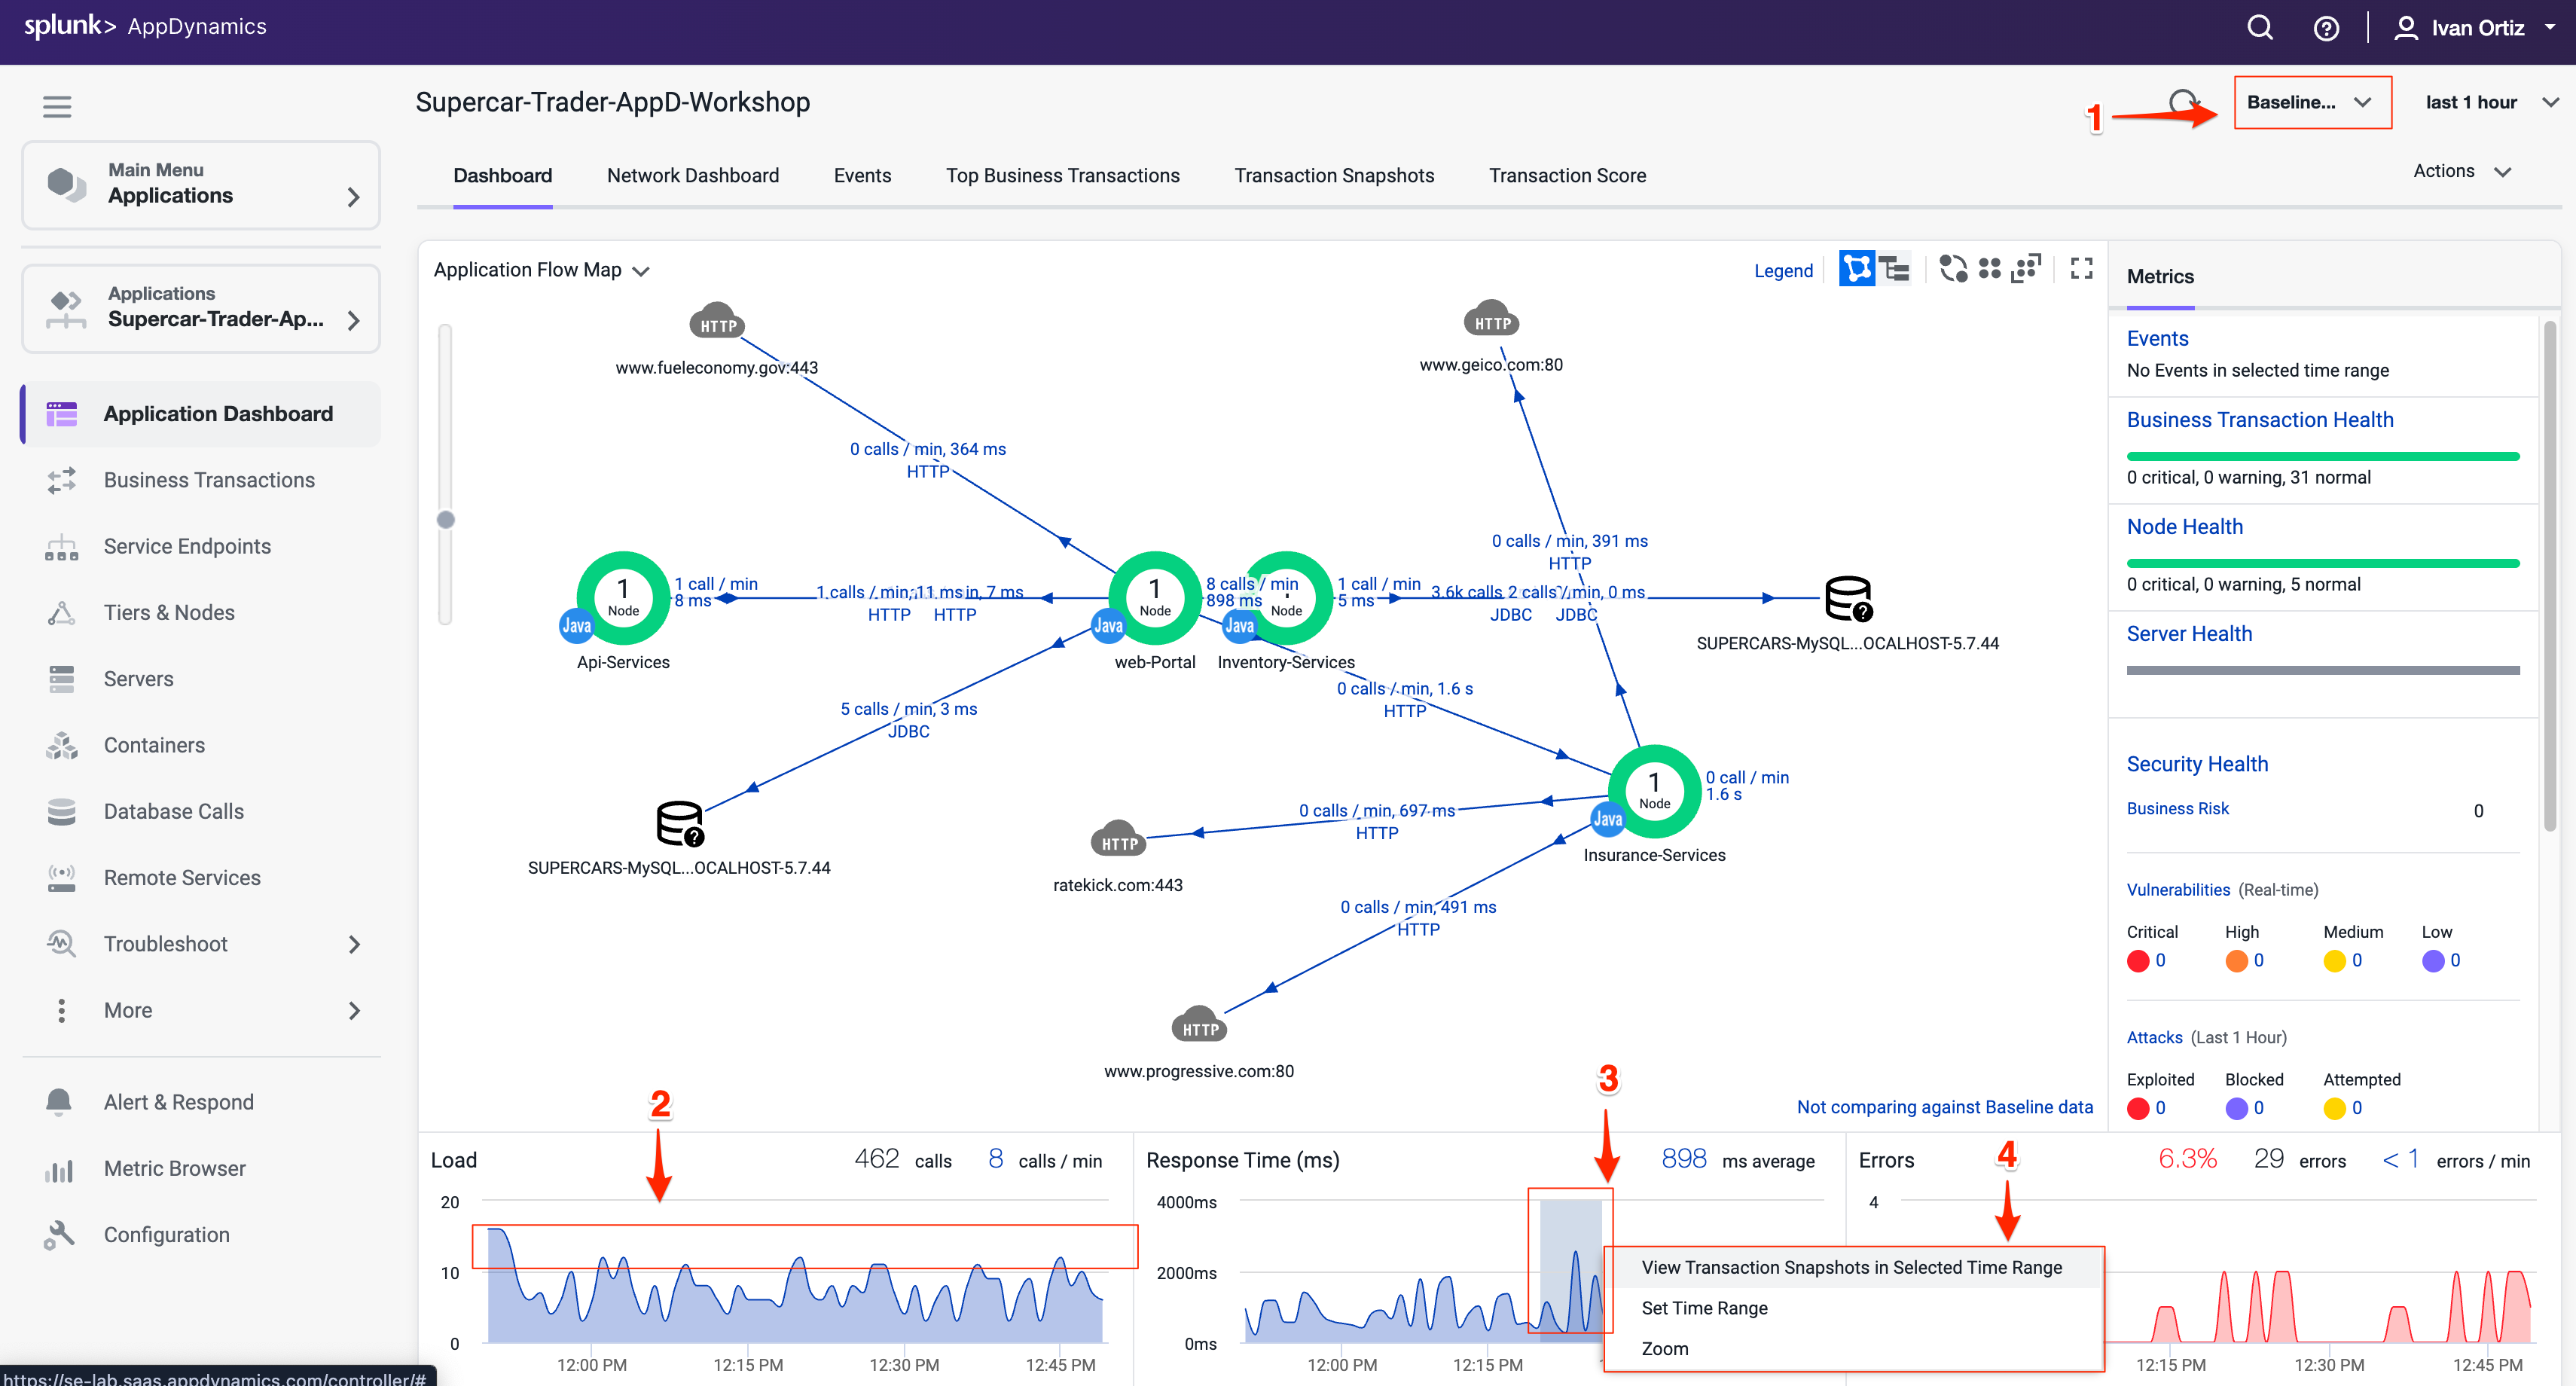
Compare the metrics on the charts to the Dynamic Baseline that has been automatically calculated for each of the metrics.
The Dynamic Baseline is shown in the load and response time charts as the blue dotted line seen in the following image.
Left-click and hold down your mouse button while dragging from left to right to highlight a spike seen in any of the three charts at the bottom of the dashboard.
Release your mouse button and select one of the three options in the pop-up menu.
The precision of AppDynamics unique Dynamic Baselining increases over time to provide you with an accurate picture of the state of your applications, their components, and their business transactions, so you can be proactively alerted before things get to a critical state and take action before your end users are impacted.
You can read more about AppDynamics Dynamic Baselines here.
Troubleshoot a slow transaction snapshot
Let’s look at our business transactions and find the one that has the highest number of very slow transactions by following these steps.
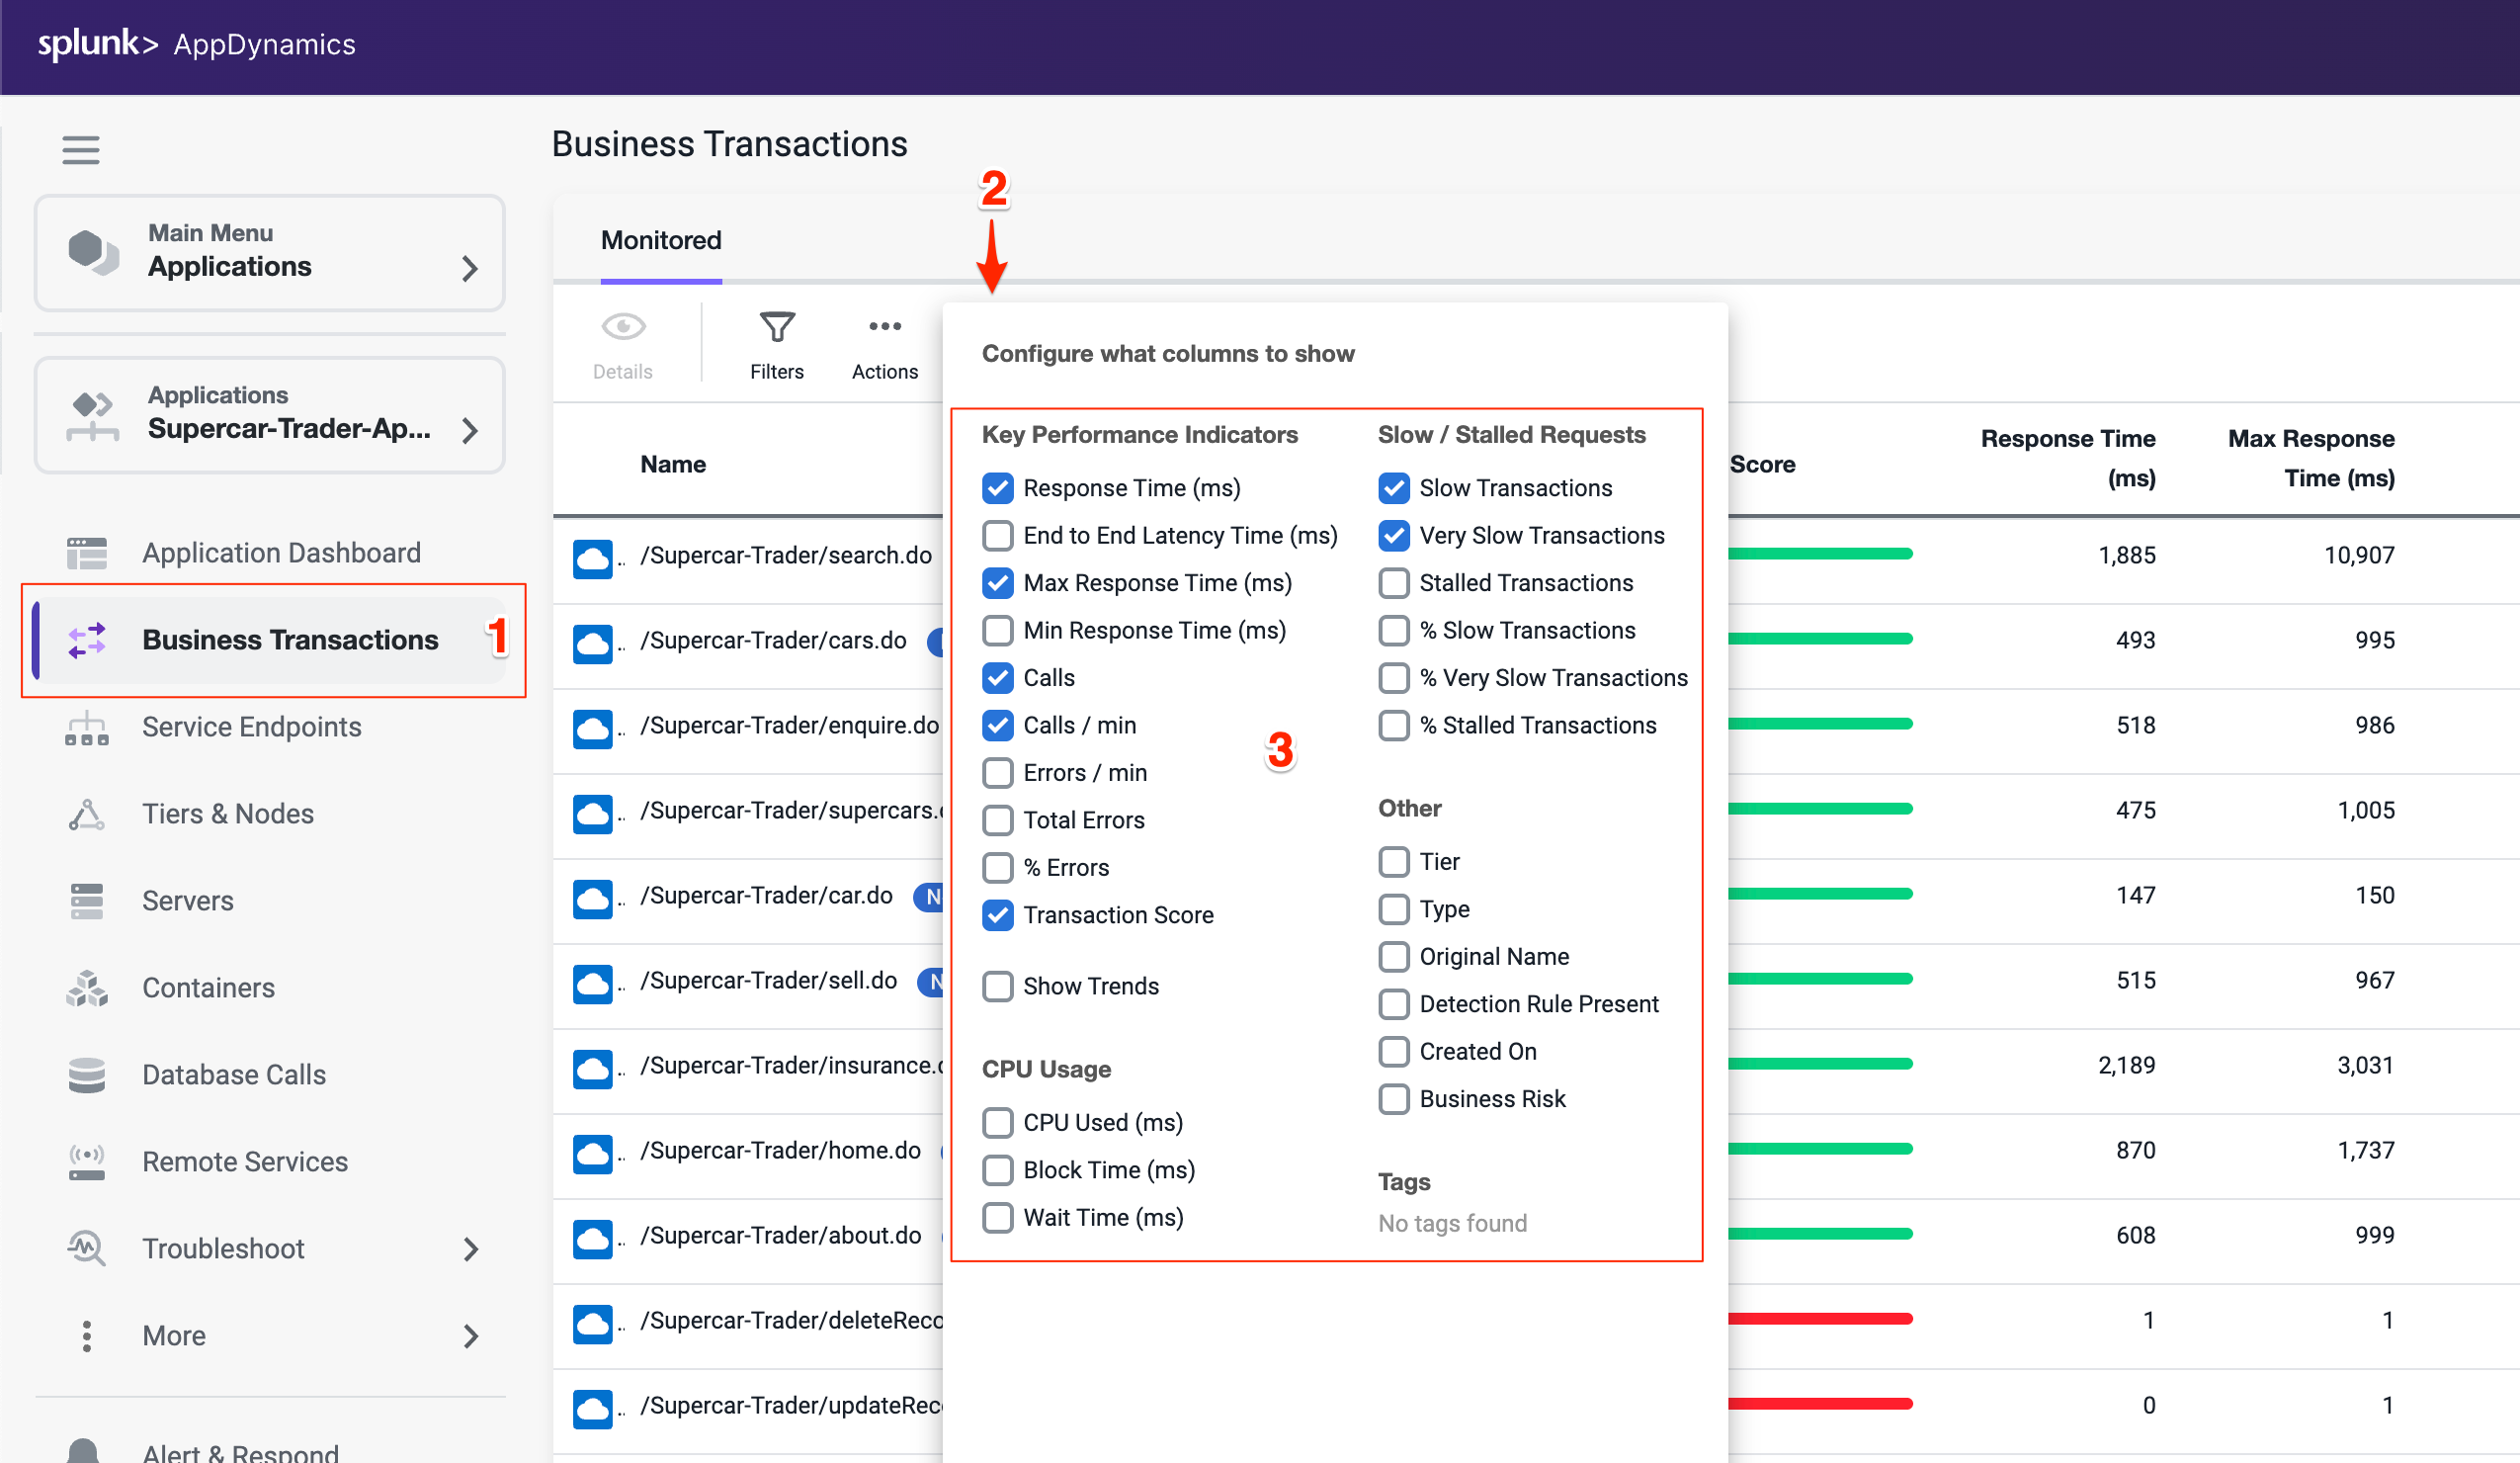
Click the Business Transactions option on the left menu.
Click the View Options button.
Check and uncheck the boxes on the options to match what you see in the following image:
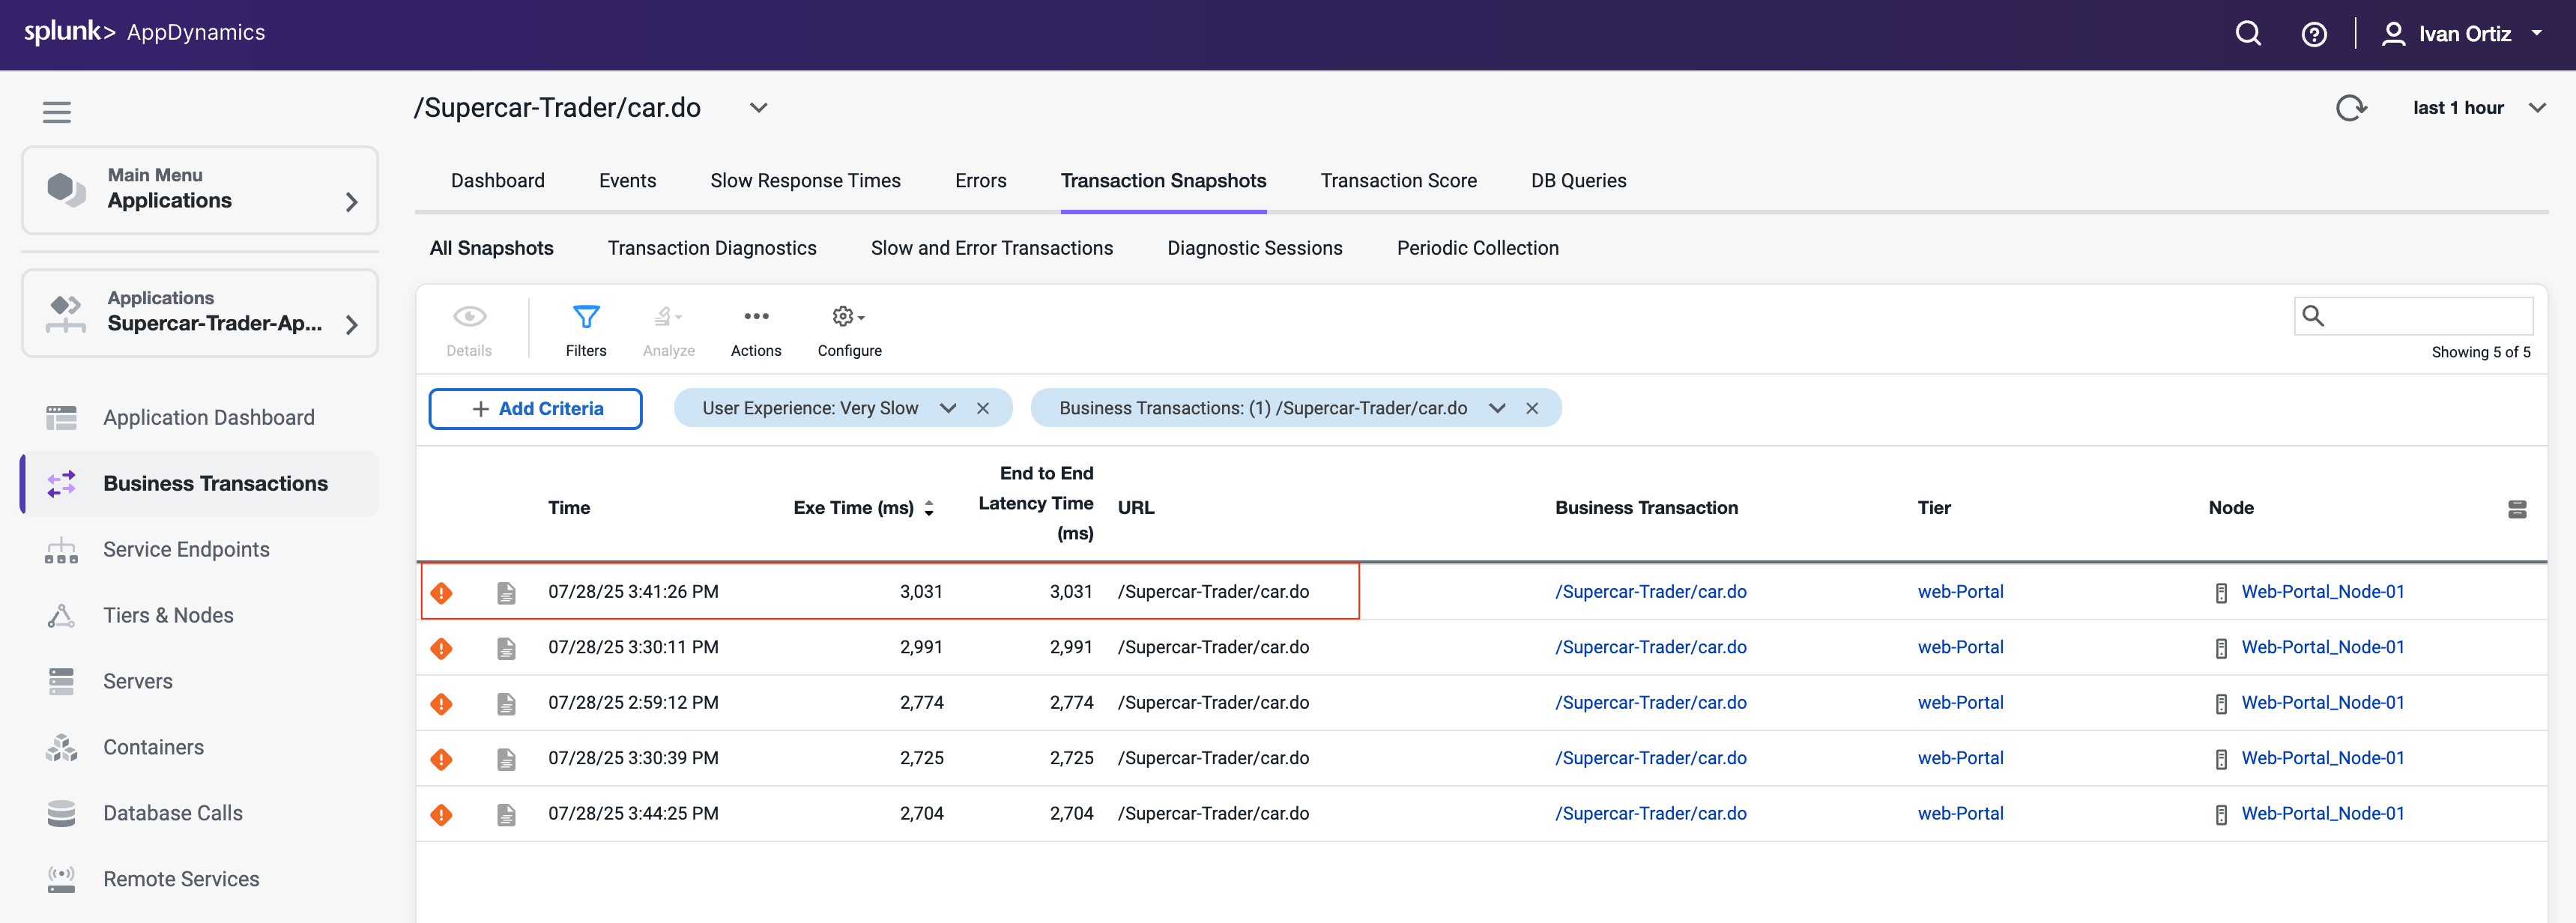
Find the Business Transaction named /Supercar-Trader/car.do and drill into the very slow transaction snapshots by clicking on the number of Very Slow Transactions for the business transaction.
Tip
If the /Supercar-Trader/car.do BT does not have any Very Slow Transactions, find a Business Transaction which has some and click in the number under that column. The screenshots may look slightly different moving forward but the concepts remain the same.
You should see the list of very slow transaction snapshots. Double-click on the snapshot that has the highest response time as seen below.
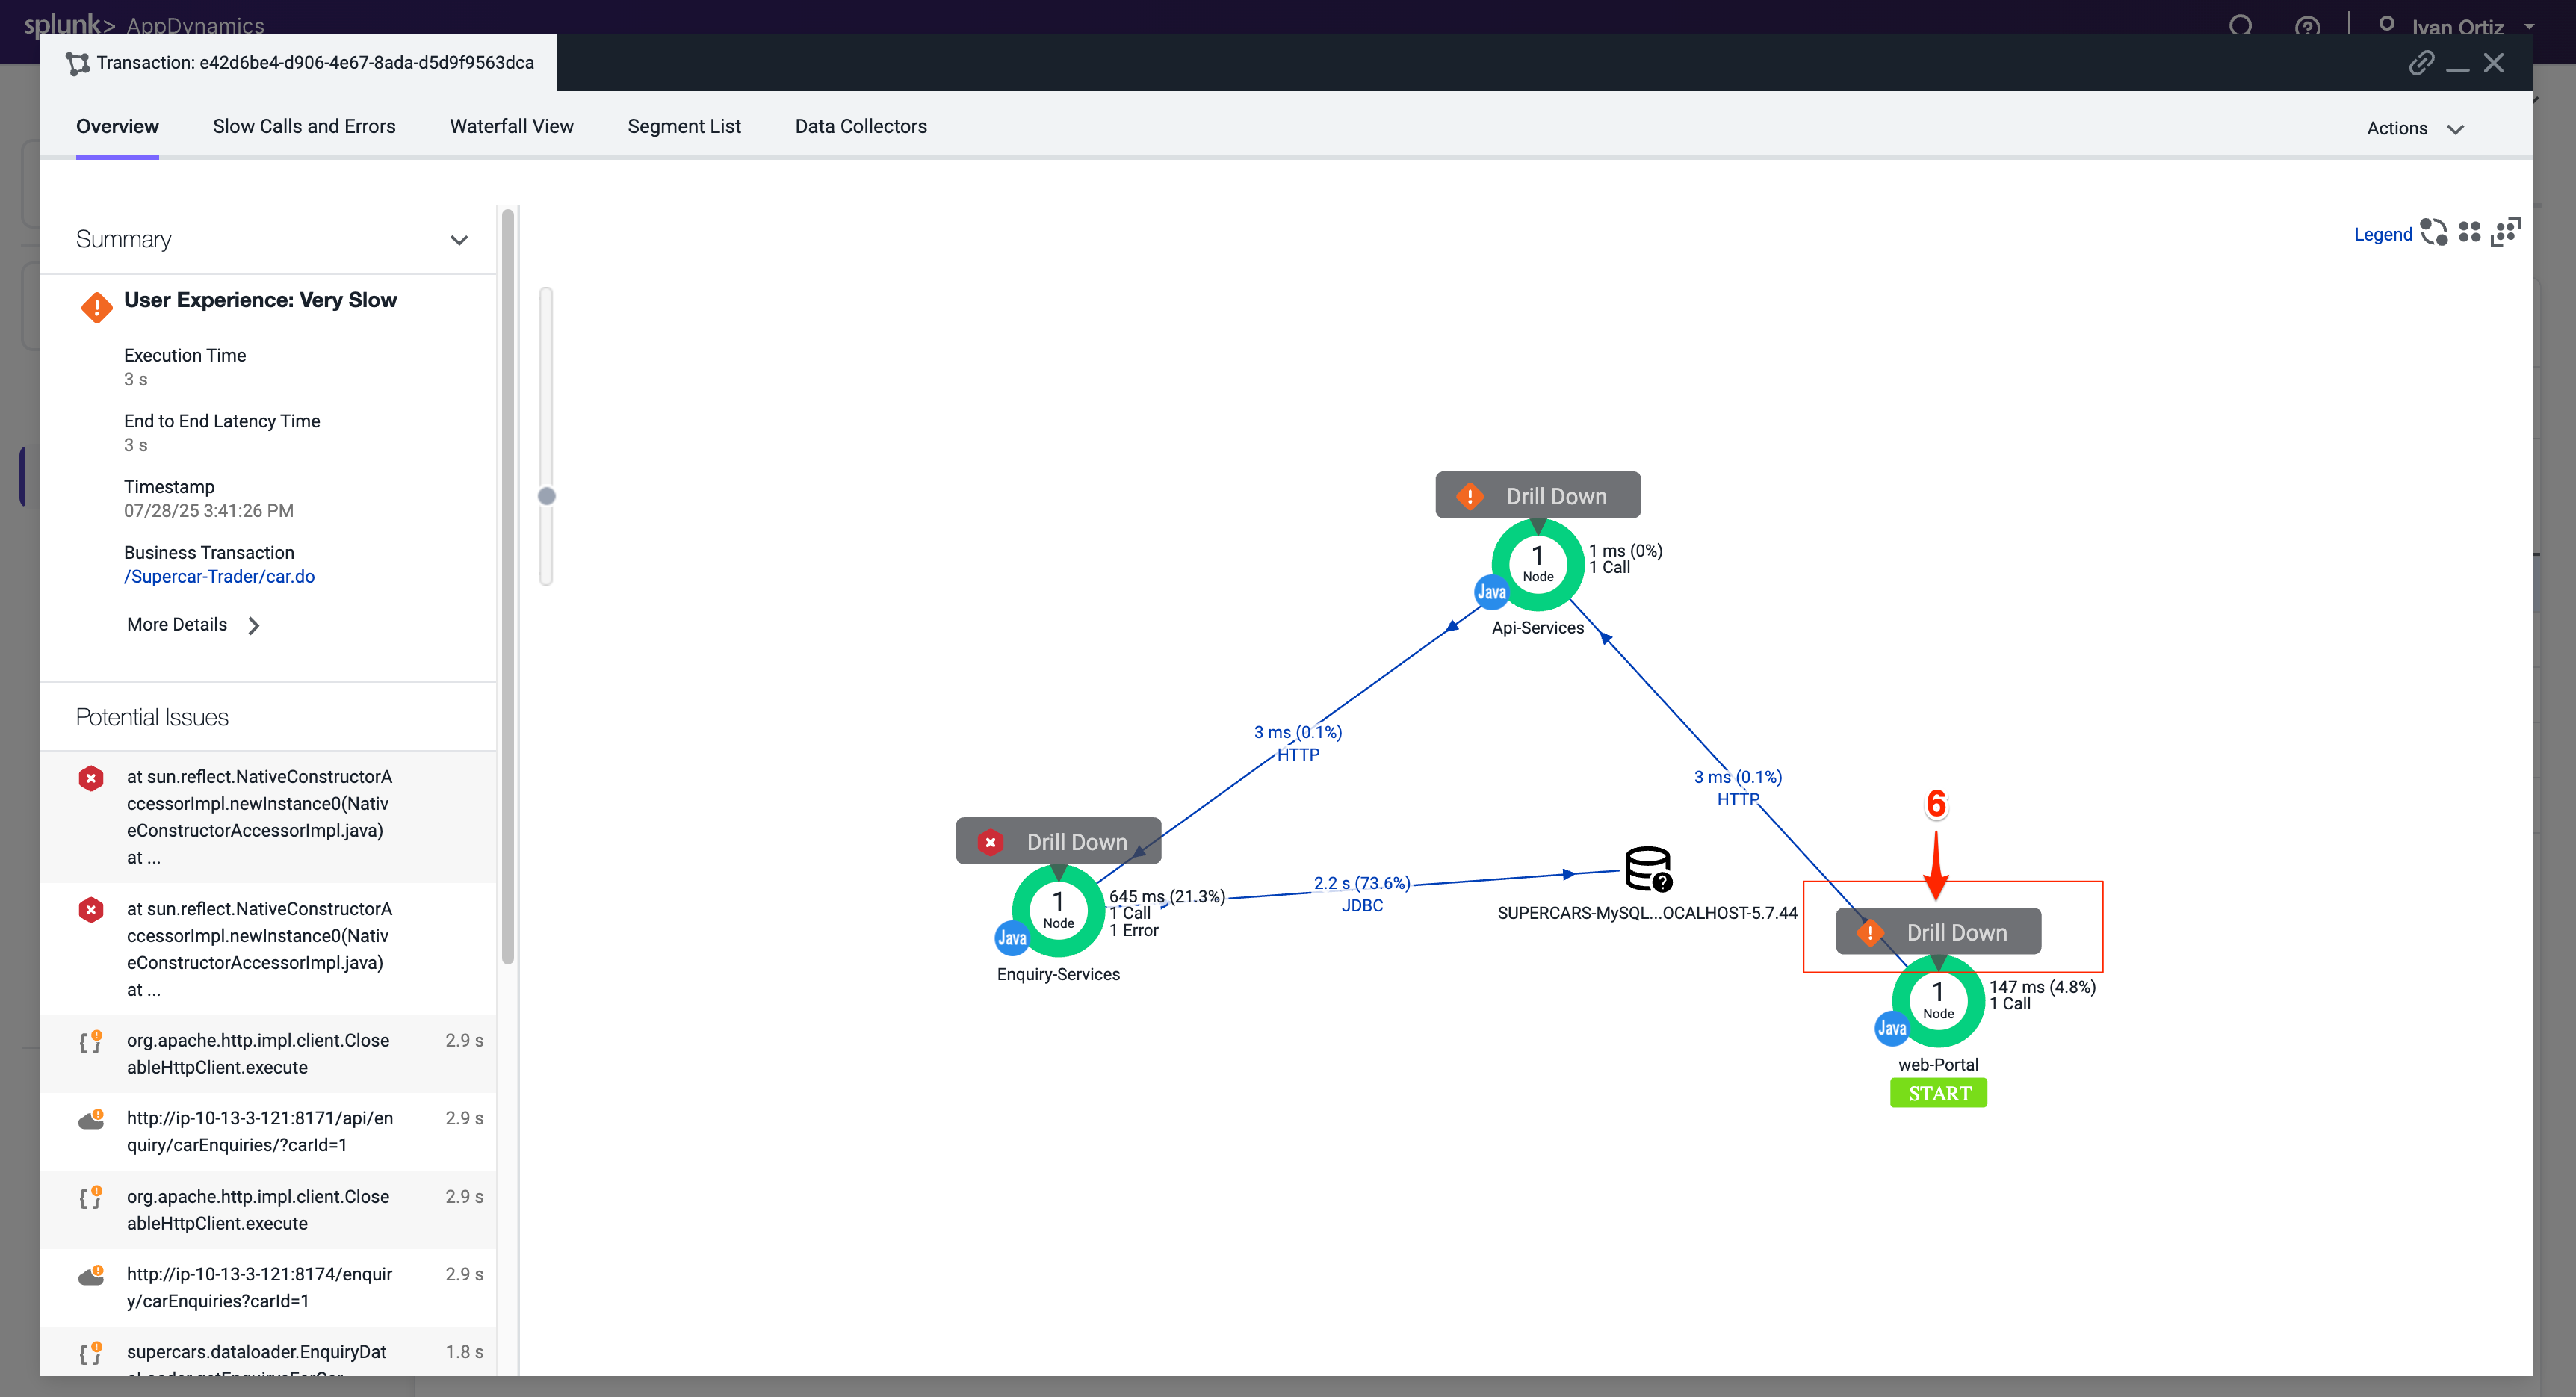
When the transaction snapshot viewer opens, we see the flow map view of all the components that were part of this specific transaction. This snapshot shows the transaction traversed through the components below in order.
The Web-Portal Tier.
The Api-Services Tier.
The Enquiry-Services Tier.
The MySQL Database.
The Potential Issues panel on the left highlights slow methods and slow remote services. While we can use the Potential Issues panel to drill straight into the call graph, we will use the Flow Map within the snapshot to follow the complete transaction in this example.
Click on Drill Down on the Web-Portal Tier shown on the Flow Map of the snapshot.
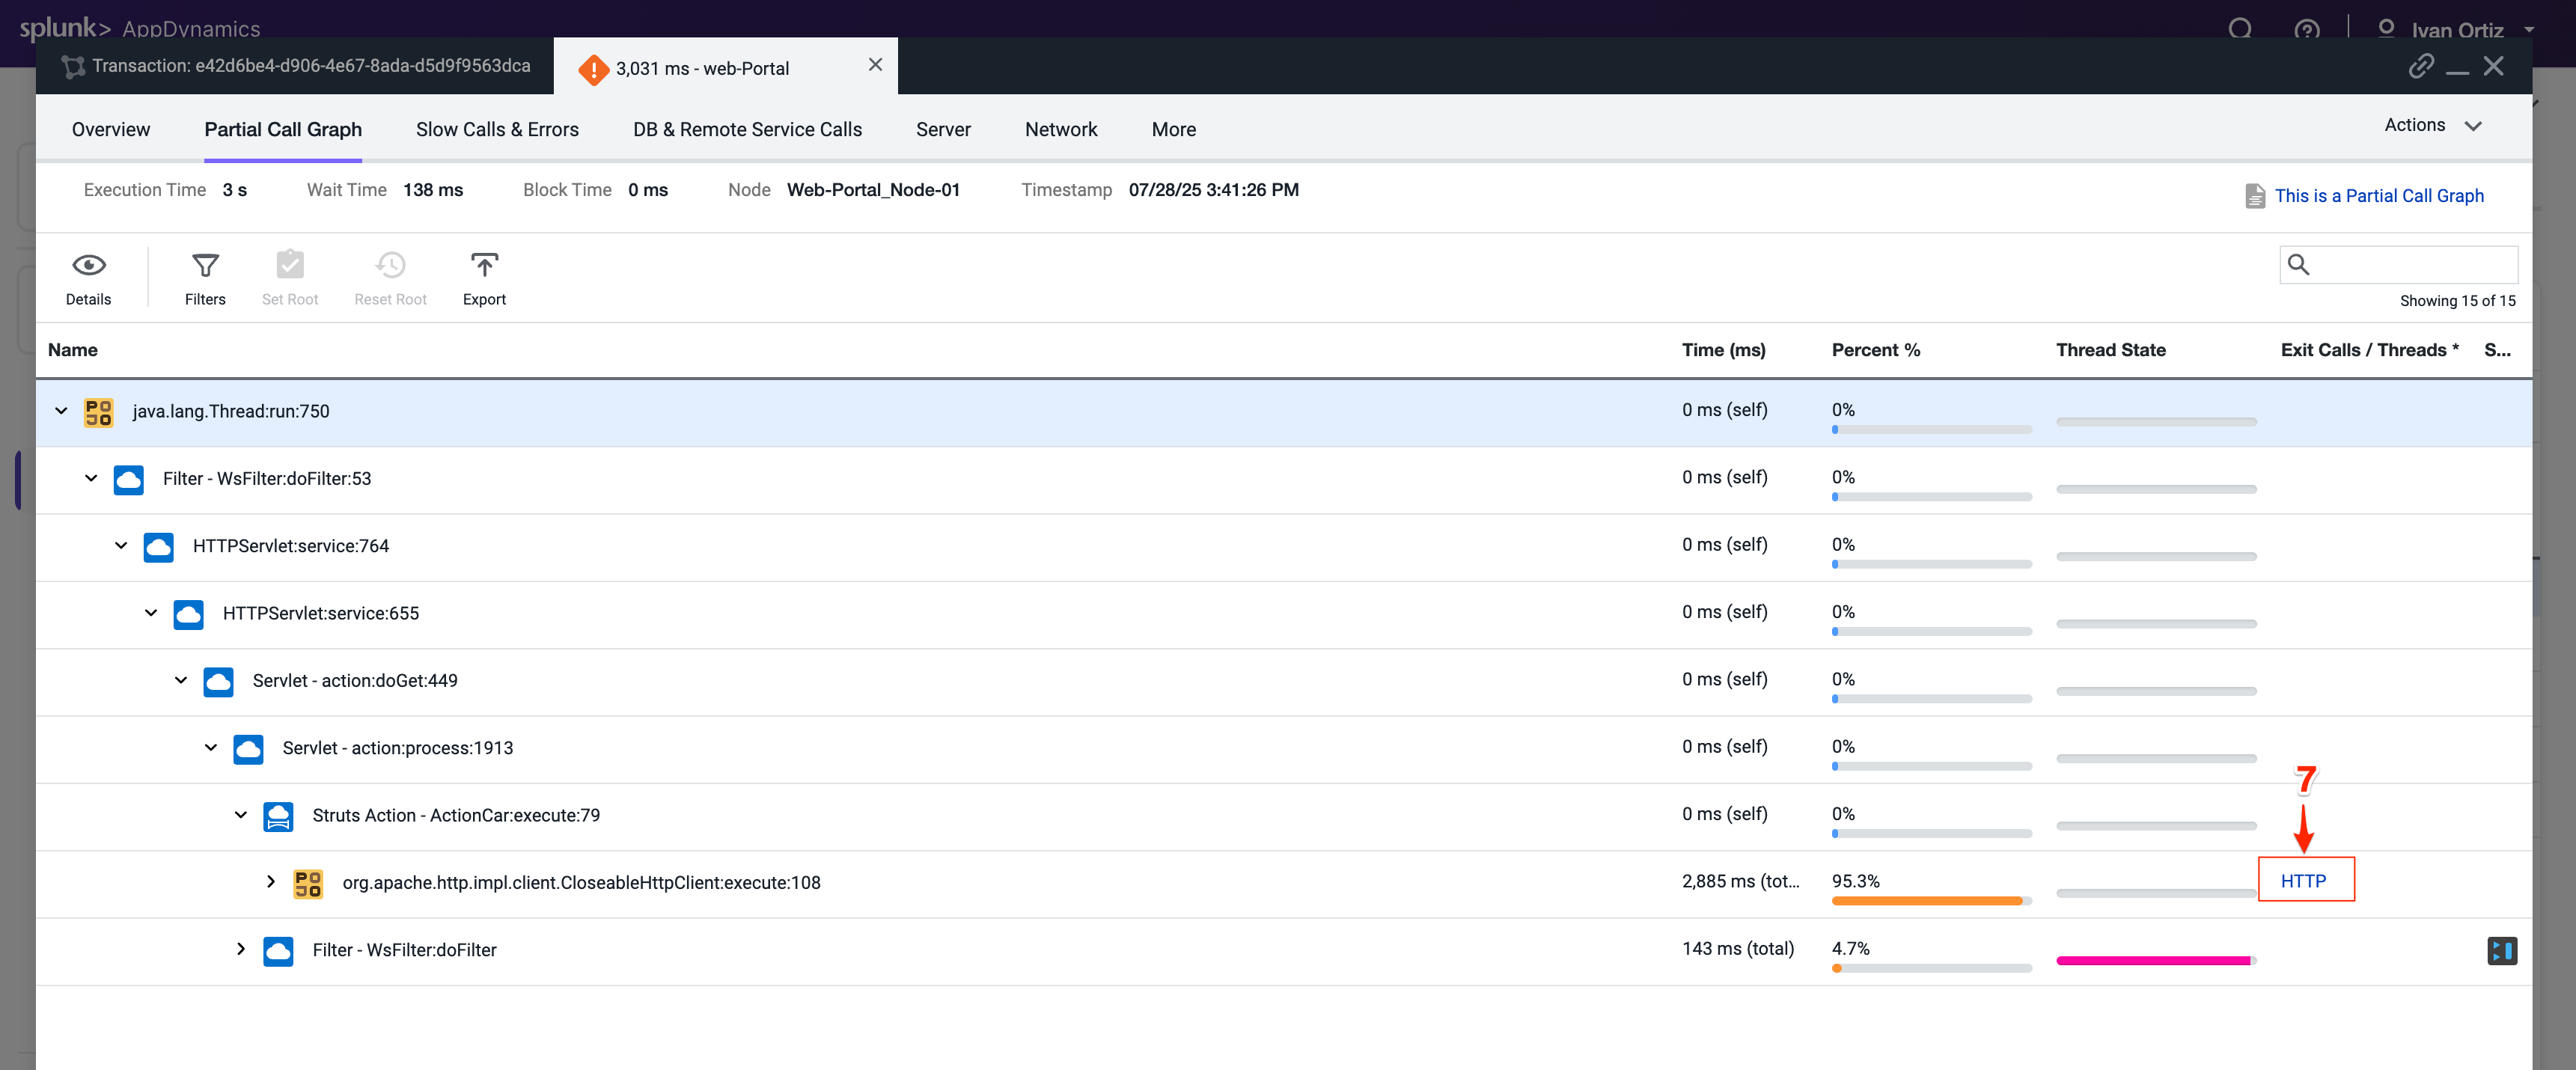
The tab that opens shows the call graph of the Web-Portal Tier. We can see that most of the time was from an outbound HTTP call.
Click on the block to drill down to the segment where the issue happening. Click the HTTP link to the details of the downstream call.
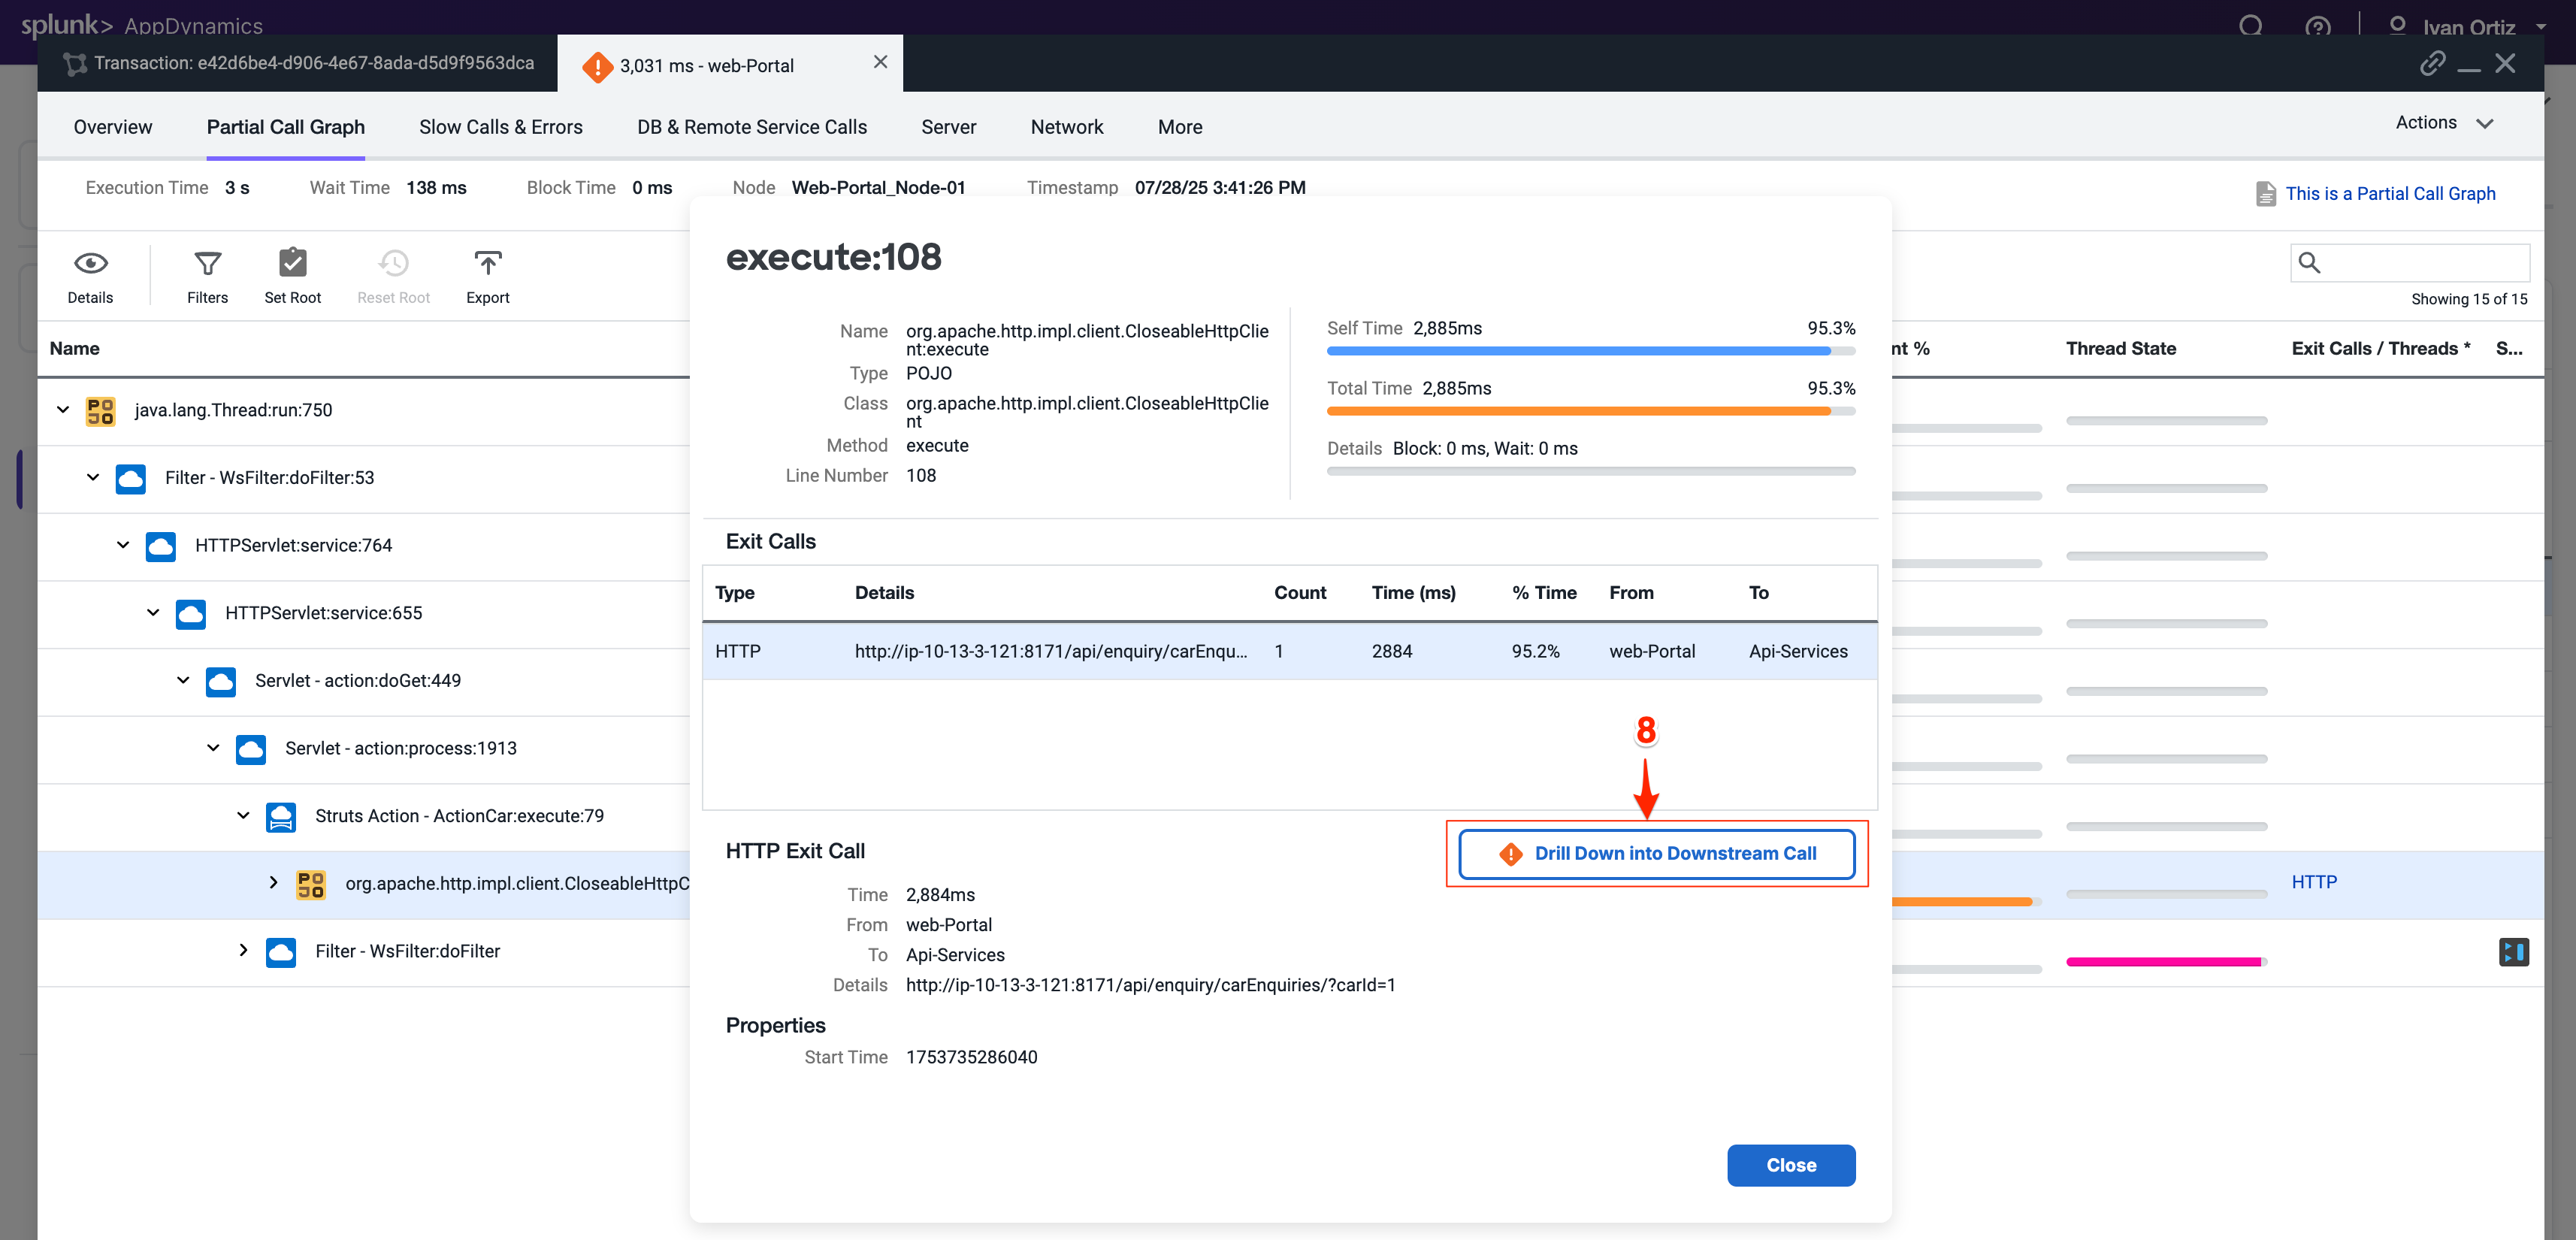
The detail panel for the downstream call shows that the Web-Portal Tier made an outbound HTTP call to the Api-Services Tier. Follow the HTTP call into the Api-Services Tier.
Click Drill Down into Downstream Call.
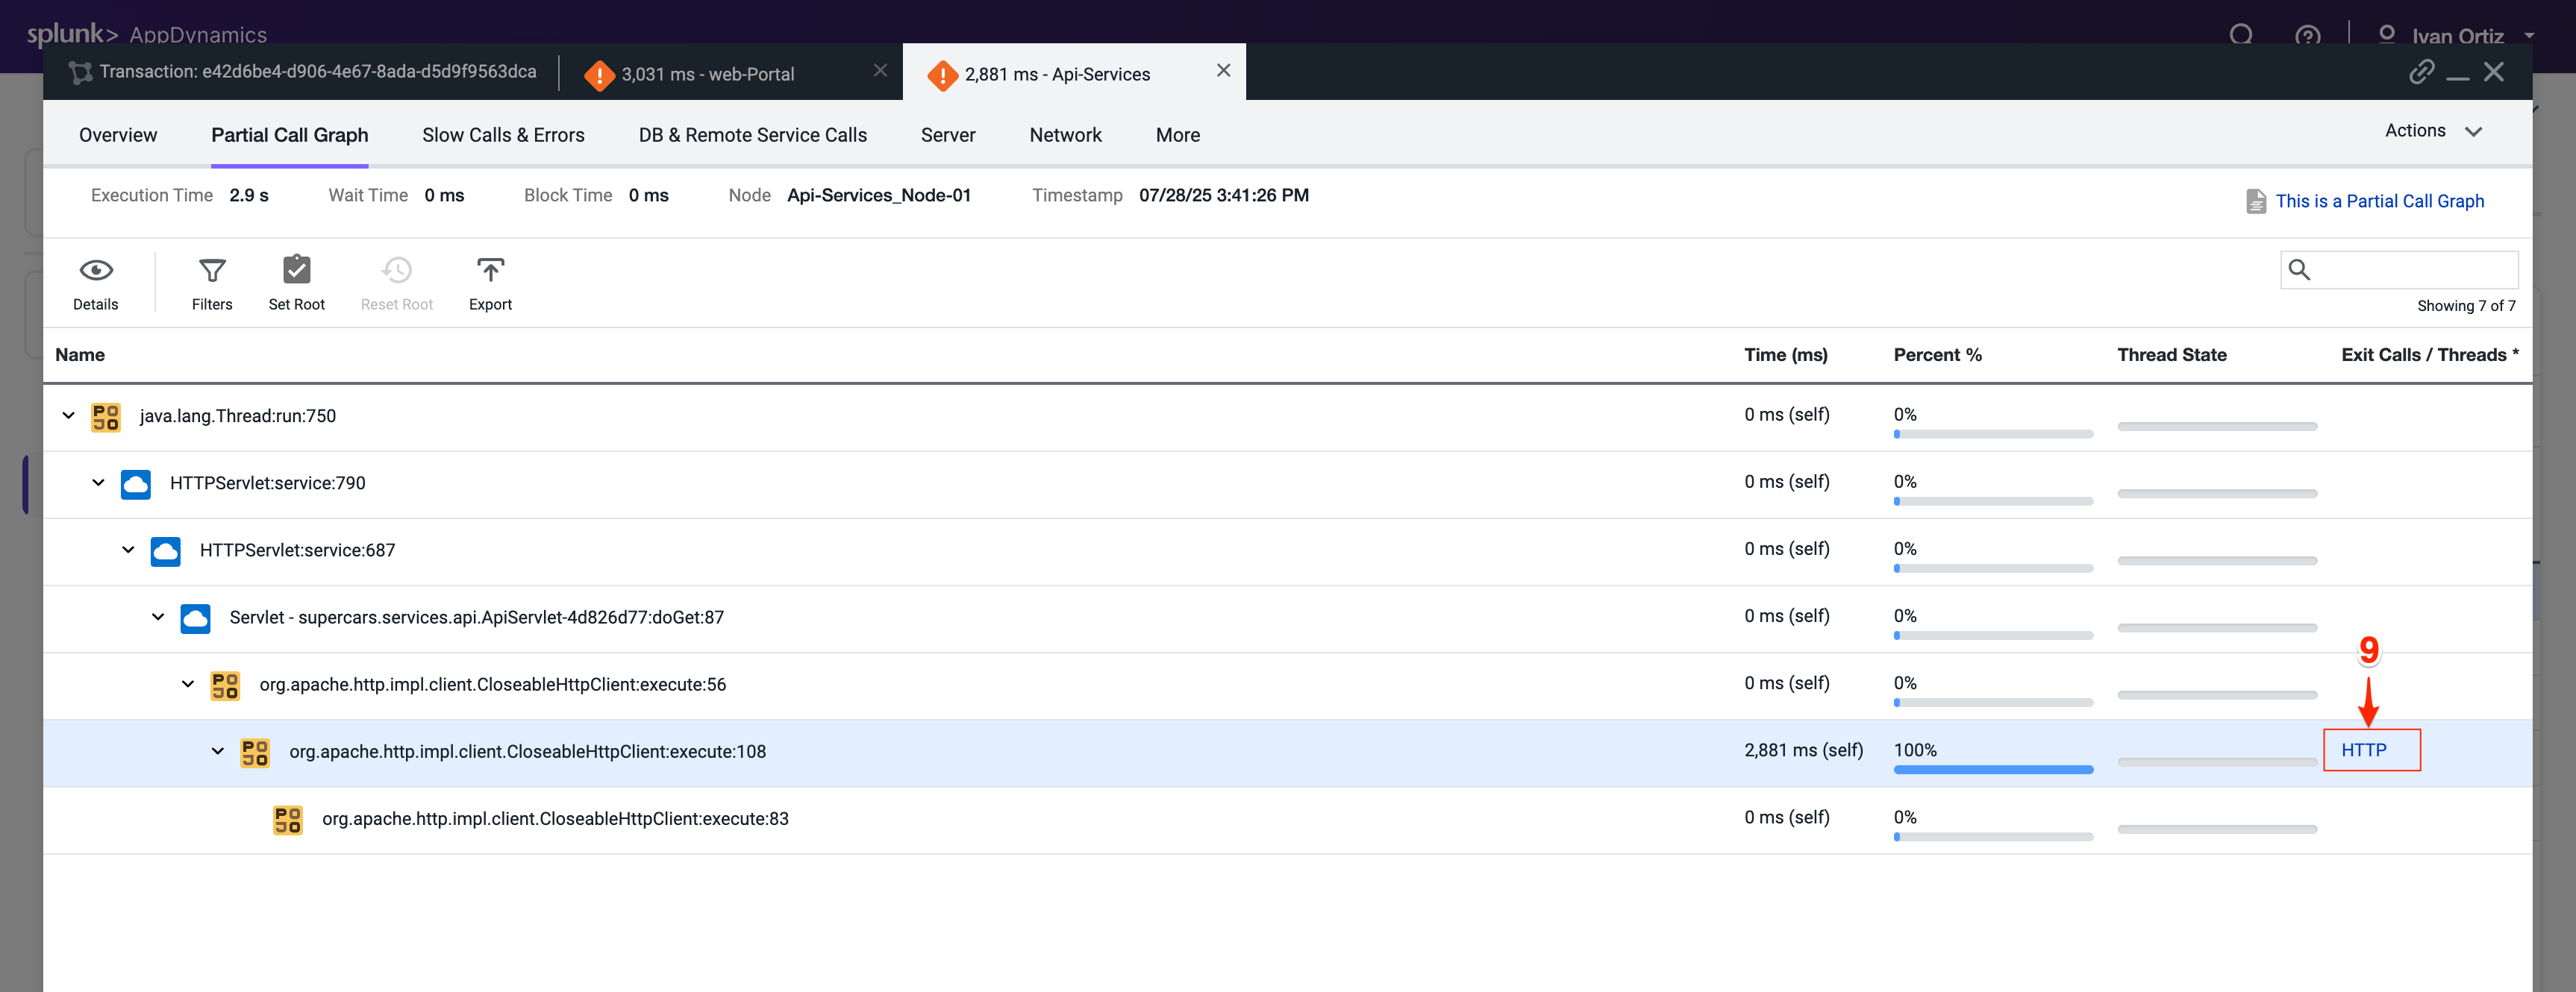
The next tab that opens shows the call graph of the Api-Services Tier. We can see that 100% of the time was due to an outbound HTTP call.
Click the HTTP link to open the detail panel for the downstream call.
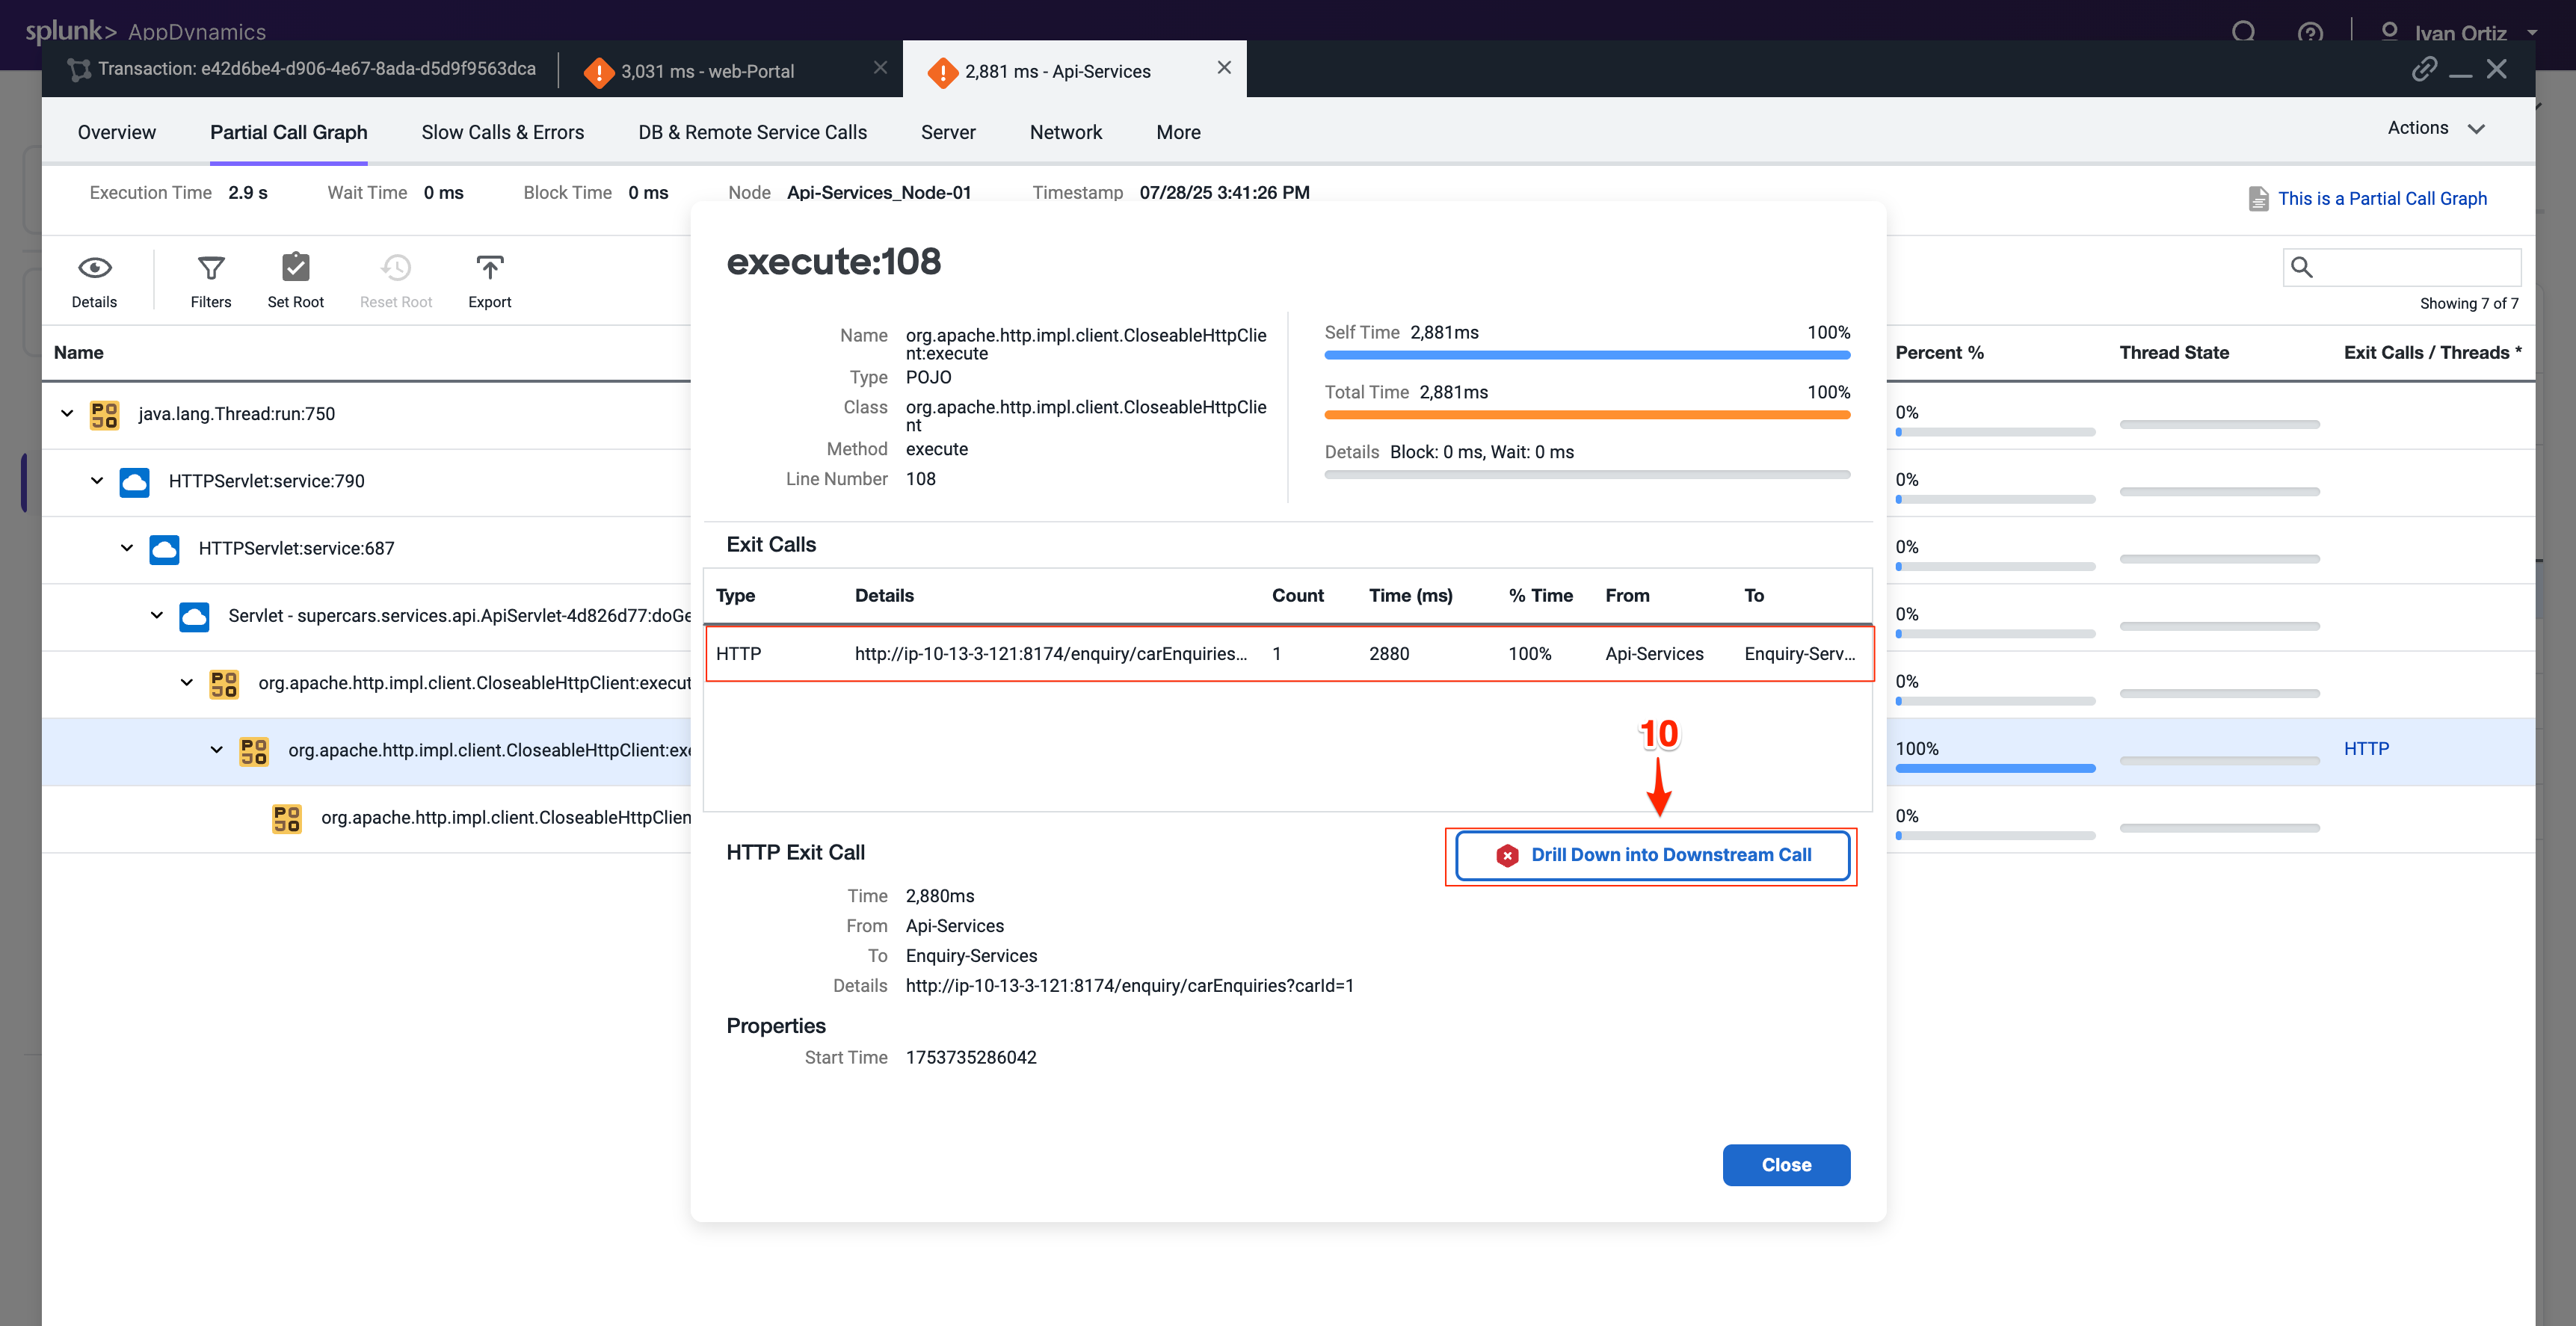
The detail panel for the downstream call shows that the Api-Services Tier made an outbound HTTP call to the Enquiry-Services Tier. Follow the HTTP call into the Enquiry-Services Tier.
Click Drill Down into Downstream Call.
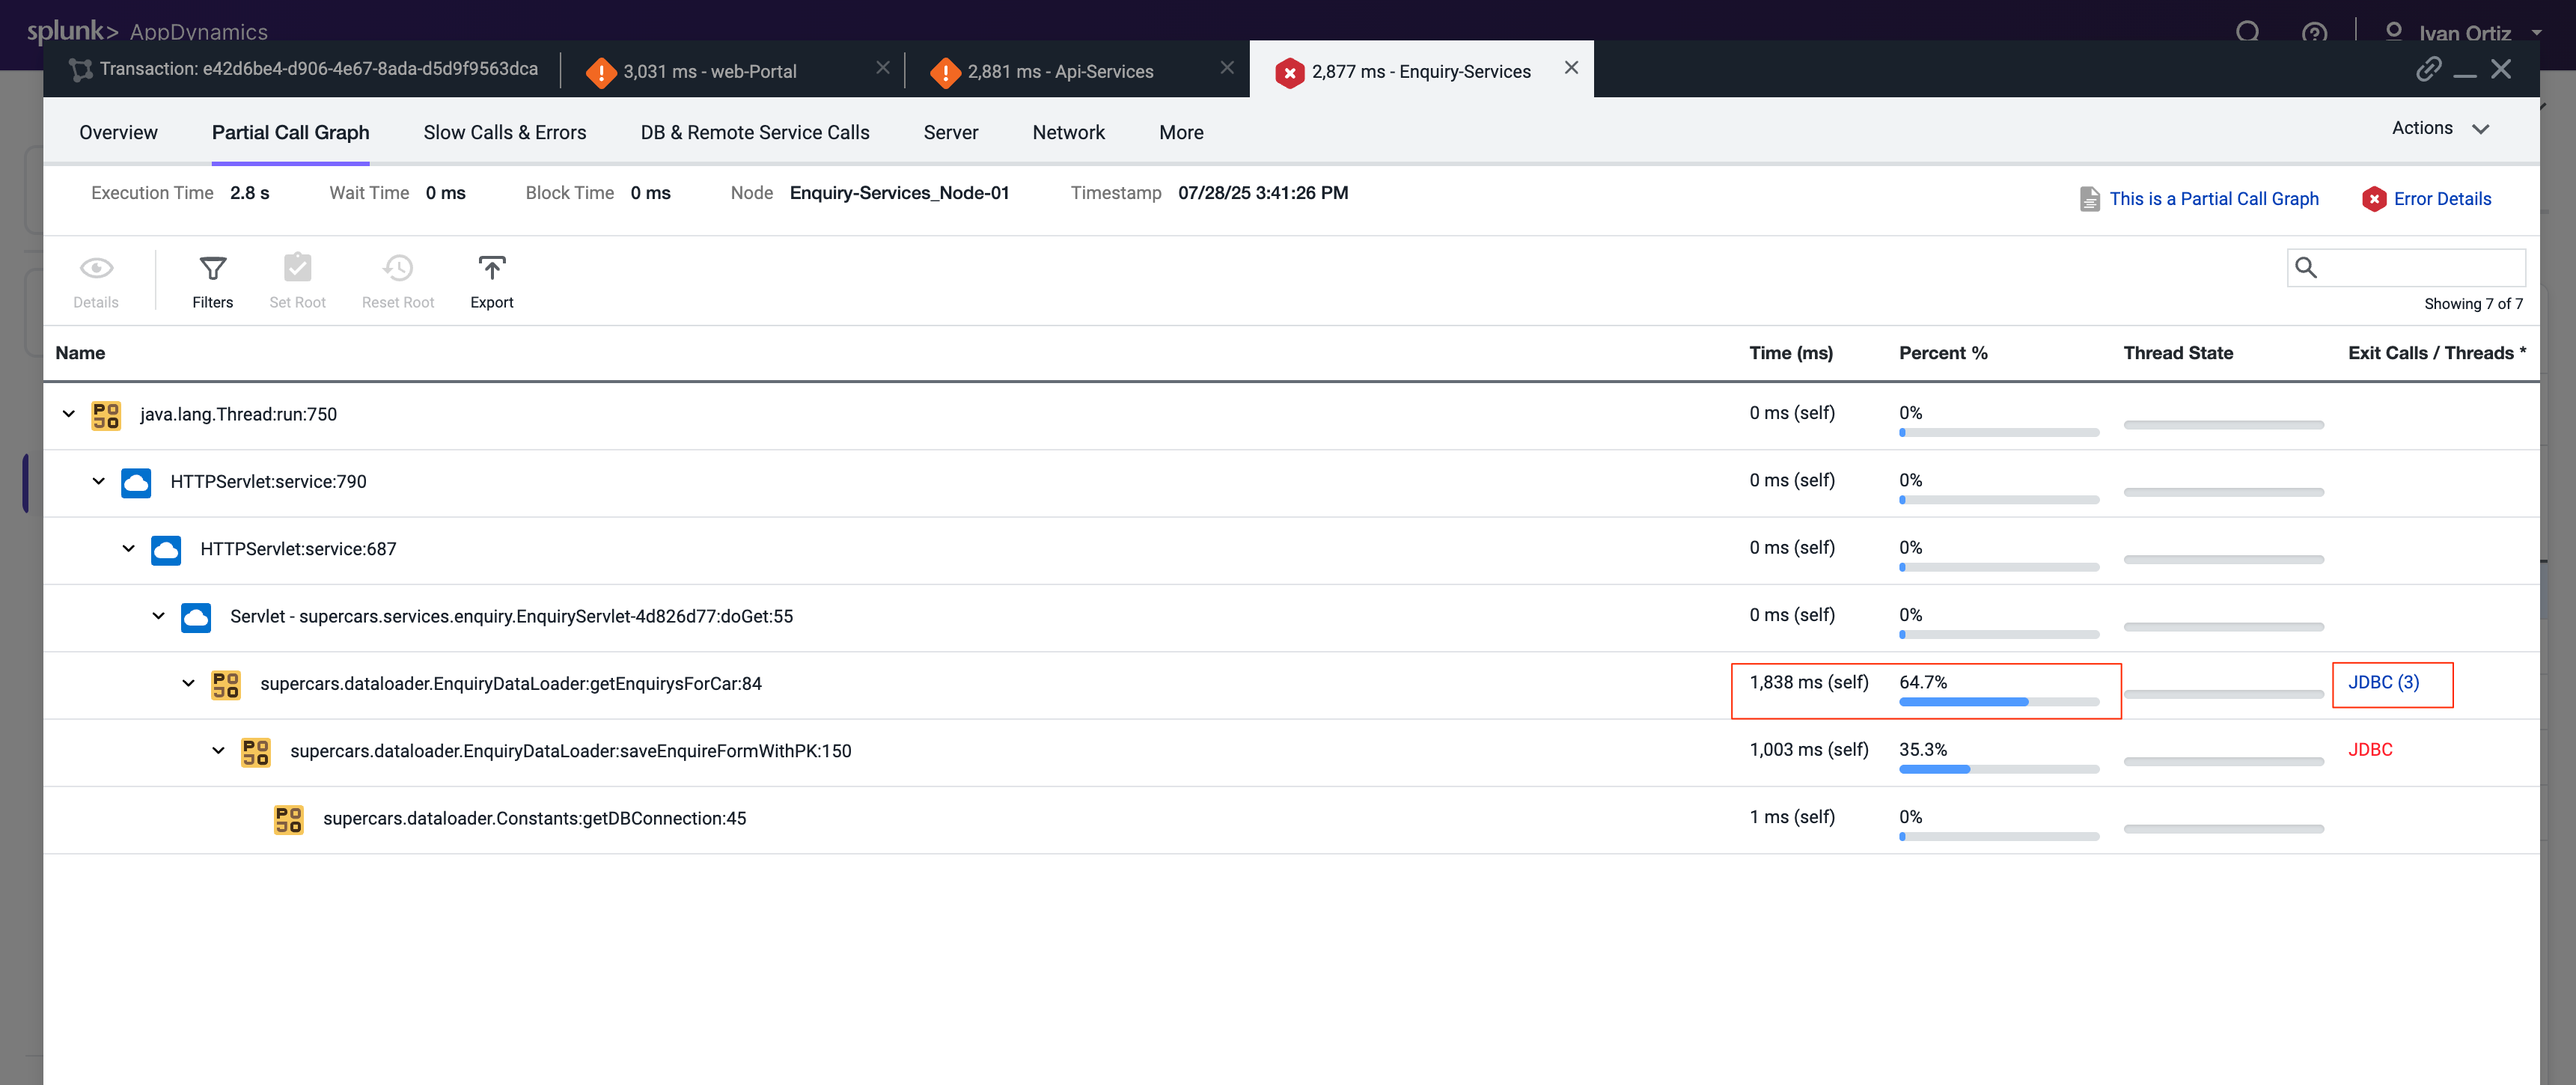
The next tab that opens shows the call graph of the Enquiry-Services Tier. We can see that there were JDBC calls to the database that caused issues with the transaction.
Click the JDBC link with the largest time to open the detail panel for the JDBC calls.
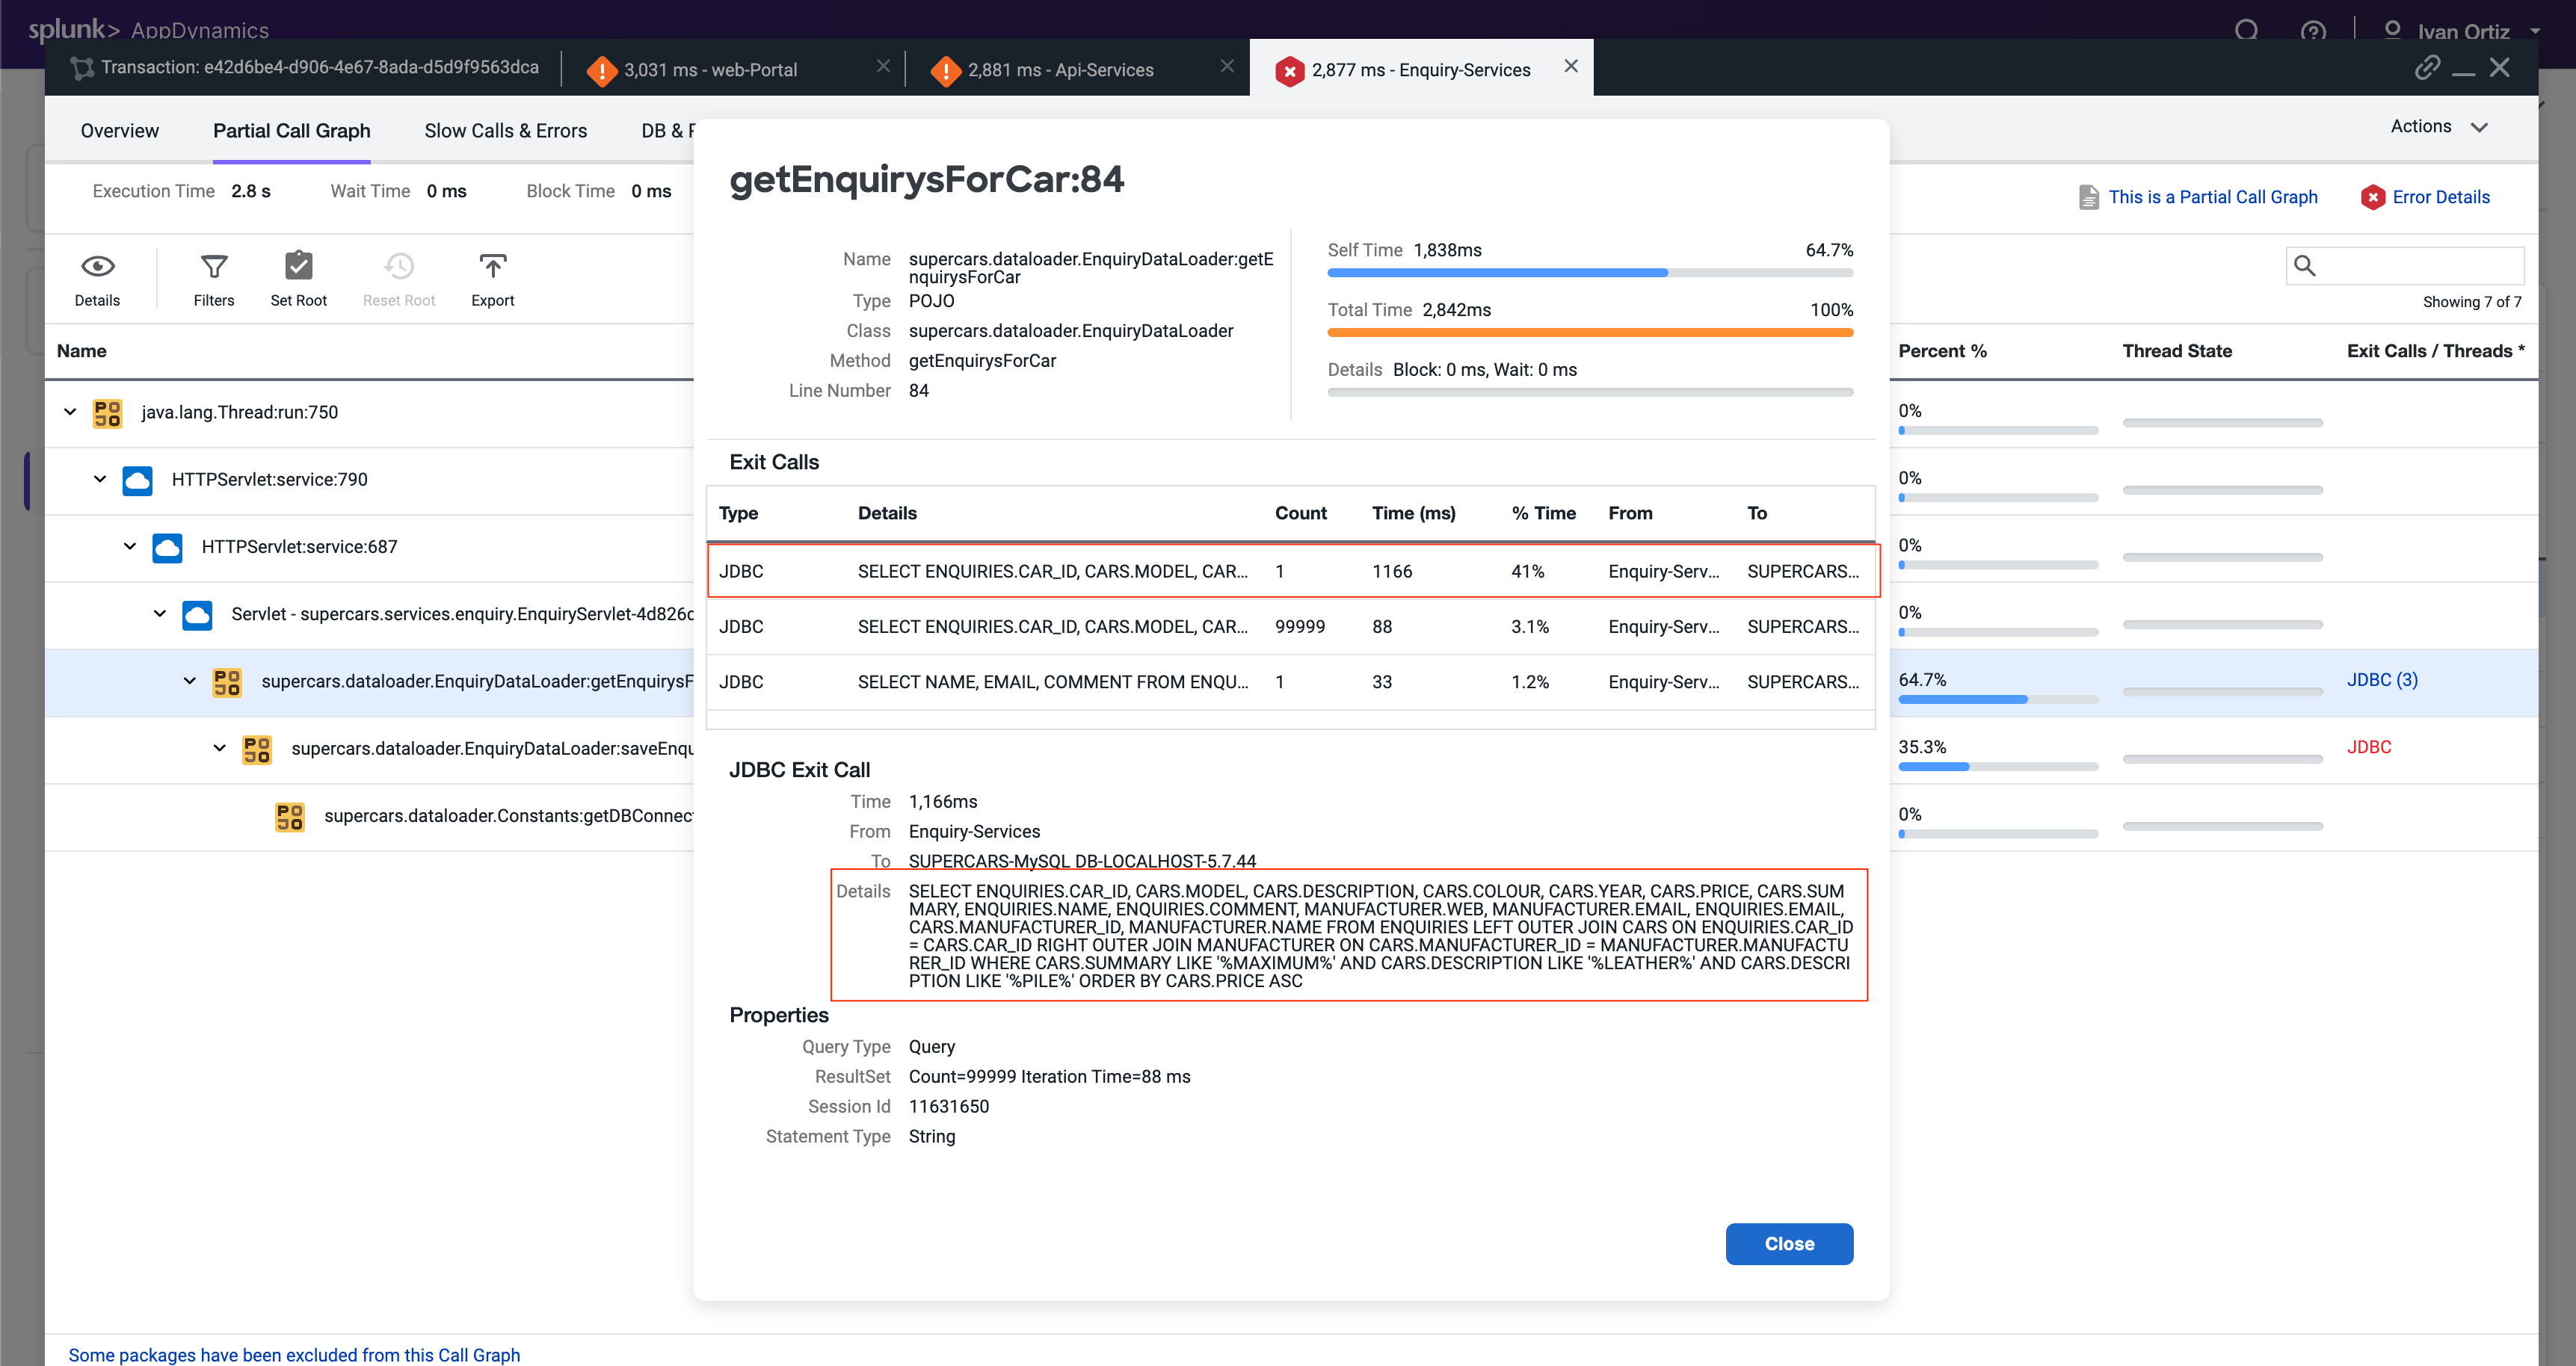
The detail panel for the JDBC exit calls shows the specific query that took most of the time. We can see the full SQL statement along with the SQL parameter values.
Summary
In this lab, we first used Business Transactions to identify a very slow transaction that required troubleshooting. We then examined the call graph to pinpoint the specific part of the code causing delays. Following that, we drilled down into downstream services and the database to further analyze the root cause of the slowness. Finally, we successfully identified the exact inefficient SQL query responsible for the performance issue. This comprehensive approach demonstrates how AppDynamics helps in isolating and resolving transaction bottlenecks effectively.
7. Troubleshooting Errors & Exceptions
In this exercise, you will learn how to effectively detect and diagnose errors within your application to identify their root causes. Additionally, you will explore how to pinpoint specific nodes that may be underperforming or experiencing errors, and apply troubleshooting techniques to resolve these performance issues. This hands-on experience will enhance your ability to maintain application health and ensure optimal performance.
Find Specific Errors Within Your Application
AppDynamics makes it easy to find errors and exceptions within your application. You can use the Errors dashboard to see transactions snapshots with errors and find the exceptions that are occurring most often. Identifying errors quickly helps prioritize fixes that improve application stability and user experience. Understanding the types and frequency of exceptions allows you to focus on the most impactful issues.
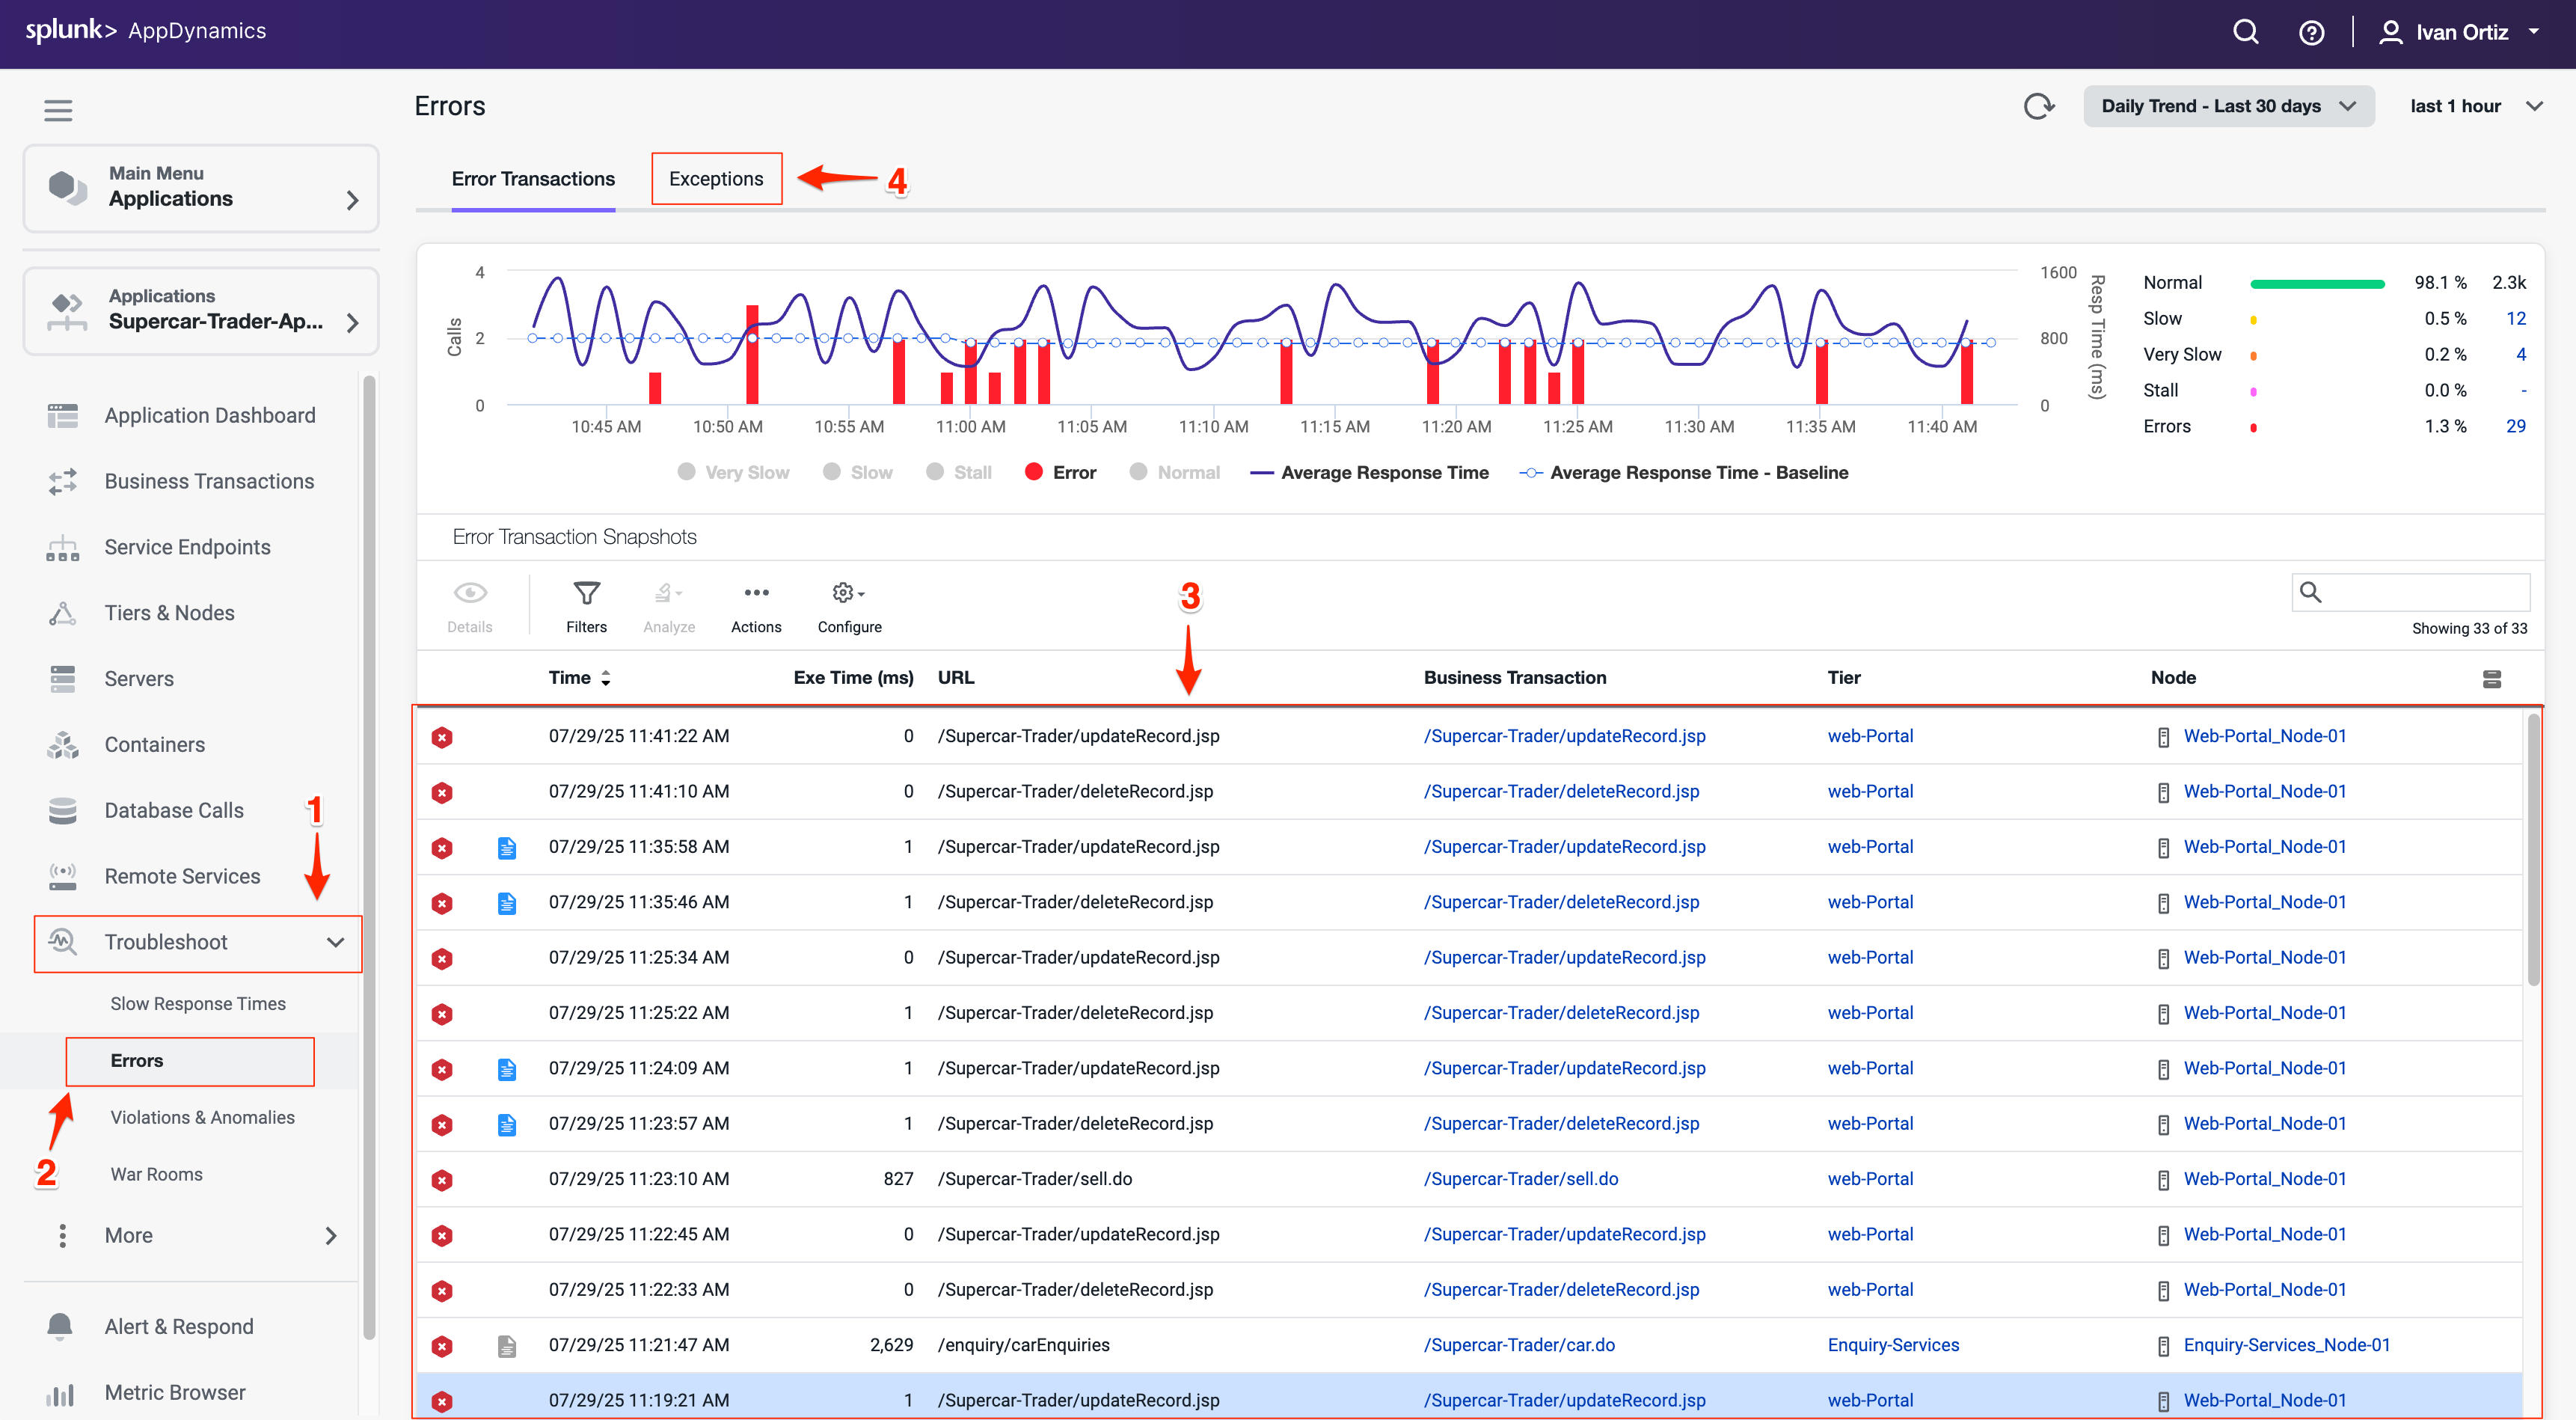
Click on the Troubleshoot option on the left menu.
Click on the Errors option on the left menu. This navigates you to the Errors dashboard where you can quickly identify business transactions with errors
Explore a few of the error transaction snapshots. Reviewing snapshots helps you see the exact context and flow when errors occurred.
Click on the Exceptions tab to see exceptions grouped by type. Grouping by exception type helps identify recurring problems and patterns.
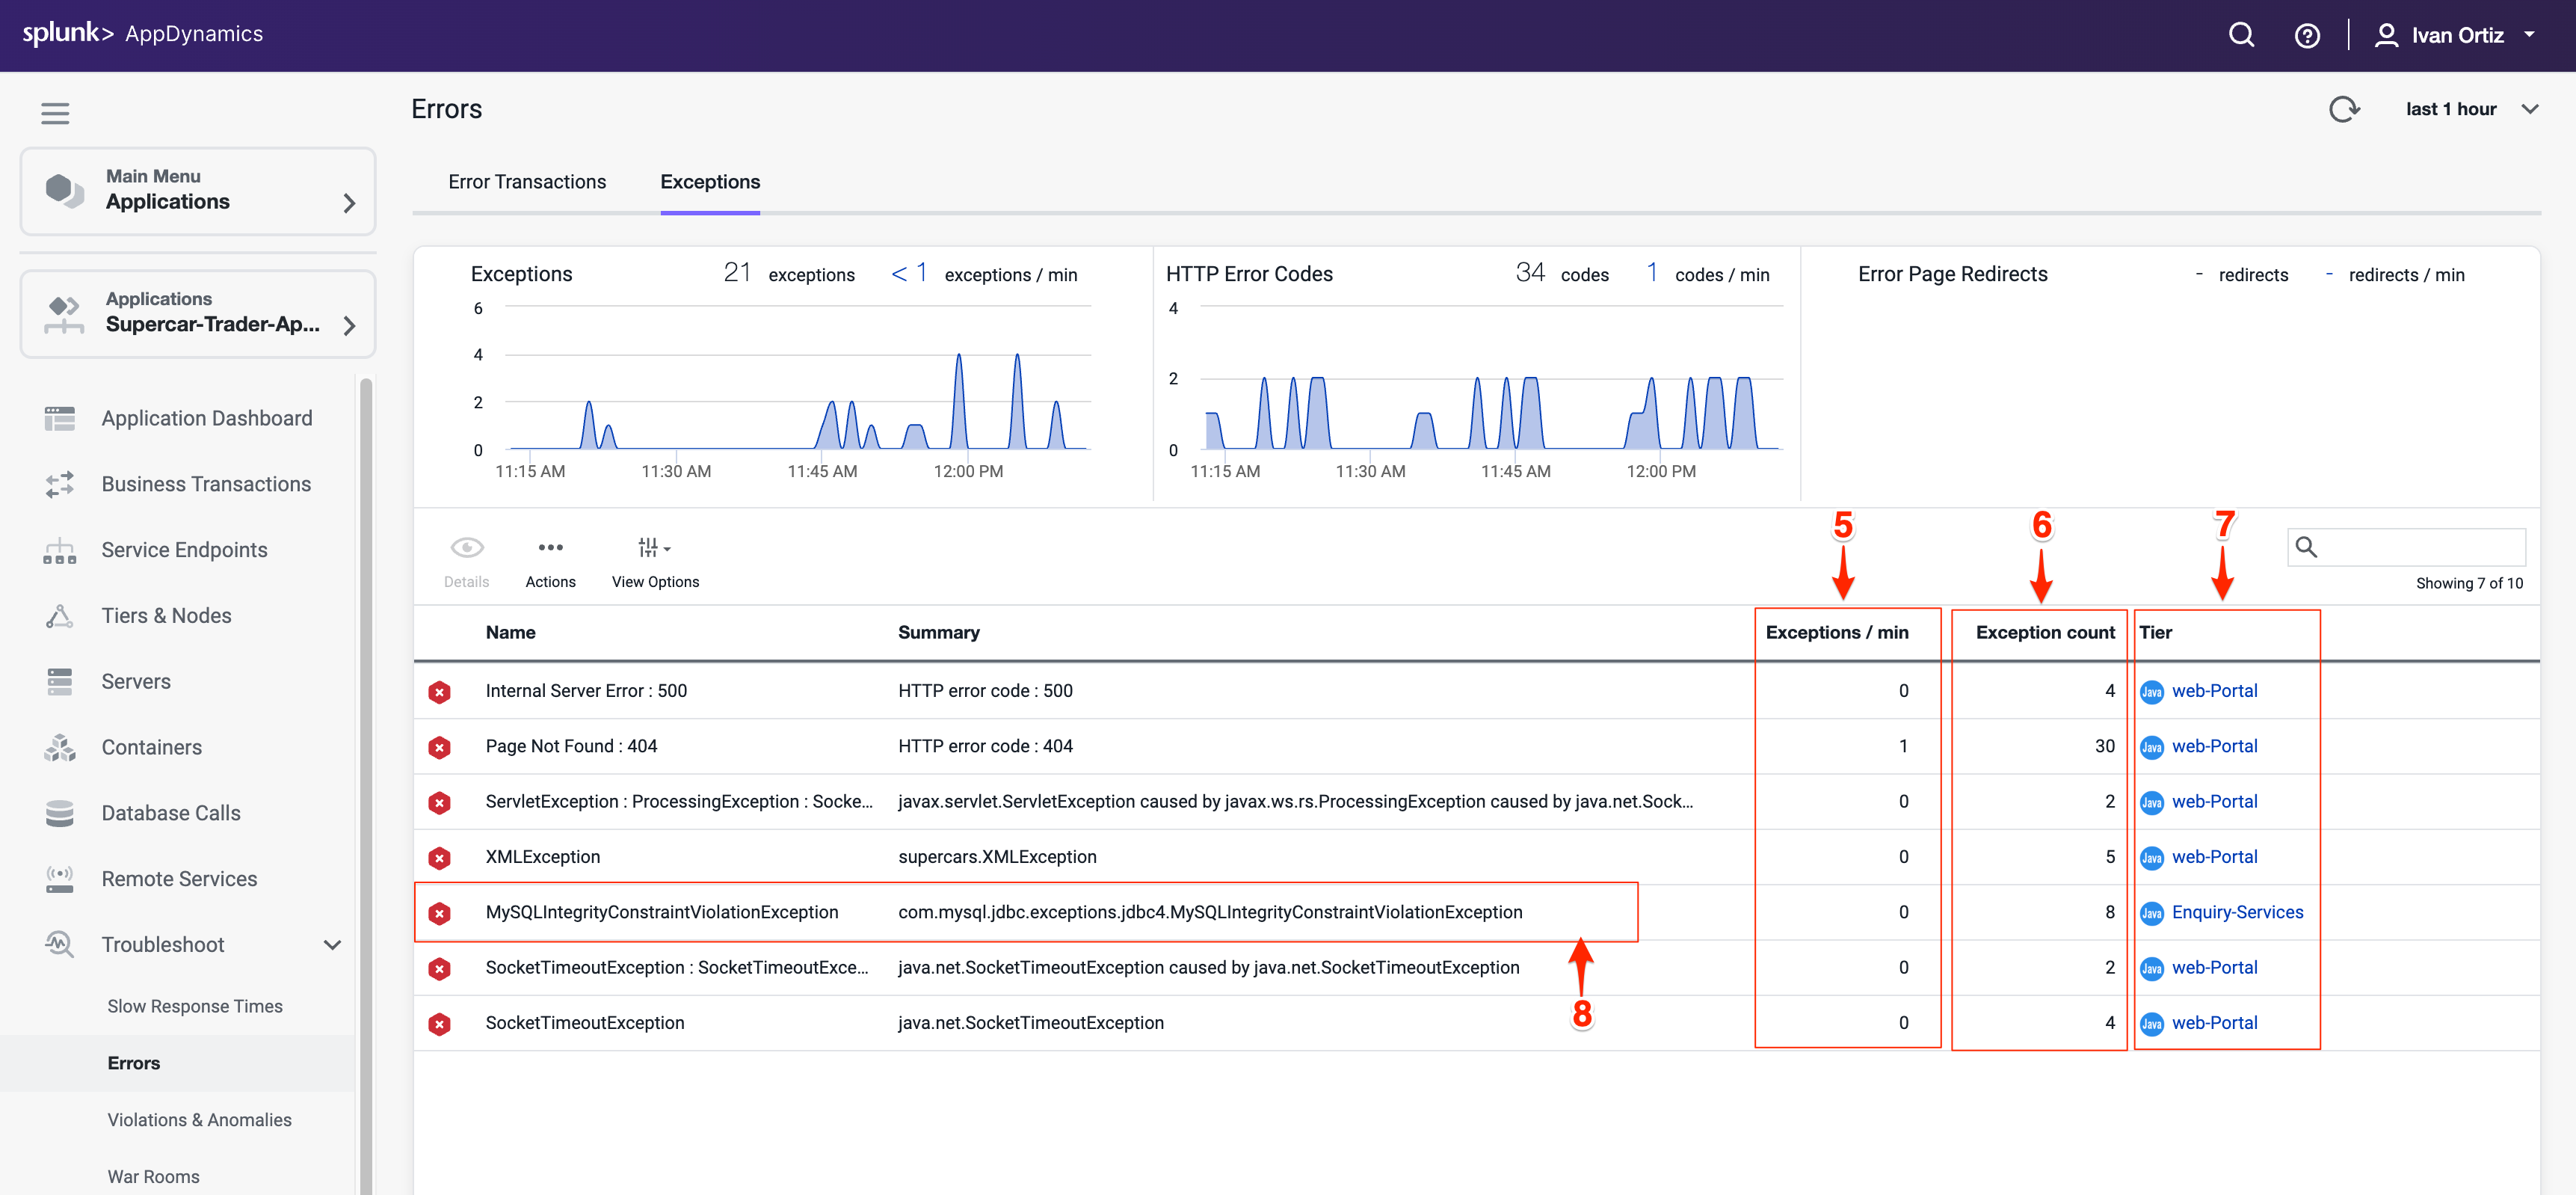
The Exceptions tab shows you what types of exceptions are occurring the most within the application so you can prioritize remediating the ones having the most impact.
Observe the Exceptions per minute and Exception count (6) to understand error frequency. High frequency exceptions often indicate critical issues needing immediate attention.
Note the Tier where exceptions occur to localize the problem within your application architecture. Knowing the affected tier helps narrow down the root cause.
Double-click on the MySQLIntegrityConstraintViolationException type to drill deeper.
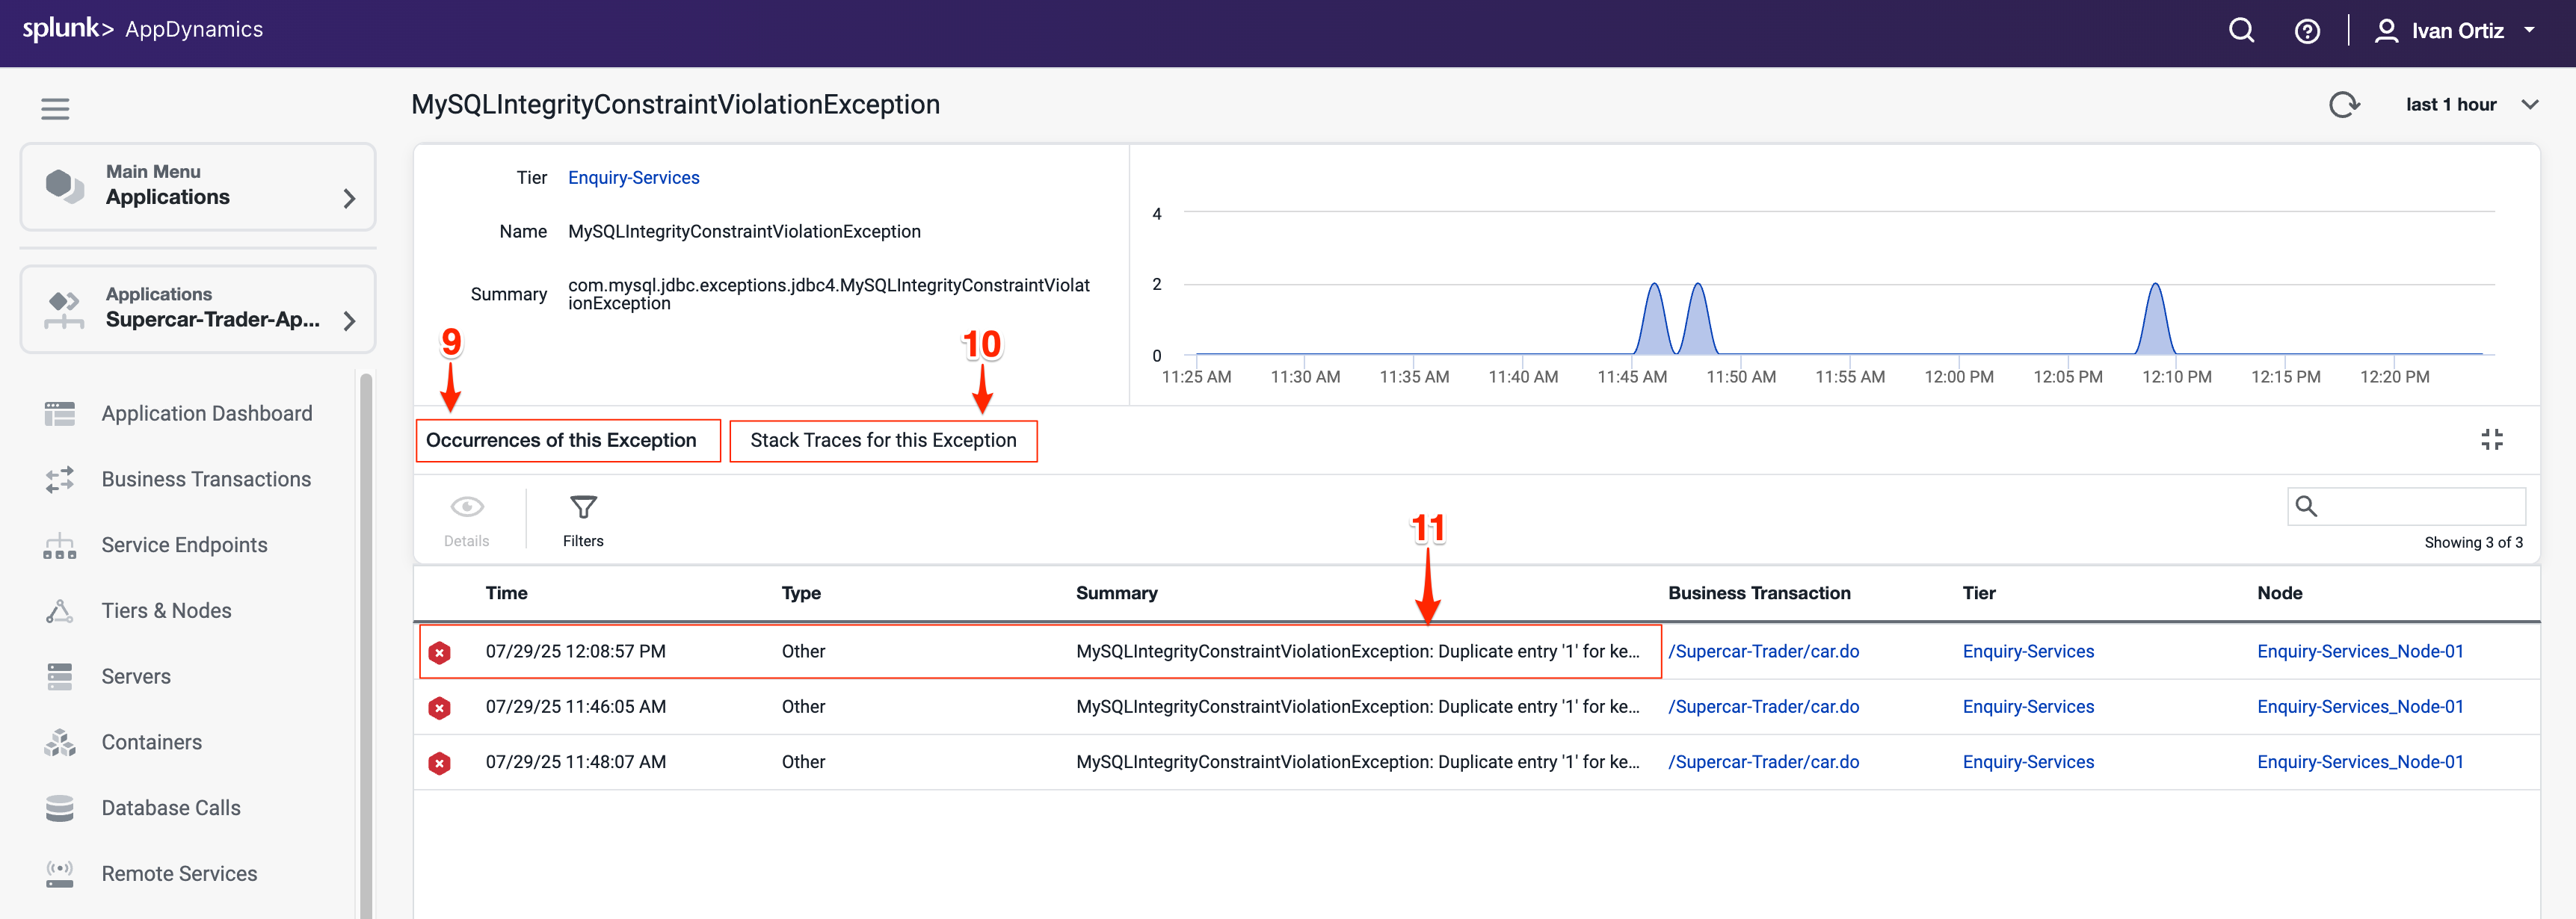
Review the overview dashboard showing snapshots that experienced this exception type.
The tab labeled Stack Traces for this Exception shows you an aggregated list of the unique stack traces generated by this exception type. Stack traces provide the exact code paths causing the error, essential for debugging.
Double-click a snapshot to open it and see the error in context.
This shows the transaction flow and pinpoints where the error happened.
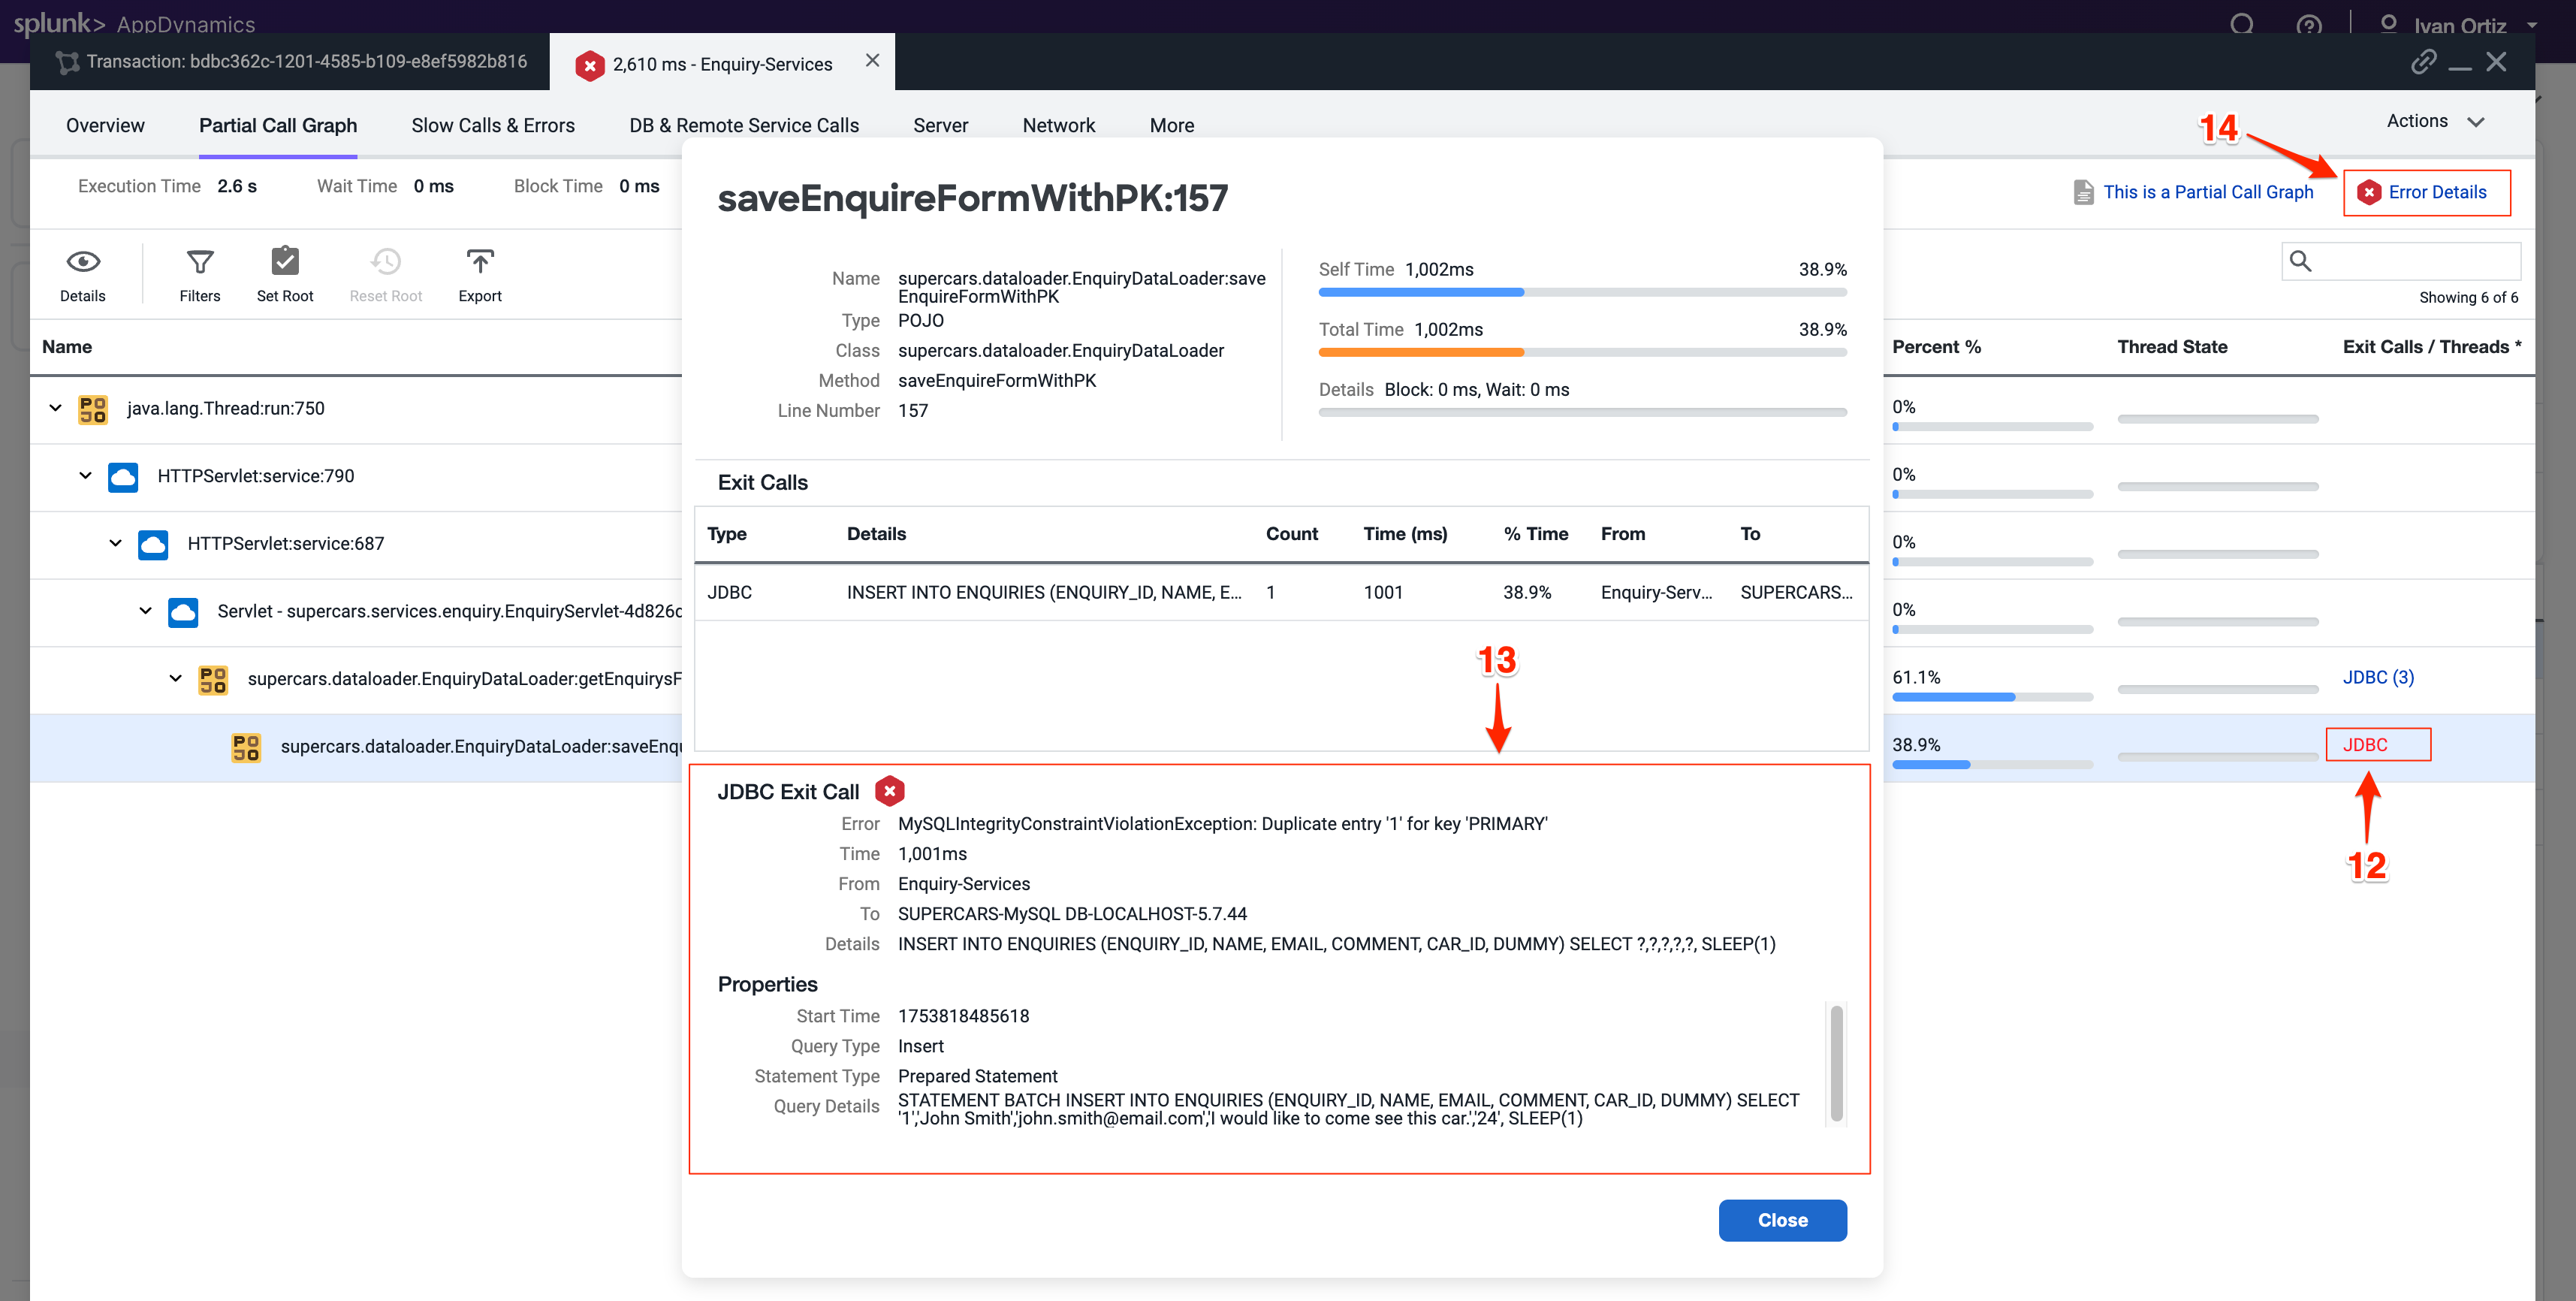
When you open an error snapshot from the exceptions screen, the snapshot opens to the specific segment within the snapshot where the error occurred.
Notice exit calls in red text indicating errors or exceptions.
Drill into the exit call to view detailed error information.
Click Error Details to see the full stack trace. Full stack traces are critical for developers to trace and fix bugs.
Tip
If you want to learn more about error handling and exceptions, refer to the official AppDynamics documentation in the following link: here.
Troubleshoot Node Issues
Node health directly impacts application performance and availability. Early detection of node issues prevents outages and ensures smooth operation. AppDynamics provides visual indicators throughout the UI, making it easy to quickly identify issues.
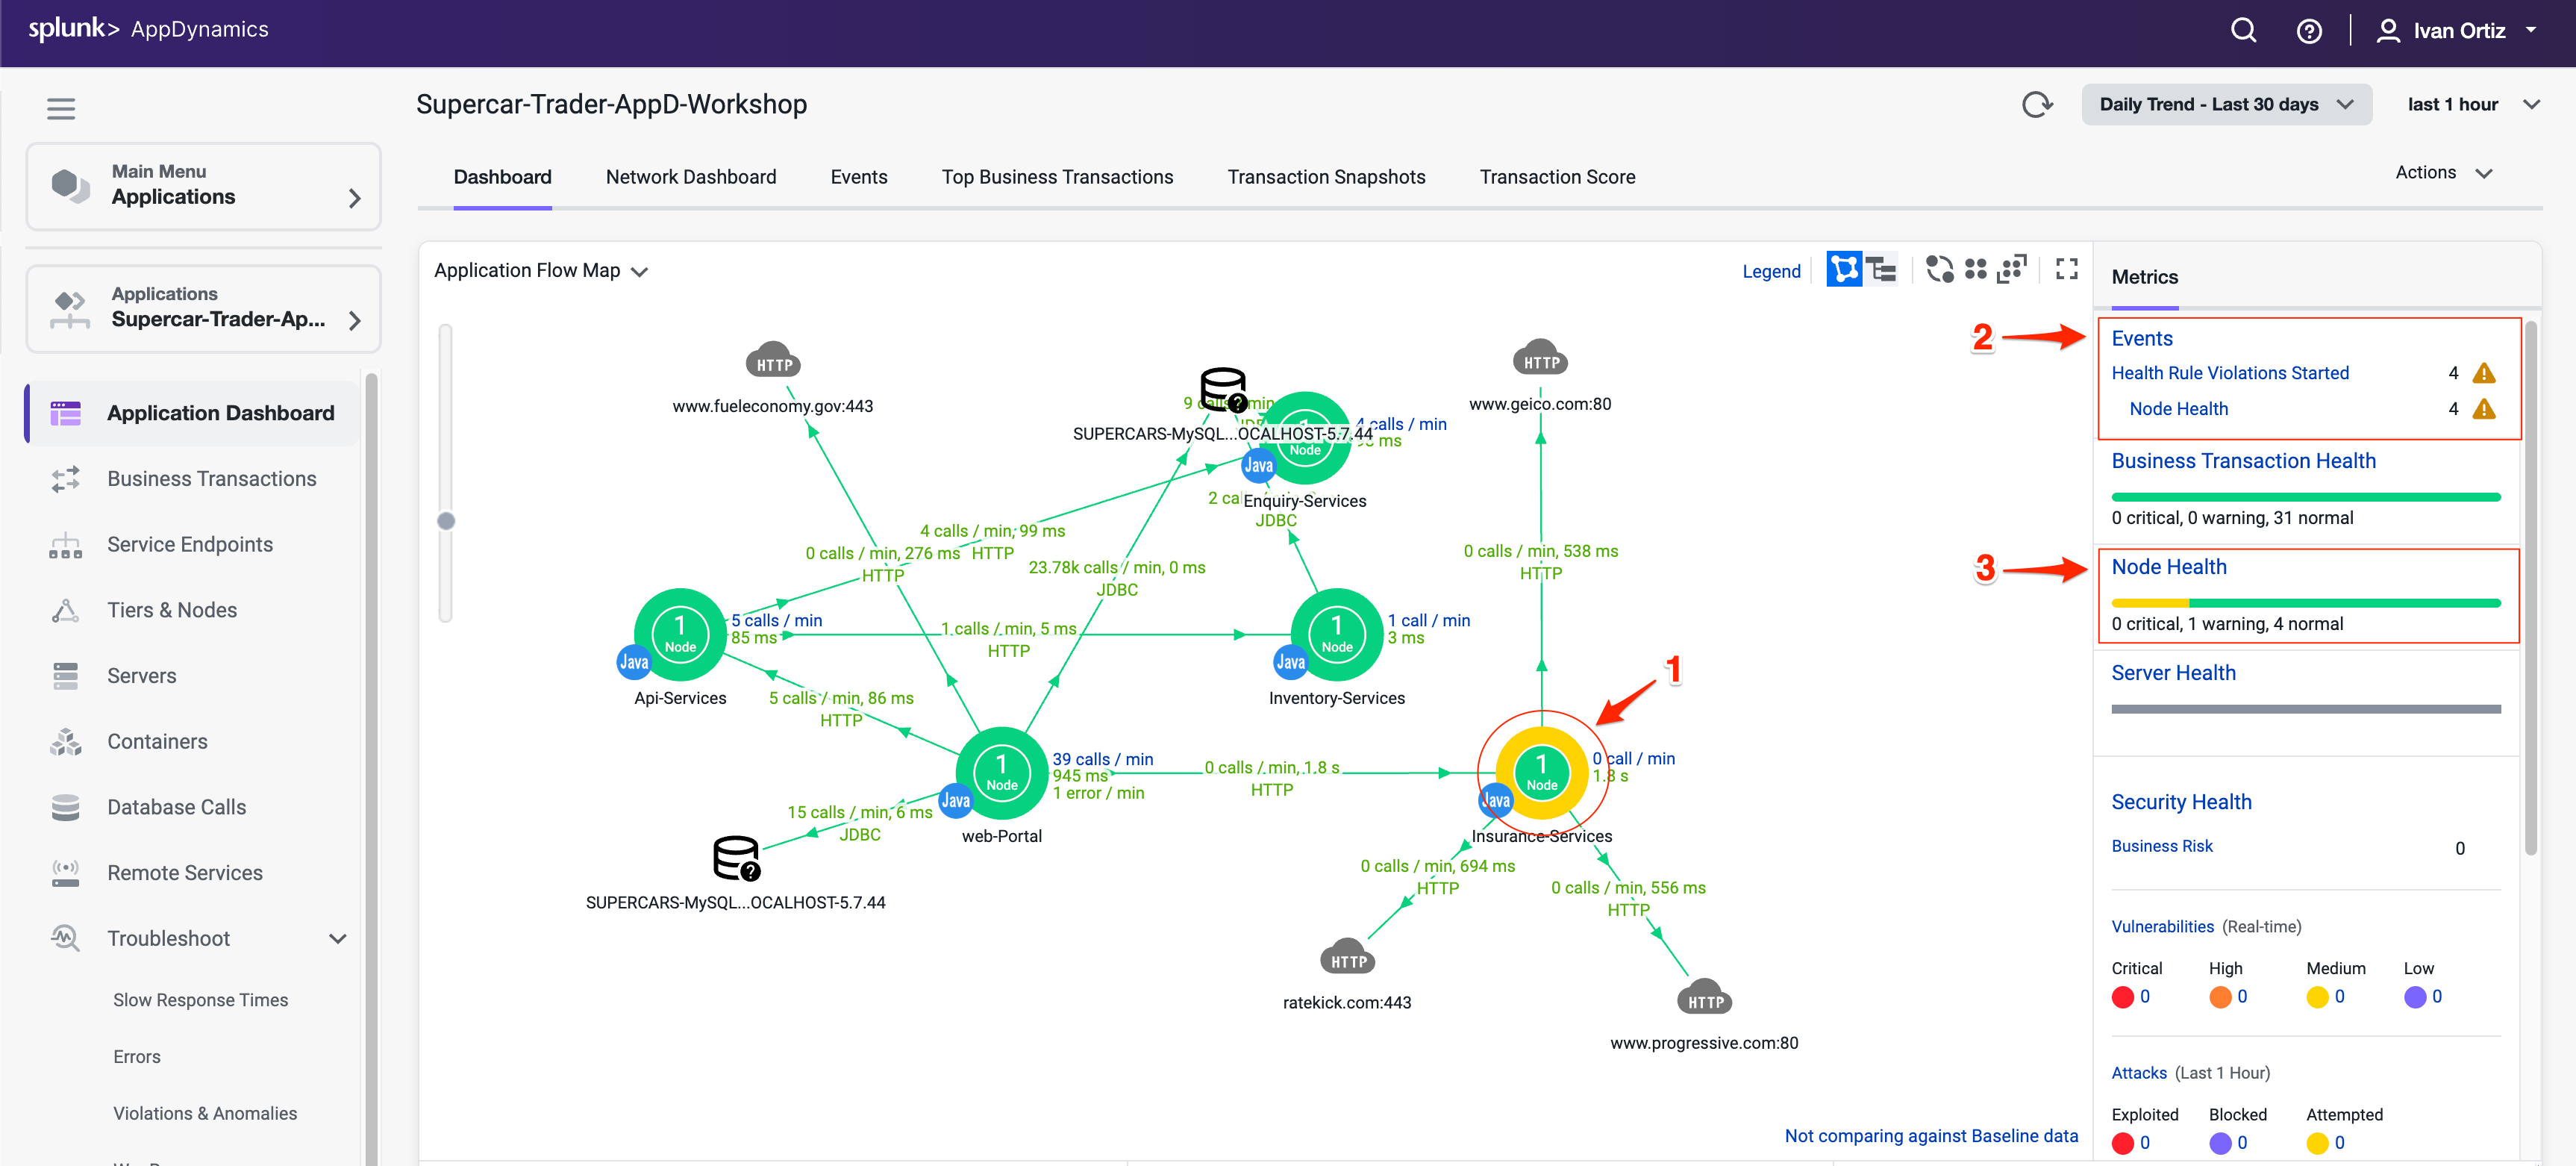
You can see indicators of Node issues in three areas on the Application Dashboard.
Observe the Application Dashboard for visual indicators of node problems. Color changes and icons provide immediate alerts to issues
The Events panel shows Health Rule Violations, including those related to Node Health.
The Node Health panel tells you how many critical or warning issues are occurring for Nodes. Click on the Node Health link in the Node Health panel to drill into the Tiers & Nodes dashboard.
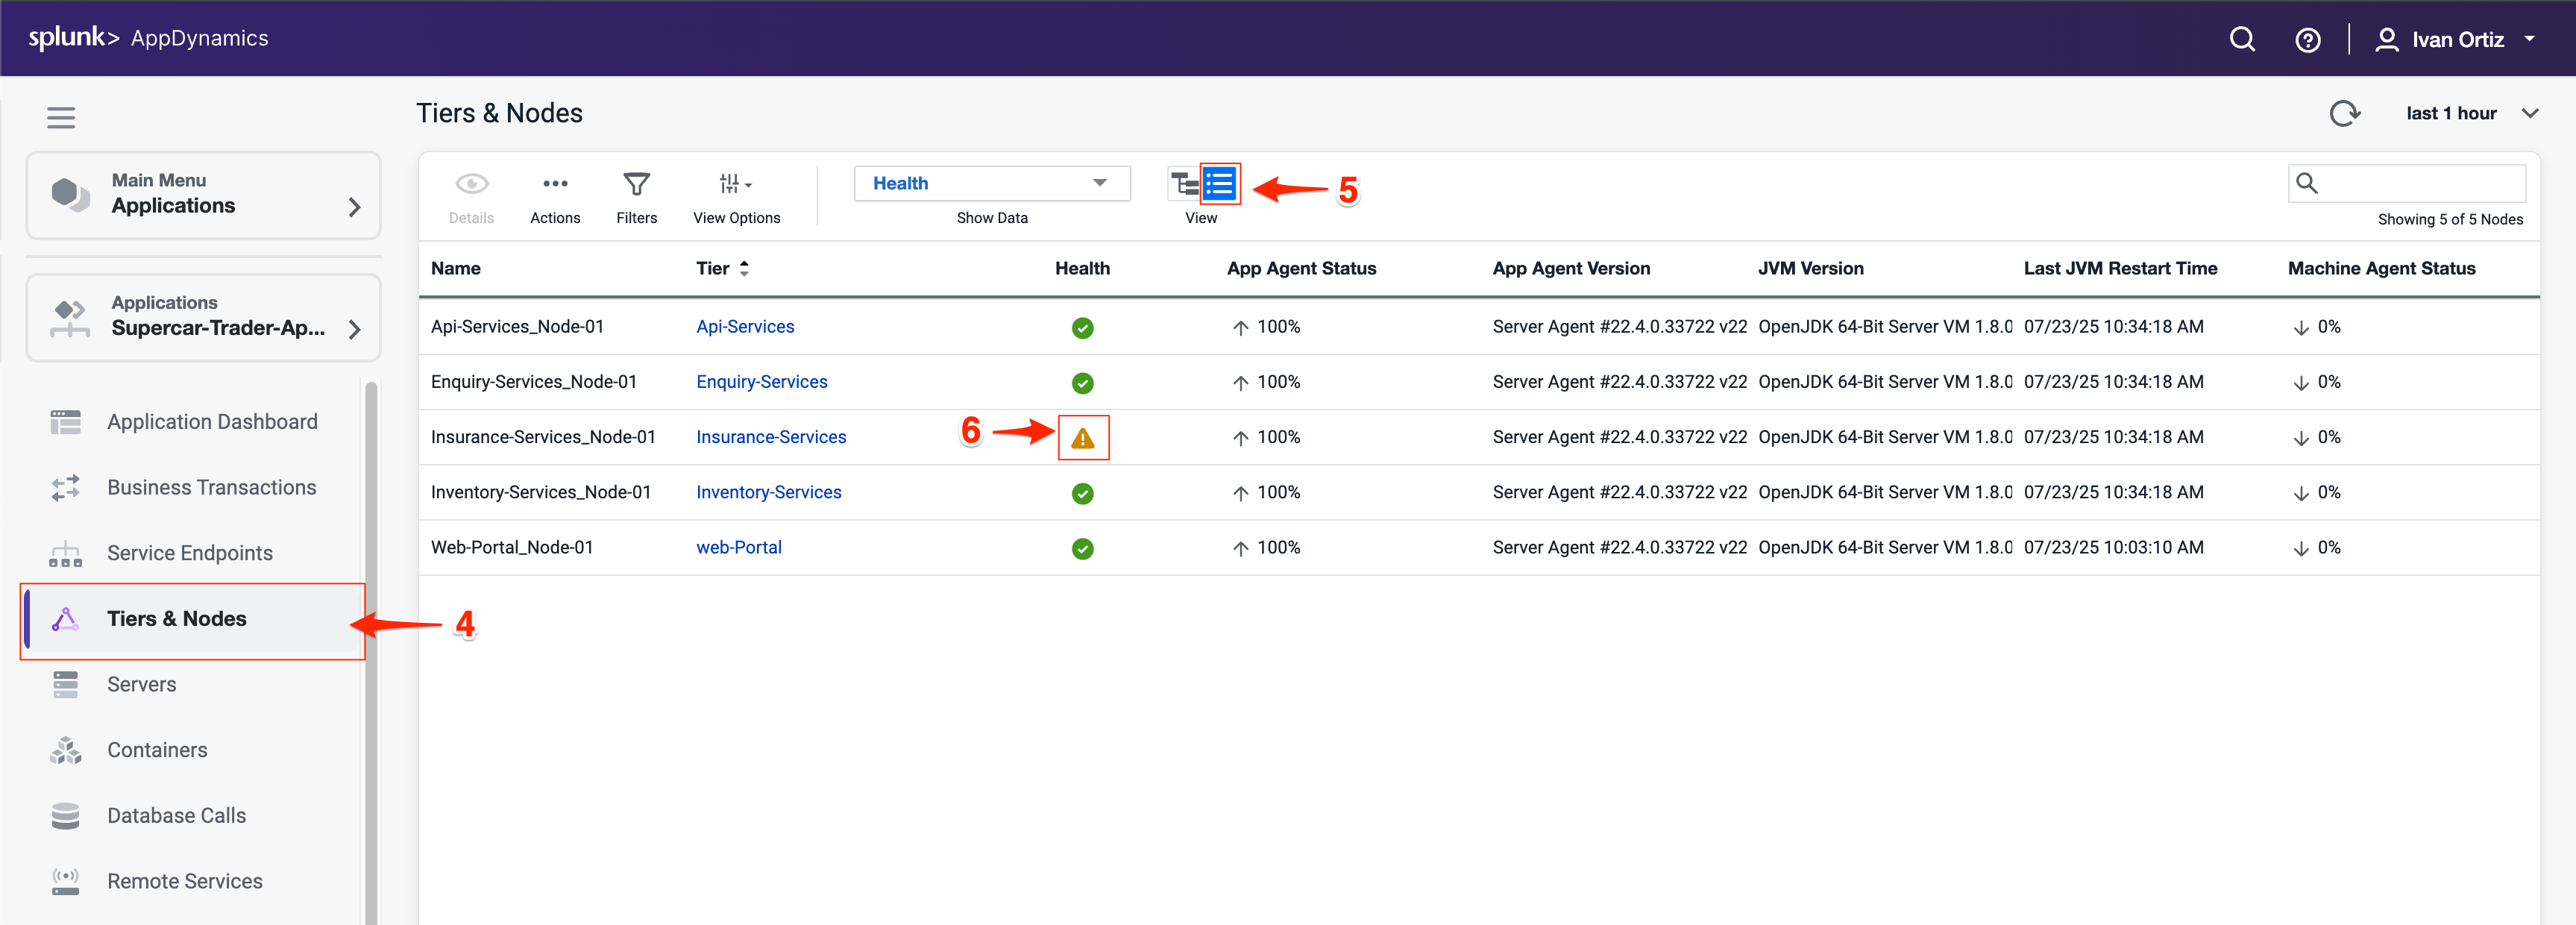
Alternatevely, you can click Tiers & Nodes on the left menu to reach the Tiers & Nodes dashboard
Switch to Grid View for an organized list of nodes. Grid view makes it easier to scan and find nodes with warnings.
Click on the warning icon for the Insurance-Services_Node-01 Node.
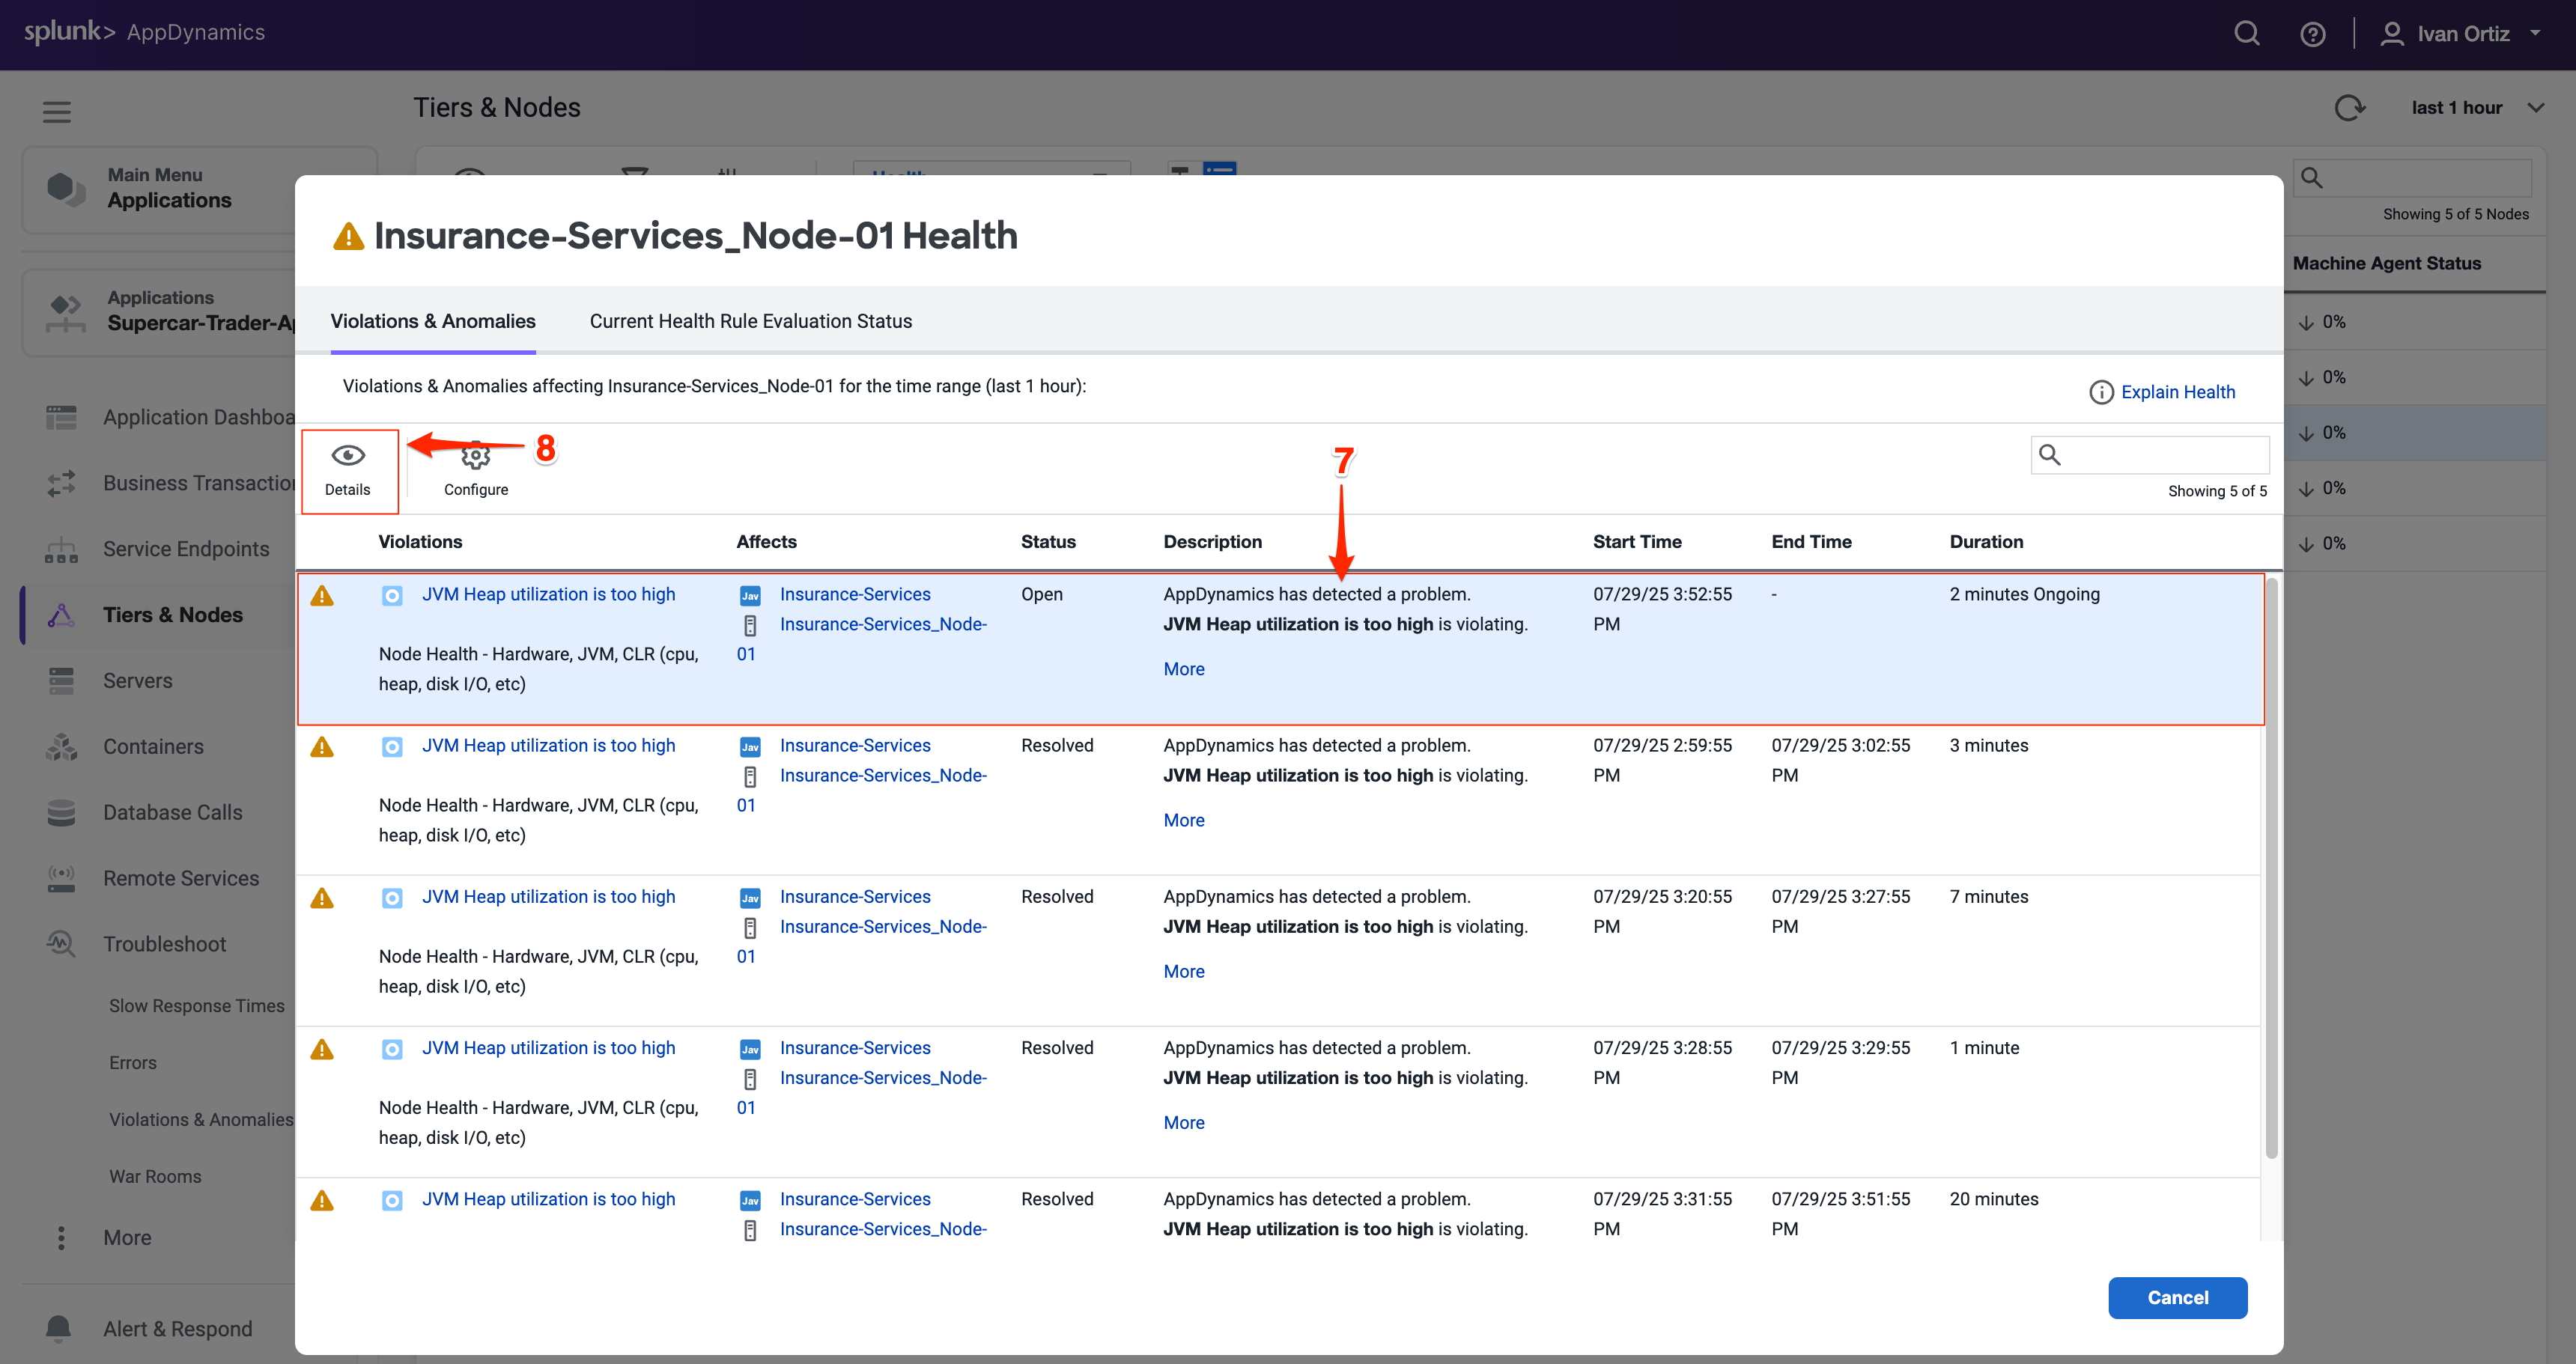
Review the Health Rule Violations summary and click on violation descriptions.
Click on the Details button to see the details.
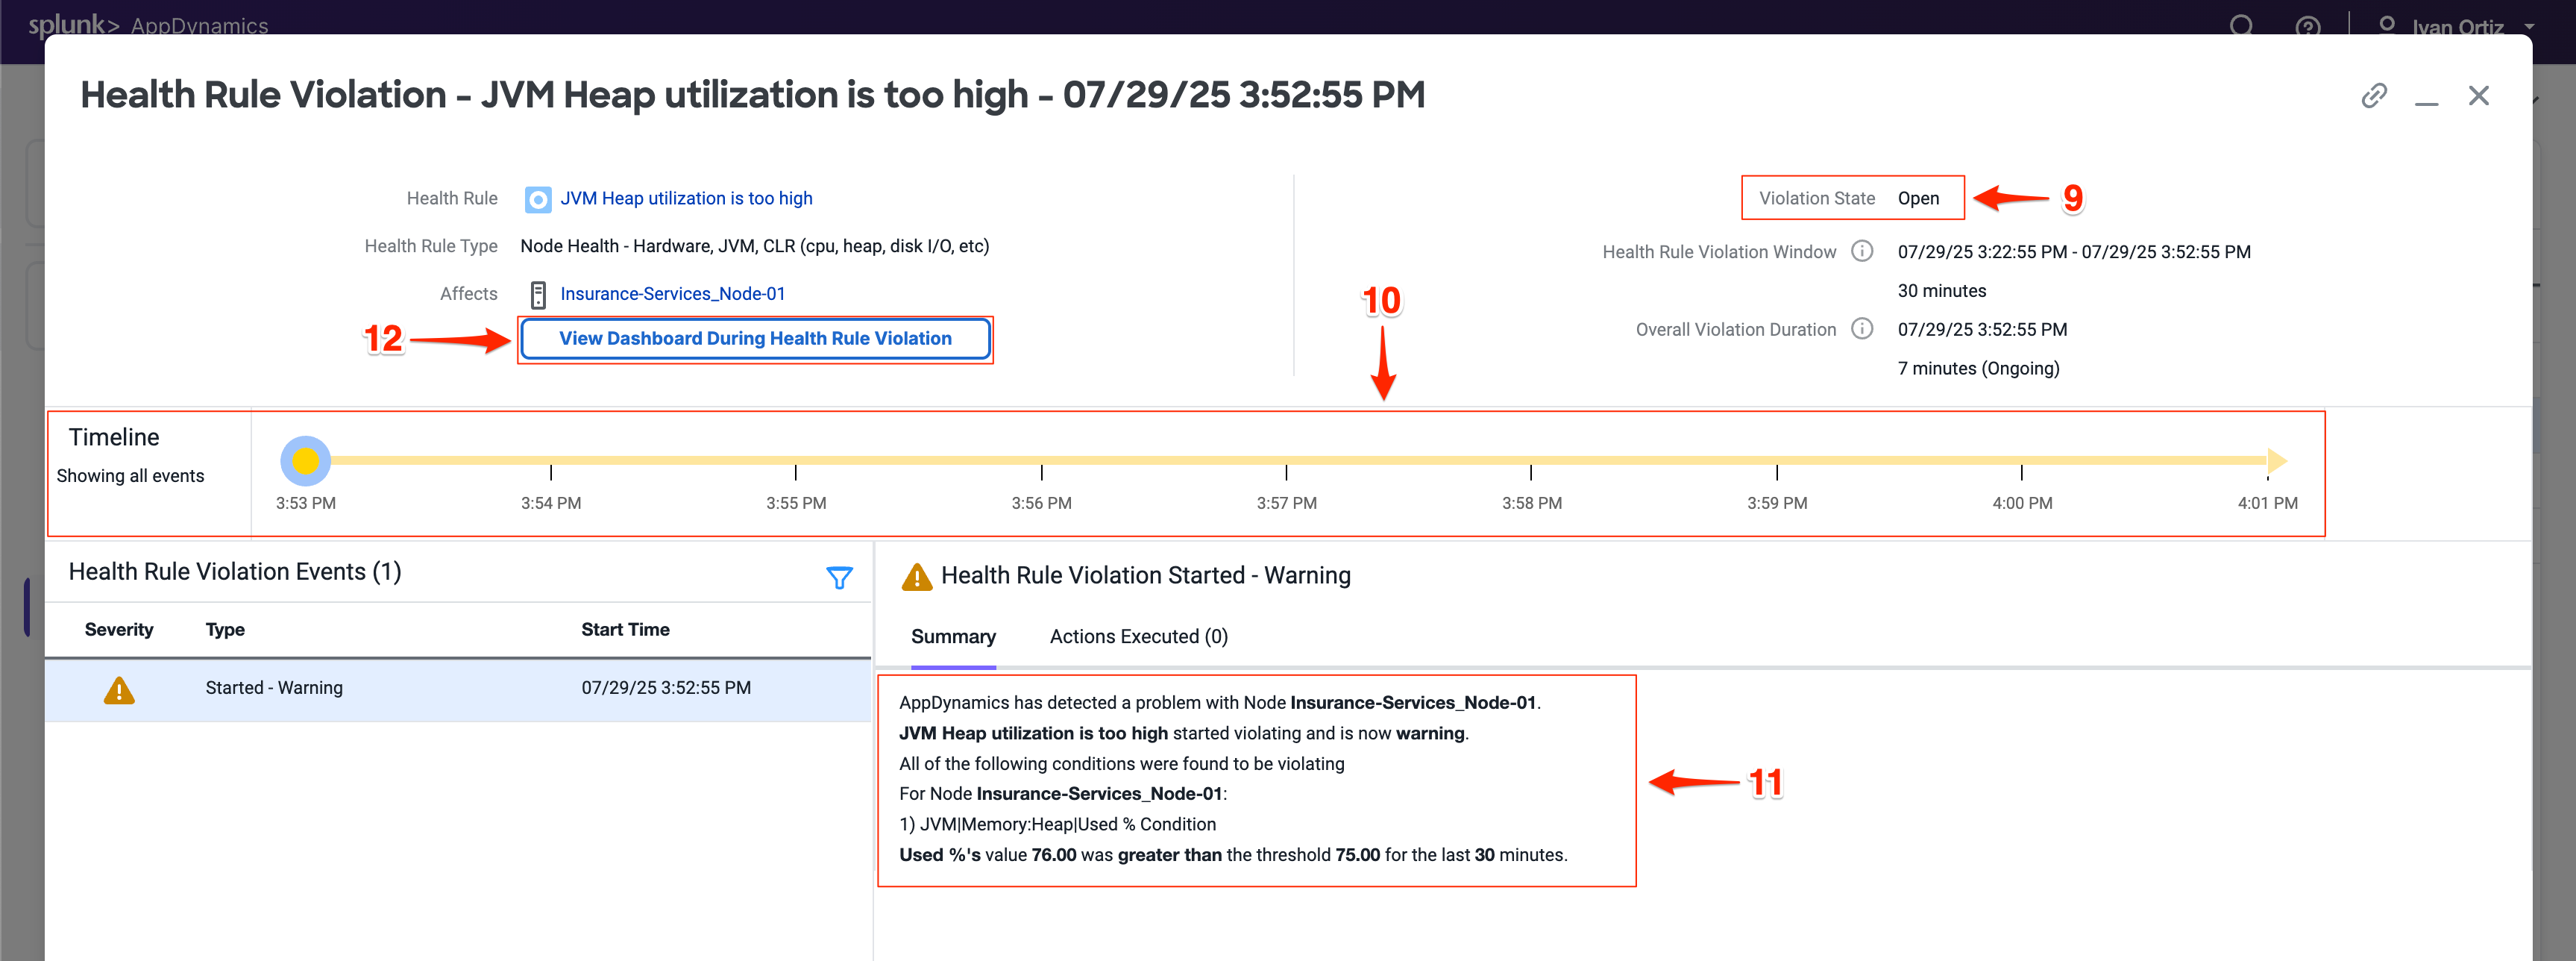
The Health Rule Violation details viewer shows you:
The current state of the violation.
The timeline of when the violation was occurring.
The specifics of what the violation is and the conditions that triggered it.
Click on the View Dashboard During Health Rule Violation to see node metrics at the time of the issue. Correlating violations with performance metrics aids diagnosis.
When you click on the View Dashboard During Health Rule Violation button, it opens the Server tab of the Node dashboard by default.
If you haven’t installed the AppDynamics Server Visibility Monitoring agent yet then you won’t see the resource metrics for the host of the Node. You will be able to see those metrics in the next lab. The AppDynamics Java agent collects memory metrics from the JVM via JMX.
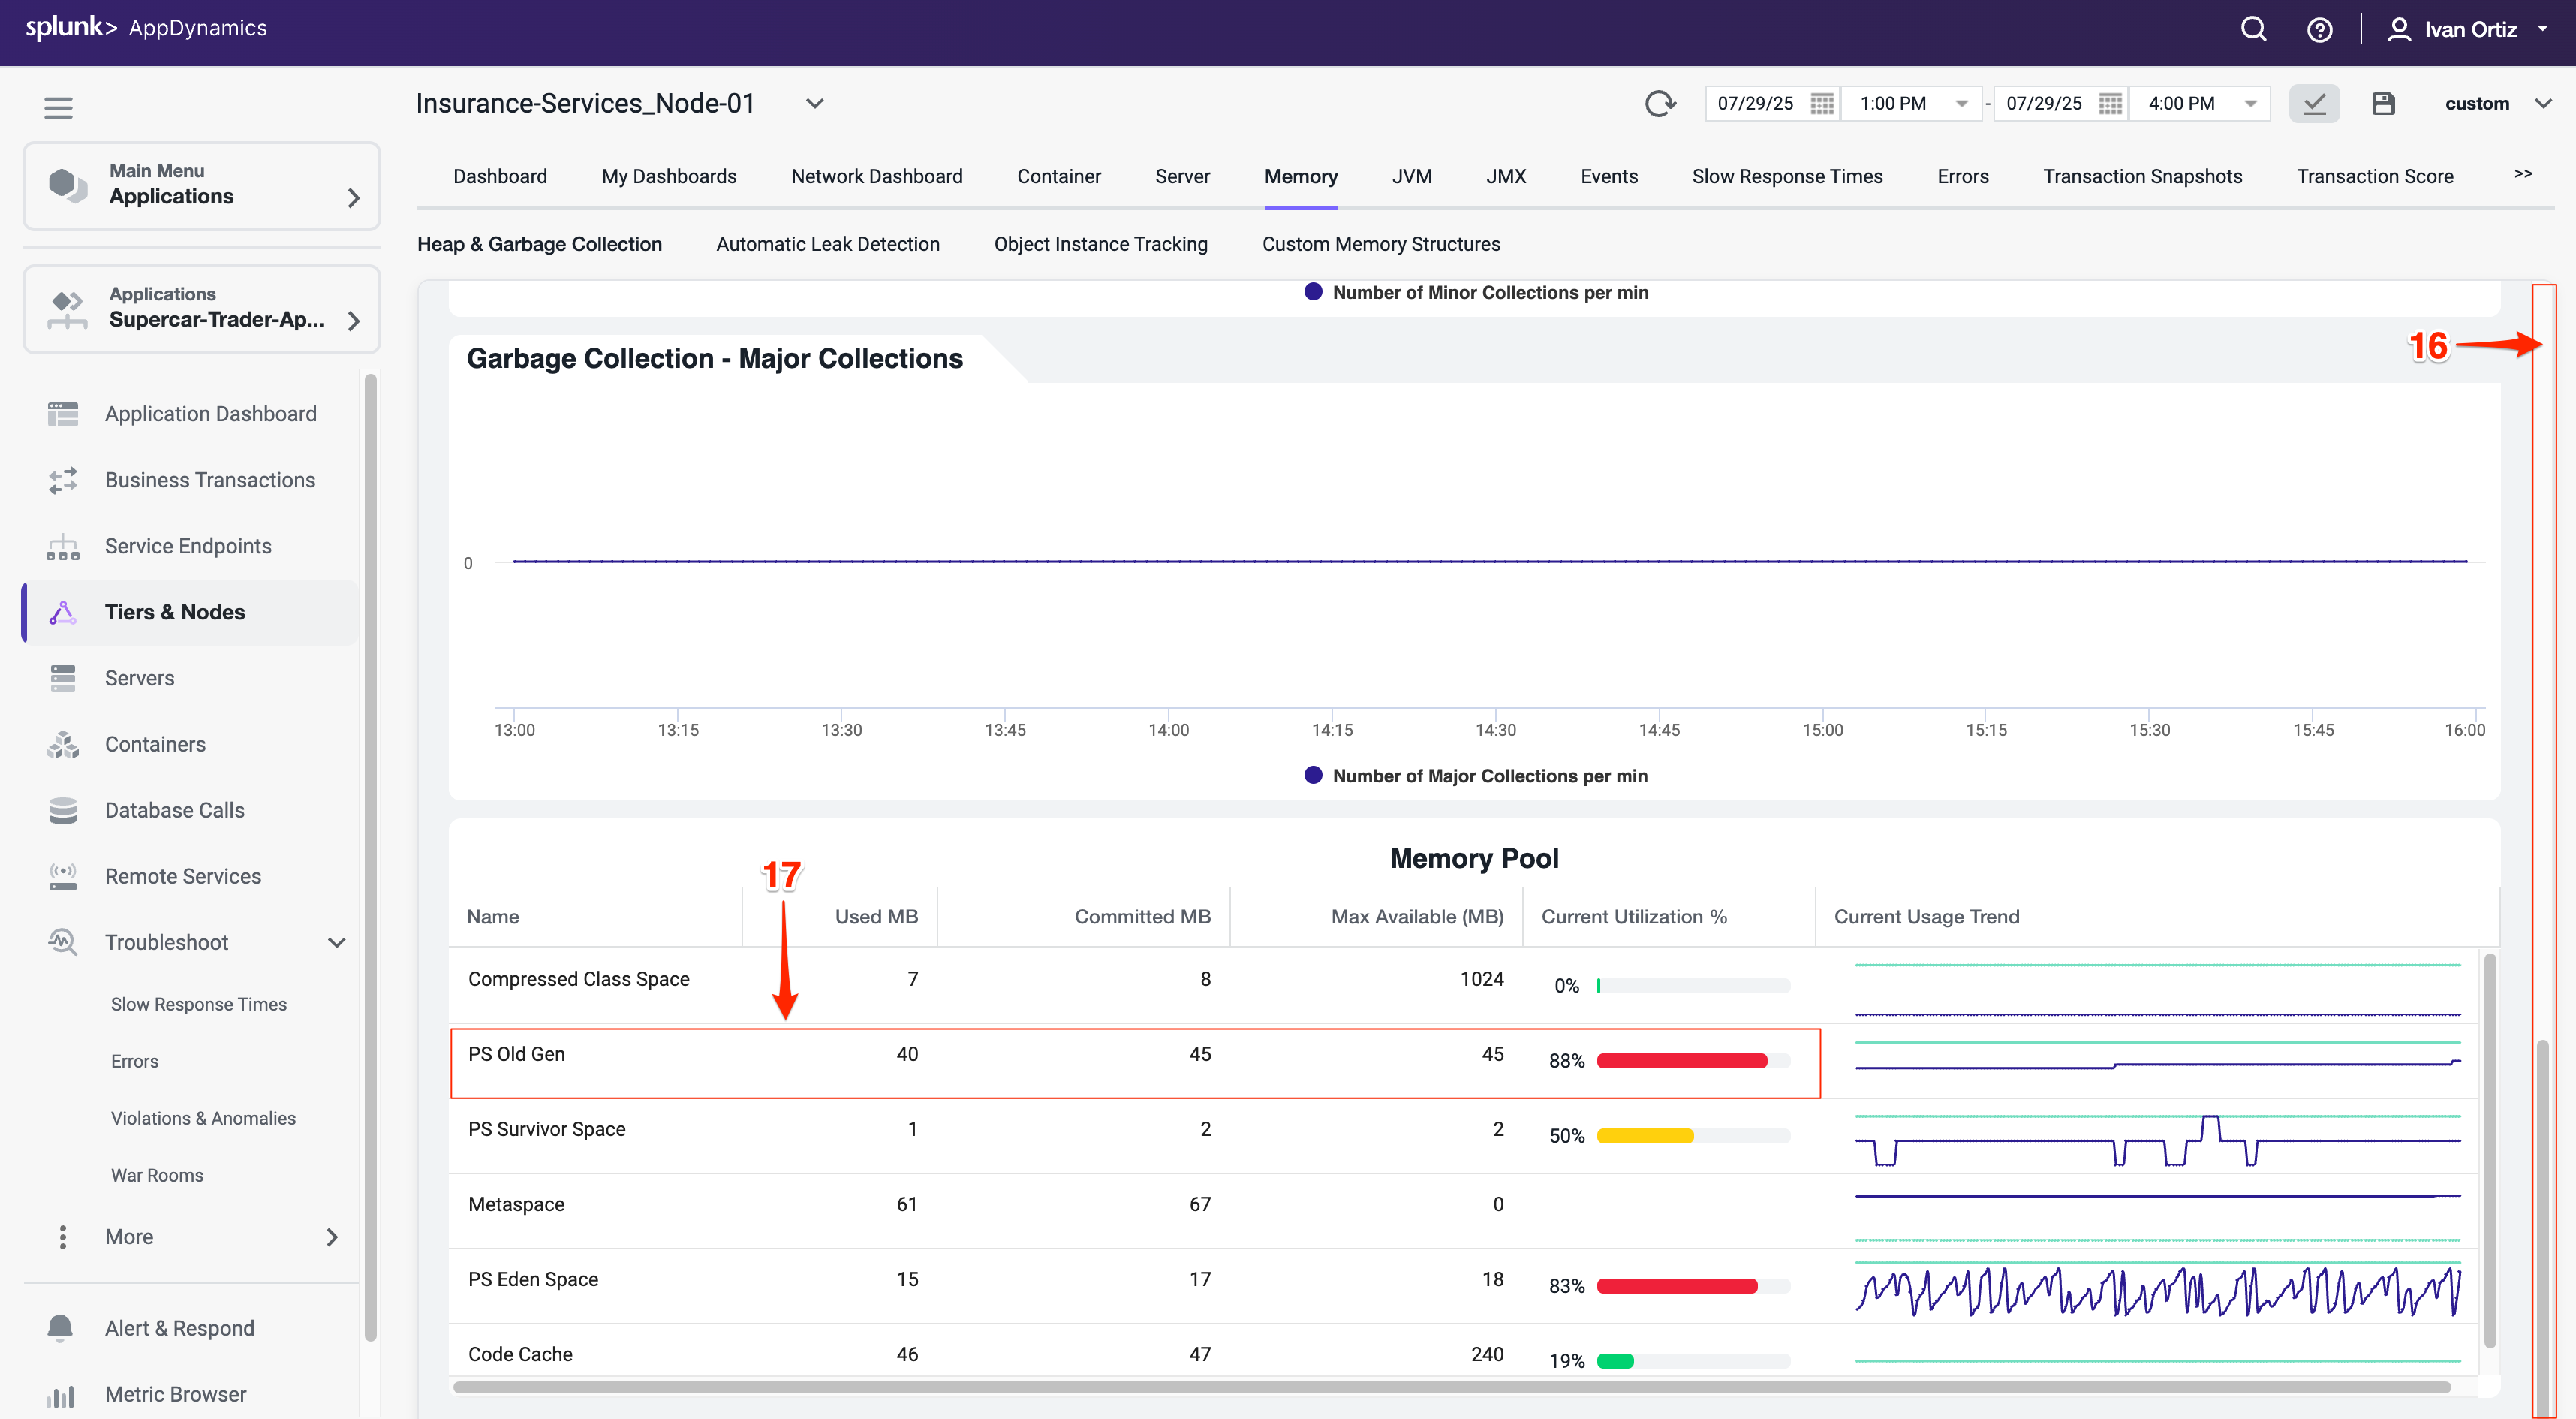
Investigate the JVM heap data using the steps below.
Click on the Memory tab.
Look at the current heap utilization.
Notice the Major Garbage Collections that have been occurring.
Note: If you have an issue seeing the Memory screen, try using an alternate browser (Firefox should render correctly for Windows, Linux, and Mac).

Use the outer scroll bar to scroll to the bottom of the screen.
Note high PS Old Gen memory usage as a potential sign of memory leaks or inefficient garbage collection. Identifying memory pressure early can prevent outages.
You can read more about Node and JVM monitoring here and here.
Summary
In this lab, you learned how to effectively use AppDynamics to identify and troubleshoot application errors and node health issues. You started by locating specific errors and exceptions using the Errors dashboard, understanding their frequency, types, and impact on your application. You drilled down into error snapshots and stack traces to pinpoint the root cause of failures.
Next, you explored node health monitoring by interpreting visual indicators on the Application Dashboard and investigating Health Rule Violations. You learned to analyze JVM memory metrics to detect potential performance bottlenecks related to garbage collection and heap usage.
Together, these skills enable proactive monitoring and rapid troubleshooting to maintain application performance and reliability.