In this Learning Lab you learn about AppDynamics Business iQ.
When you have completed this lab, you will be able to:
Enable analytics with the new Agentless Analytics Java Agent (v 4.5.15 +).
Configure HTTP data collectors.
Configure method invocation data collectors.
Understand dashboard components.
Build a business dashboard.
Workshop Environment
The lab environment has two hosts:
The first host runs the AppDynamics Controller and will be referred to from this point on as the Controller.
The second host runs the Supercar Trader application used in the labs. It will be the host where you will install the AppDynamics agents and will be referred to from this point on as the Application VM.
Controller VM
Application VM
Subsections of Business iQ
Lab Prerequisite
3 minutes
In this exercise you will complete the following tasks:
Access your AppDynamics Controller from your web browser.
Verify transaction load to the application.
Restart the application and transaction load if needed.
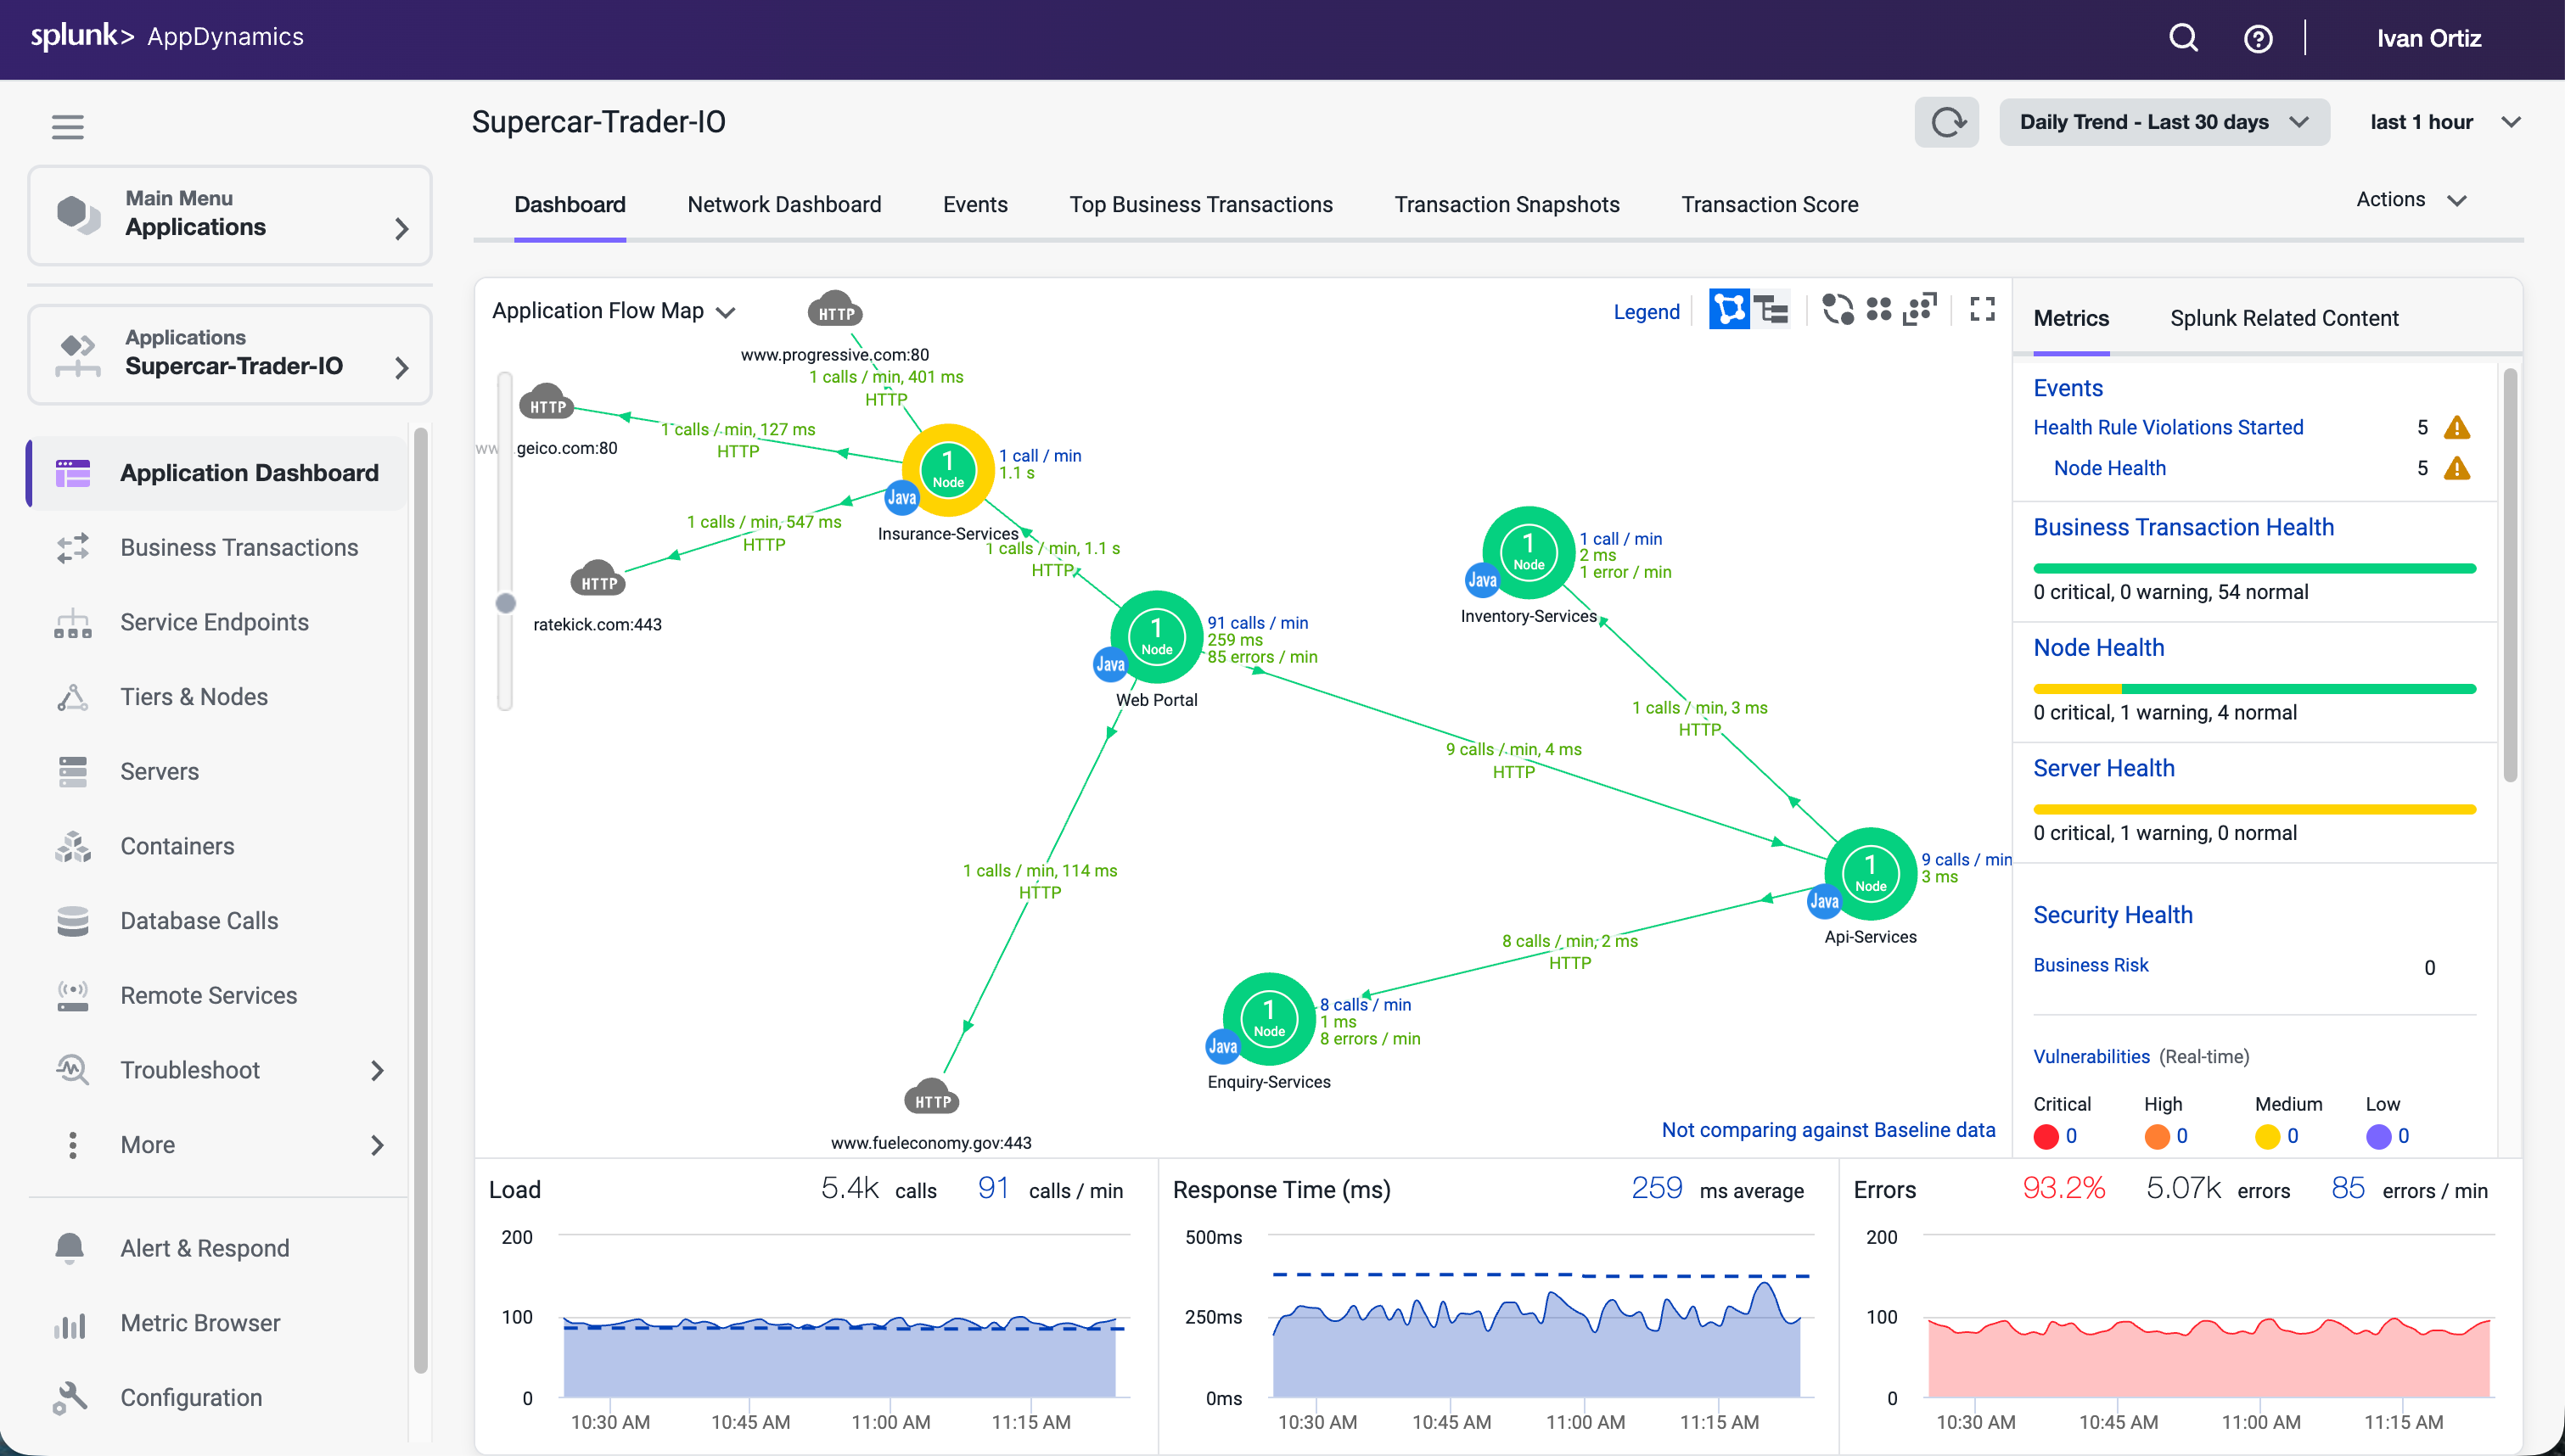
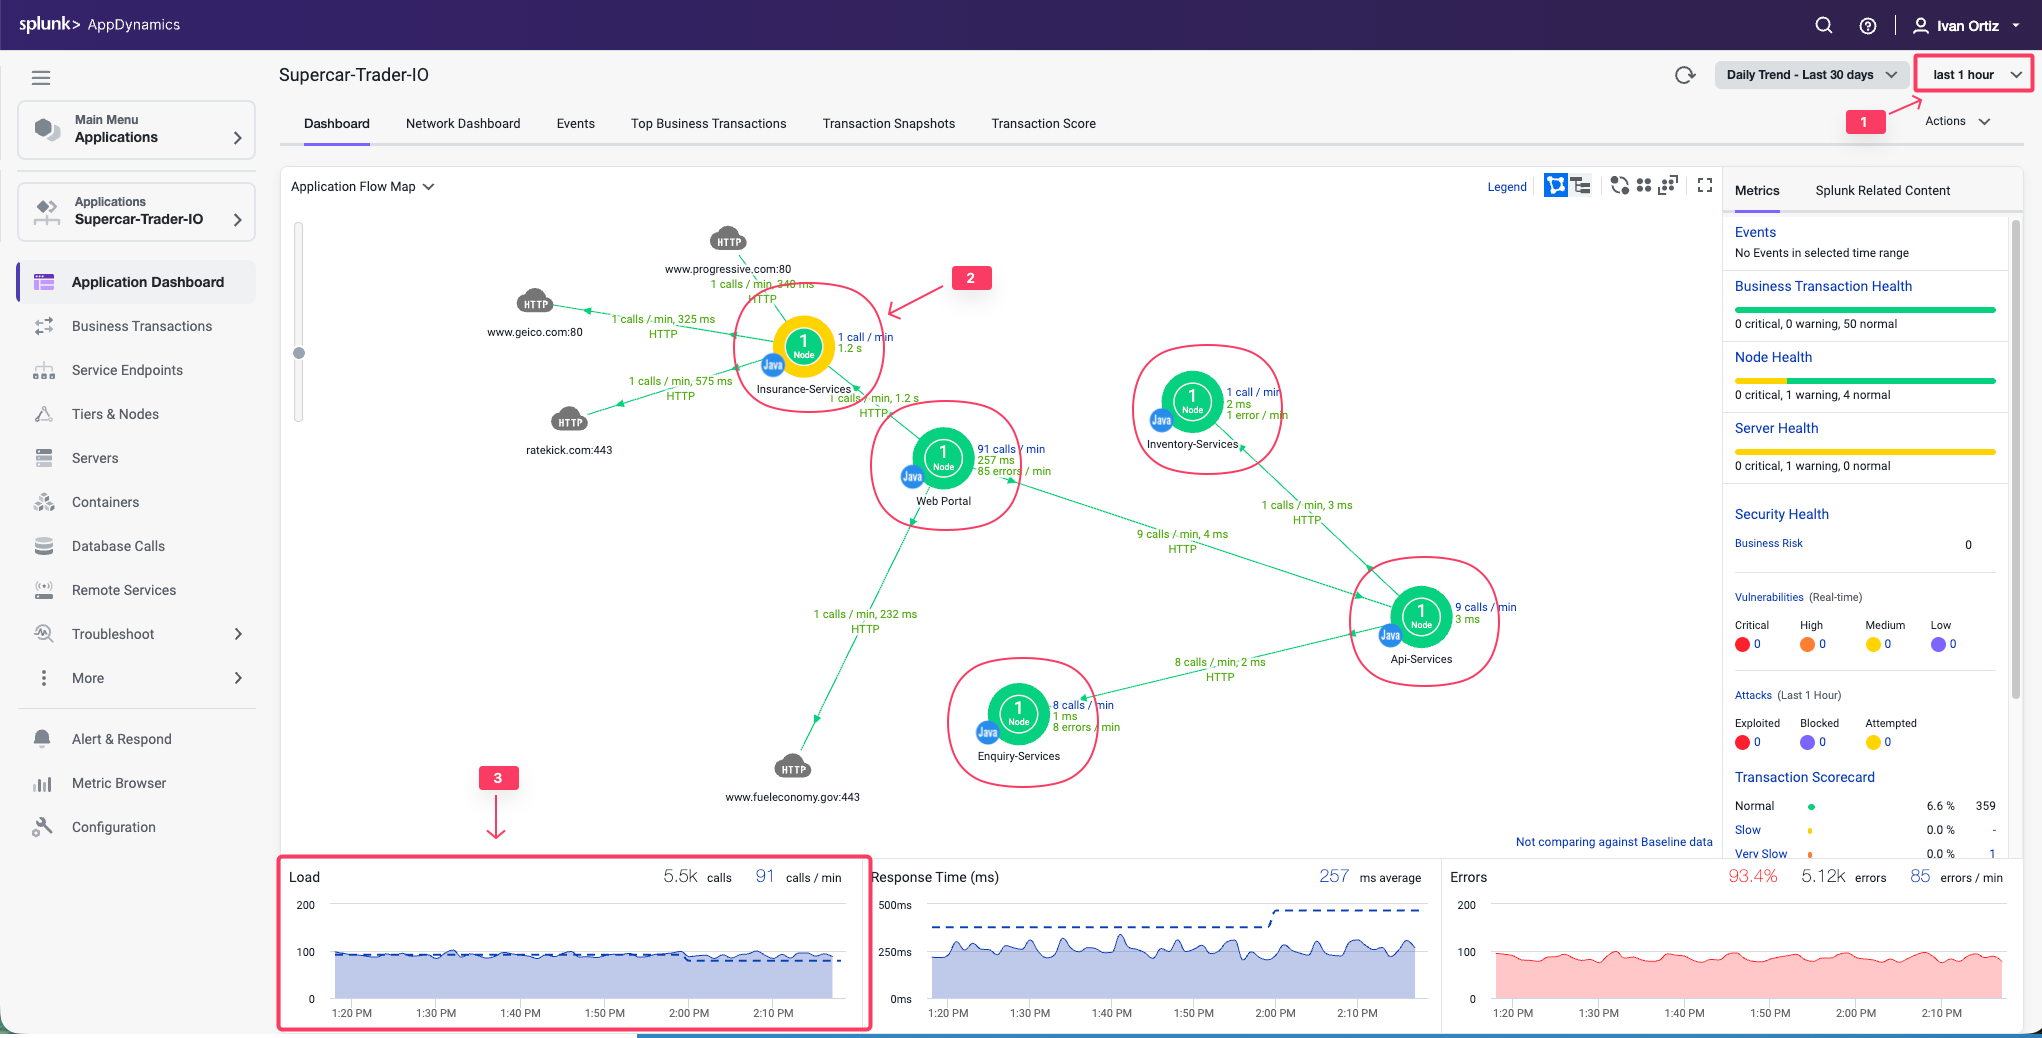
Verify you see the five different Tiers on the flow map.
Verify there has been consistent load over the last 1 hour.
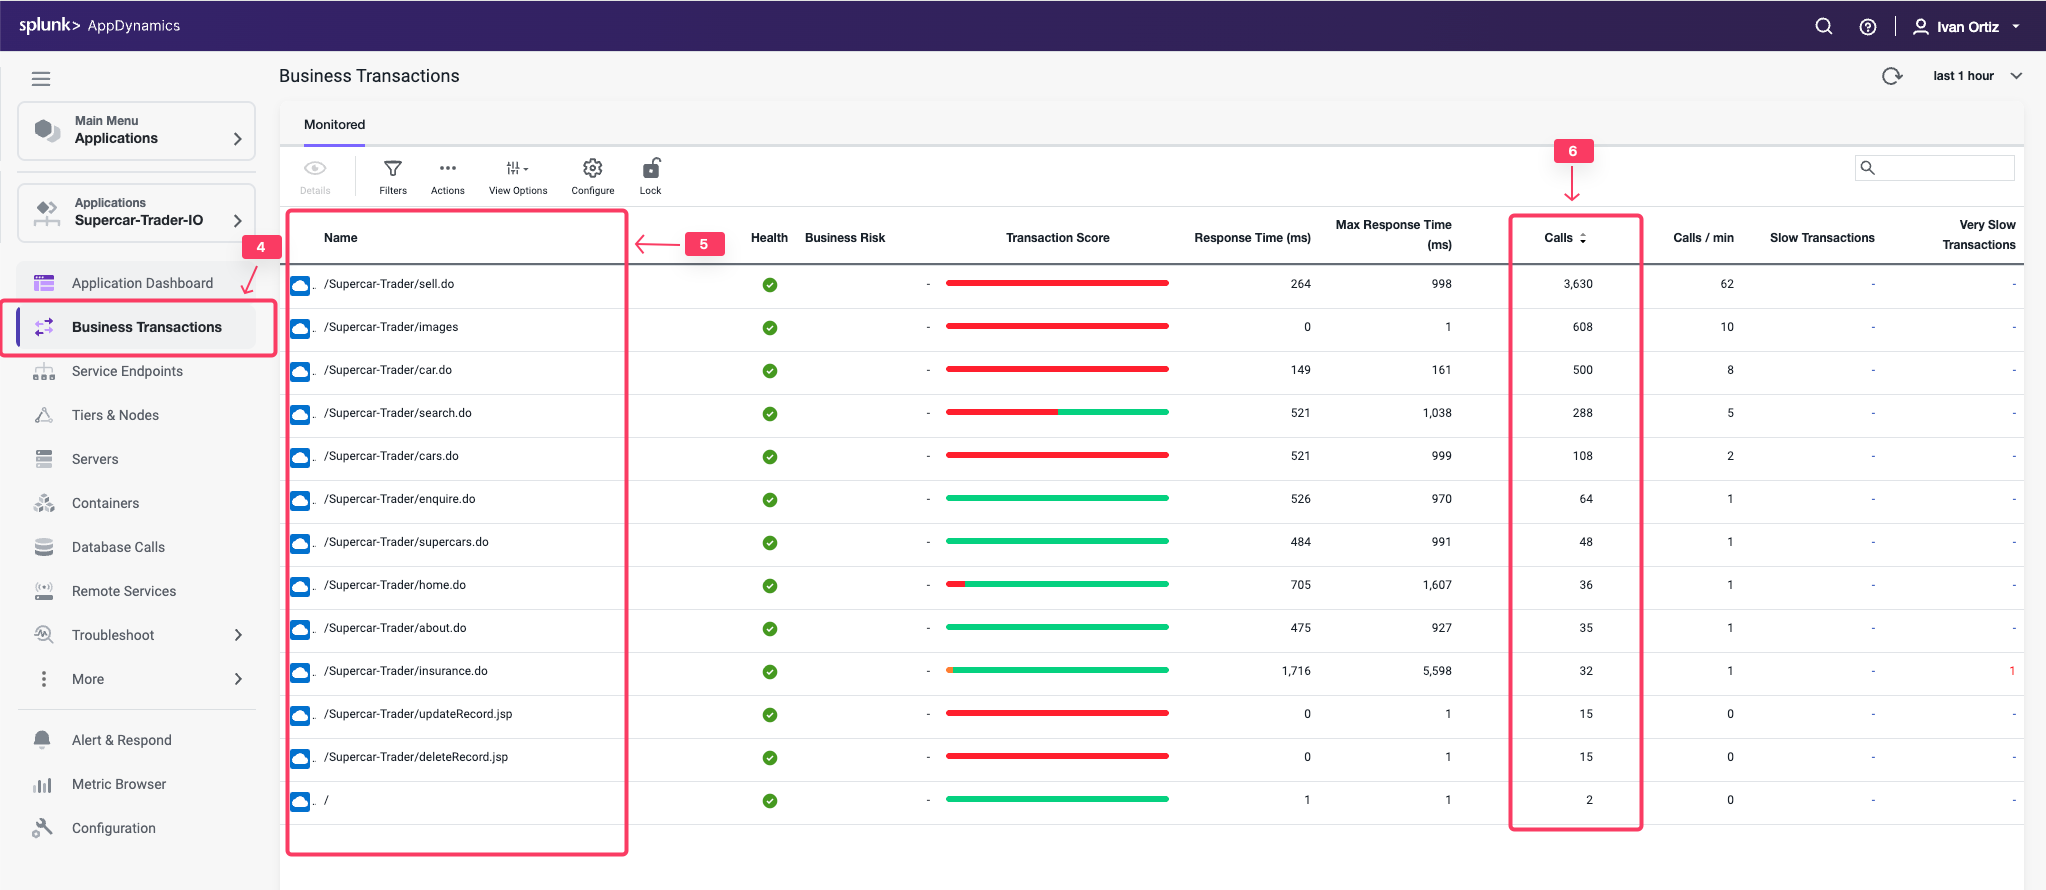
Check the list of business transactions:
Click the Business Transactions option on the left menu.
Verify you see the eleven business transactions seen below.
Verify that they have some number of calls during the last hour.
Note: If you don’t see the Calls column, you can click the View Options toolbar button to show that column.
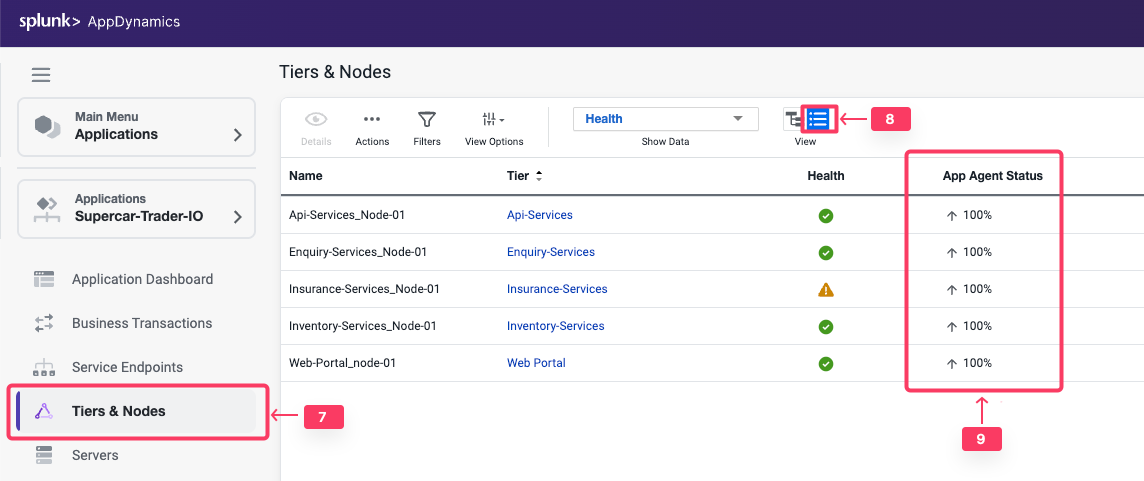
Check the agent status for the Nodes:
Click the Tiers & Nodes option on the left menu.
Click Grid View.
Verify that the App Agent Status for each Node is greater than 90% during the last hour.
Restart the Application and Load Generation if Needed
If any of the checks you performed in the previous steps could not be verified, SSH into your Application VM and follow these steps to restart the application and transaction load.
Use the following commands to stop the running instance of Apache Tomcat.
cd /usr/local/apache/apache-tomcat-9/bin
./shutdown.sh
Use the command below to check for remaining application JVMs still running.
ps -ef | grep Supercar-Trader
If you find any remaining application JVMs still running, kill the remaining JVMs using the command below.
sudo pkill -f Supercar-Trader
Use the following commands to stop the load generation for the application. Wait until all processes are stopped.
cd /opt/appdynamics/lab-artifacts/phantomjs
./stop_load.sh
Restart the Tomcat server:
cd /usr/local/apache/apache-tomcat-9/bin
./startup.sh
Wait for two minutes and use the following command to ensure Apache Tomcat is running on port 8080.
Use the following commands to start the load generation for the application.
cd /opt/appdynamics/lab-artifacts/phantomjs
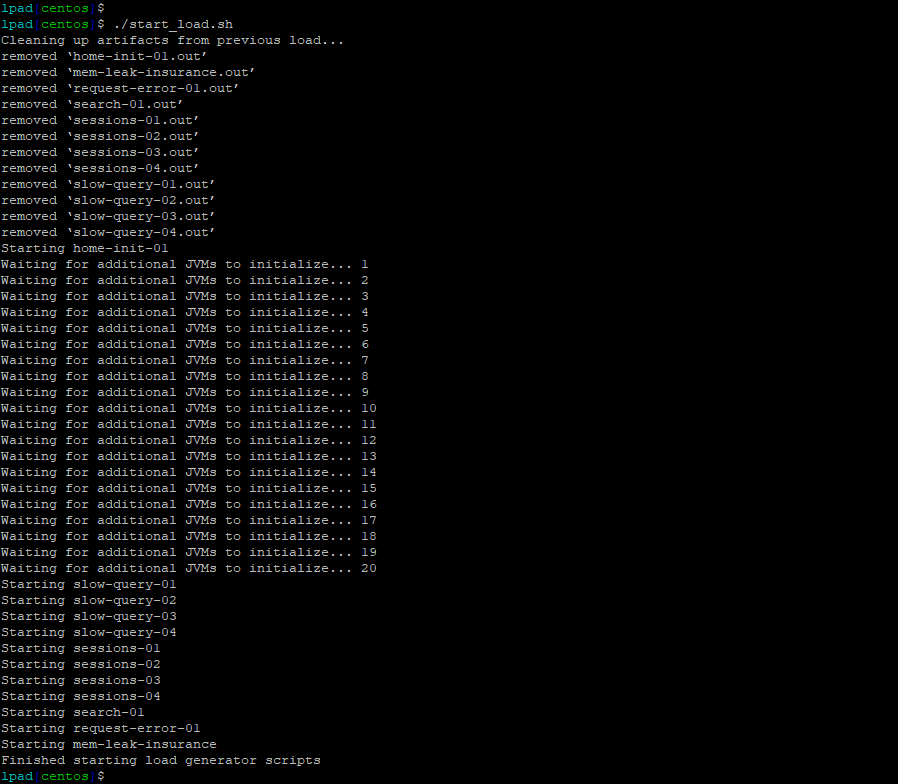
./start_load.sh
You should see output similar to the following image.
Enable Analytics on the Application
2 minutes
Analytics formerly required a separate agent that was bundled with Machine Agent. However, Analytics is now agentless and embedded in the APM Agent for both .NET Agent >= 20.10 and Java Agent >= 4.5.15 on Controllers >= 4.5.16
In this exercise you will access your AppDynamics Controller from your web browser and enable the Agentless Analytics from there.
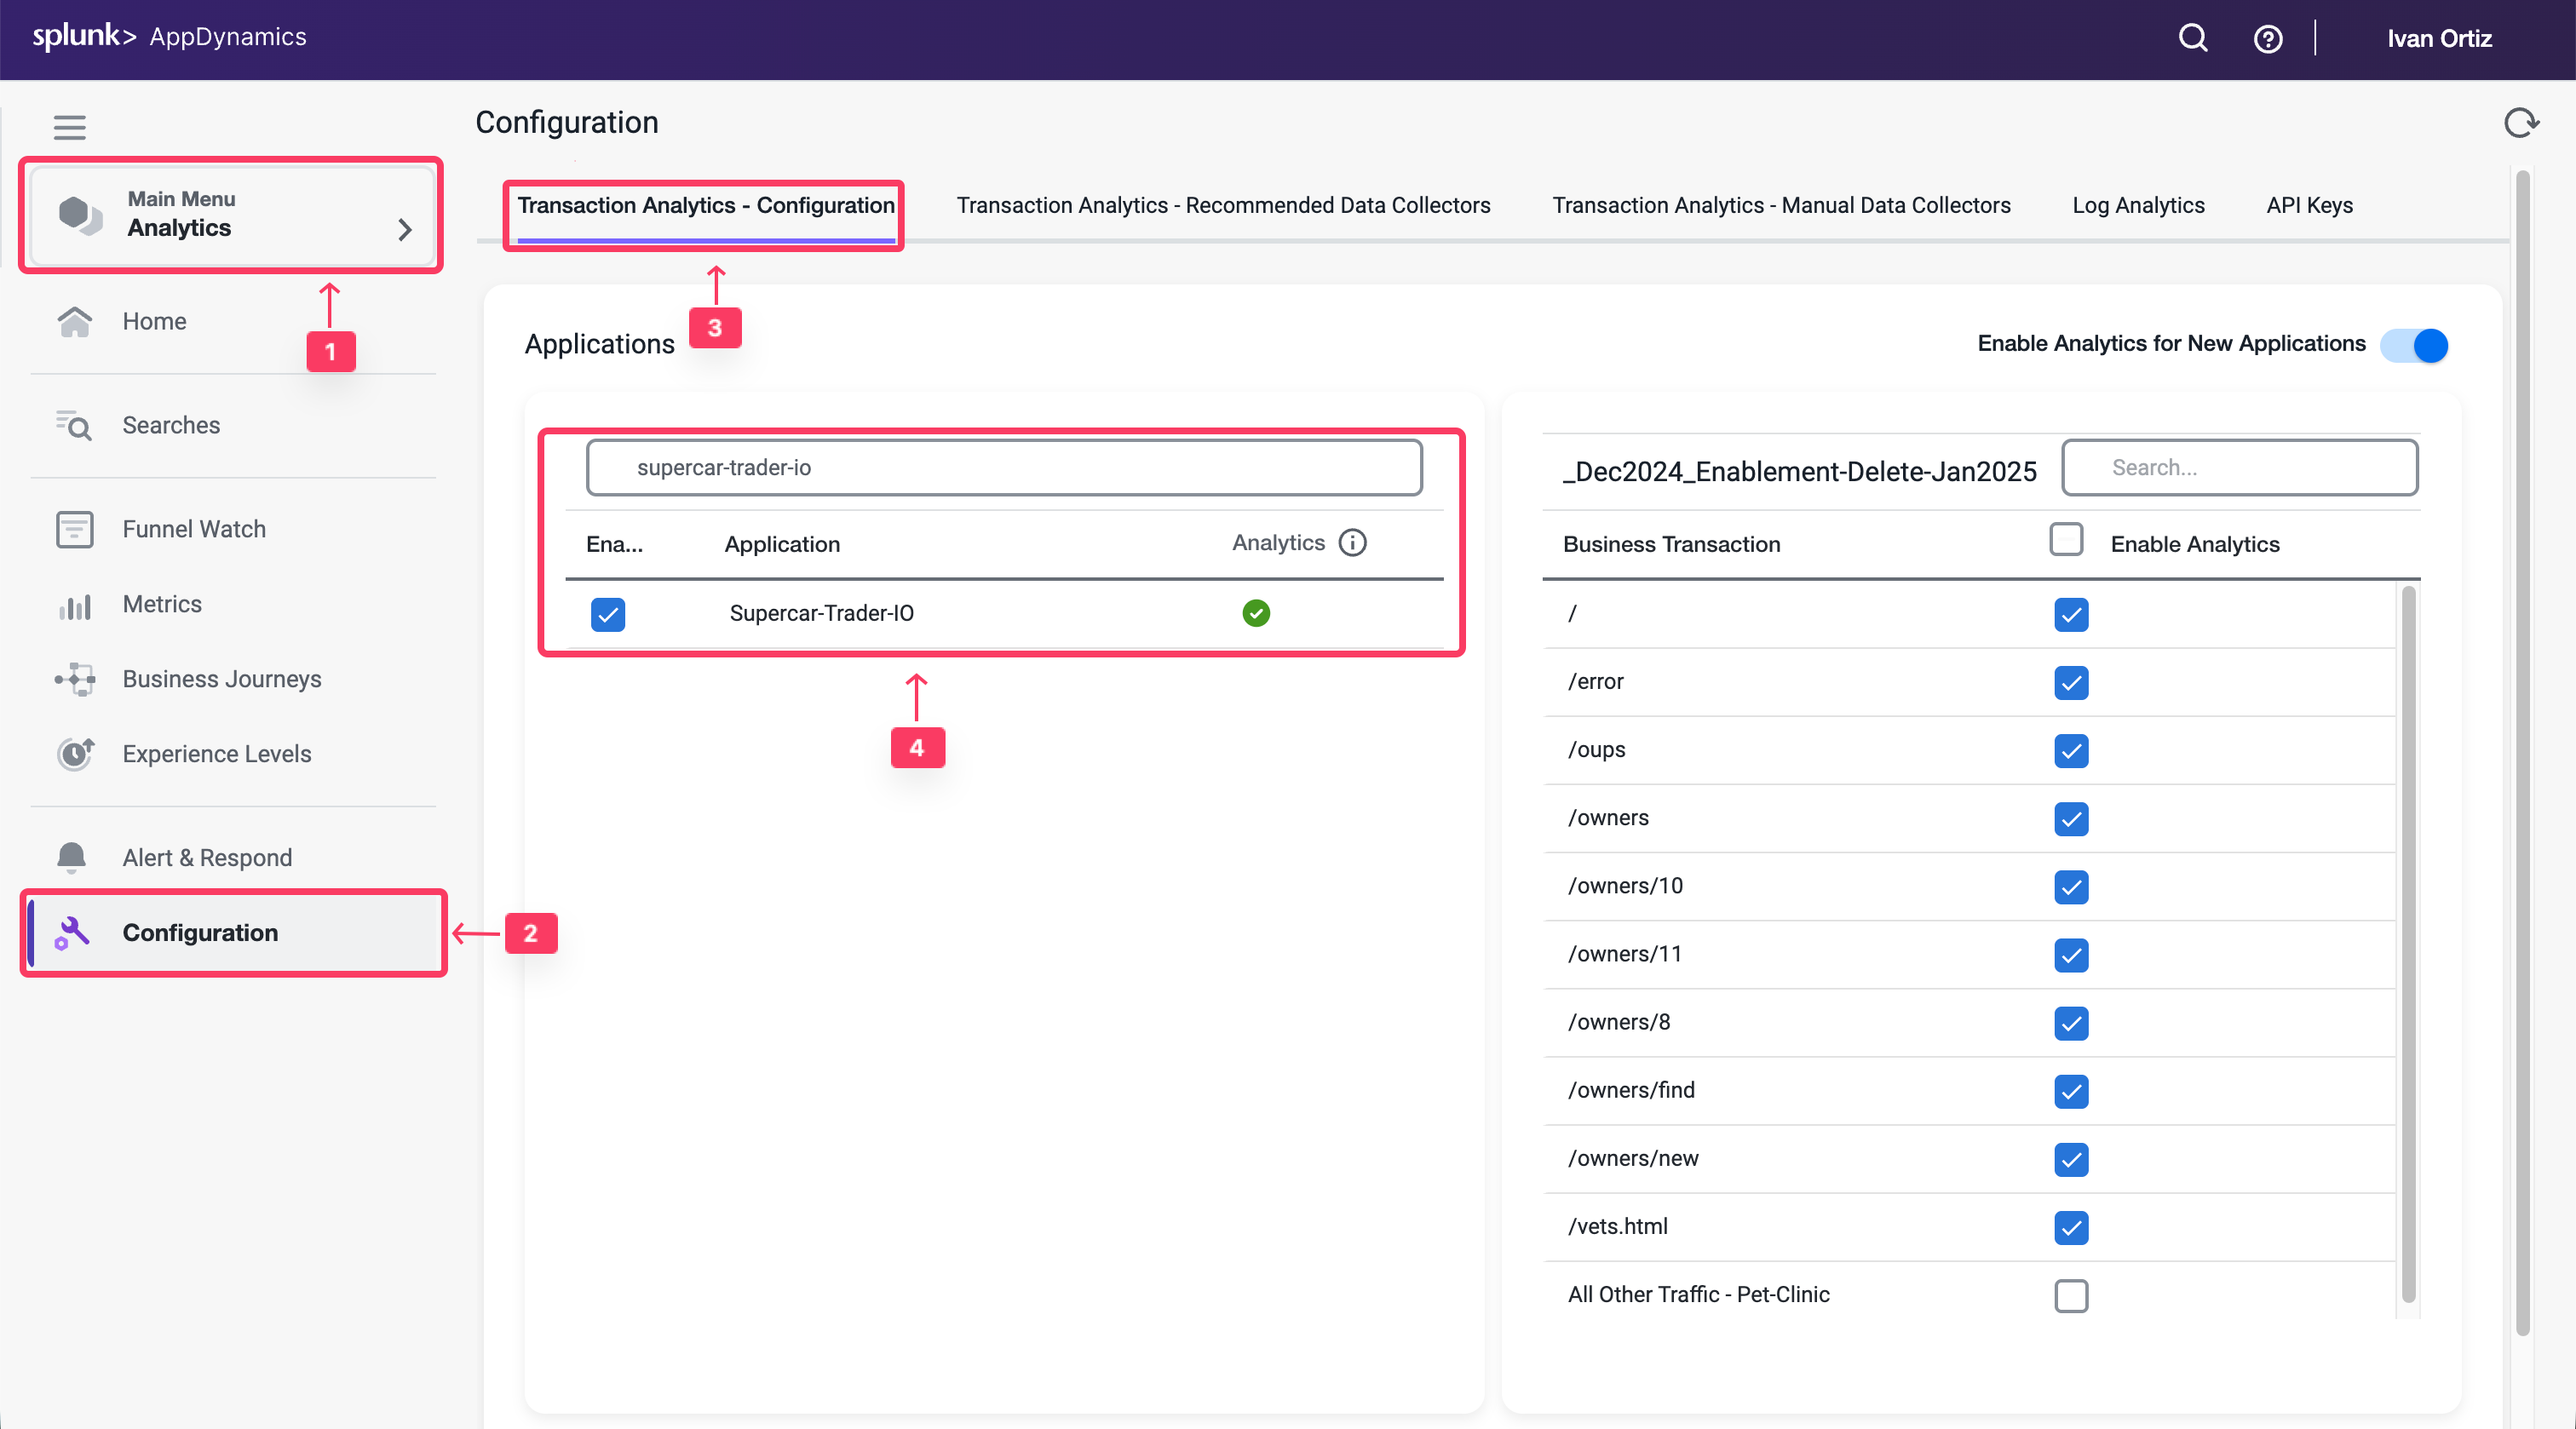
** Select the Analytics tab at the top left of the screen.
** Select the Configuration Left tab.
** Select the Transaction Analytics - Configuration tab.
** Mark the Checkbox next to Your Application Supercat-Trader-YOURINITIALS
** Click the Save button
Validate Transaction Summary
You want to verify that Analytics is working for that application and showing transactions.
Select the Analytics tab tab on the left menu.
Select the Home tab.
Under Transactions from filter to your application Supercar-Trader-YOURINITIALS
Configure HTTP Data Collectors
2 minutes
Data collectors enable you to supplement business transaction and transaction analytics data with application data. The application data can add context to business transaction performance issues. For example, they show the values of particular parameters or return value for business transactions affected by performance issues, such as the specific user, order, or product.
HTTP data collectors capture the URLs, parameter values, headers, and cookies of HTTP messages that are exchanged in a business transaction.
In this exercise you will perform the following tasks:
Enable all HTTP data collectors.
Observe and Select relevant HTTP data collectors.
Capture Business Data in Analytics using HTTP Params.
Validate Analytics on HTTP Parameters.
Enable all HTTP data collectors
Initially, you can capture all HTTP data collectors to learn which useful parameters you can capture into Analytics and use it in your Dashboards
Tip
It is strongly recommended that you perform this step on a UAT environment, not production.
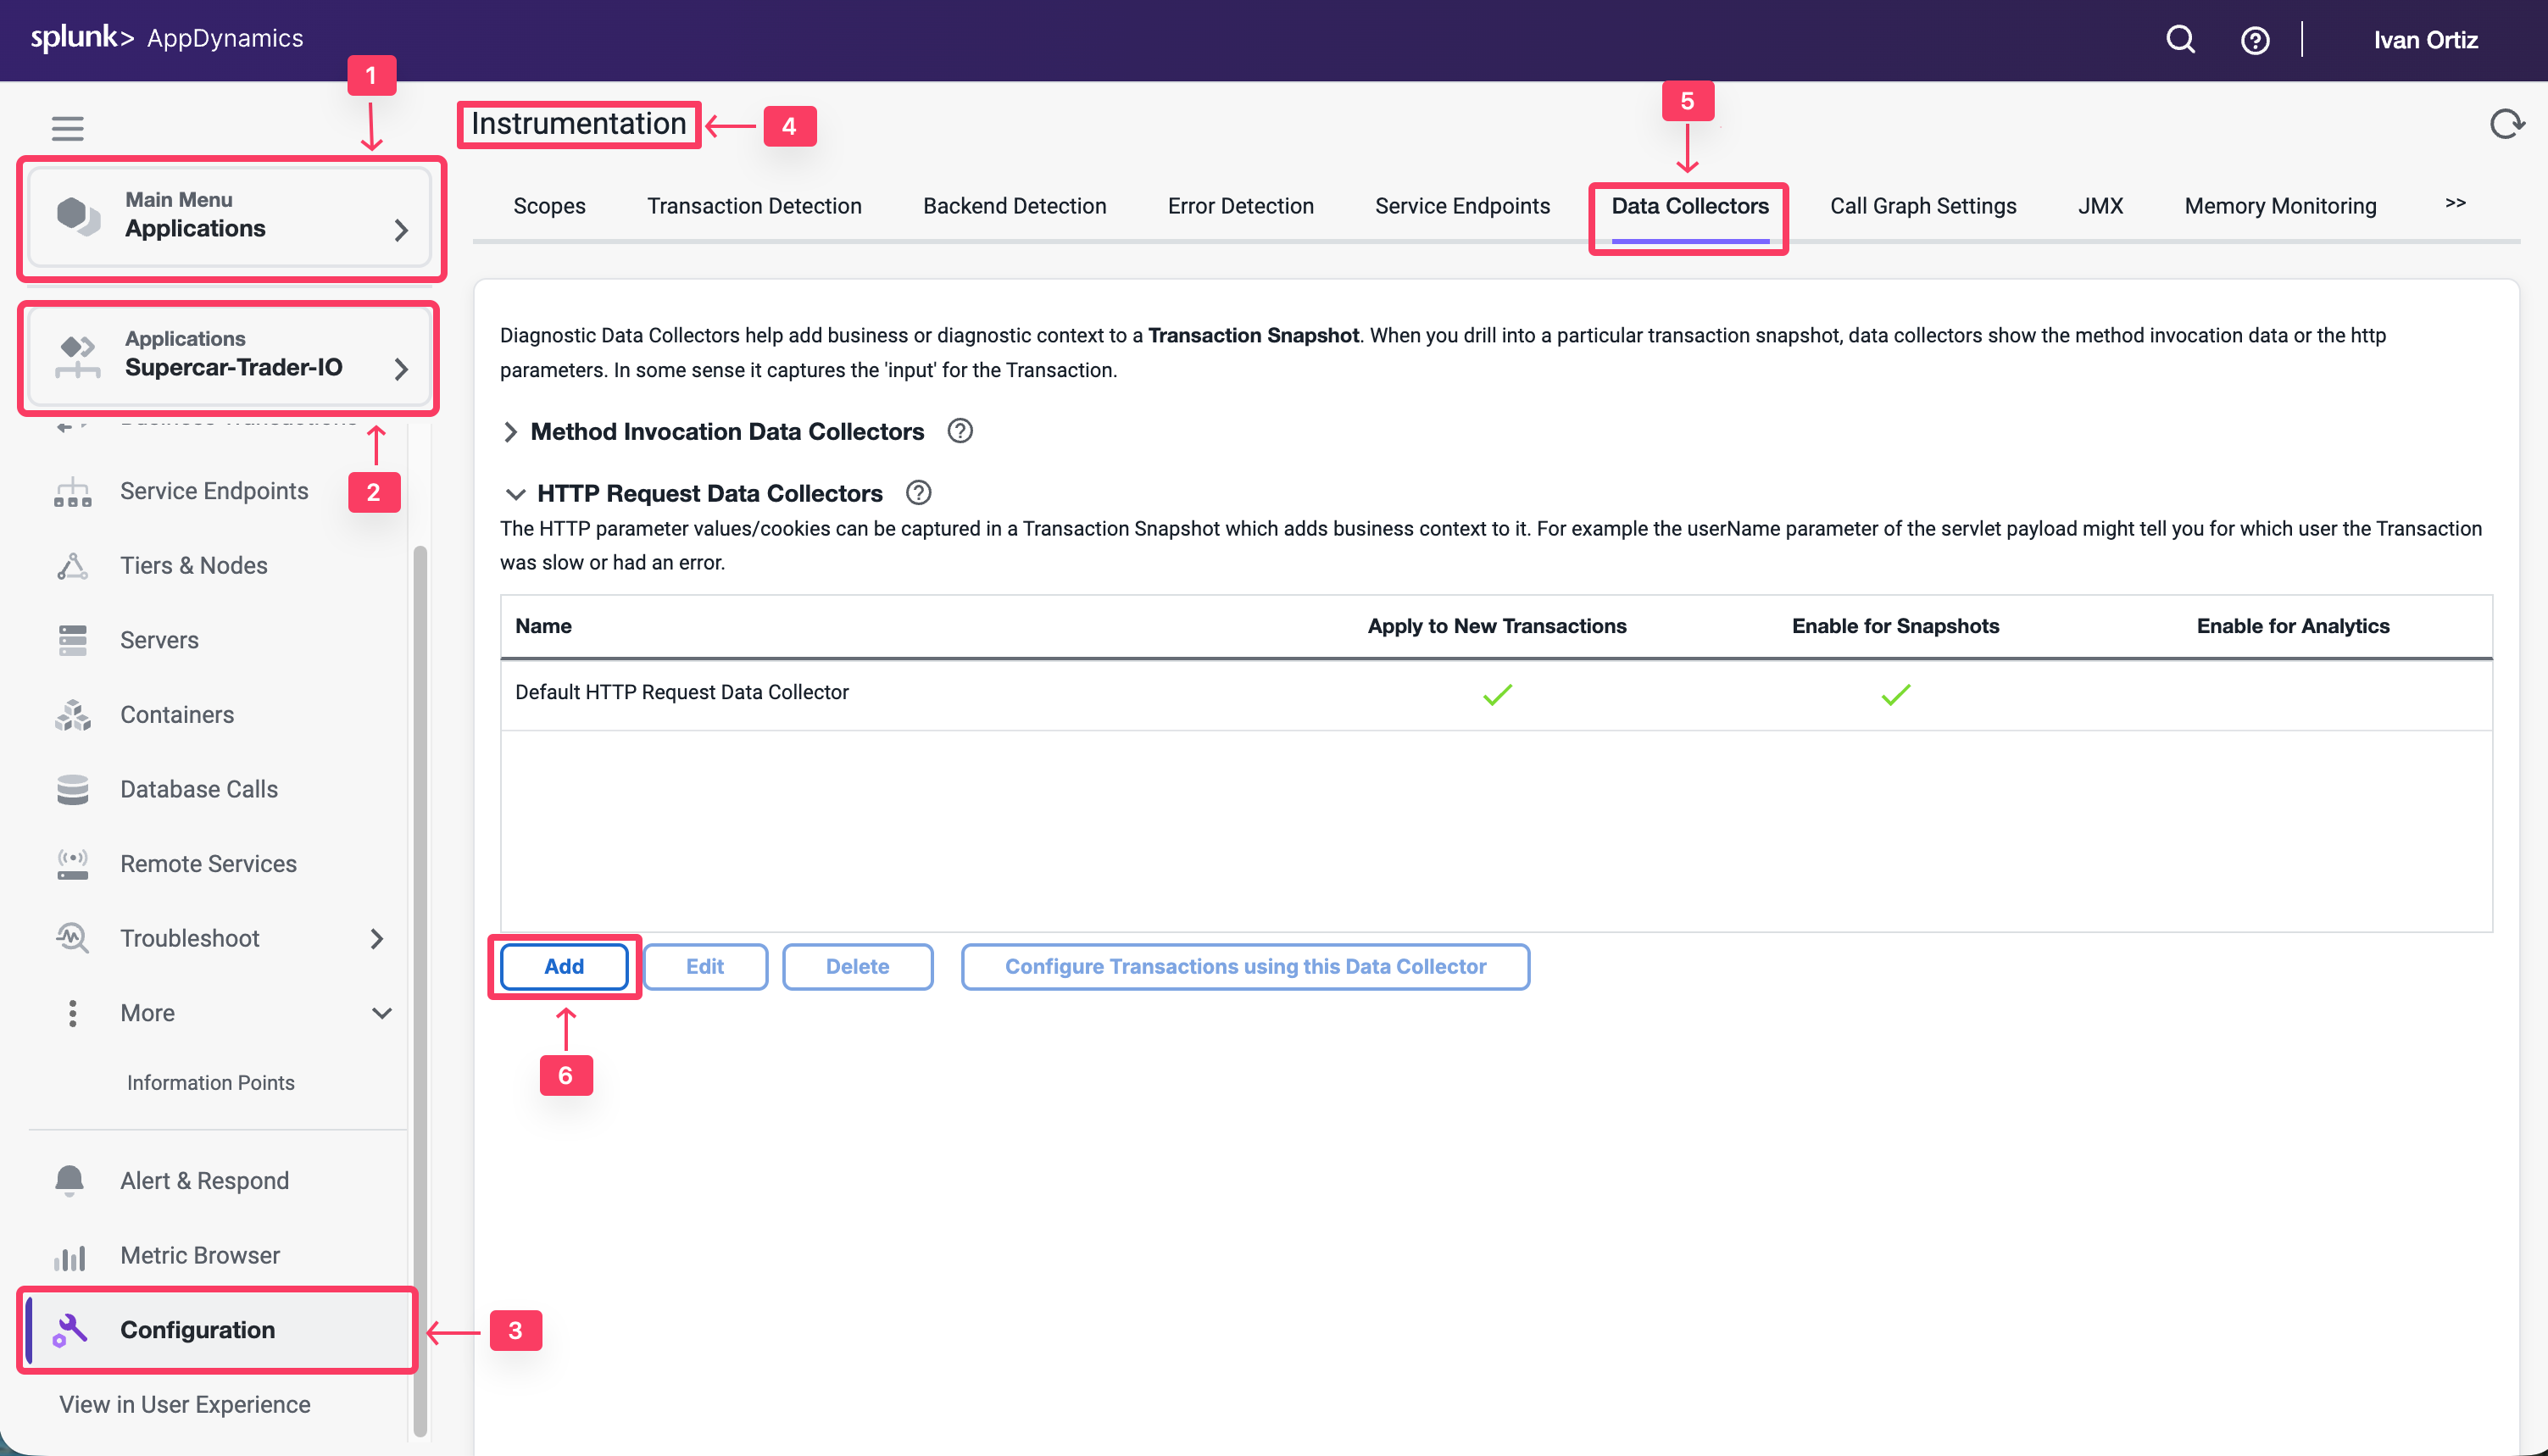
Select the Applications tab at the top left of the screen.
Select the Supercar-Trader-YOURINITIALS Application.
Select the Configuration Left tab.
Click on the Instrumentation Link.
Select the Data Collectors tab.
Click on the Add Button in the HTTP Request Data Collectors
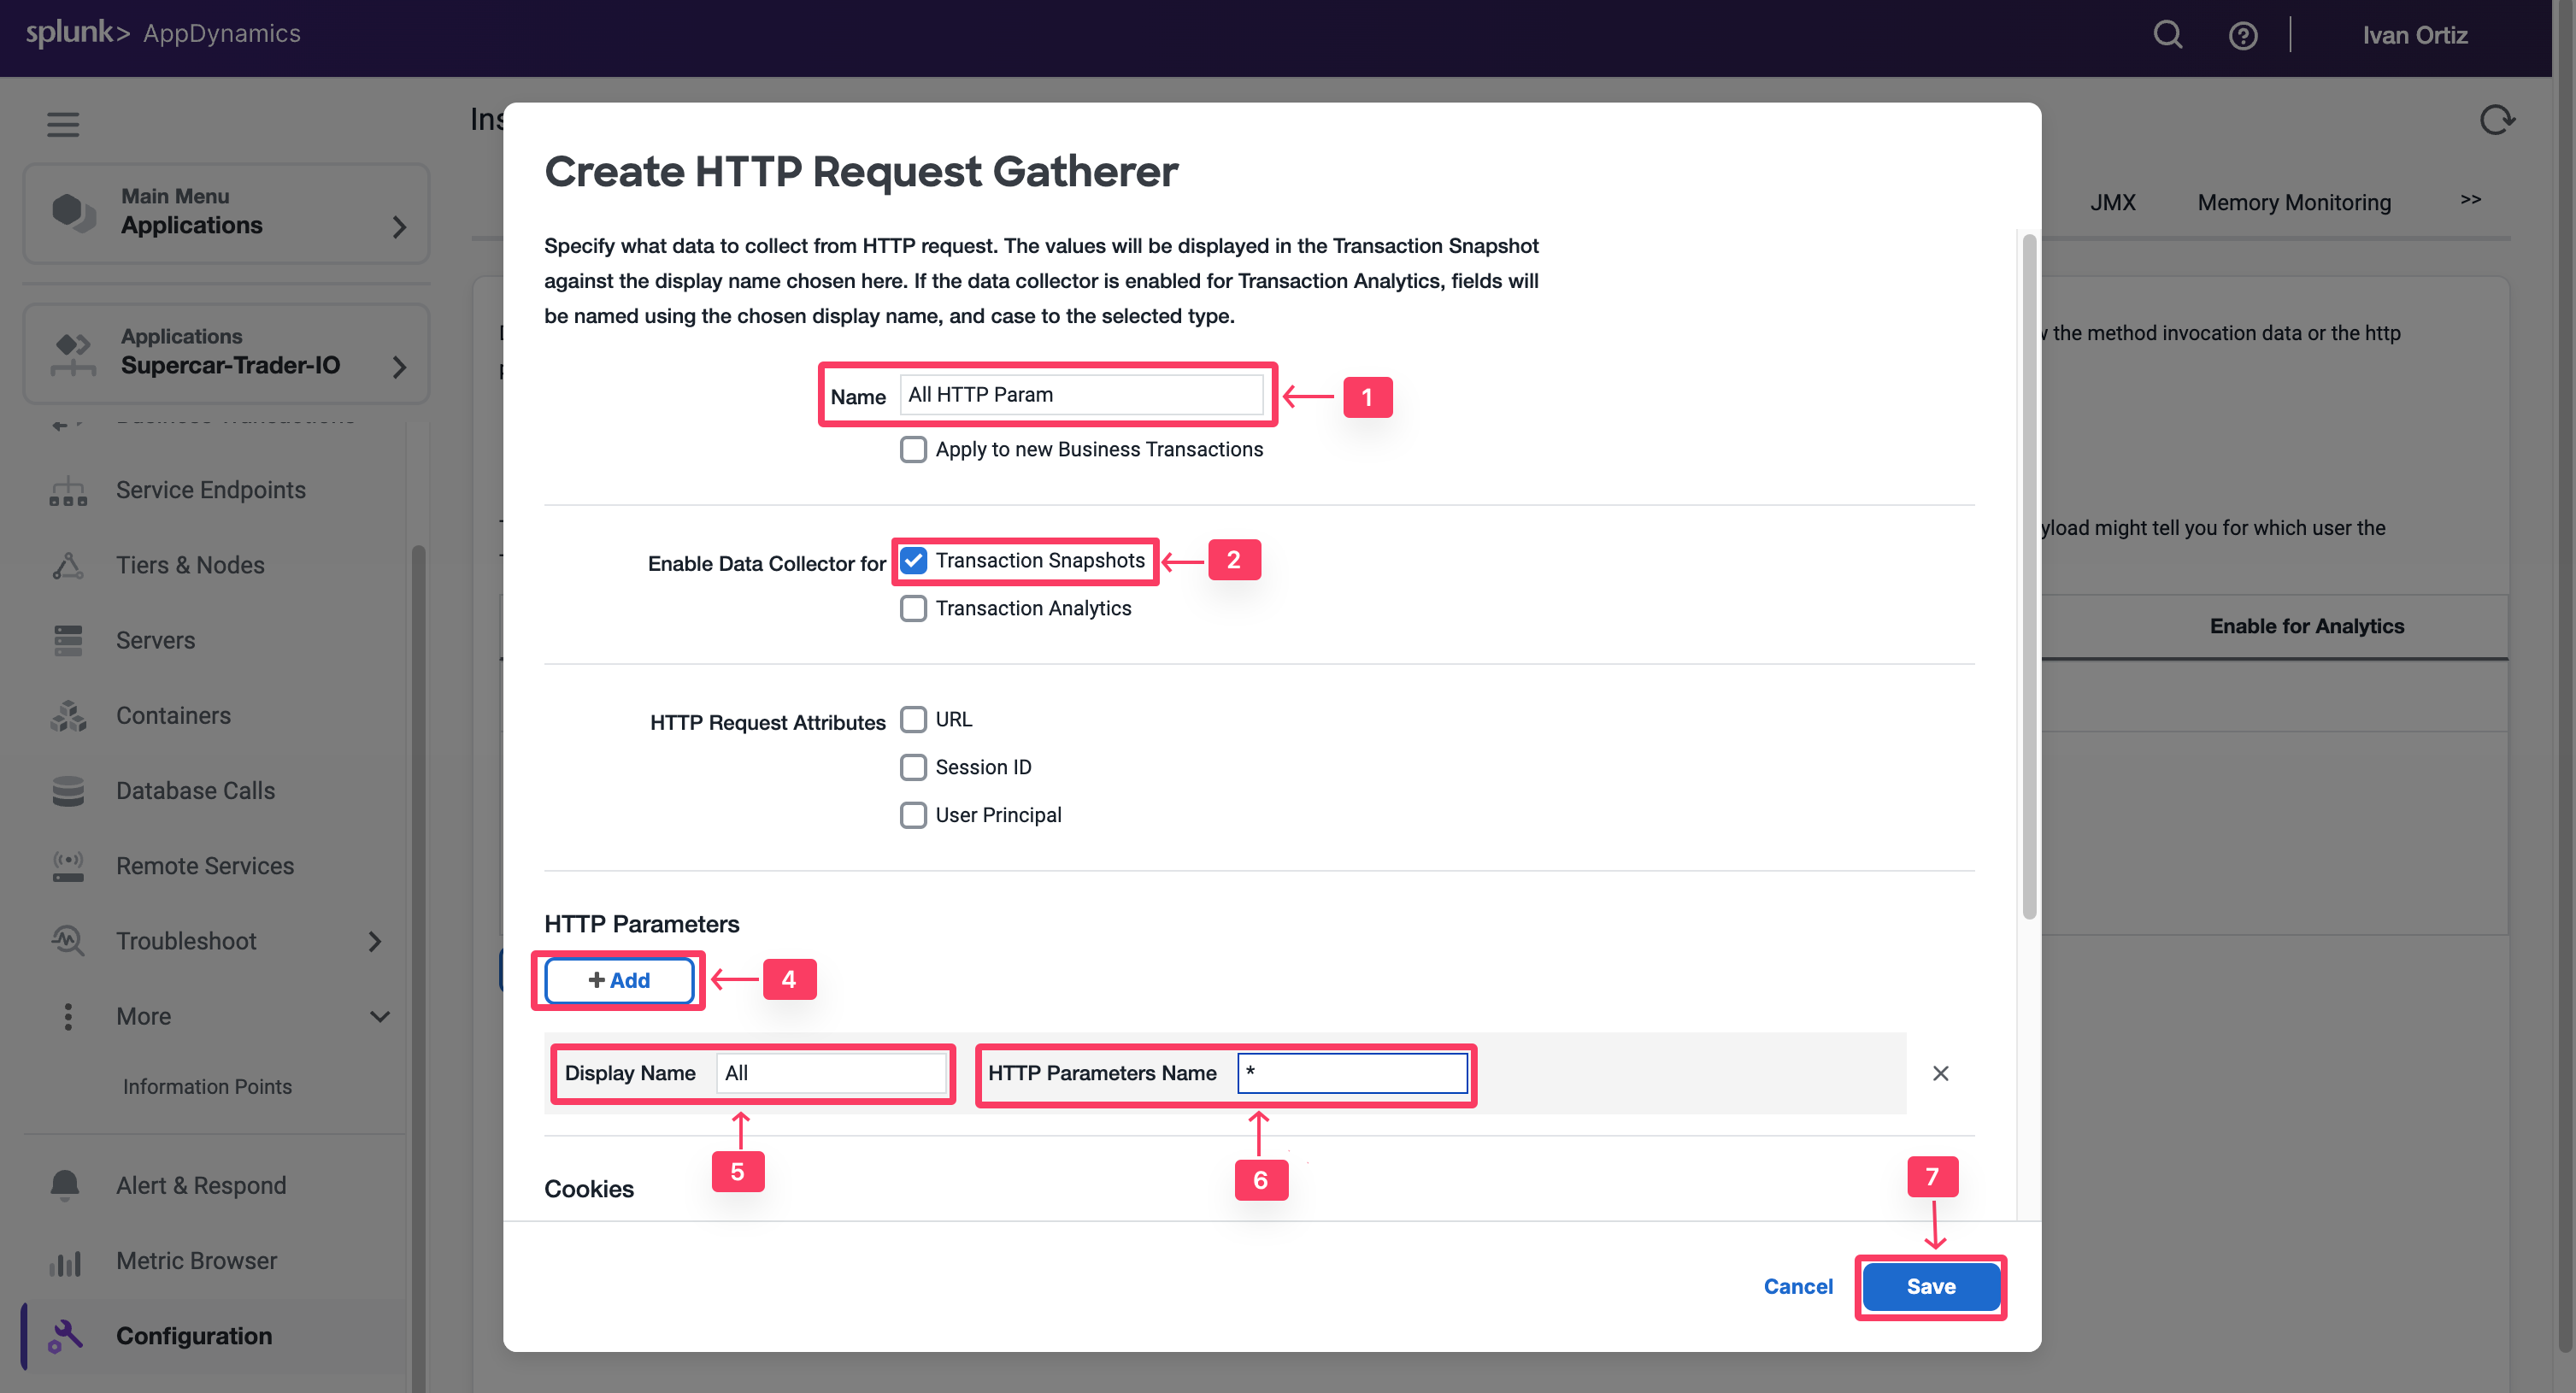
You will now configure an HTTP data collector to capture all HTTP Parameters. You will only enable it on Transaction Snapshots to avoid any overheads until you identify the precise parameters that you need for Transaction Analytics
For the Name, specify All HTTP Param.
Under Enable Data Collector for check the box for Transaction Snapshots.
Do not enable Transaction Analytics.
Click on + Add in the HTTP Parameters section.
For the new Parameter, specify All as the Display Name
Then specify an asterisk * in the HTTP Parameter name.
Click Save
Click “Ok” to confirm the data collector.
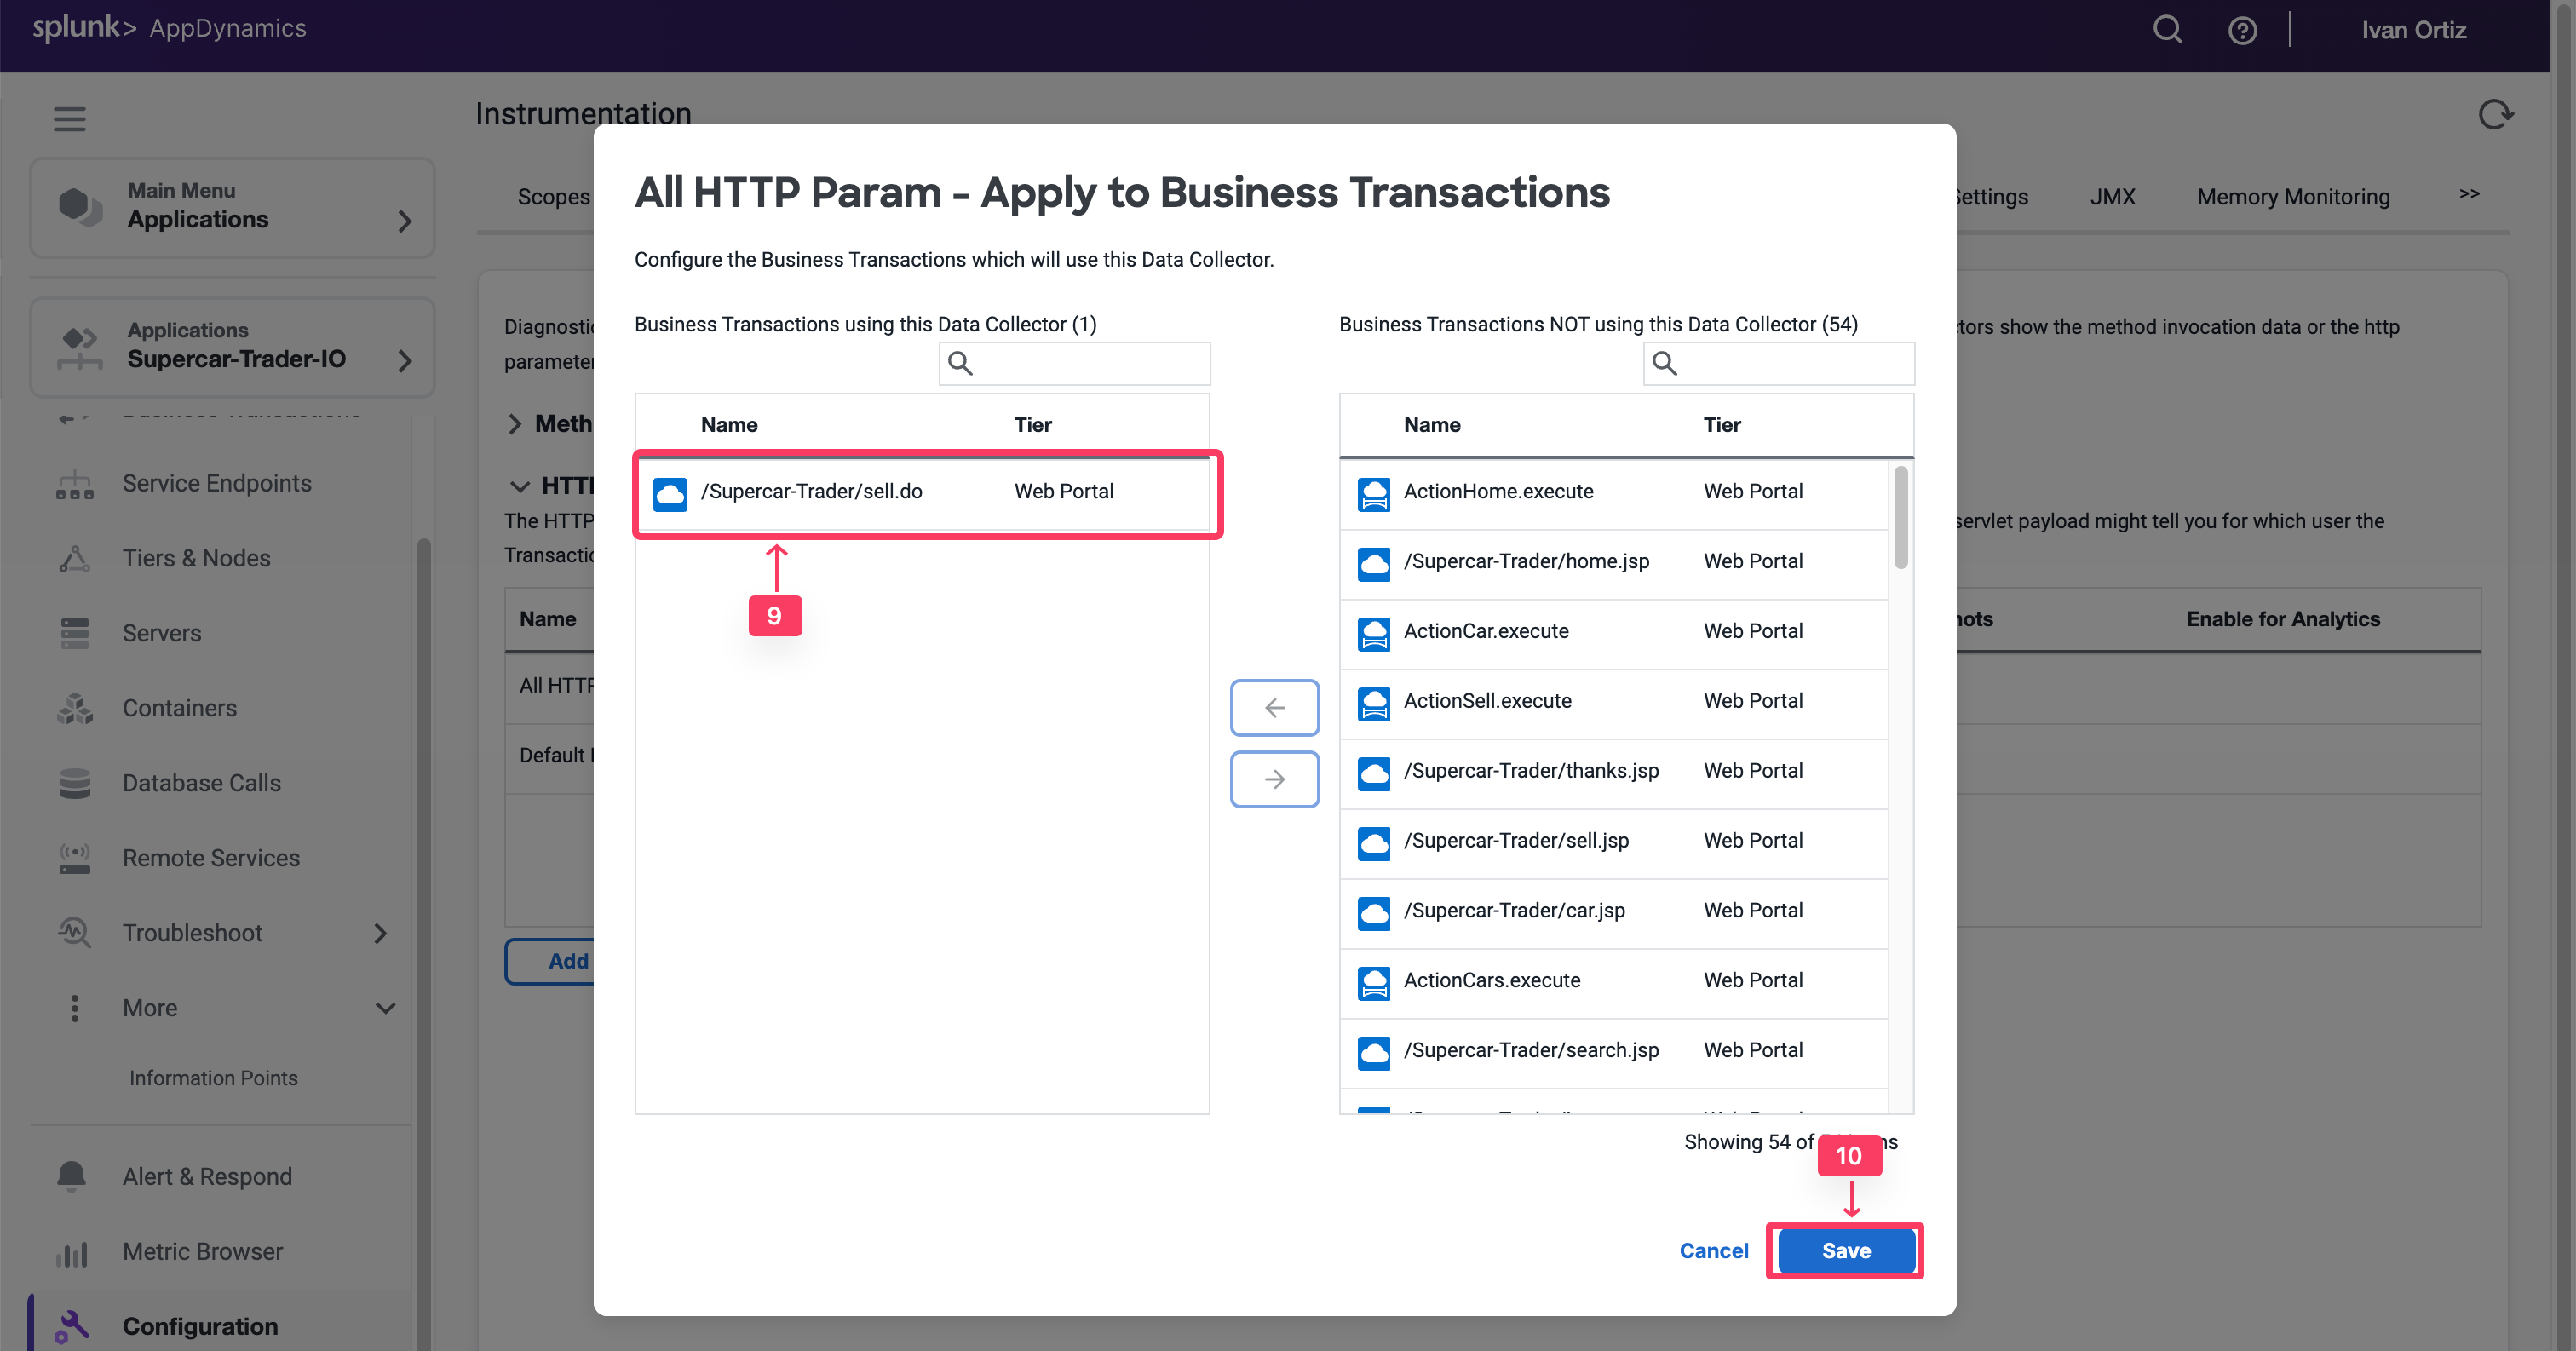
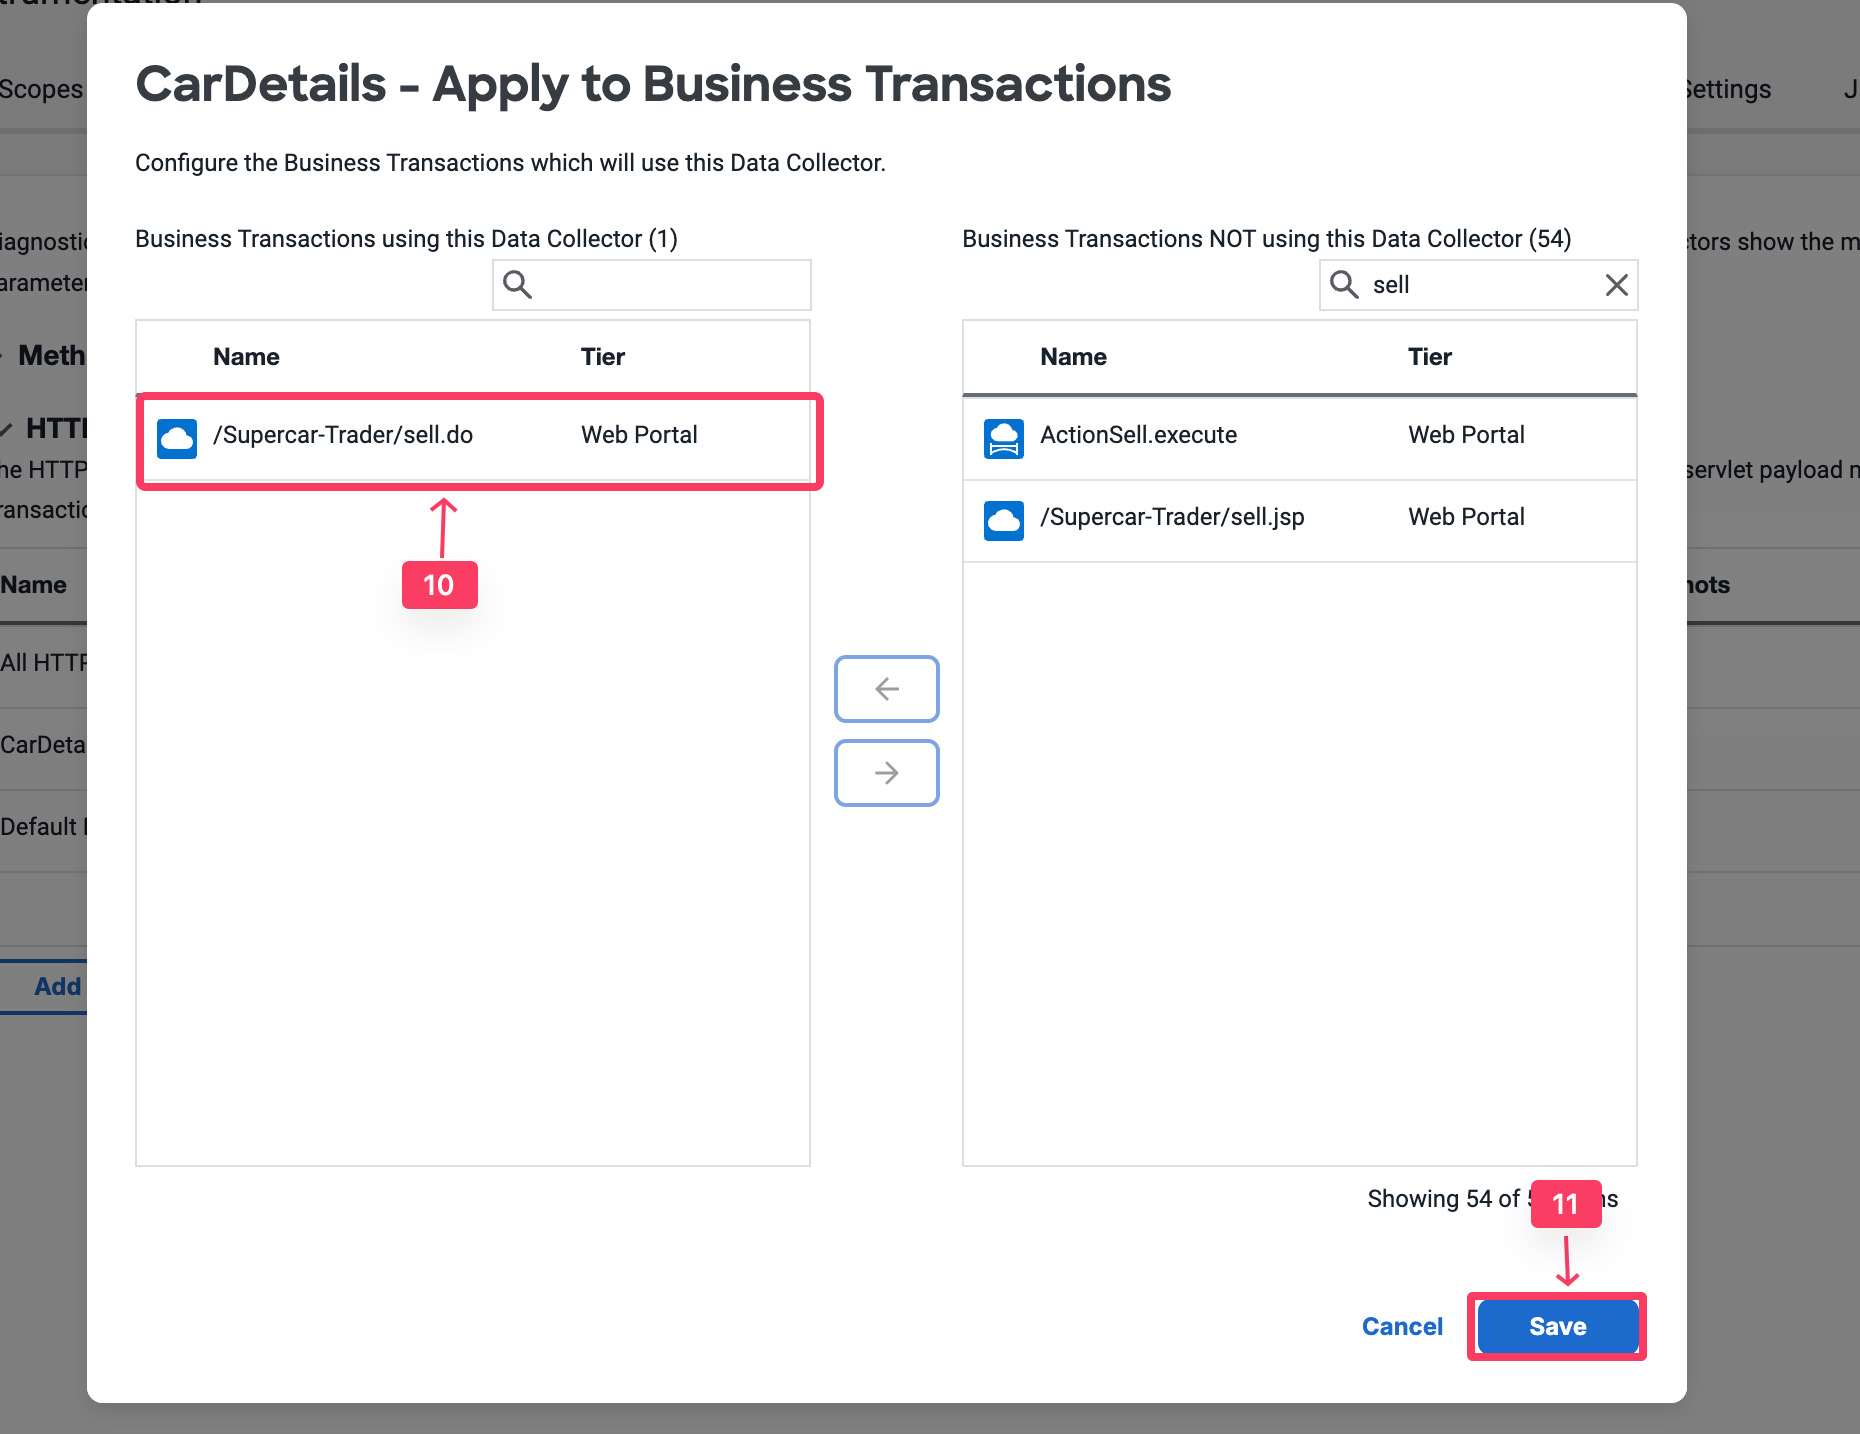
Enable /Supercar-Trader/sell.do Transaction
Click Save
Observe and Select Relevant HTTP Data Collectors
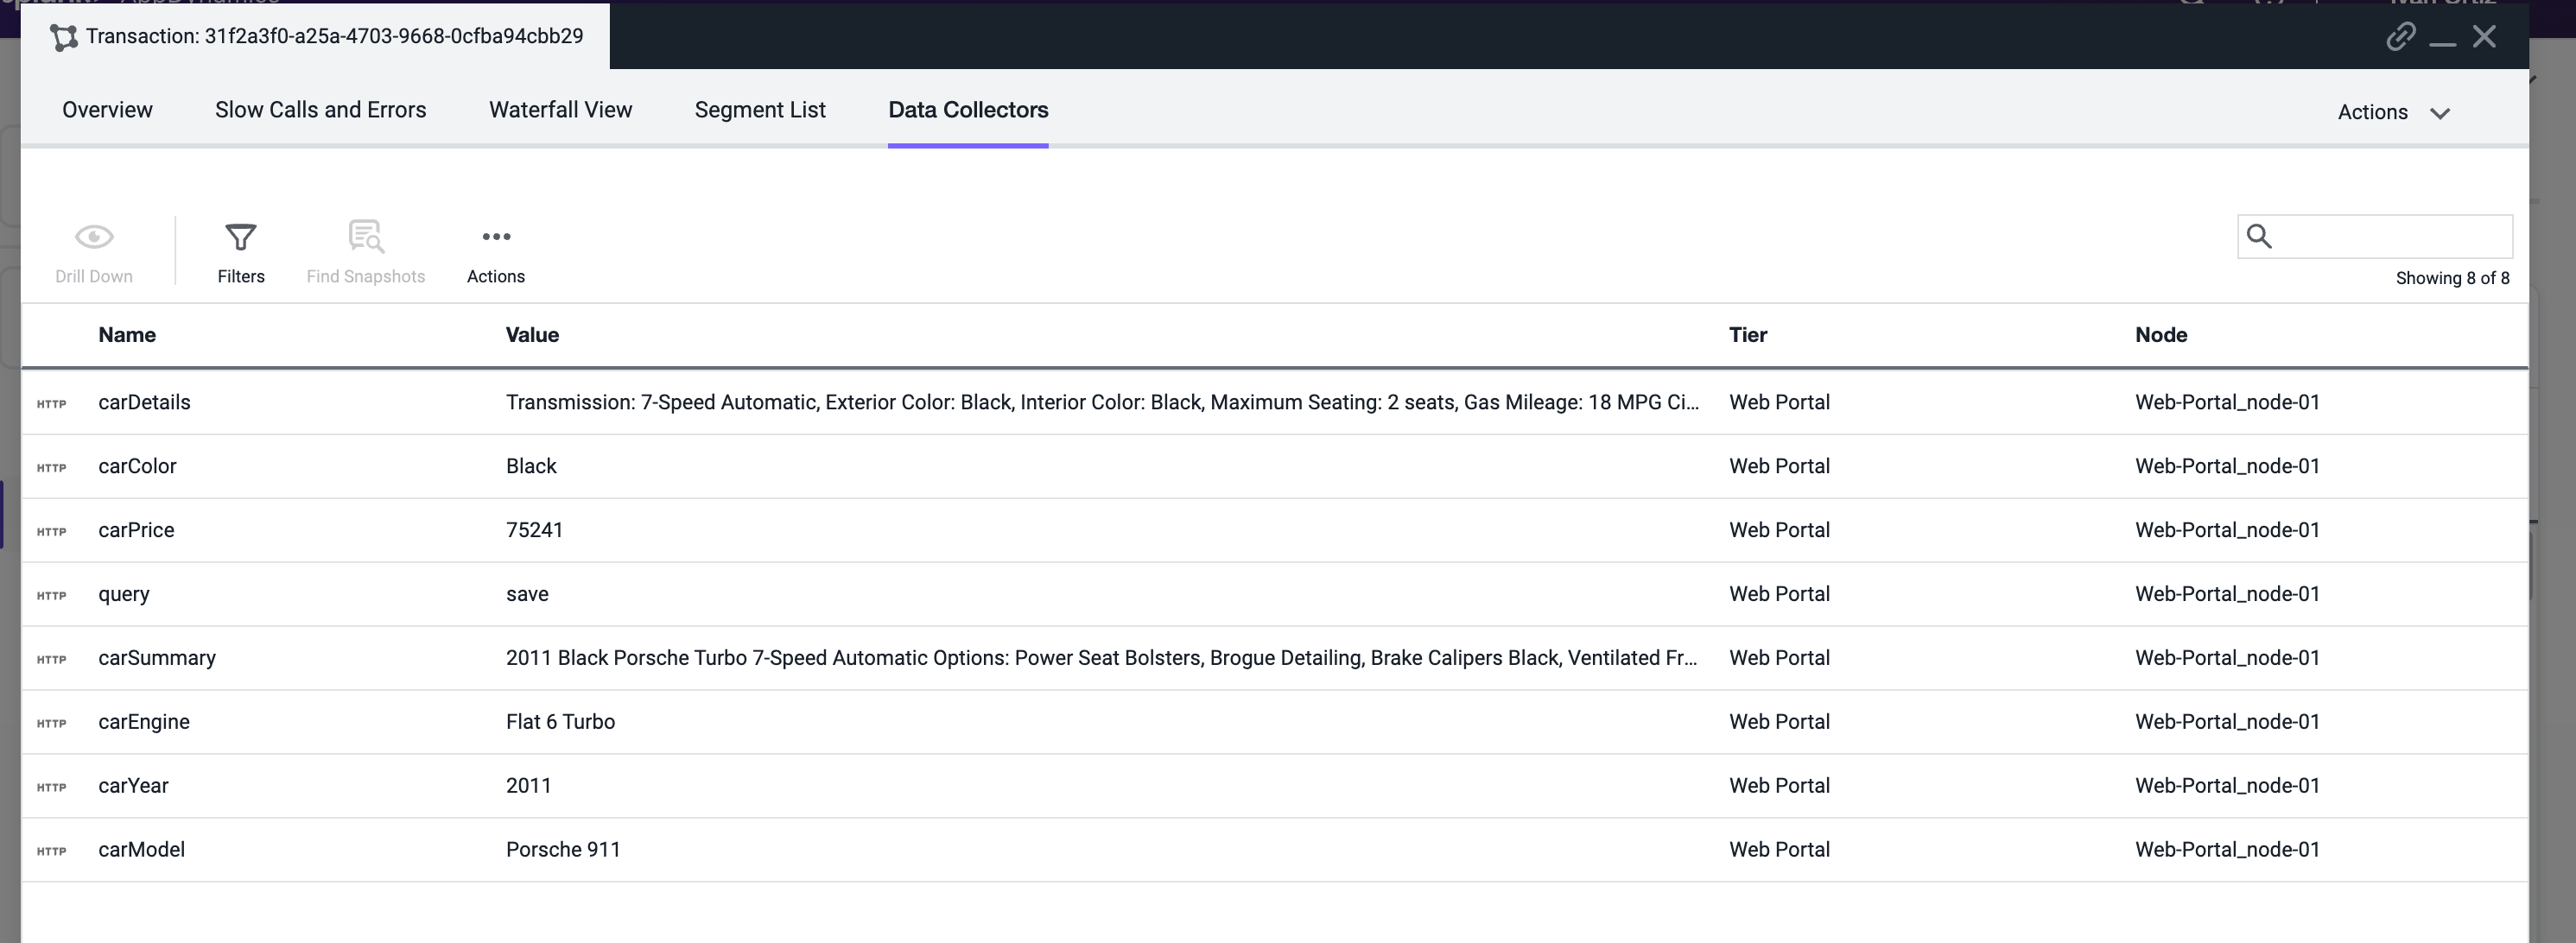
Apply load on the Application, specifically the SellCar transaction. Open one of its snapshots with Full Call Graph, and select the Data Collectors Tab.
You can now see all HTTP Parameters. You will see a number of key metrics, such as Car Price, Color, Year, and more.
Note the exact Parameter names to add them again in the HTTP Parameters list and enable them in Transaction Analytics.
Once they are added, delete the All HTTP Param HTTP data collector.
Capture Business Data in Analytics with HTTP Params
You will now configure the HTTP data collector again, but this time you will capture only the useful HTTP Parameters and enable them in Transaction Analytics. Add a new HTTP Data Collector: Application -> Configuration -> Instrumentation -> Data Collector tab -> Click Add Under the HTTP Request Data Collectors section
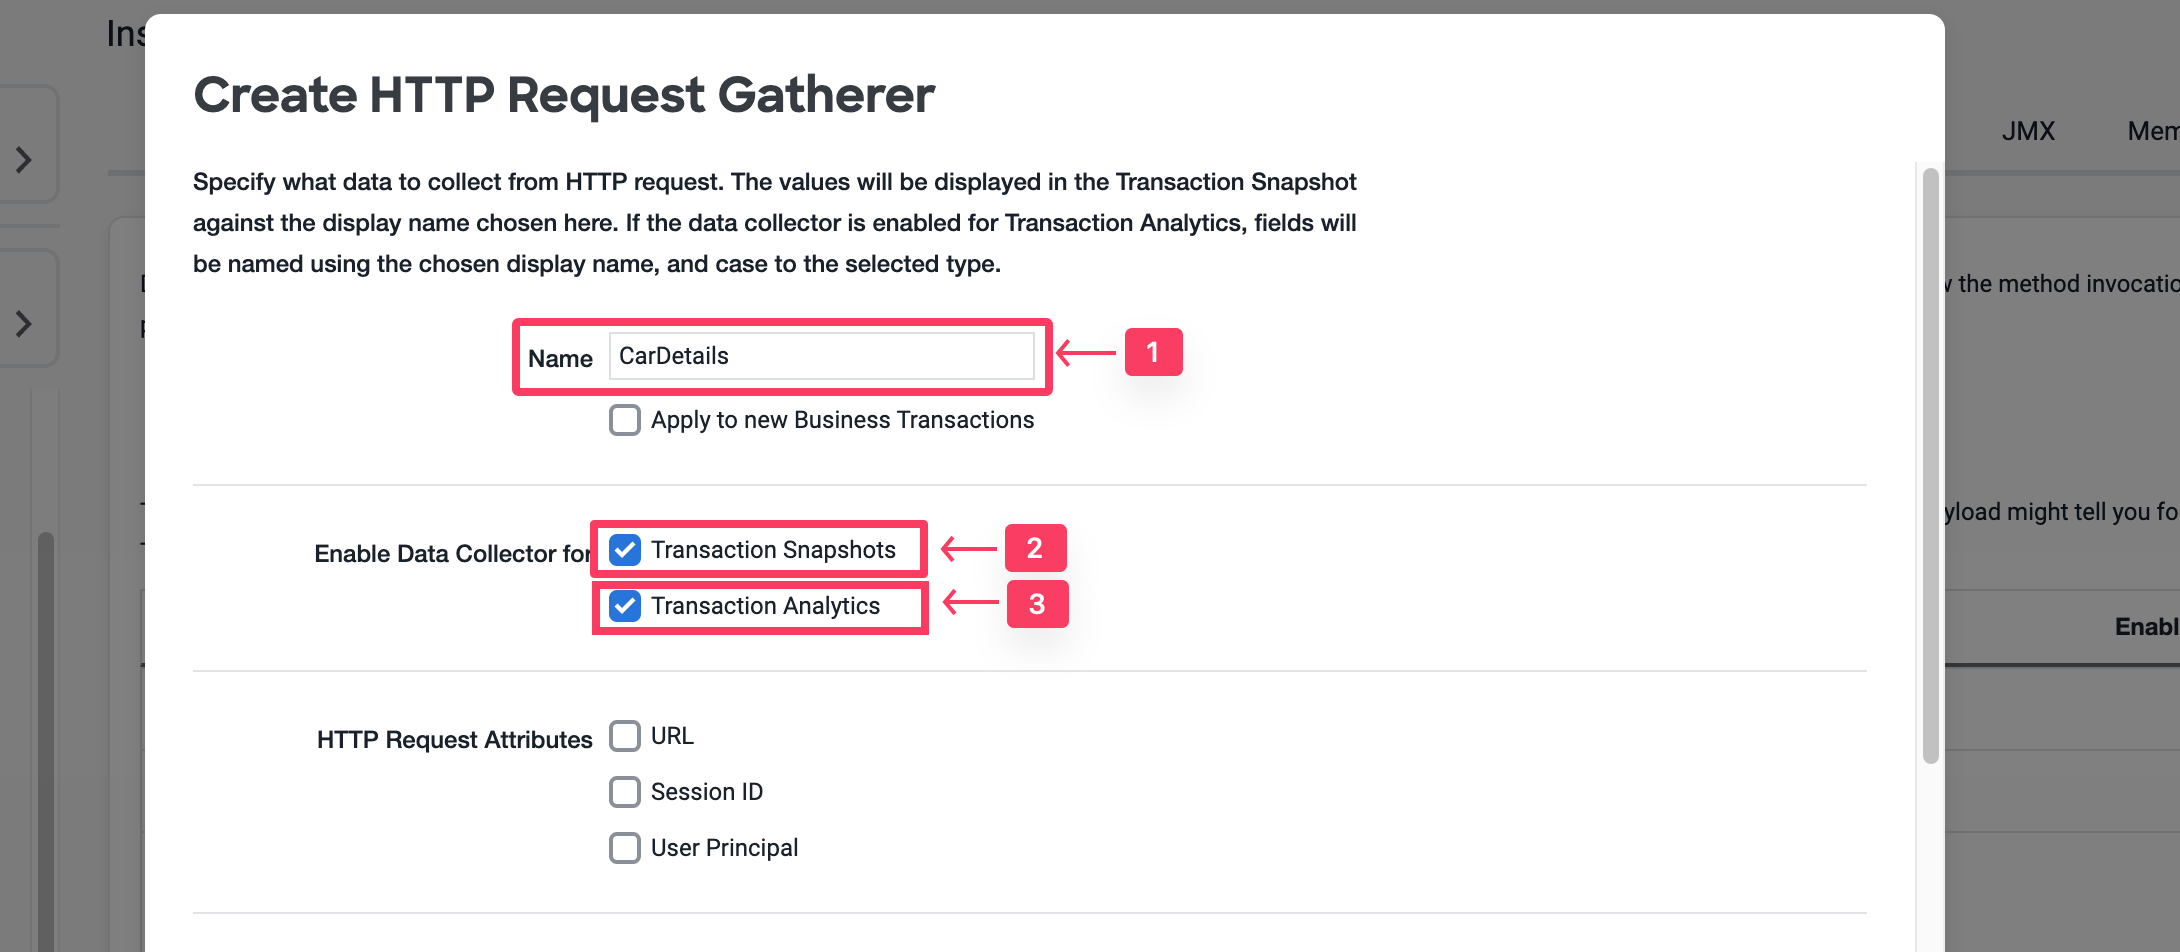
In the Name, specify CarDetails.
Enable Transaction Snapshots.
Enable Transaction Analytics.
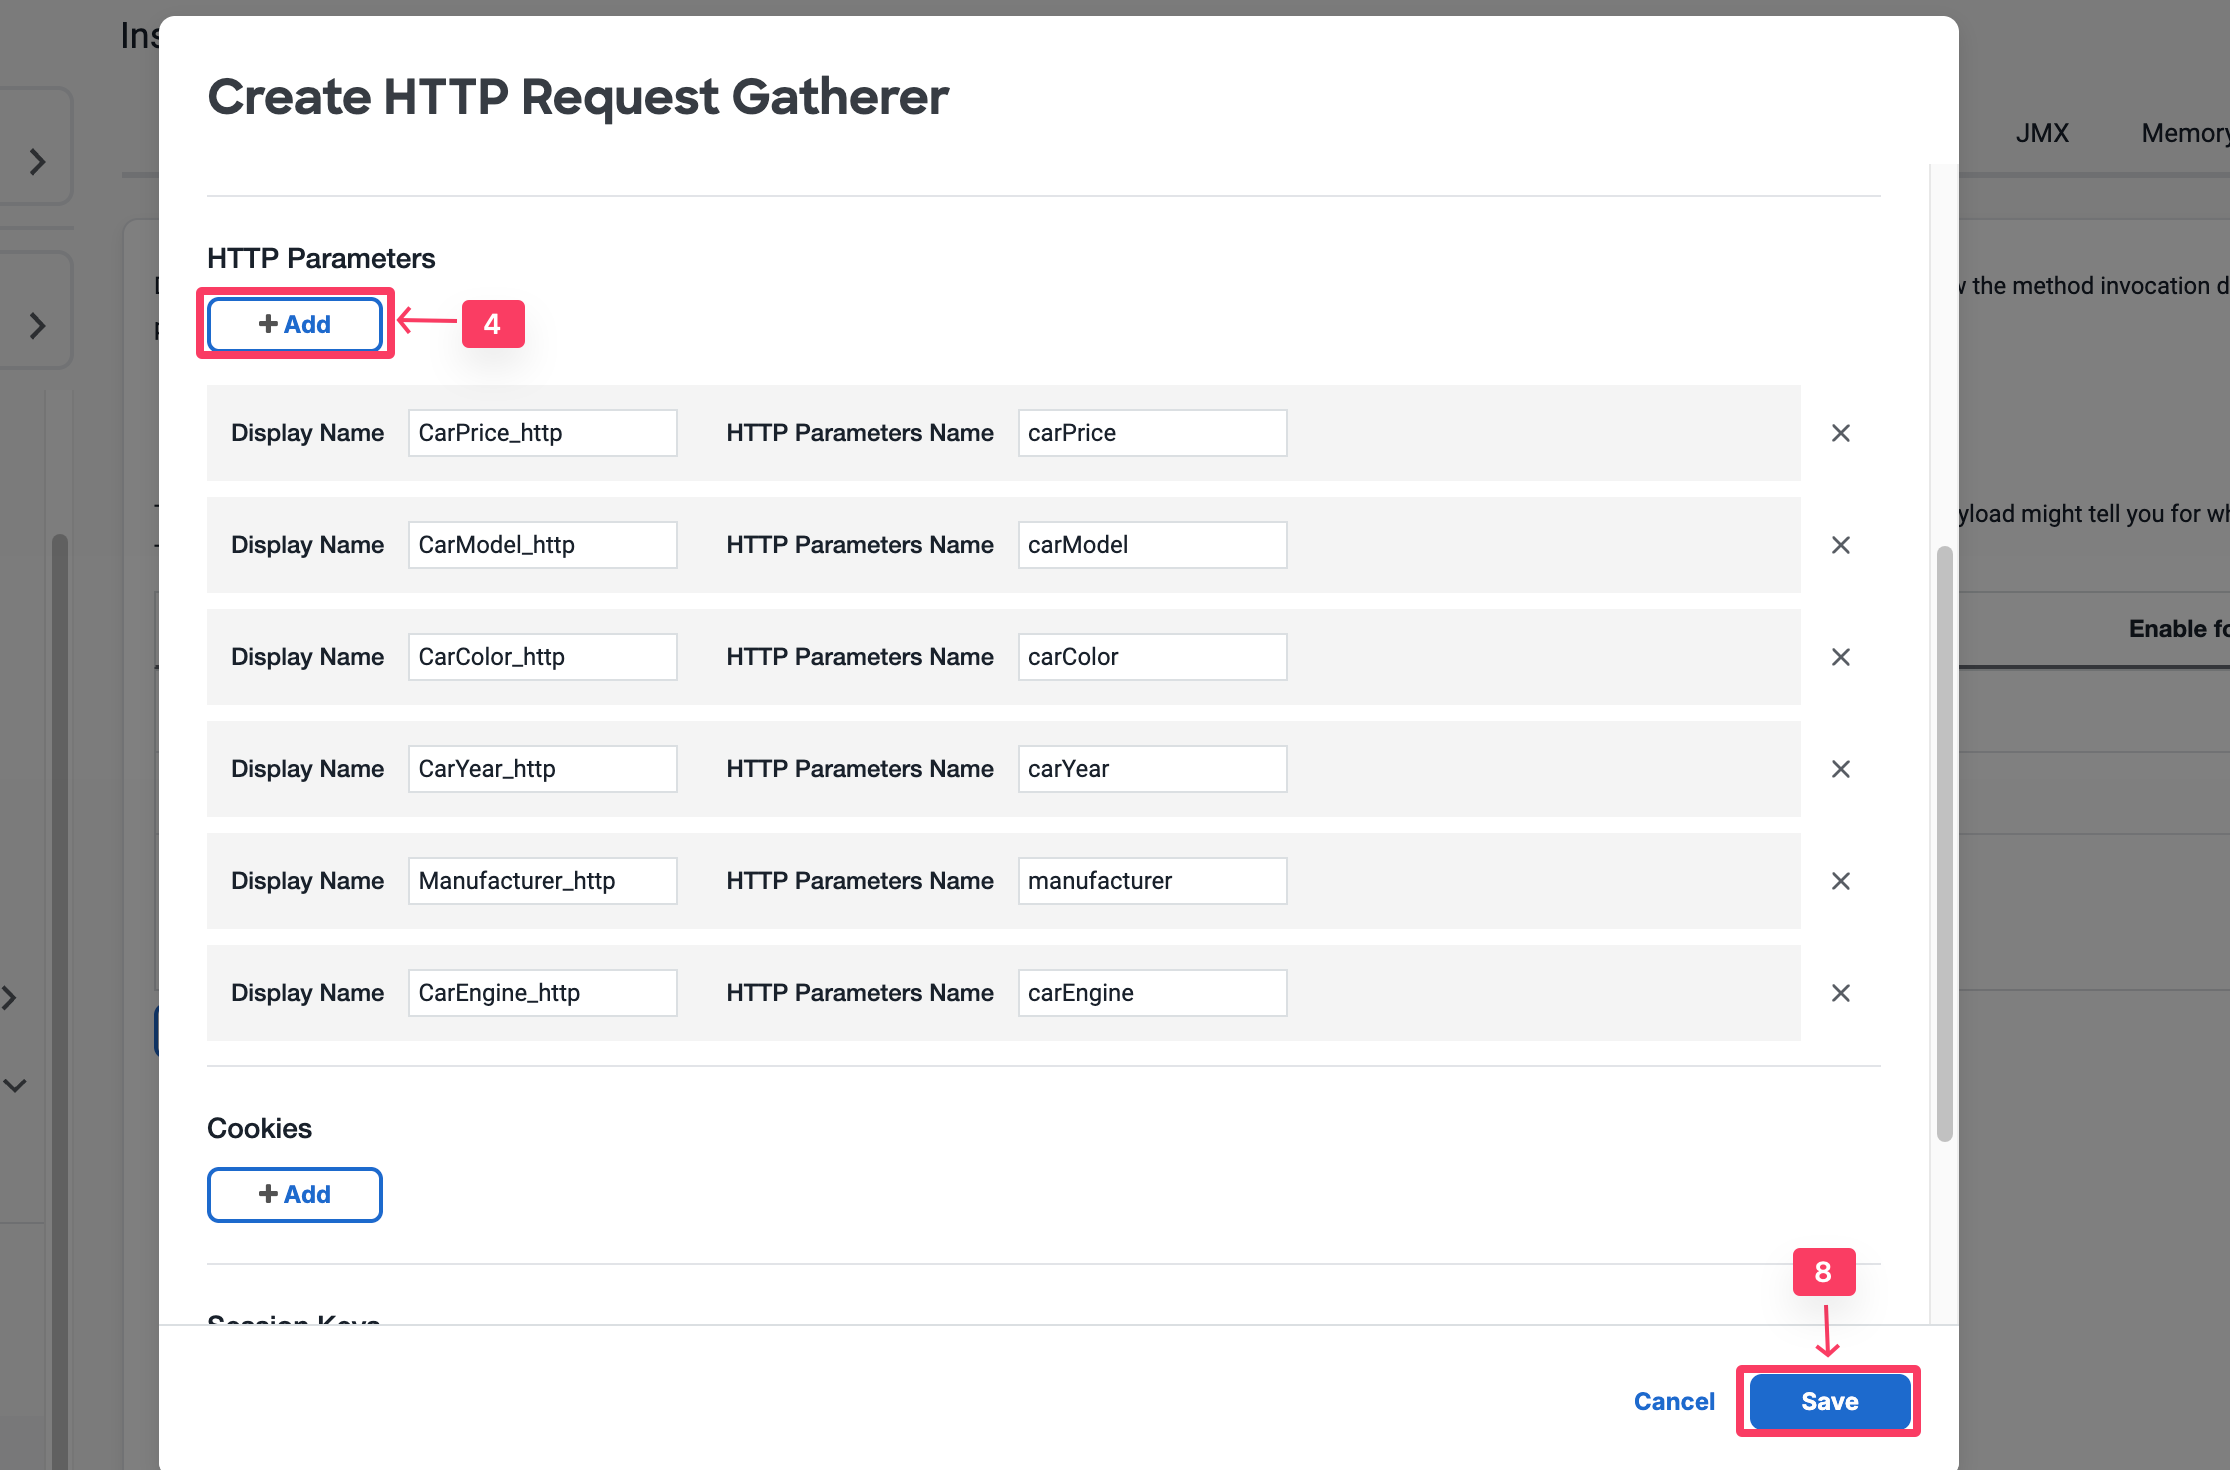
Click + Add in the HTTP Parameters section.
For the new Parameter, specify CarPrice_http as the Display Name
Then specify carPrice as the HTTP Parameter name.
Repeat for the rest of the Car Parameters as shown below.
Click Save
Click Ok to acknowledge the Data Collector implementation
Enable /Supercar-Trader/sell.do Transaction
Click Save
Delete the All HTTP Param Collector by Clicking on it, then click Delete button.
Validate Analytics on HTTP Parameters
You will now validate whether the business data was captured by HTTP data collectors in AppDynamics Analytics.
Select the Analytics tab at the top left of the screen.
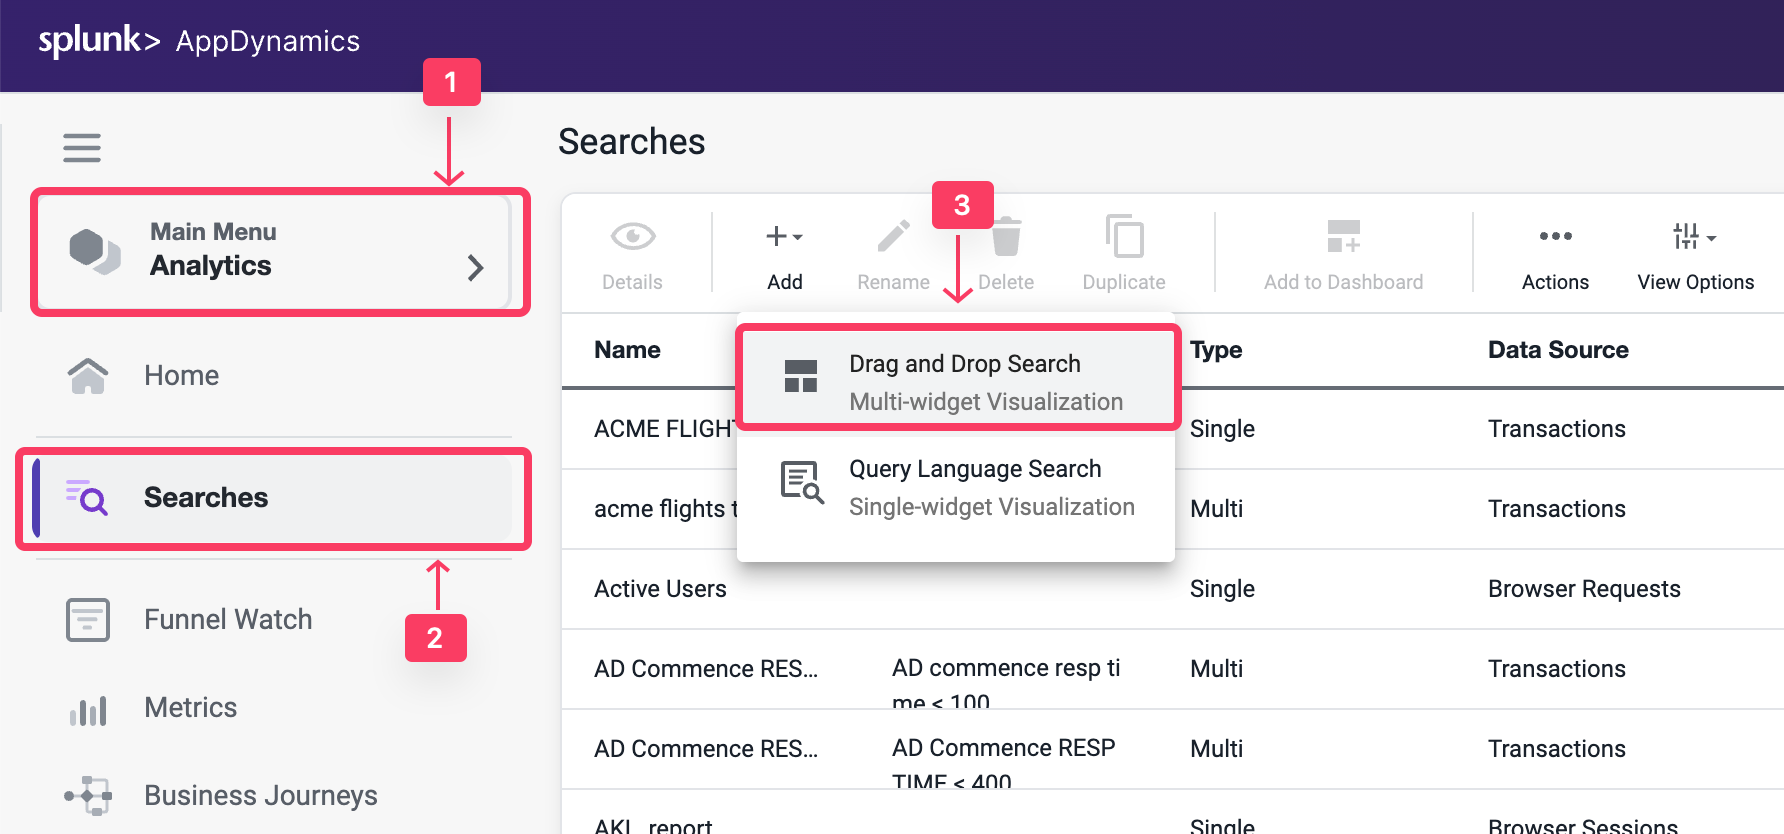
Select the Searches tab
Click the + Add button and create a new Drag and Drop Search.
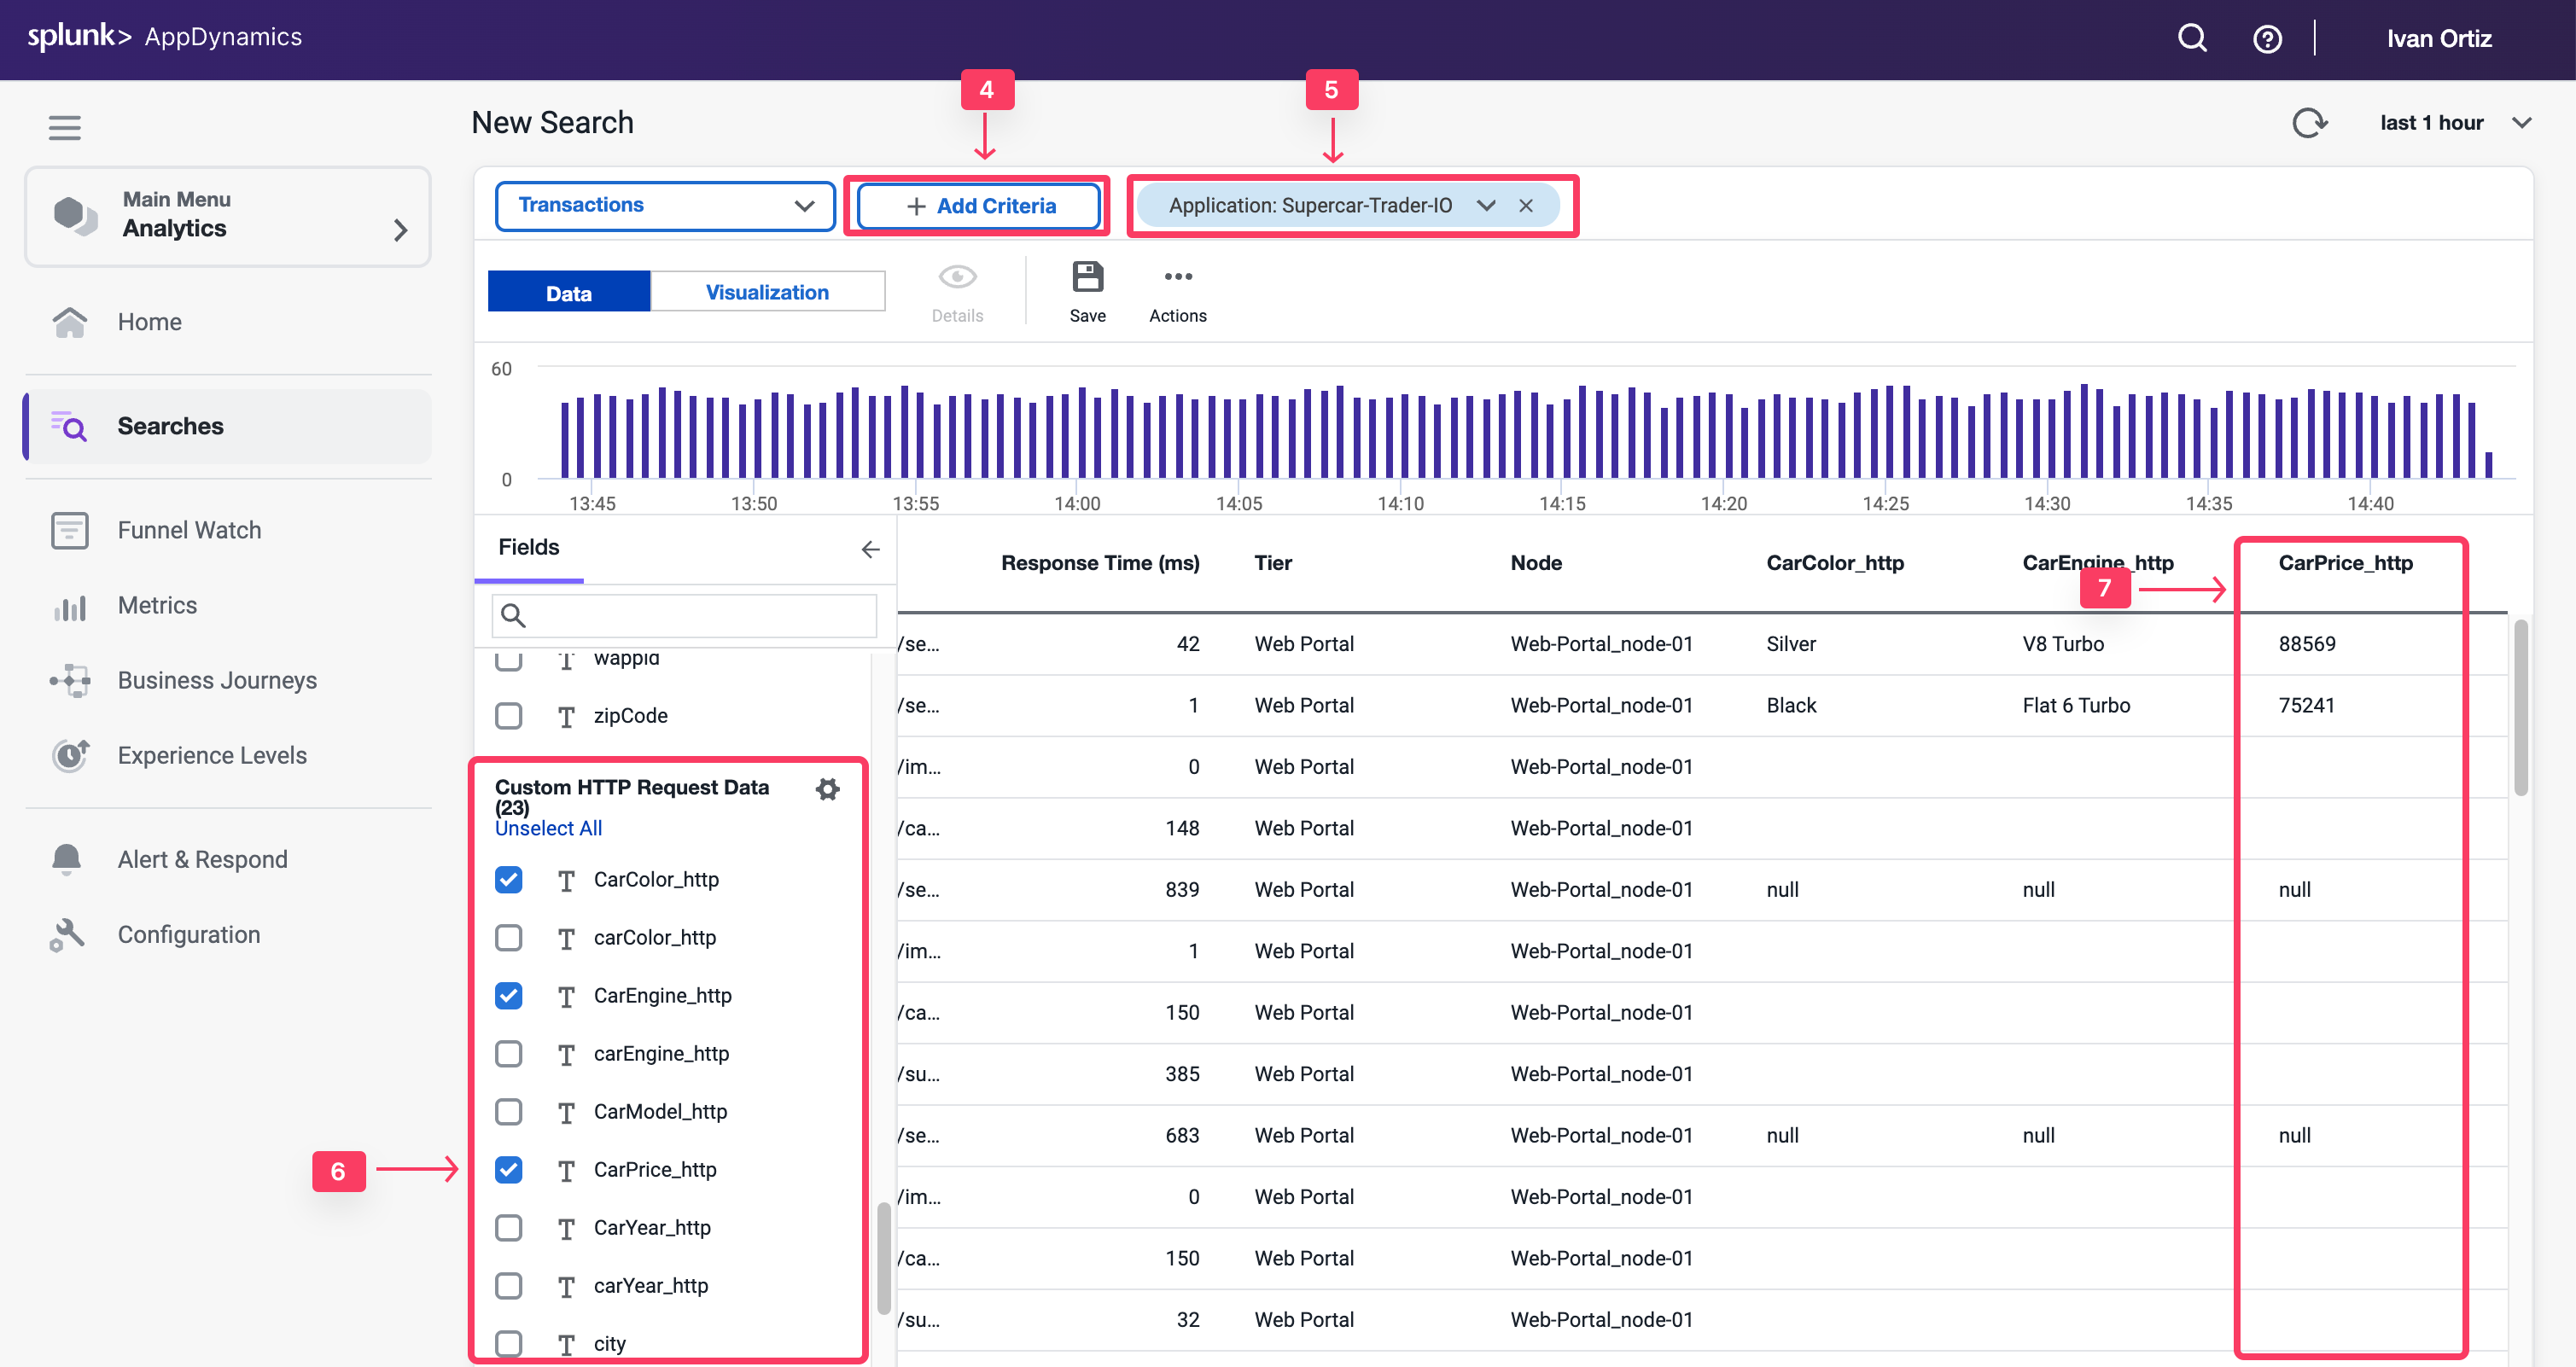
Click + Add Criteria
Select Application and Search For Your Application Name Supercar-Trader-YOURINITIALS
Under the Fields panel verify that the Business Parameters appear as a field in the Custom HTTP Request Data.
Check the box for CarPrice_http and Validate that the field has data.
Configure Method Data Collectors
2 minutes
Method invocation data collectors capture code data such as method arguments, variables, and return values. If HTTP data collectors don’t have sufficient business data, you can still capture these information from the code execution.
In this exercise you will perform the following tasks:
Discover methods.
Open a discovery session.
Discover method parameters.
Drill down to an object within the code.
Create a method invocation data collector.
Validate analytics on method invocation data collectors.
Open a Discovery Session
You may not have an application developer available to identify the method or parameters from the source code. However, there is an approach to discover the application methods and objects directly from AppDynamics.
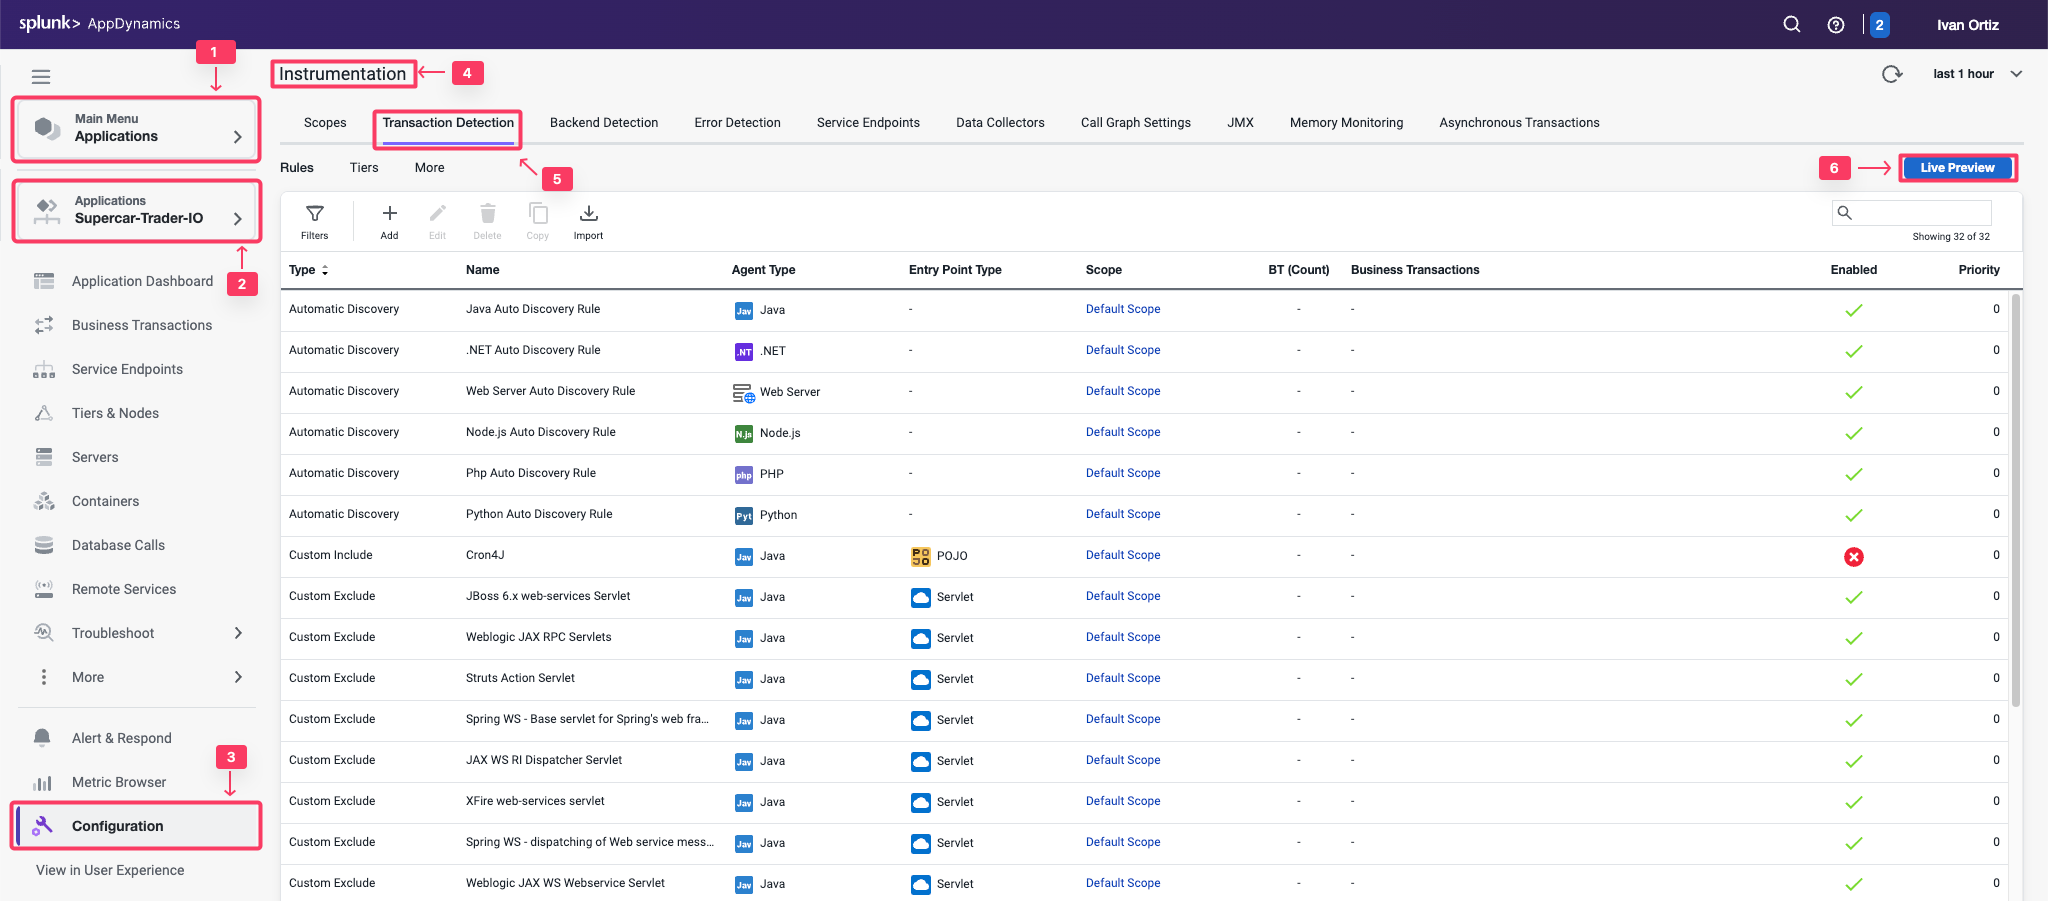
Select the Applications tab at the top left of the screen.
Select Supercar-Trader-YOURINITIALS application
Select the Configuration tab.
Click on the Instrumentation link.
Select the Transaction Detection tab.
Click on the Live Preview Button on the tight.
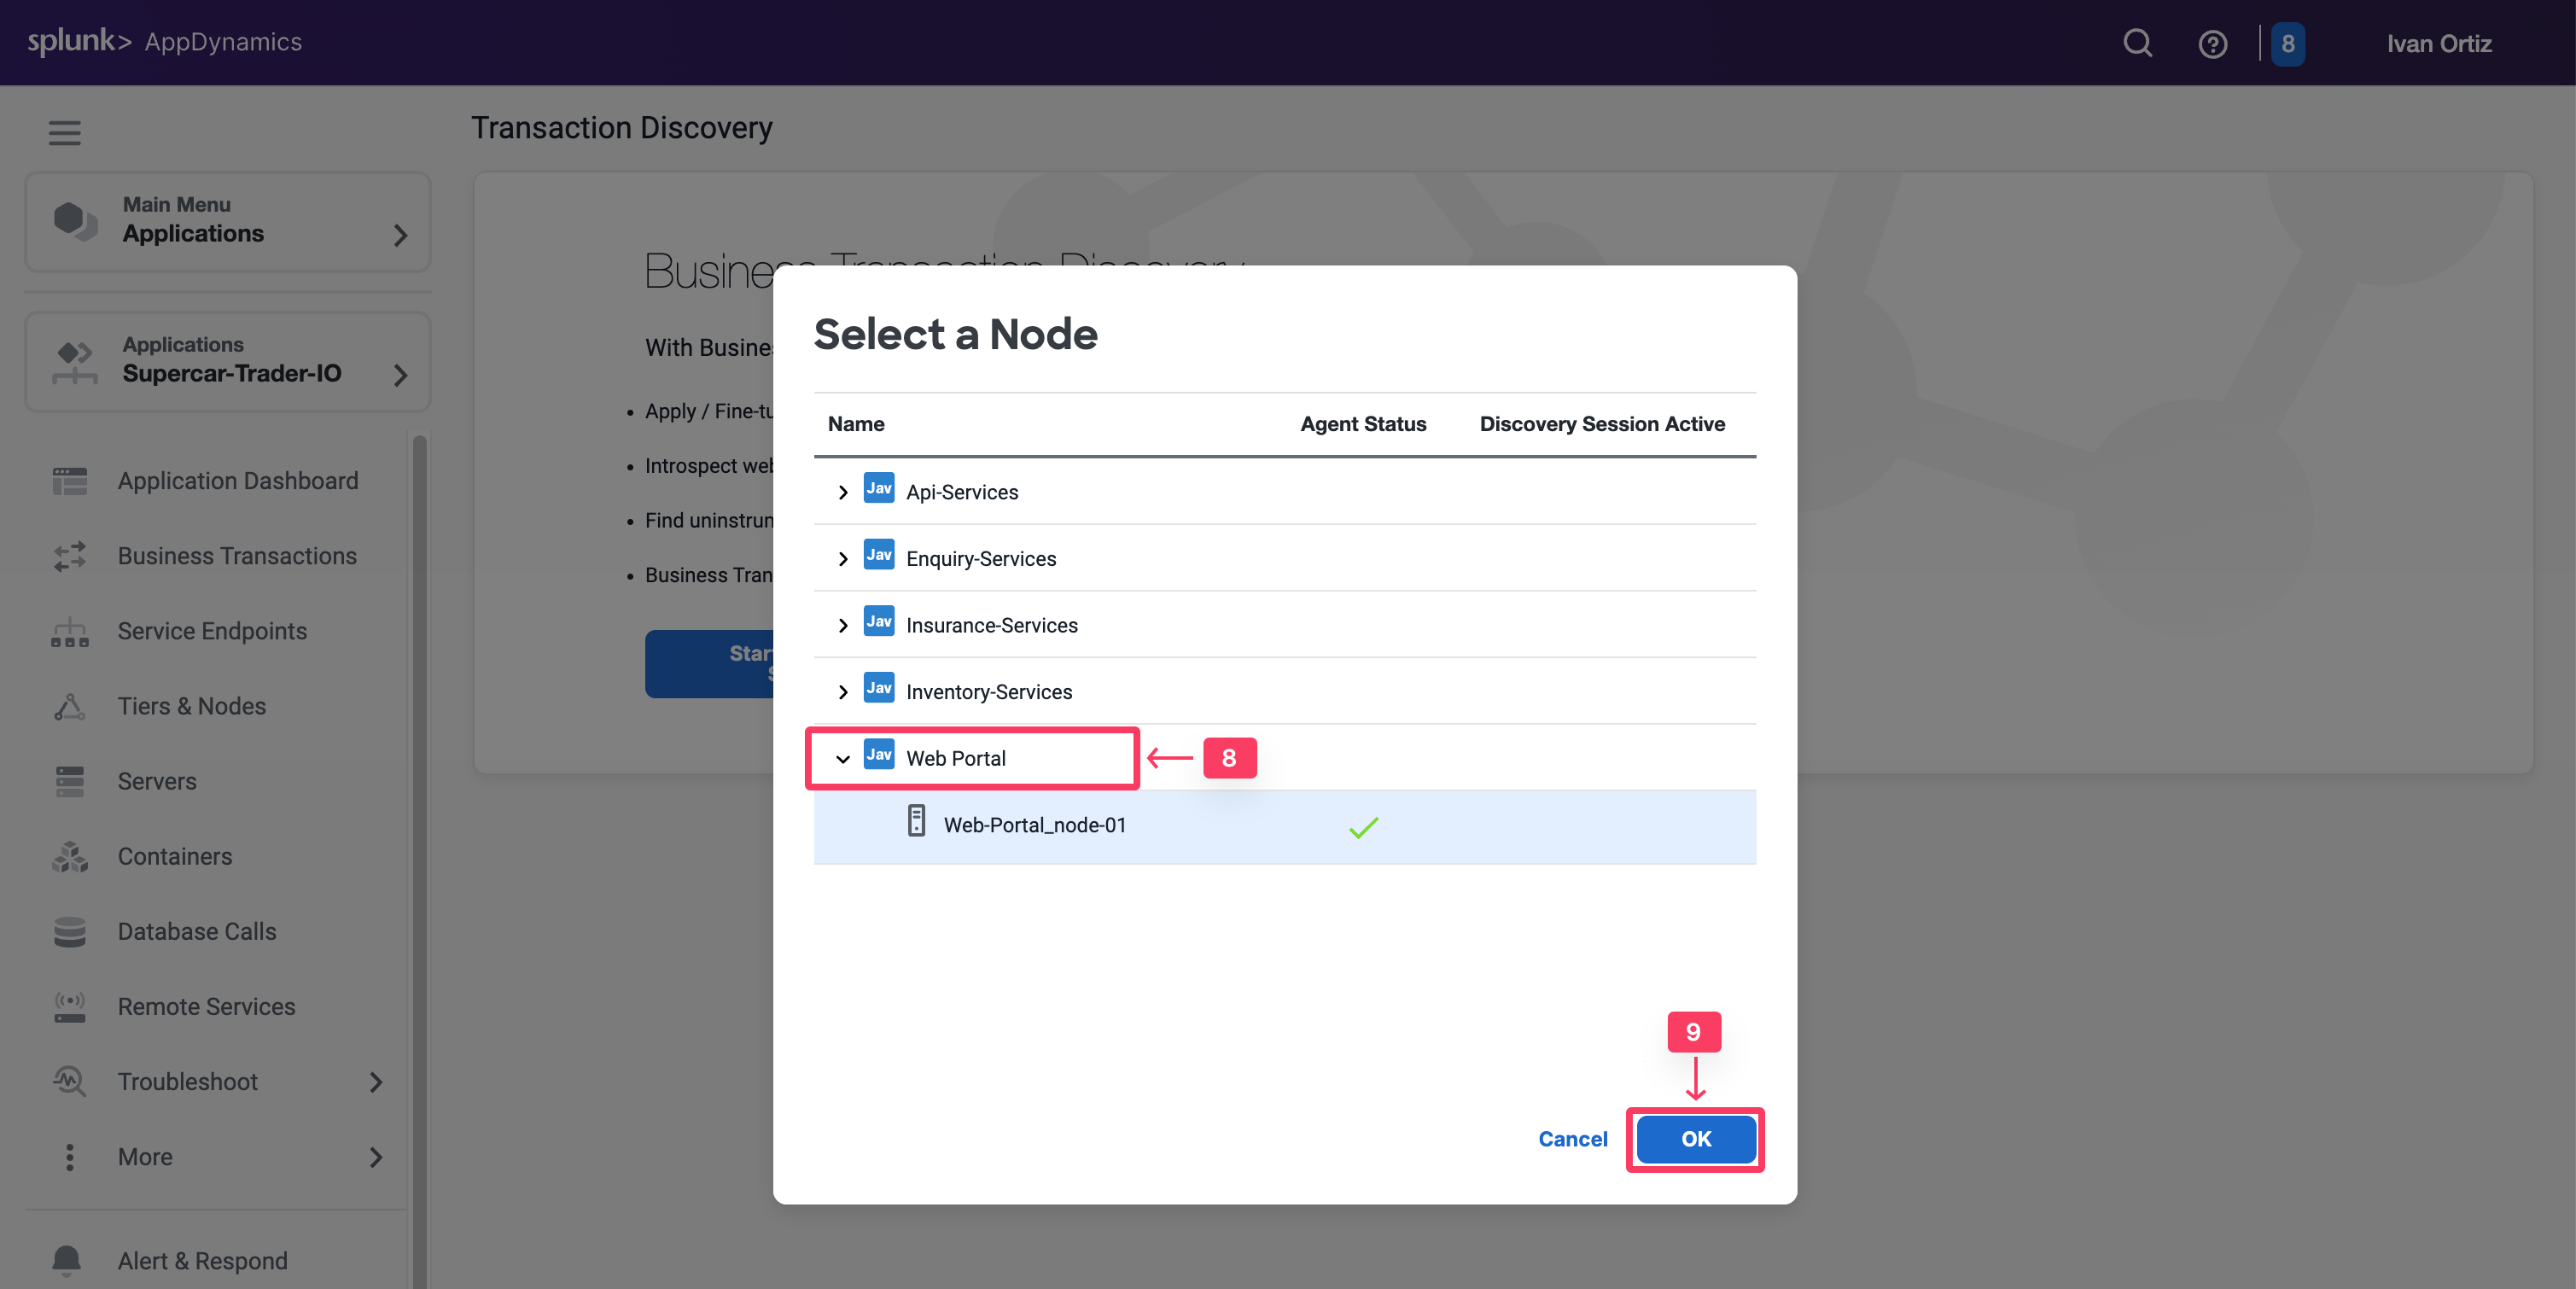
Click on Start Discovery Session button
Select the Web-Portal Node in the pop-up windows. It should be the same node that the method you are investigating runs on
Click Ok
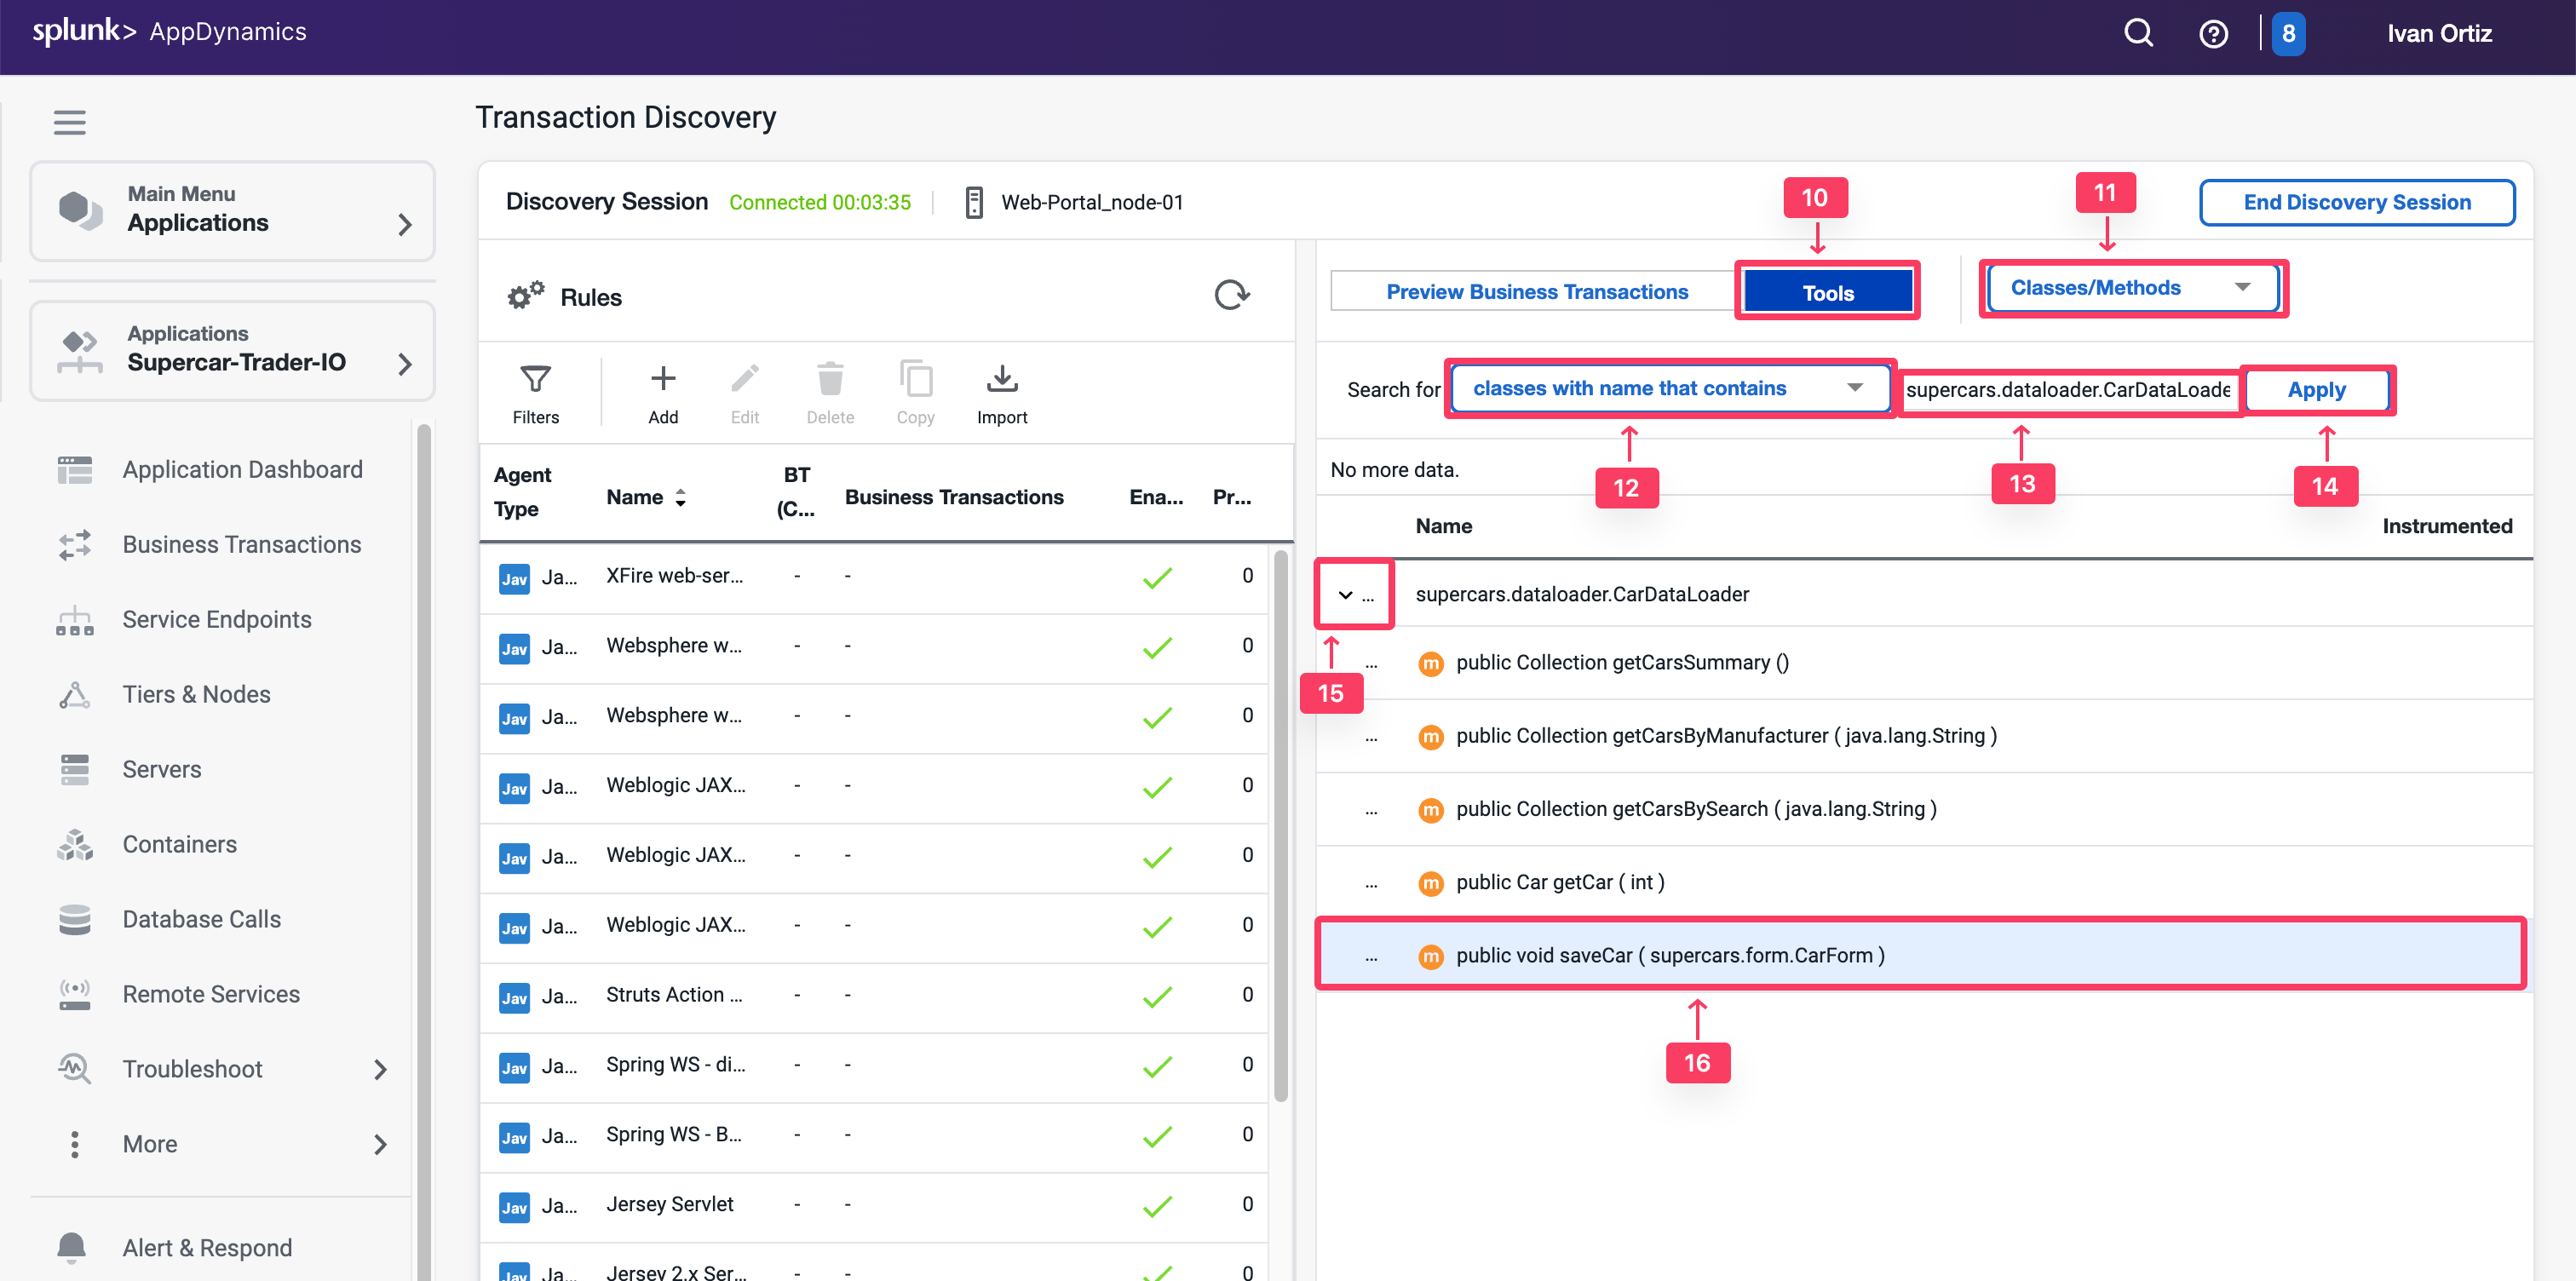
Select Tools on the right toggle.
Select Classes/Methods in the drop-down list.
Select Classes with name in the Search section.
Type in the class name supercars.dataloader.CarDataLoader in the text box. To find the class name you can search through call graphs, or ideally find it in the source code.
Click Apply to search for the matching class methods.
Once the results appear, expand the class that matches your search.
Look for the same method saveCar.
Note that the saveCar method takes a CarForm object as an input parameter.
Drill Down to the Object
Now you have found the method, explore its parameters to find out where you can pull the car details properties.
You saw that saveCar method takes the complex object CarForm as an input parameter. This object will hold the form data that was entered on the application webpage. Next, you need to inspect that object and find out how you can pull the car details from it.
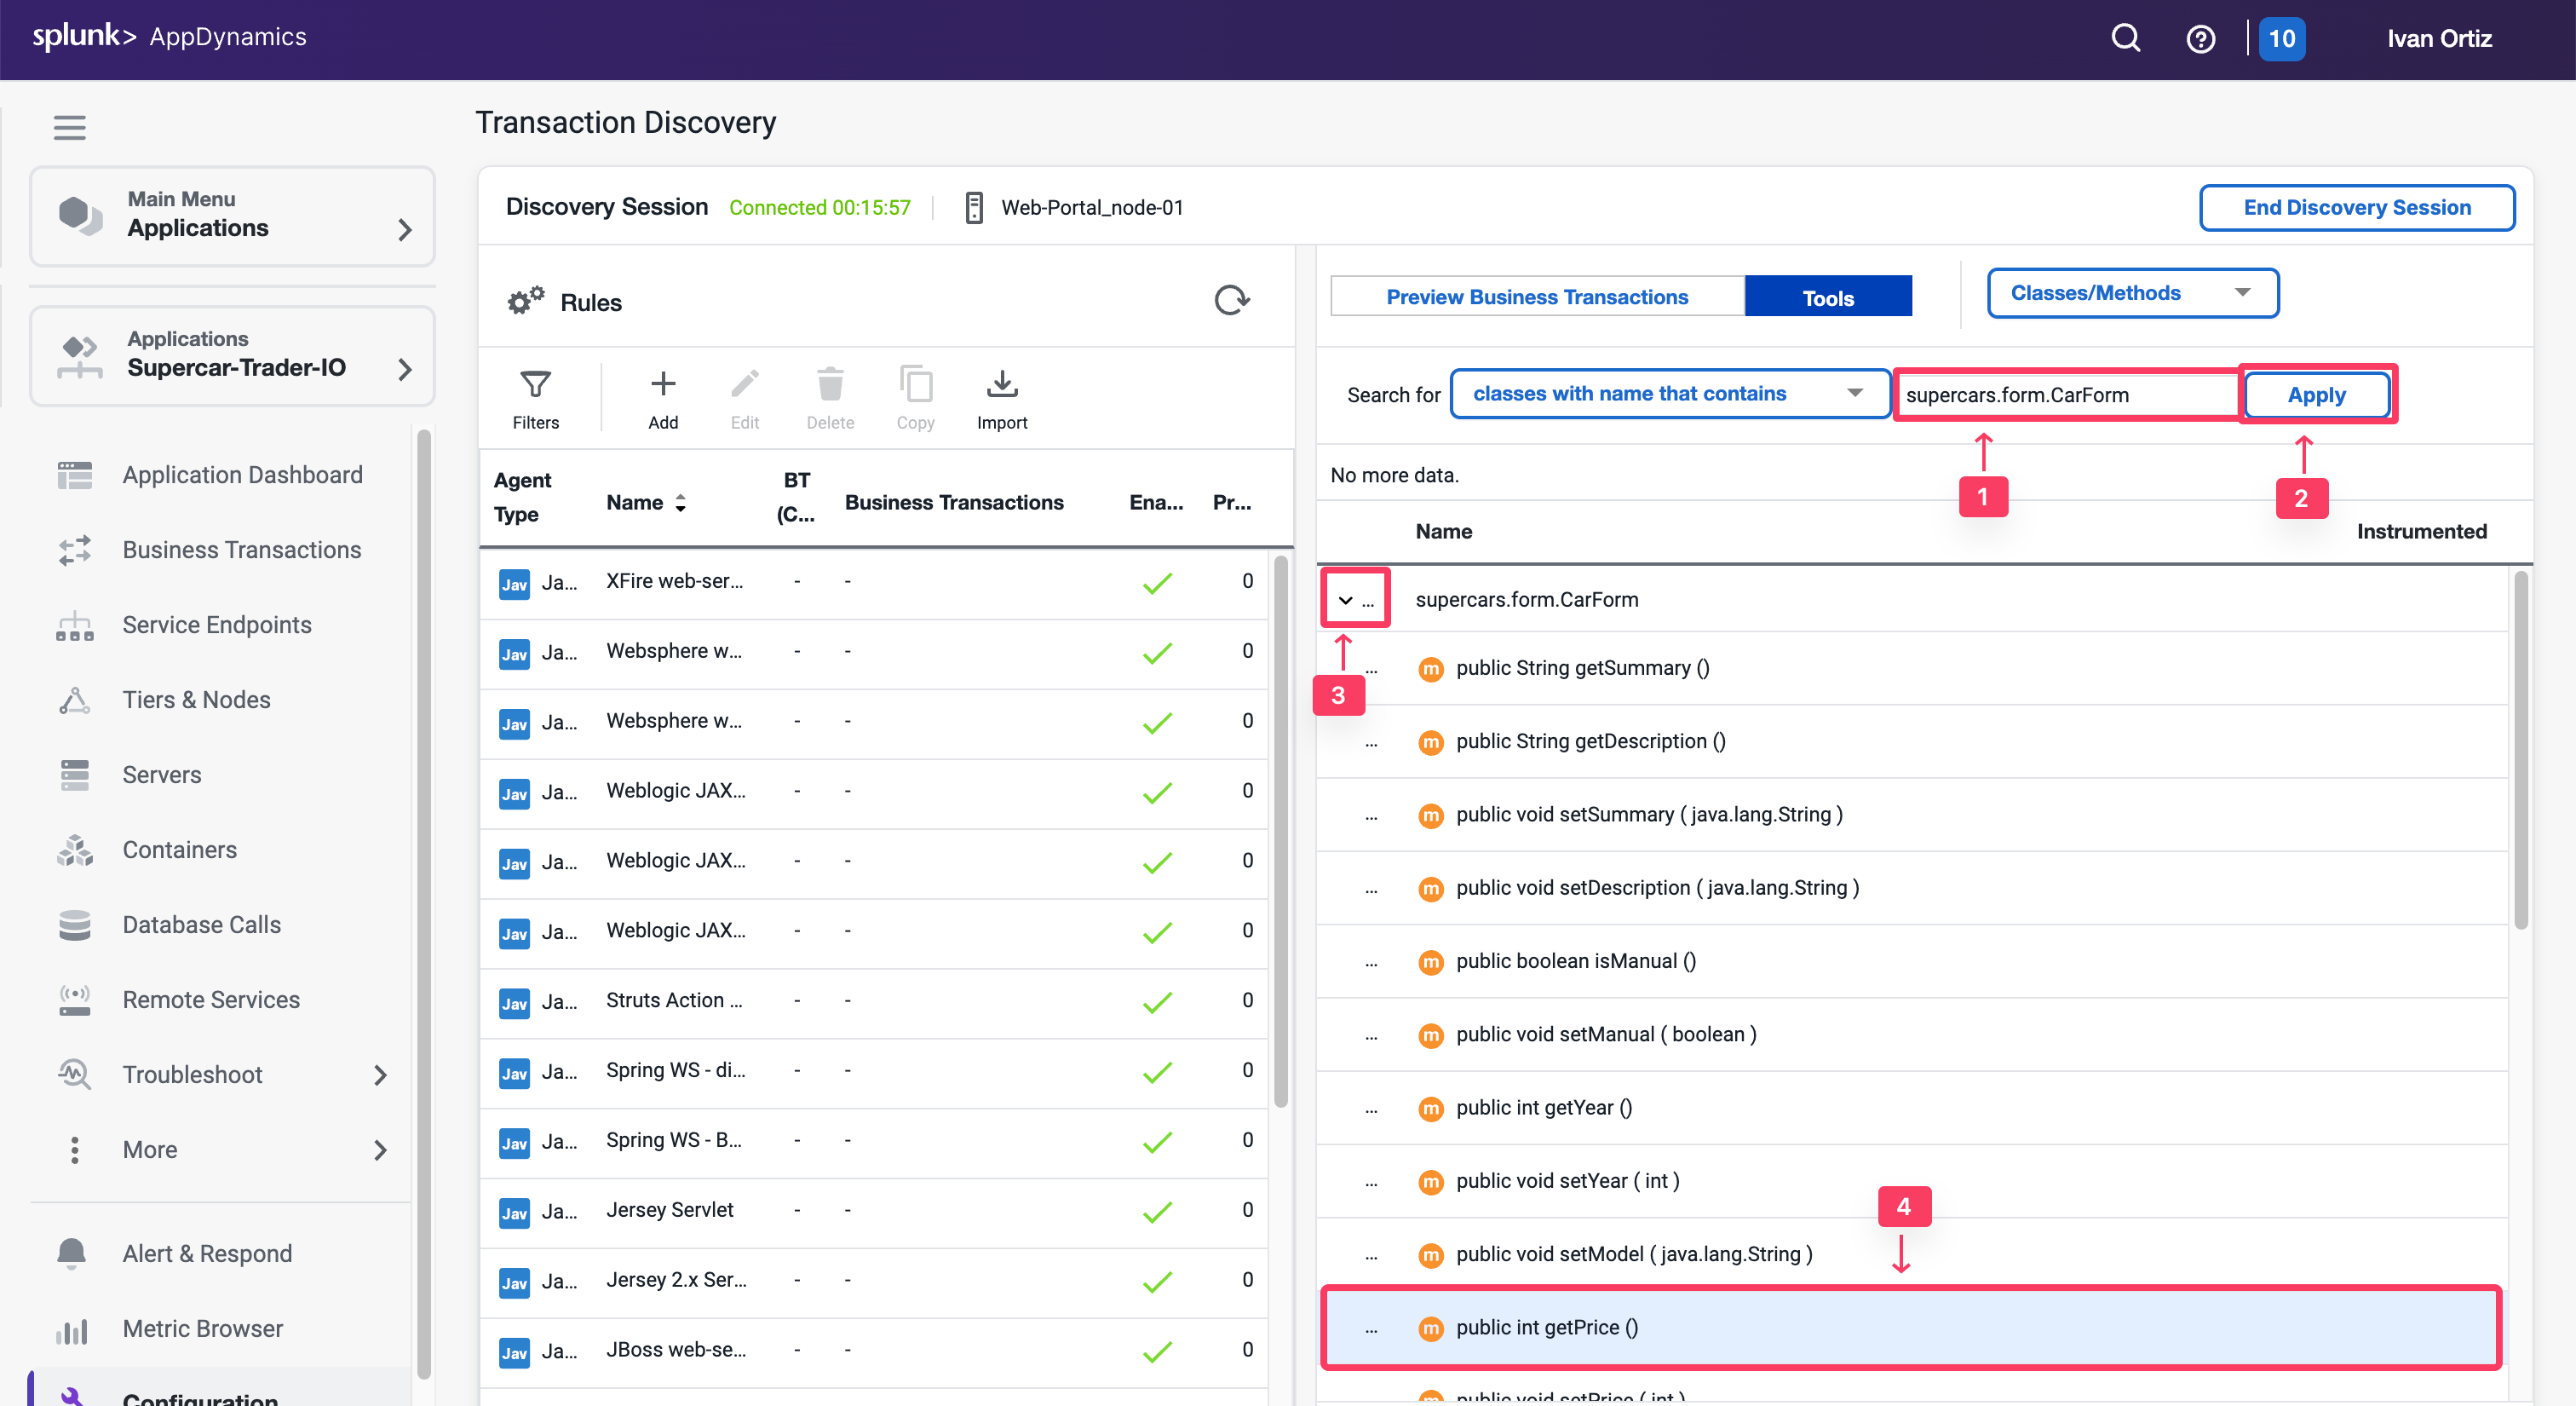
Type in the class name of the input object supercars.form.CarForm in the text box
Click Apply to search for the class methods.
When the results appear, expand the supercars.form.CarForm class that matches the search.
Look for the methods that will return the car details that you want. You will find get methods for price, model, color, and more.
Create Method Invocation Data Collector
With the findings from the previous exercises, you can now configure a method invocation data collector to pull the car details directly from the running code in runtime.
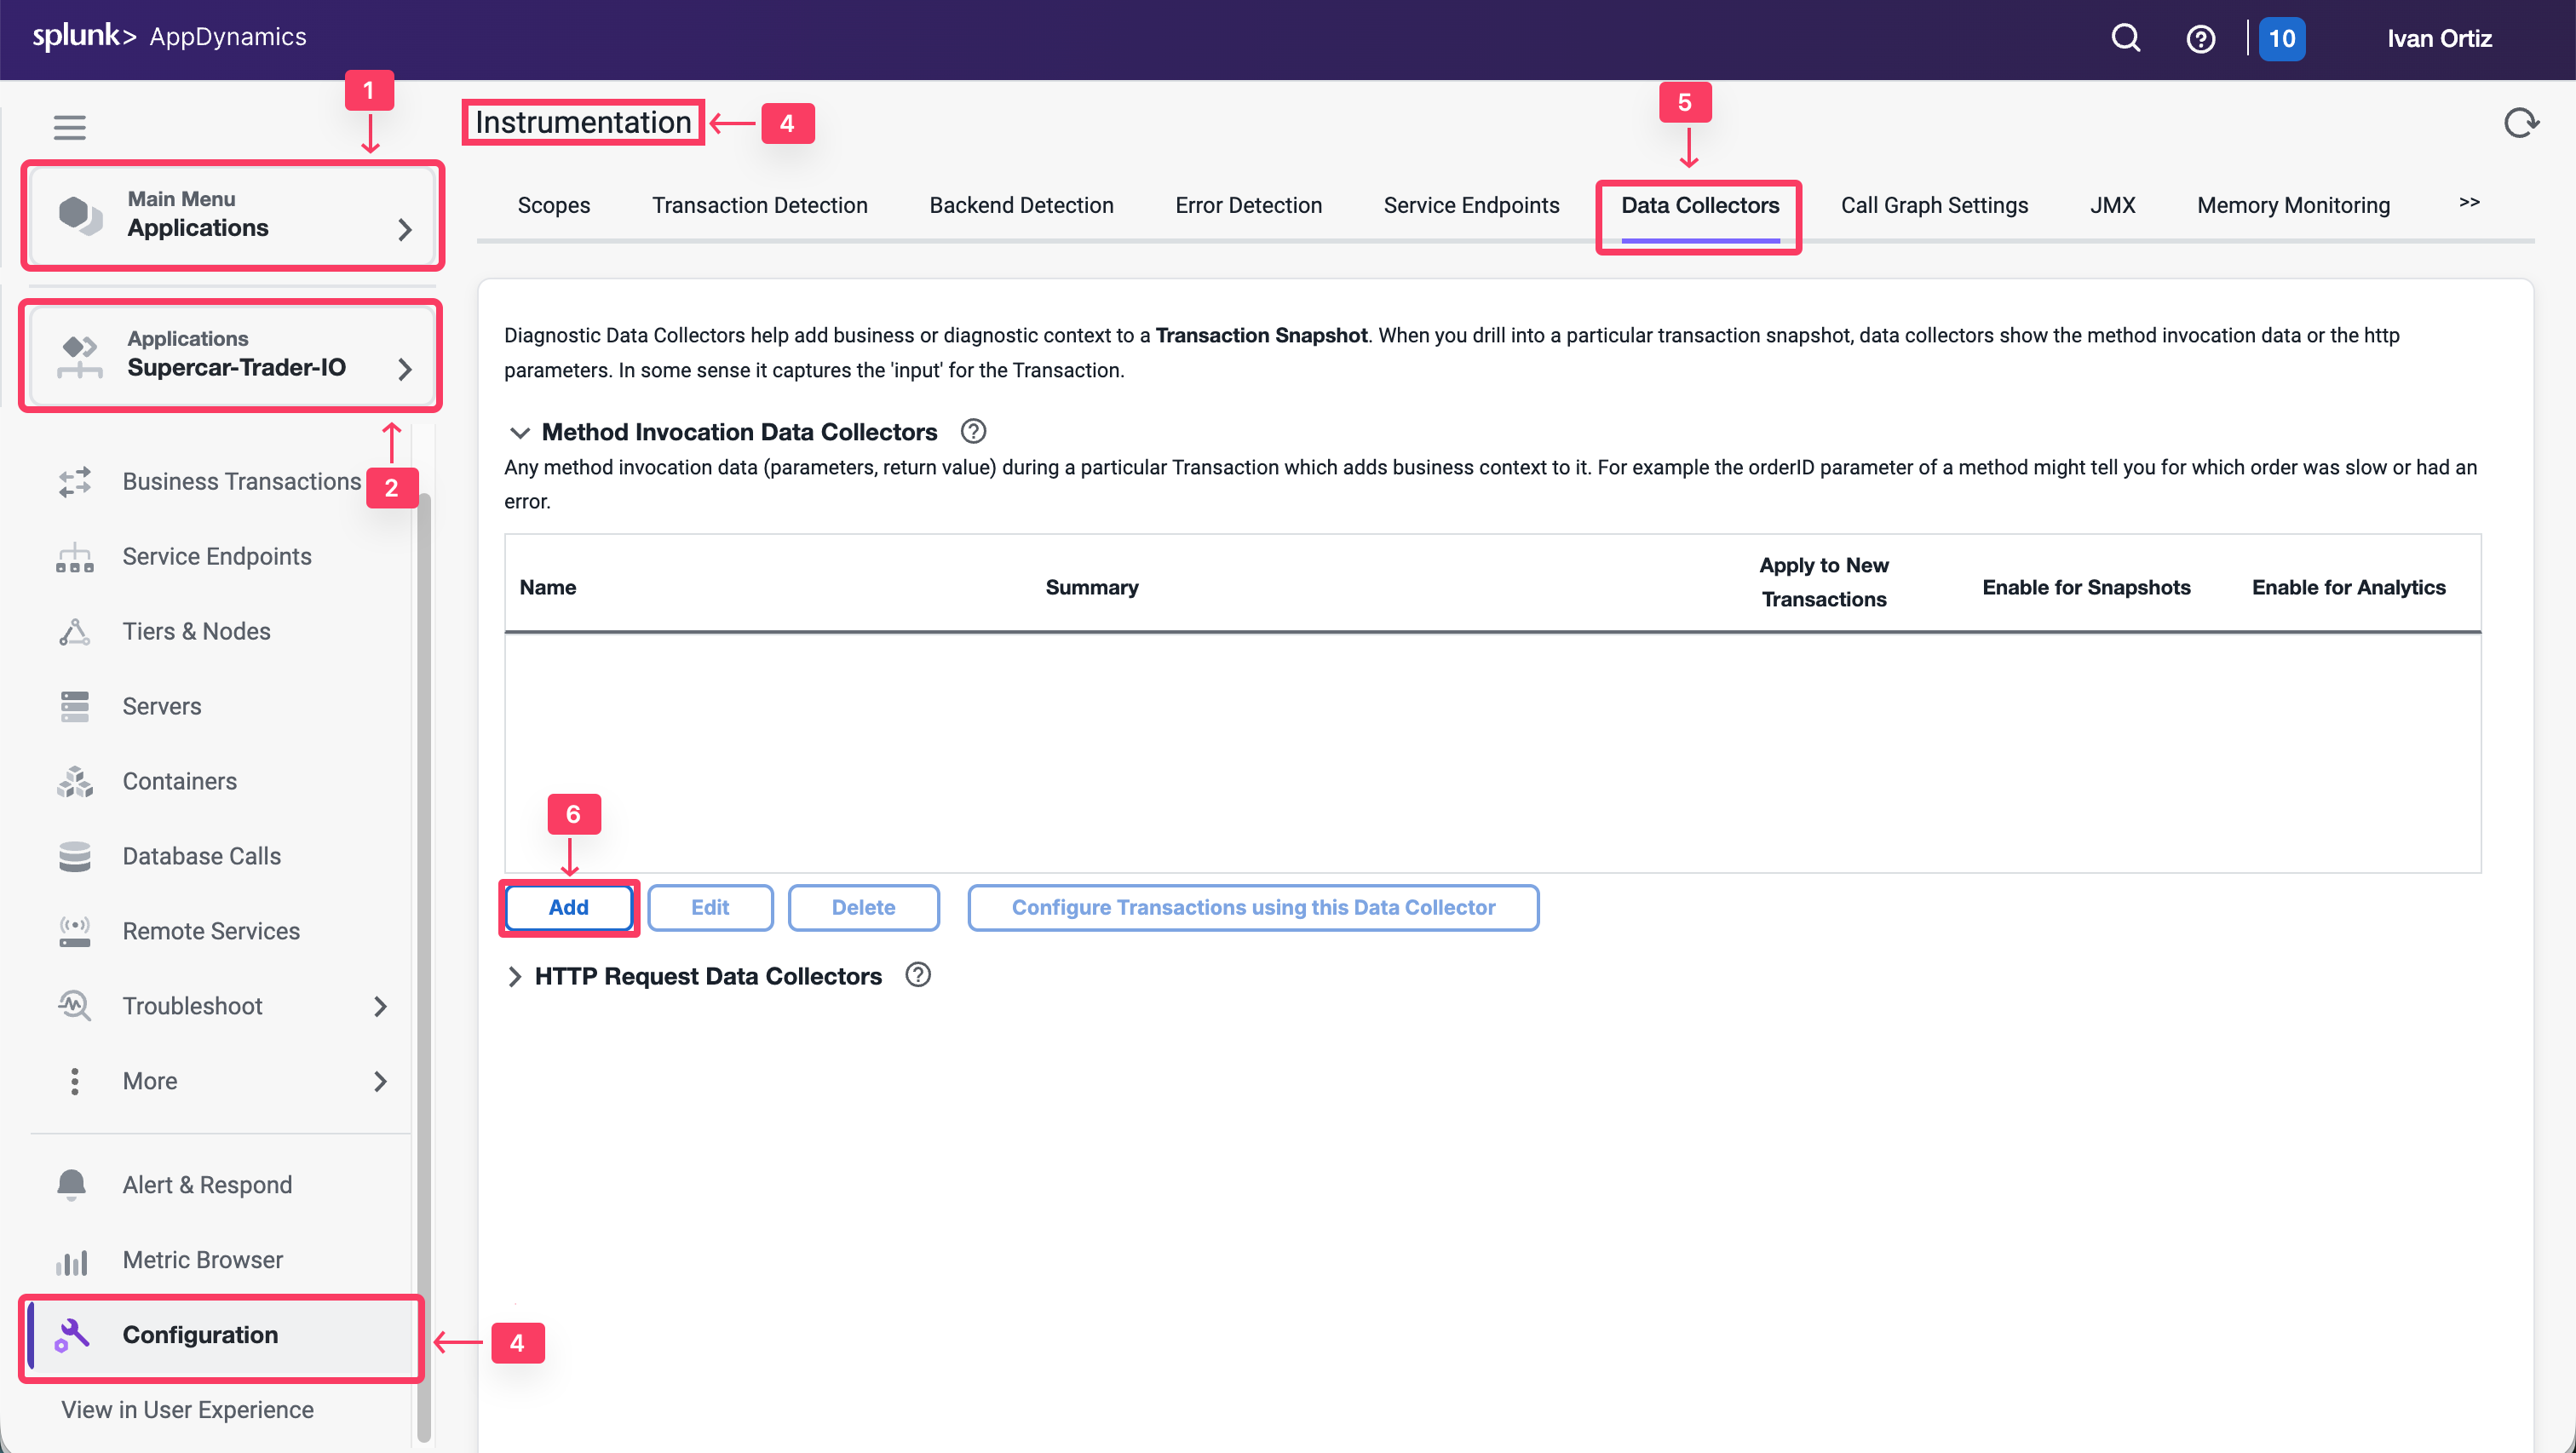
Select the Applications tab.
Select Supercar-Trader-YOURINITIALS Application
Select the Configuration tab.
Click on the Instrumentation link.
Select the Data Collectors tab.
Click Add in the Method Invocation Data Collectors.
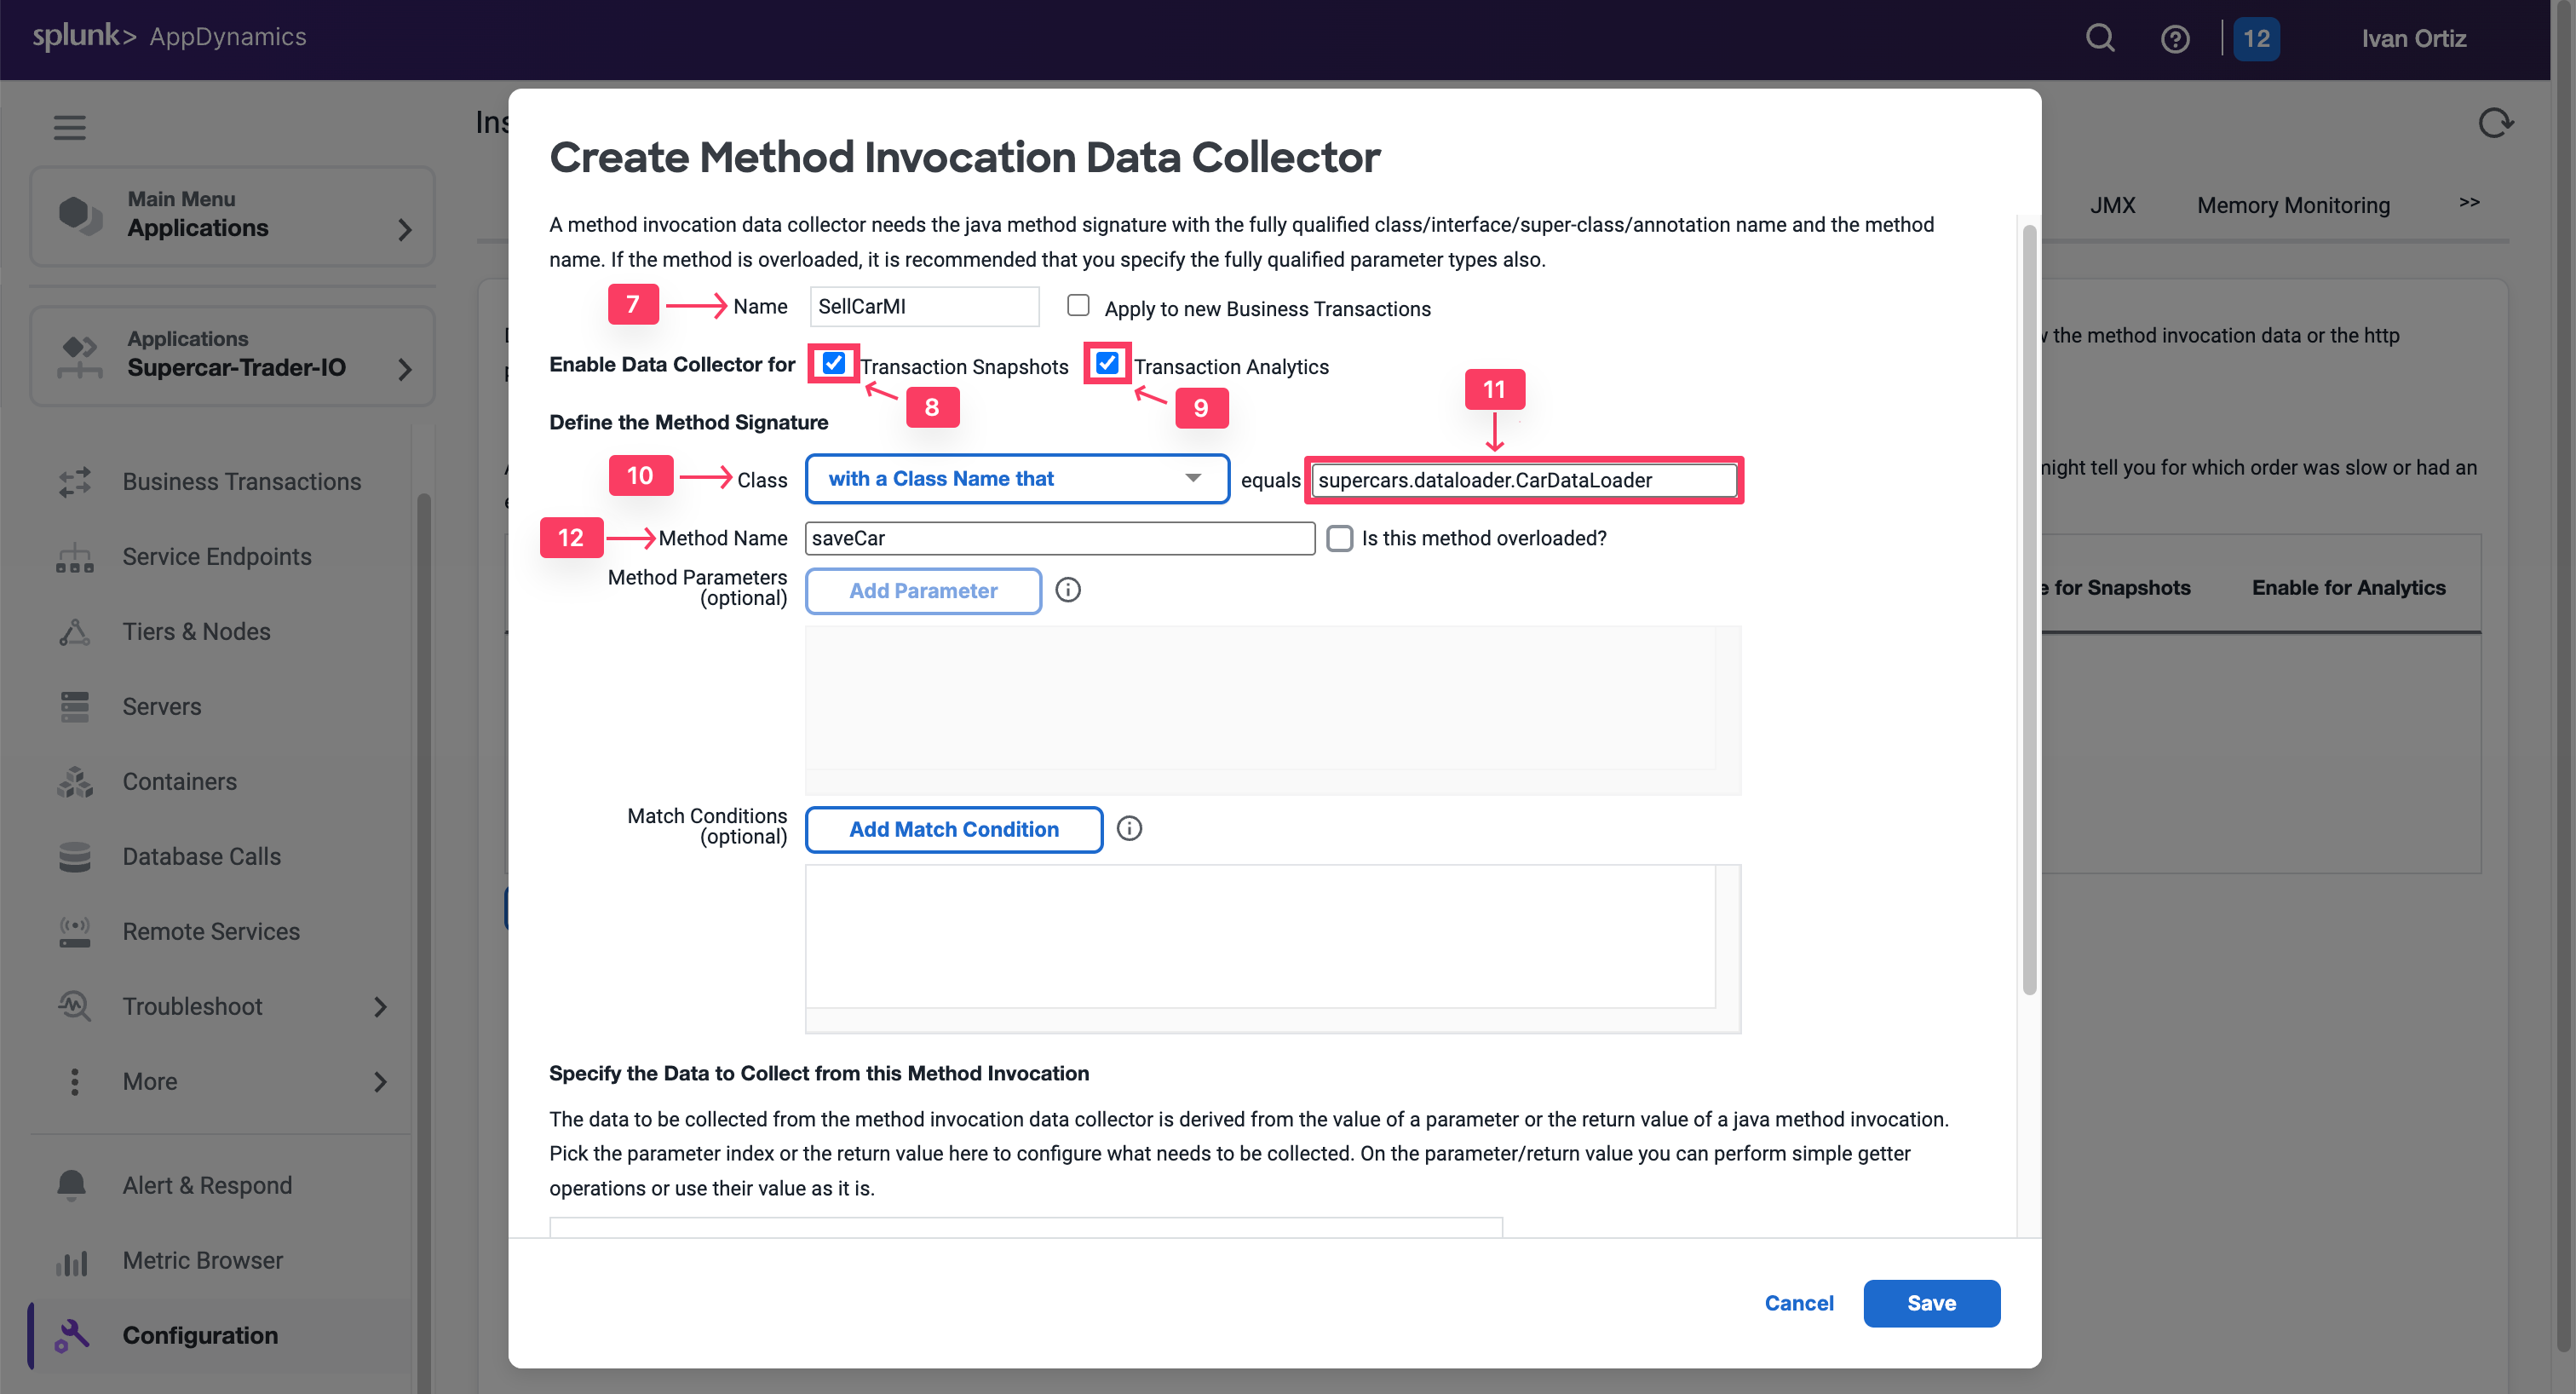
We will create a method invocation data collector to capture the car details.
For the Name, specify SellCarMI-YOURINITIALS.
Enable Transaction Snapshots.
Enable Transaction Analytics.
Select with a Class Name that.
Add supercars.dataloader.CarDataLoader as the Class Name.
Add saveCar as the Method Name.
Then as observed, the Input Parameter of Index 0 in SaveCar method was an on Object of Class CarForm, and then there is a Getter method inside that object that returns the car details properties such as getPrice().
So to explain that how we fetched that value in the MIDC, we will do the below:
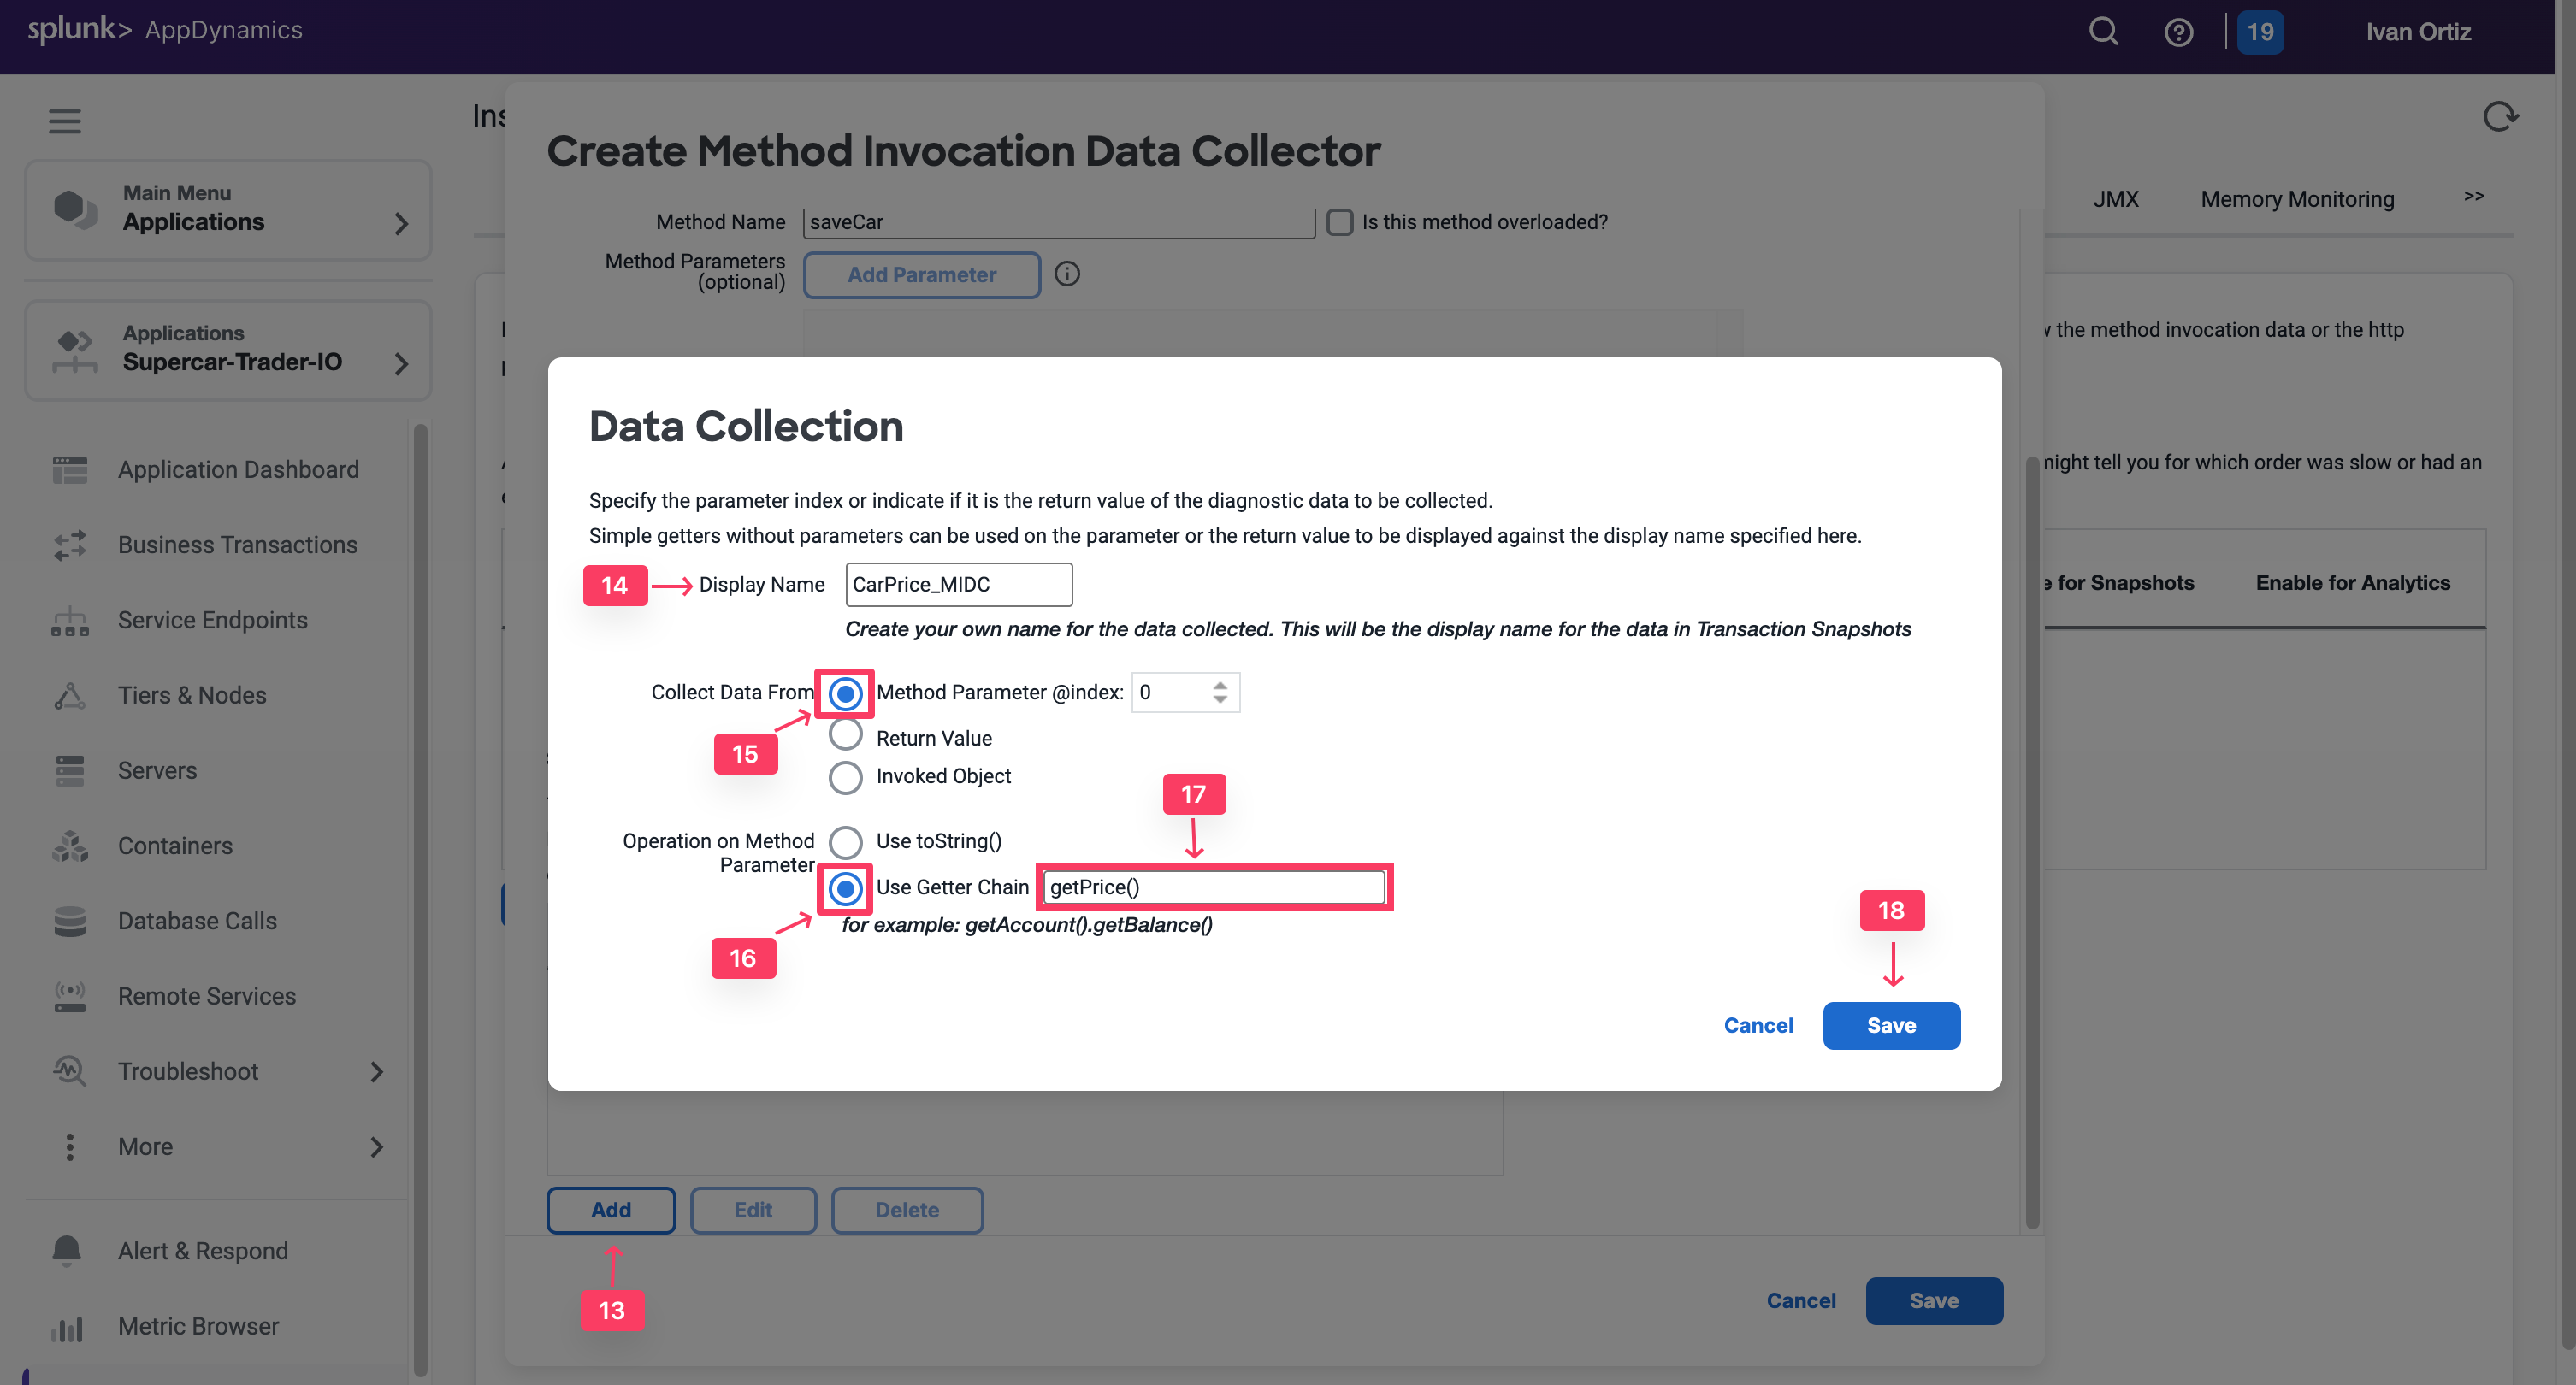
Click on Add at the bottom of the MIDC panel, to specify the new data that you want to collect.
In the Display Name, specify CarPrice_MIDC
In the Collect Data From, select Method Parameter of Index 0, which is our CarForm Object.
For the Operation on Method Parameter, select Use Getter Chain. You will be calling a method inside CarForm to return the car details.
Then specify getPrice(), the Getter method inside the CarForm class that will return the price.
Click Save.
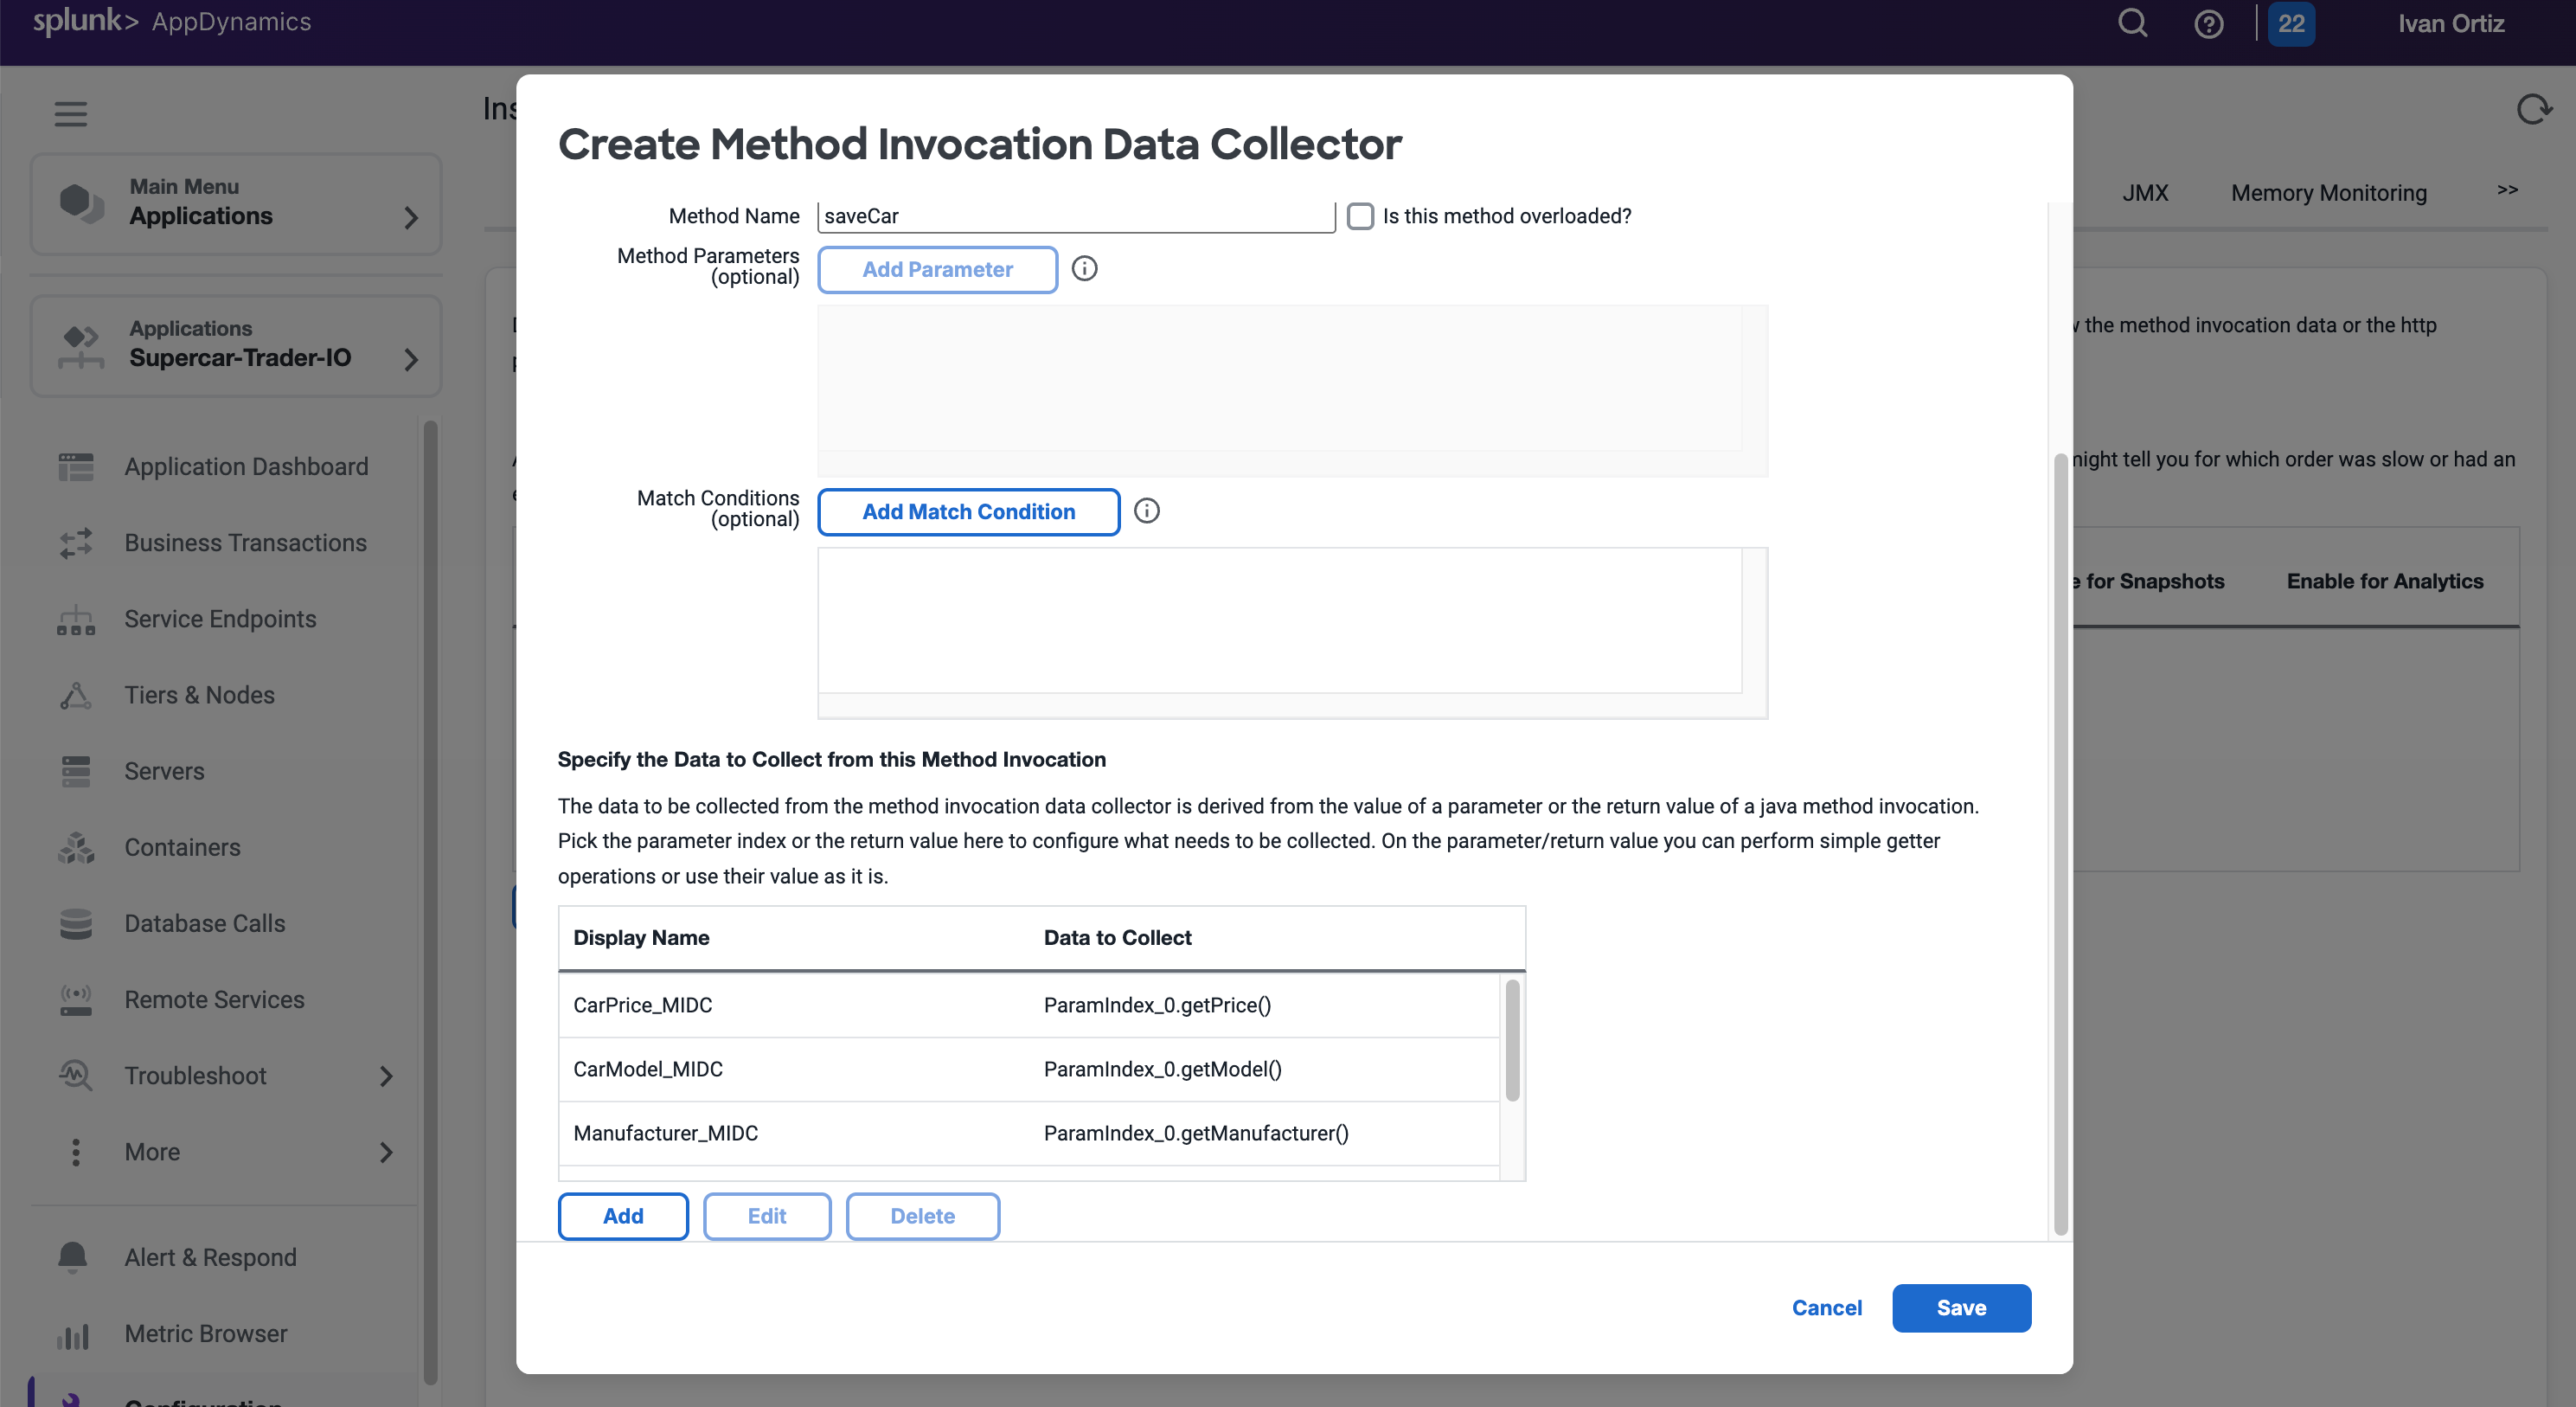
Repeat the above steps for all the properties, including color, model, and any others that you want to collect data for.
Save MIDC, and apply to the ”/Supercar-Trader/sell.do” business transaction.
The implementation of the MIDC requires that we restart the JVM:
SSH into your EC2 instance
Shutdown the Tomcat Sever
cd /usr/local/apache/apache-tomcat-9/bin
./shutdown.sh
If you find any remaining application JVMs still running, kill the remaining JVMs using the command below.
sudo pkill -f Supercar-Trader
Restart the Tomcat Server
./startup.sh
Validate that the Tomcat server is running, this can take a few minutes
Go to the website and apply some manual load on the Sell Car Page by submitting the form a couple of times.
You will now verify if the business data was captured by HTTP data collectors in AppDynamics Analytics.
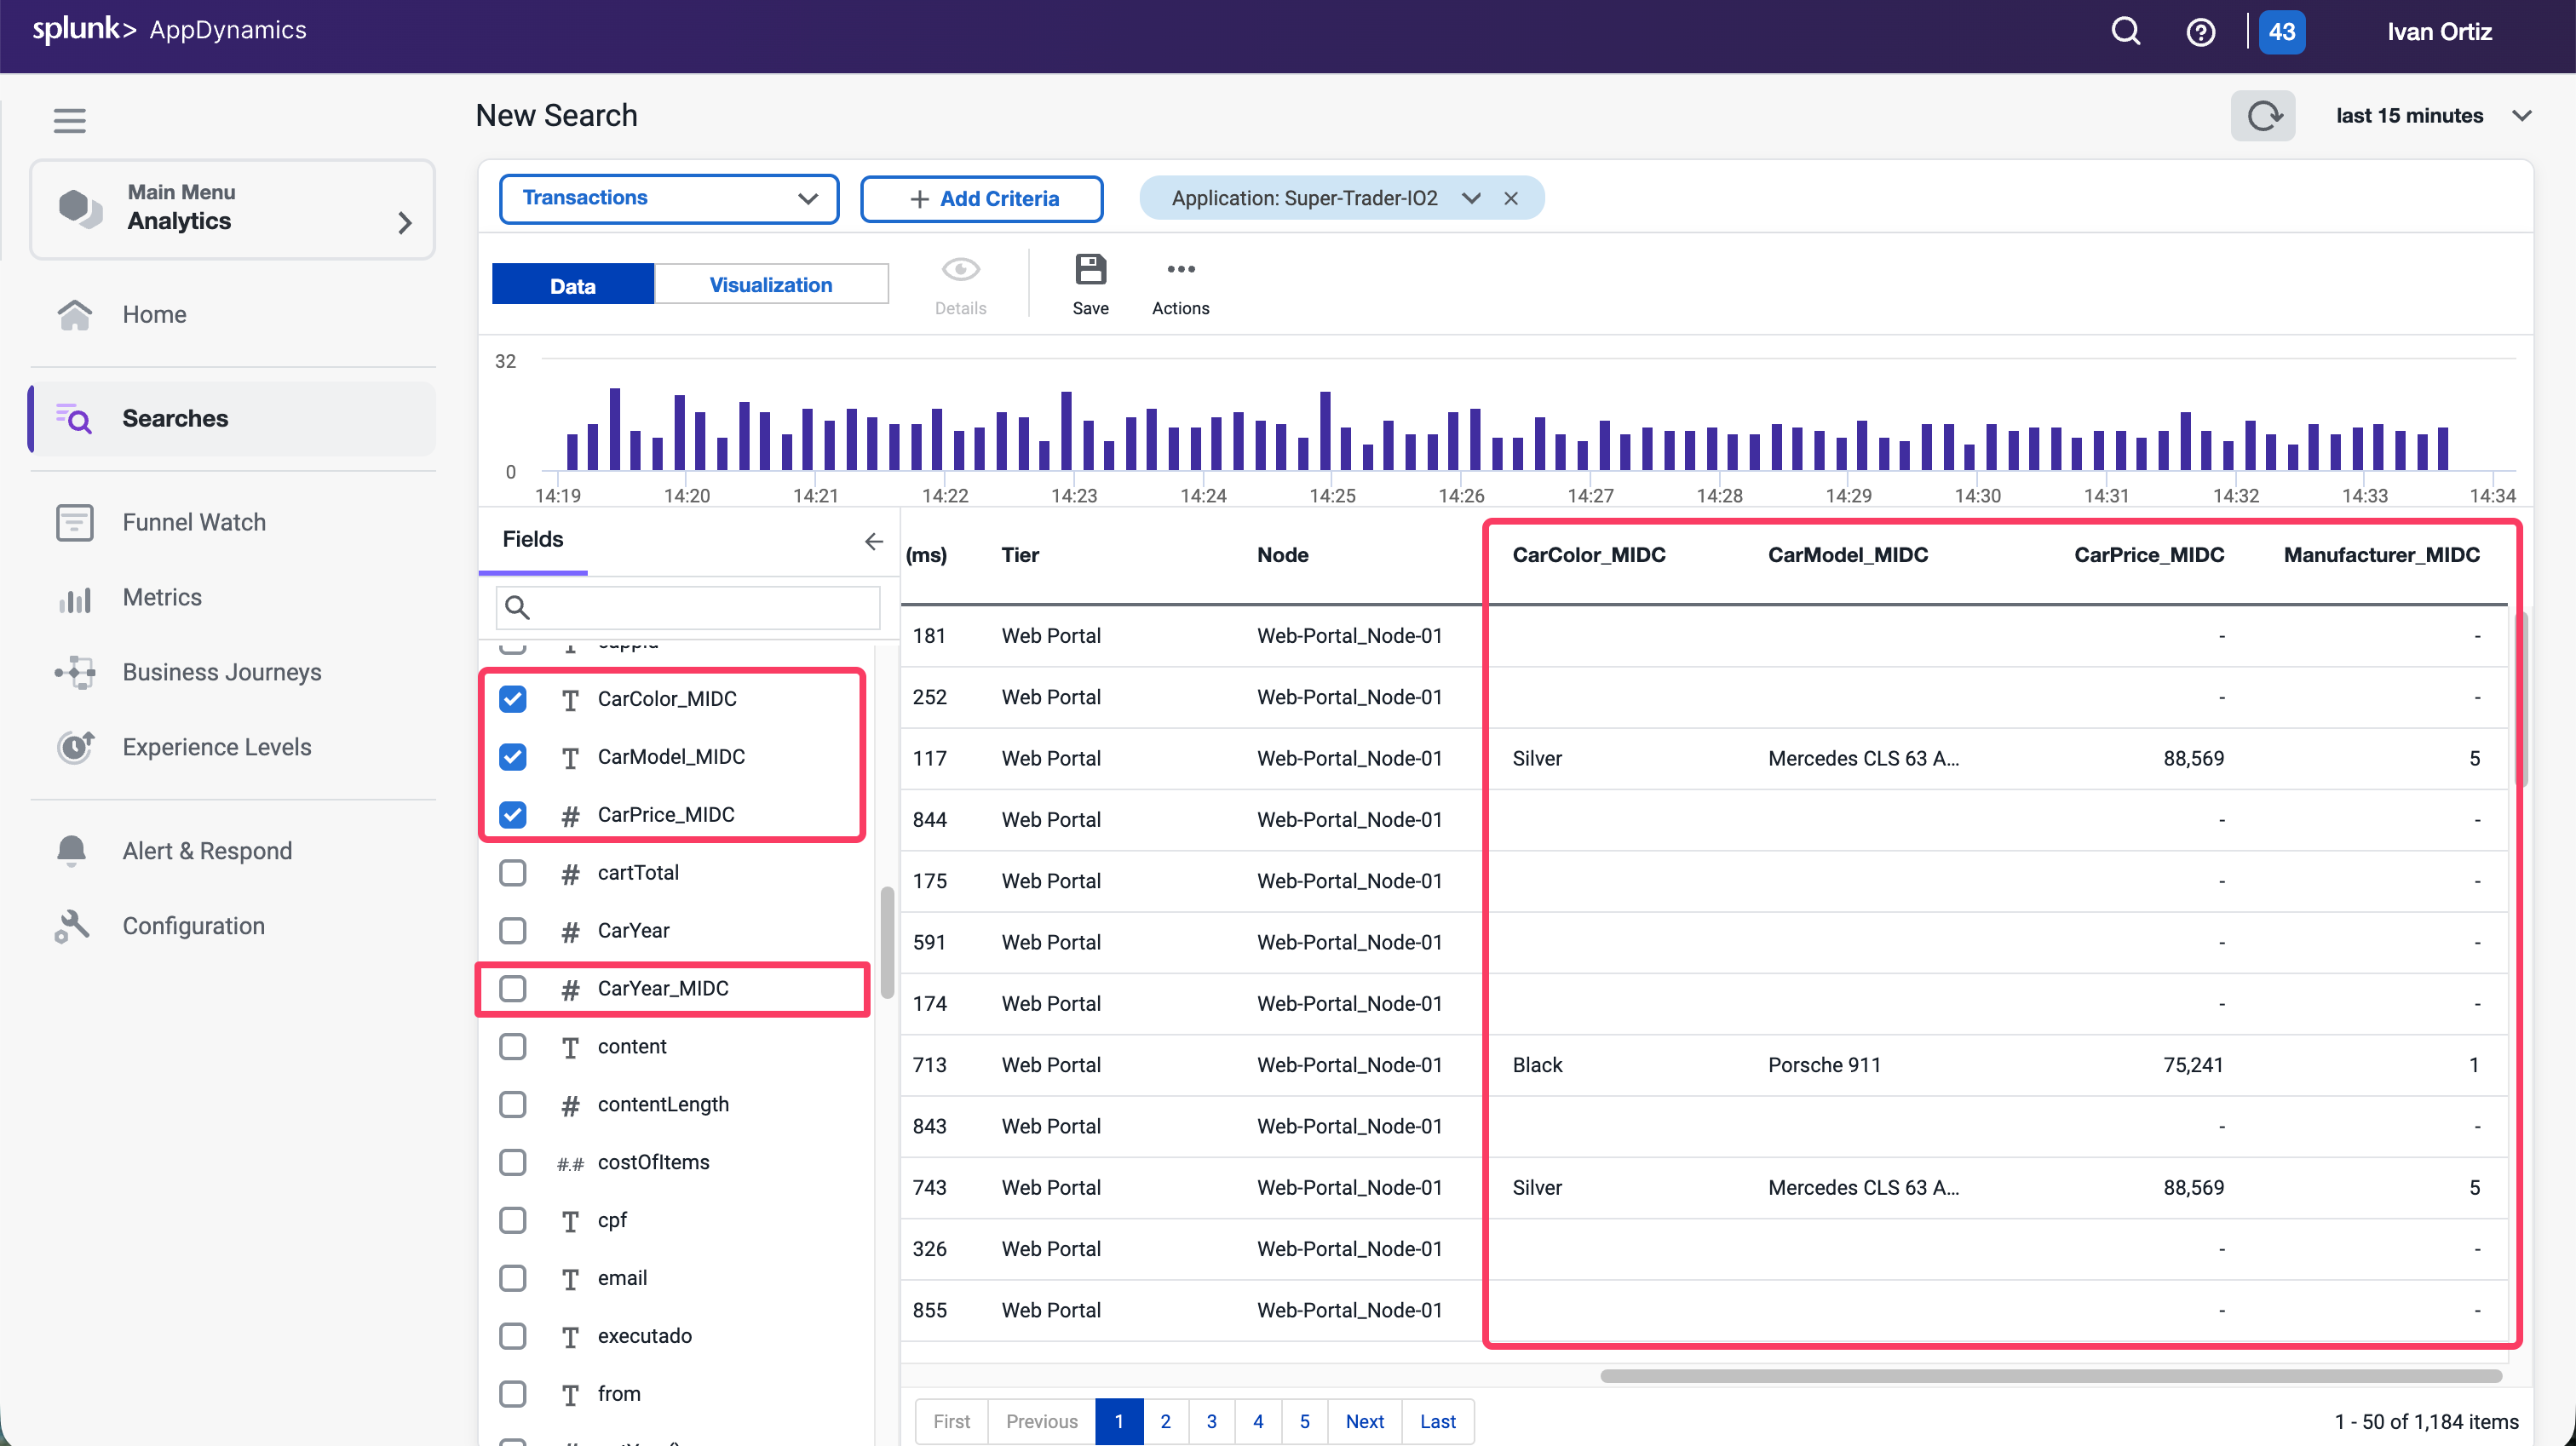
Select the Analytics tab.
Select the Searches tab and Add a new Drag and Drop Search.
Click the + Add button and create a new Drag and Drop Search.
Click + Add Criteria
Select Application and Search For Your Application Name Supercar-Trader-YOURINITIALS
Verify that the Business Parameters appear as a field in the Custom Method Data.
Verify that the CarPrice Field has data.
Conclusion
You have now captured the business data from the Sell Car transaction from the node at runtime. This data can be used in the Analytical and Dashboard features within AppDynamics to provide more context to the business and measure IT impact on the business.
Dashboard Components
2 minutes
The ability to build dashboards is a vital component of the AppDynamics capabilities and value. In this exercise,you will work with some of the dashboard components that can be used to build compelling dashboards.
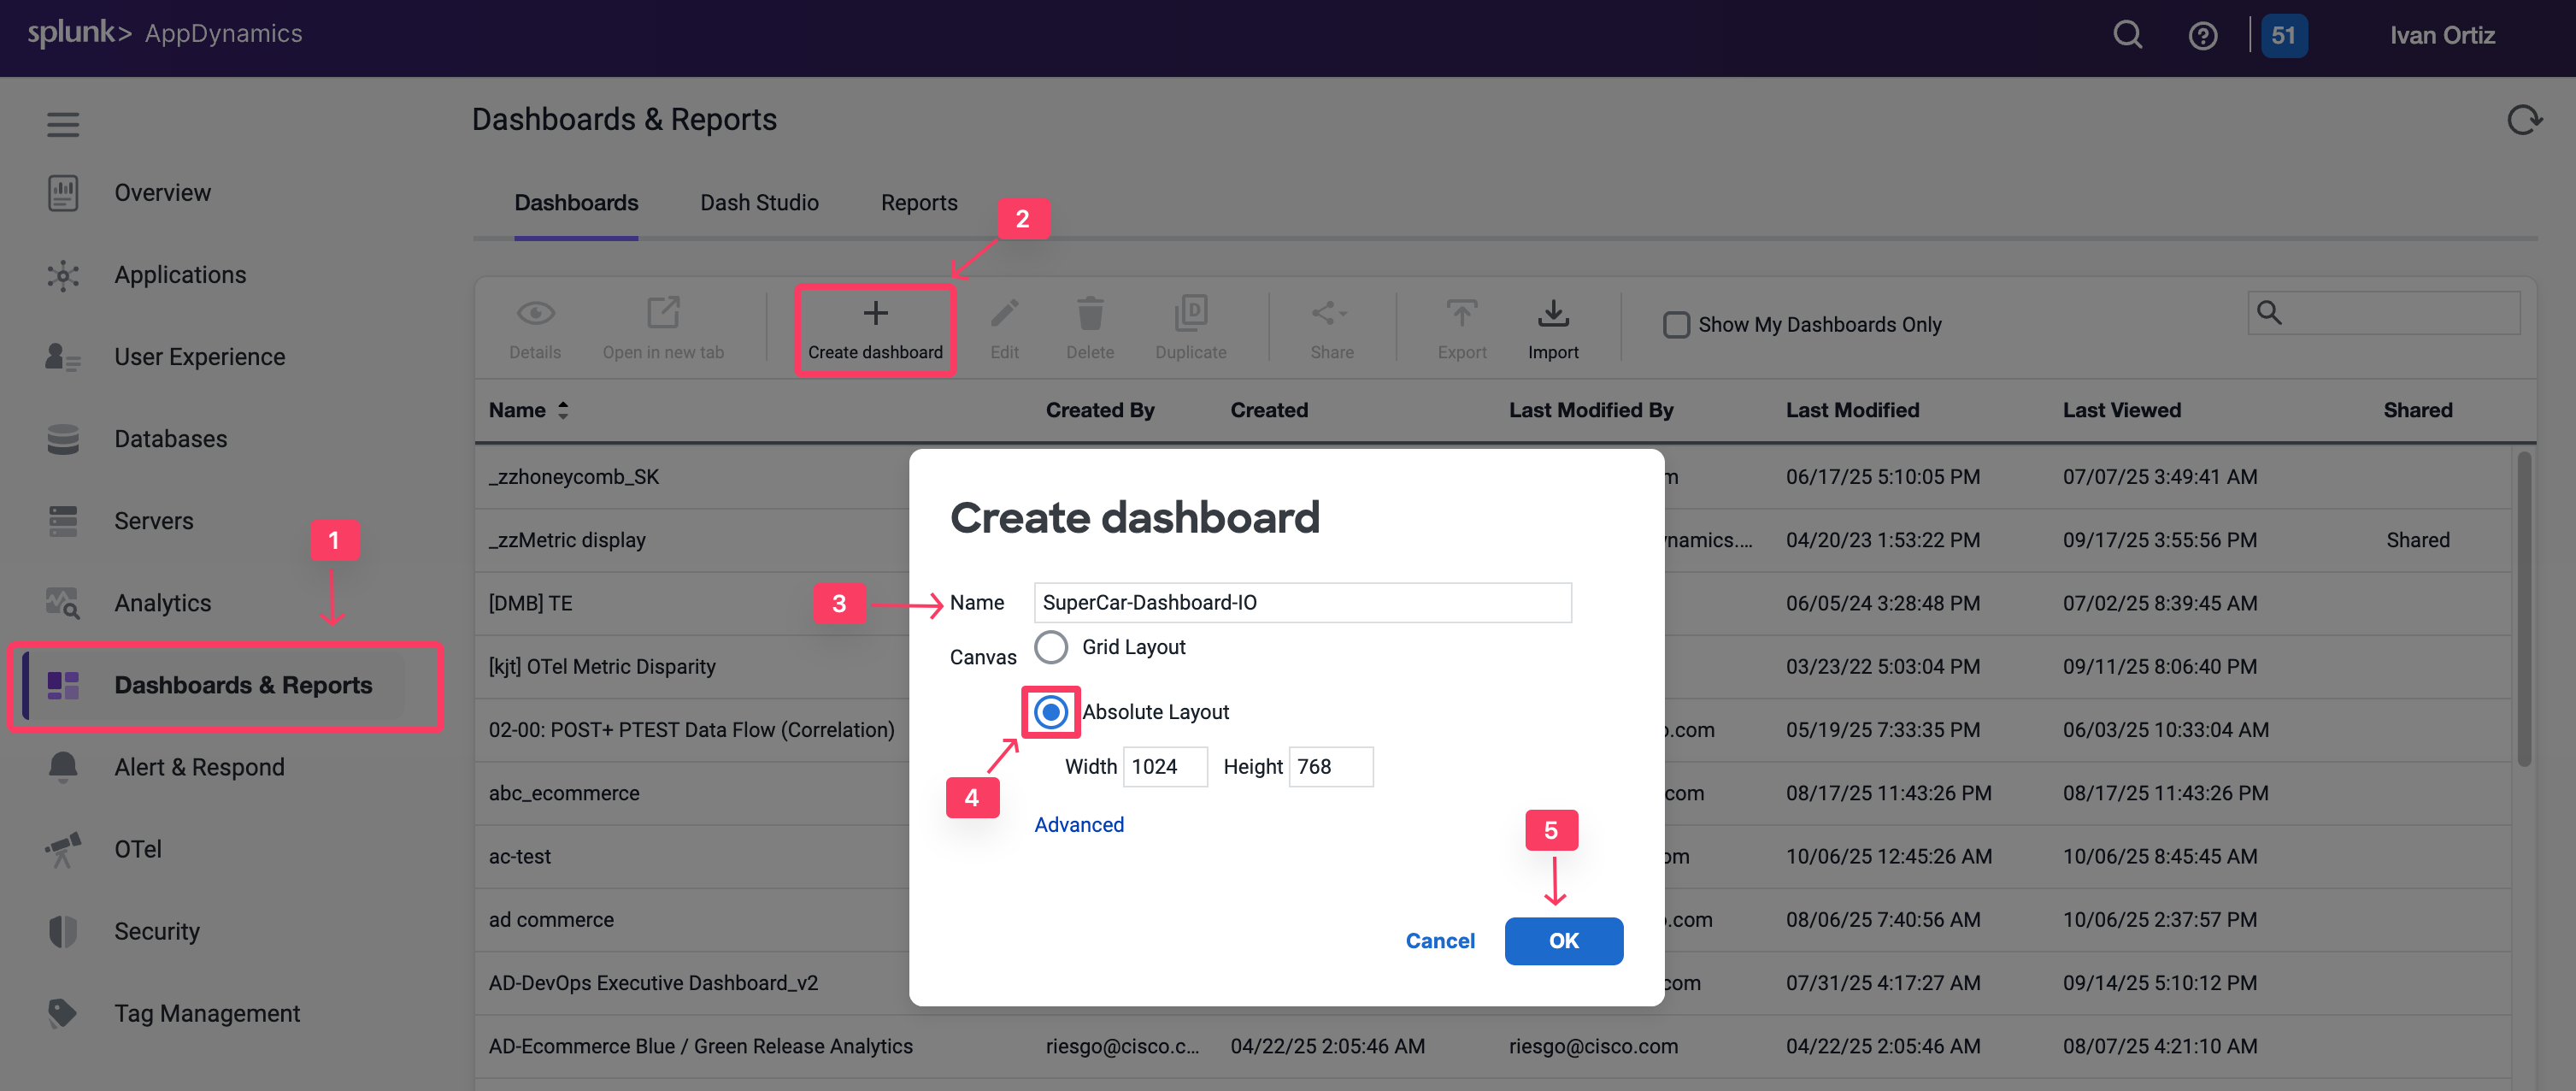
Create a new dashboard
Select the Dashboard & Reports tab.
Click Create Dashboard.
Enter a dashboard name such as SuperCar-Dashboard-YOURINITIALS.
Select Absolute Layout as the Canvas Type.
Click OK.
Now open the newly created empty dashboard. You will now add various widget types.
Dashboard components custom widget builder
The custom widget builder is a highly flexible tool that can generate representations of data, including numeric vews, time series, pie charts, and more. It is based on the AppDynamics AD Query Language.
To create a widget, follow these steps:
Toggle the Edit Mode at the upper left corner of the dashboard.
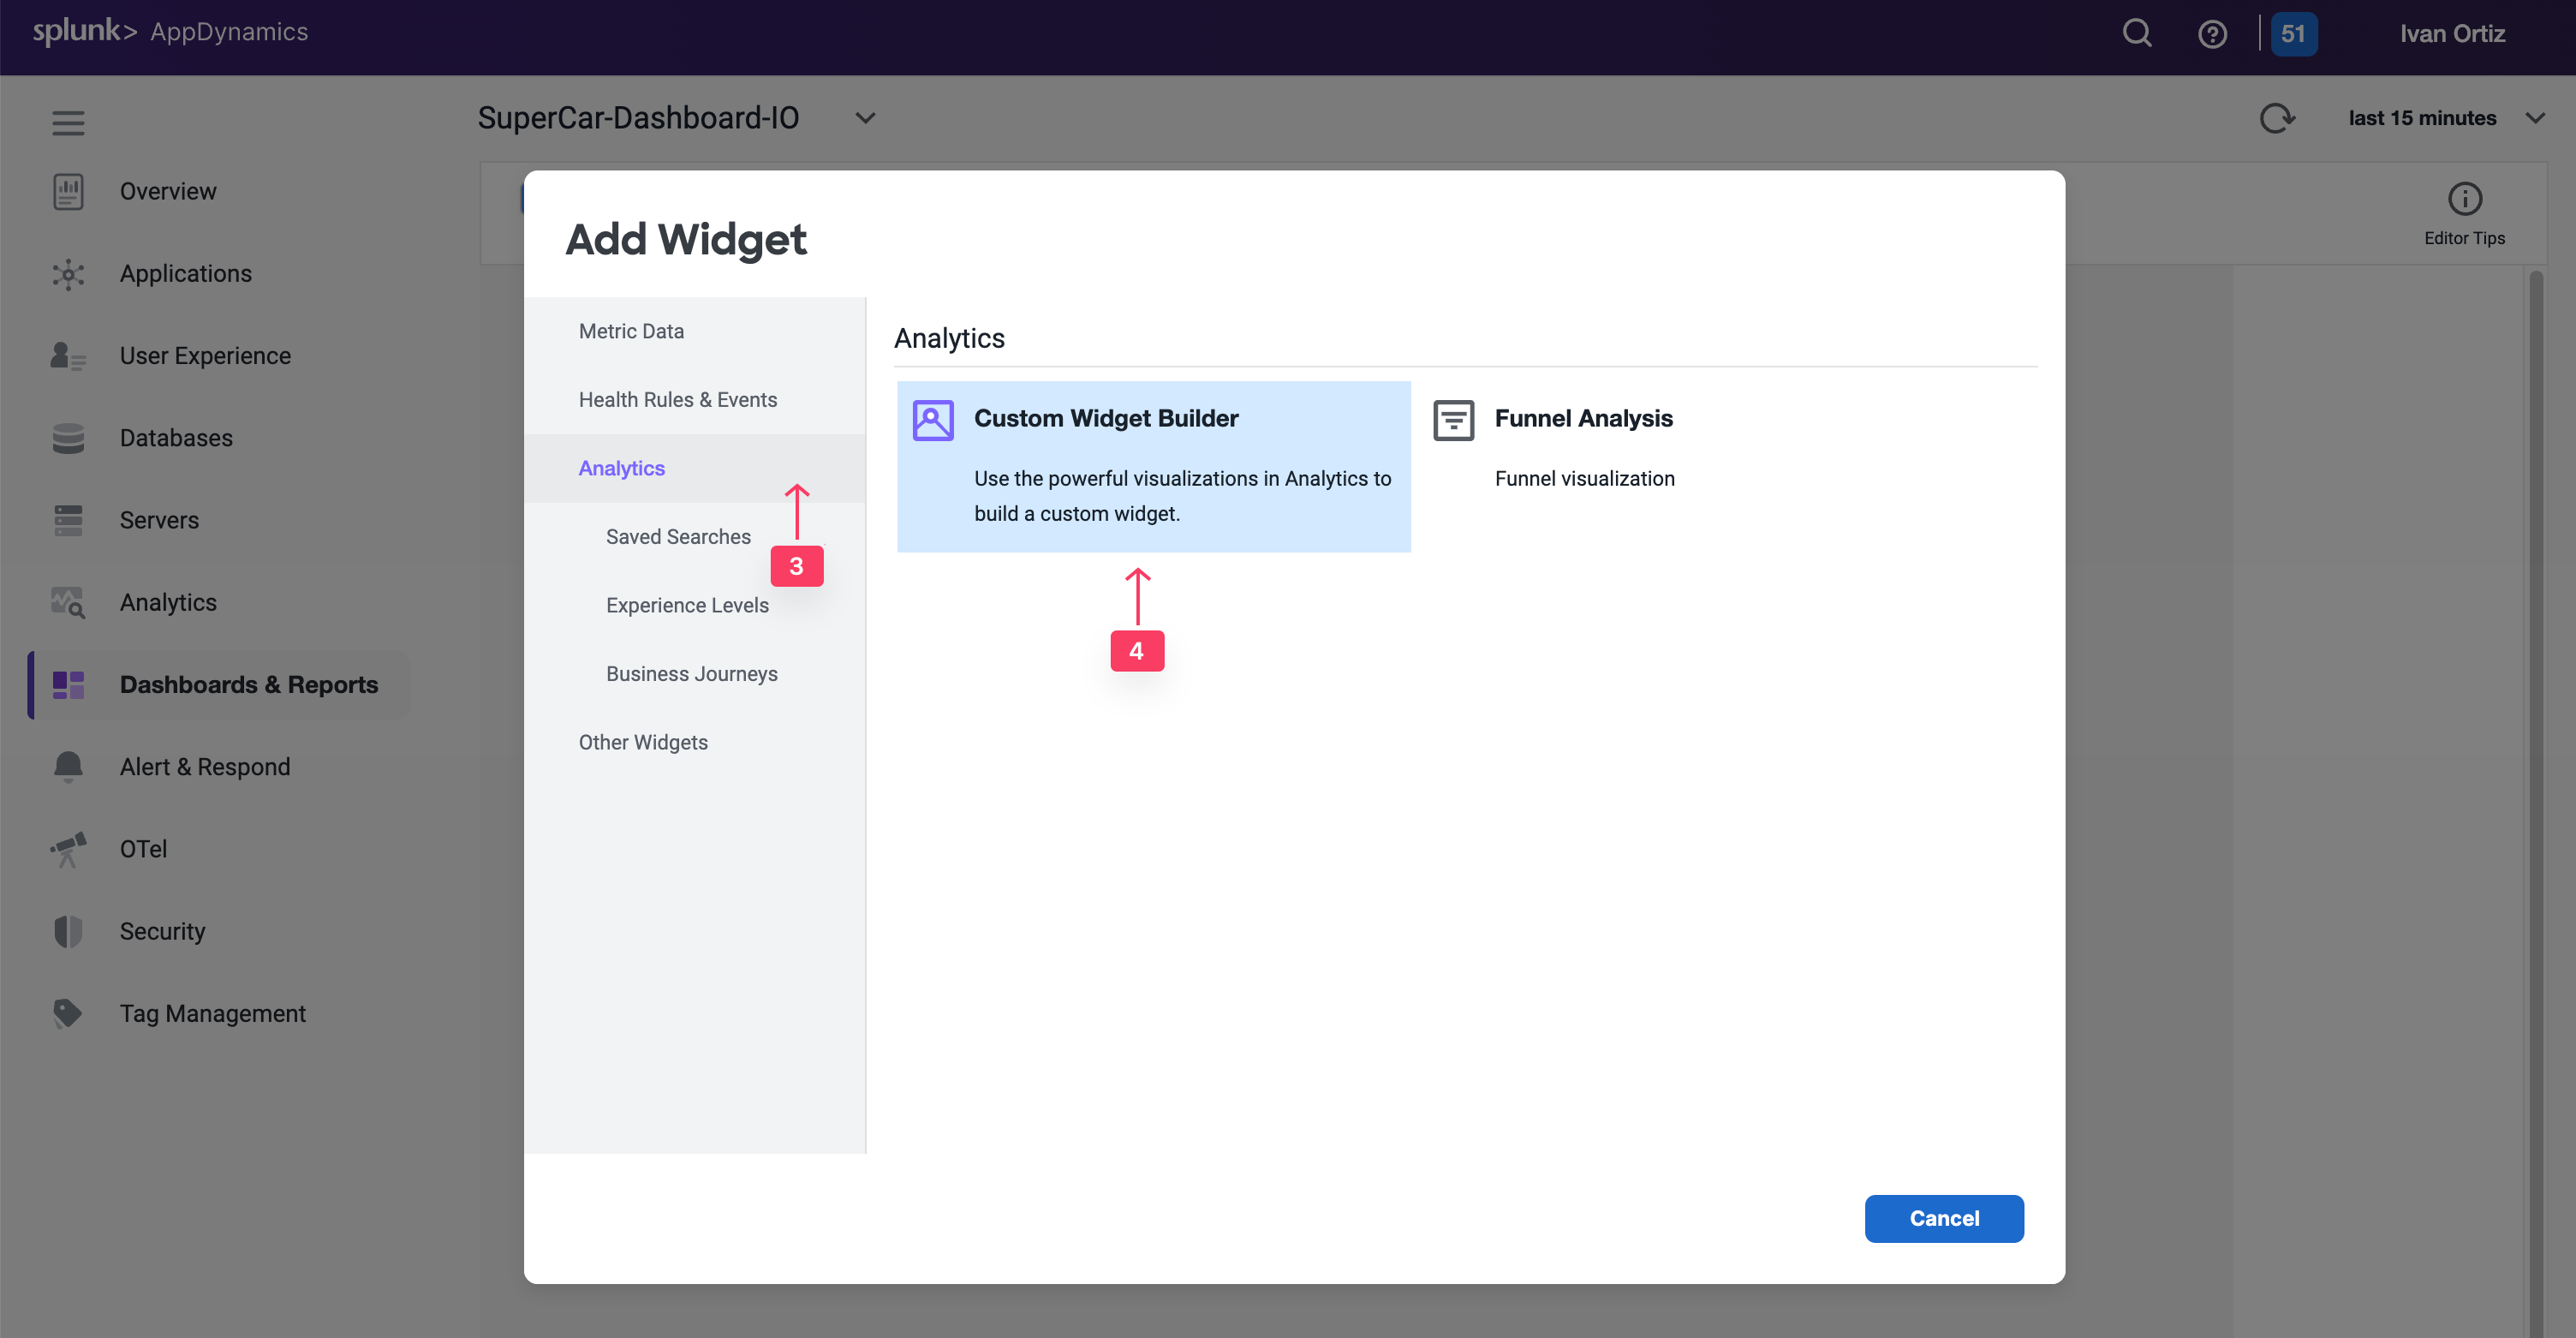
Click Add Widget.
Select the Analytics tab on the left.
Click Custom Widget Builder.
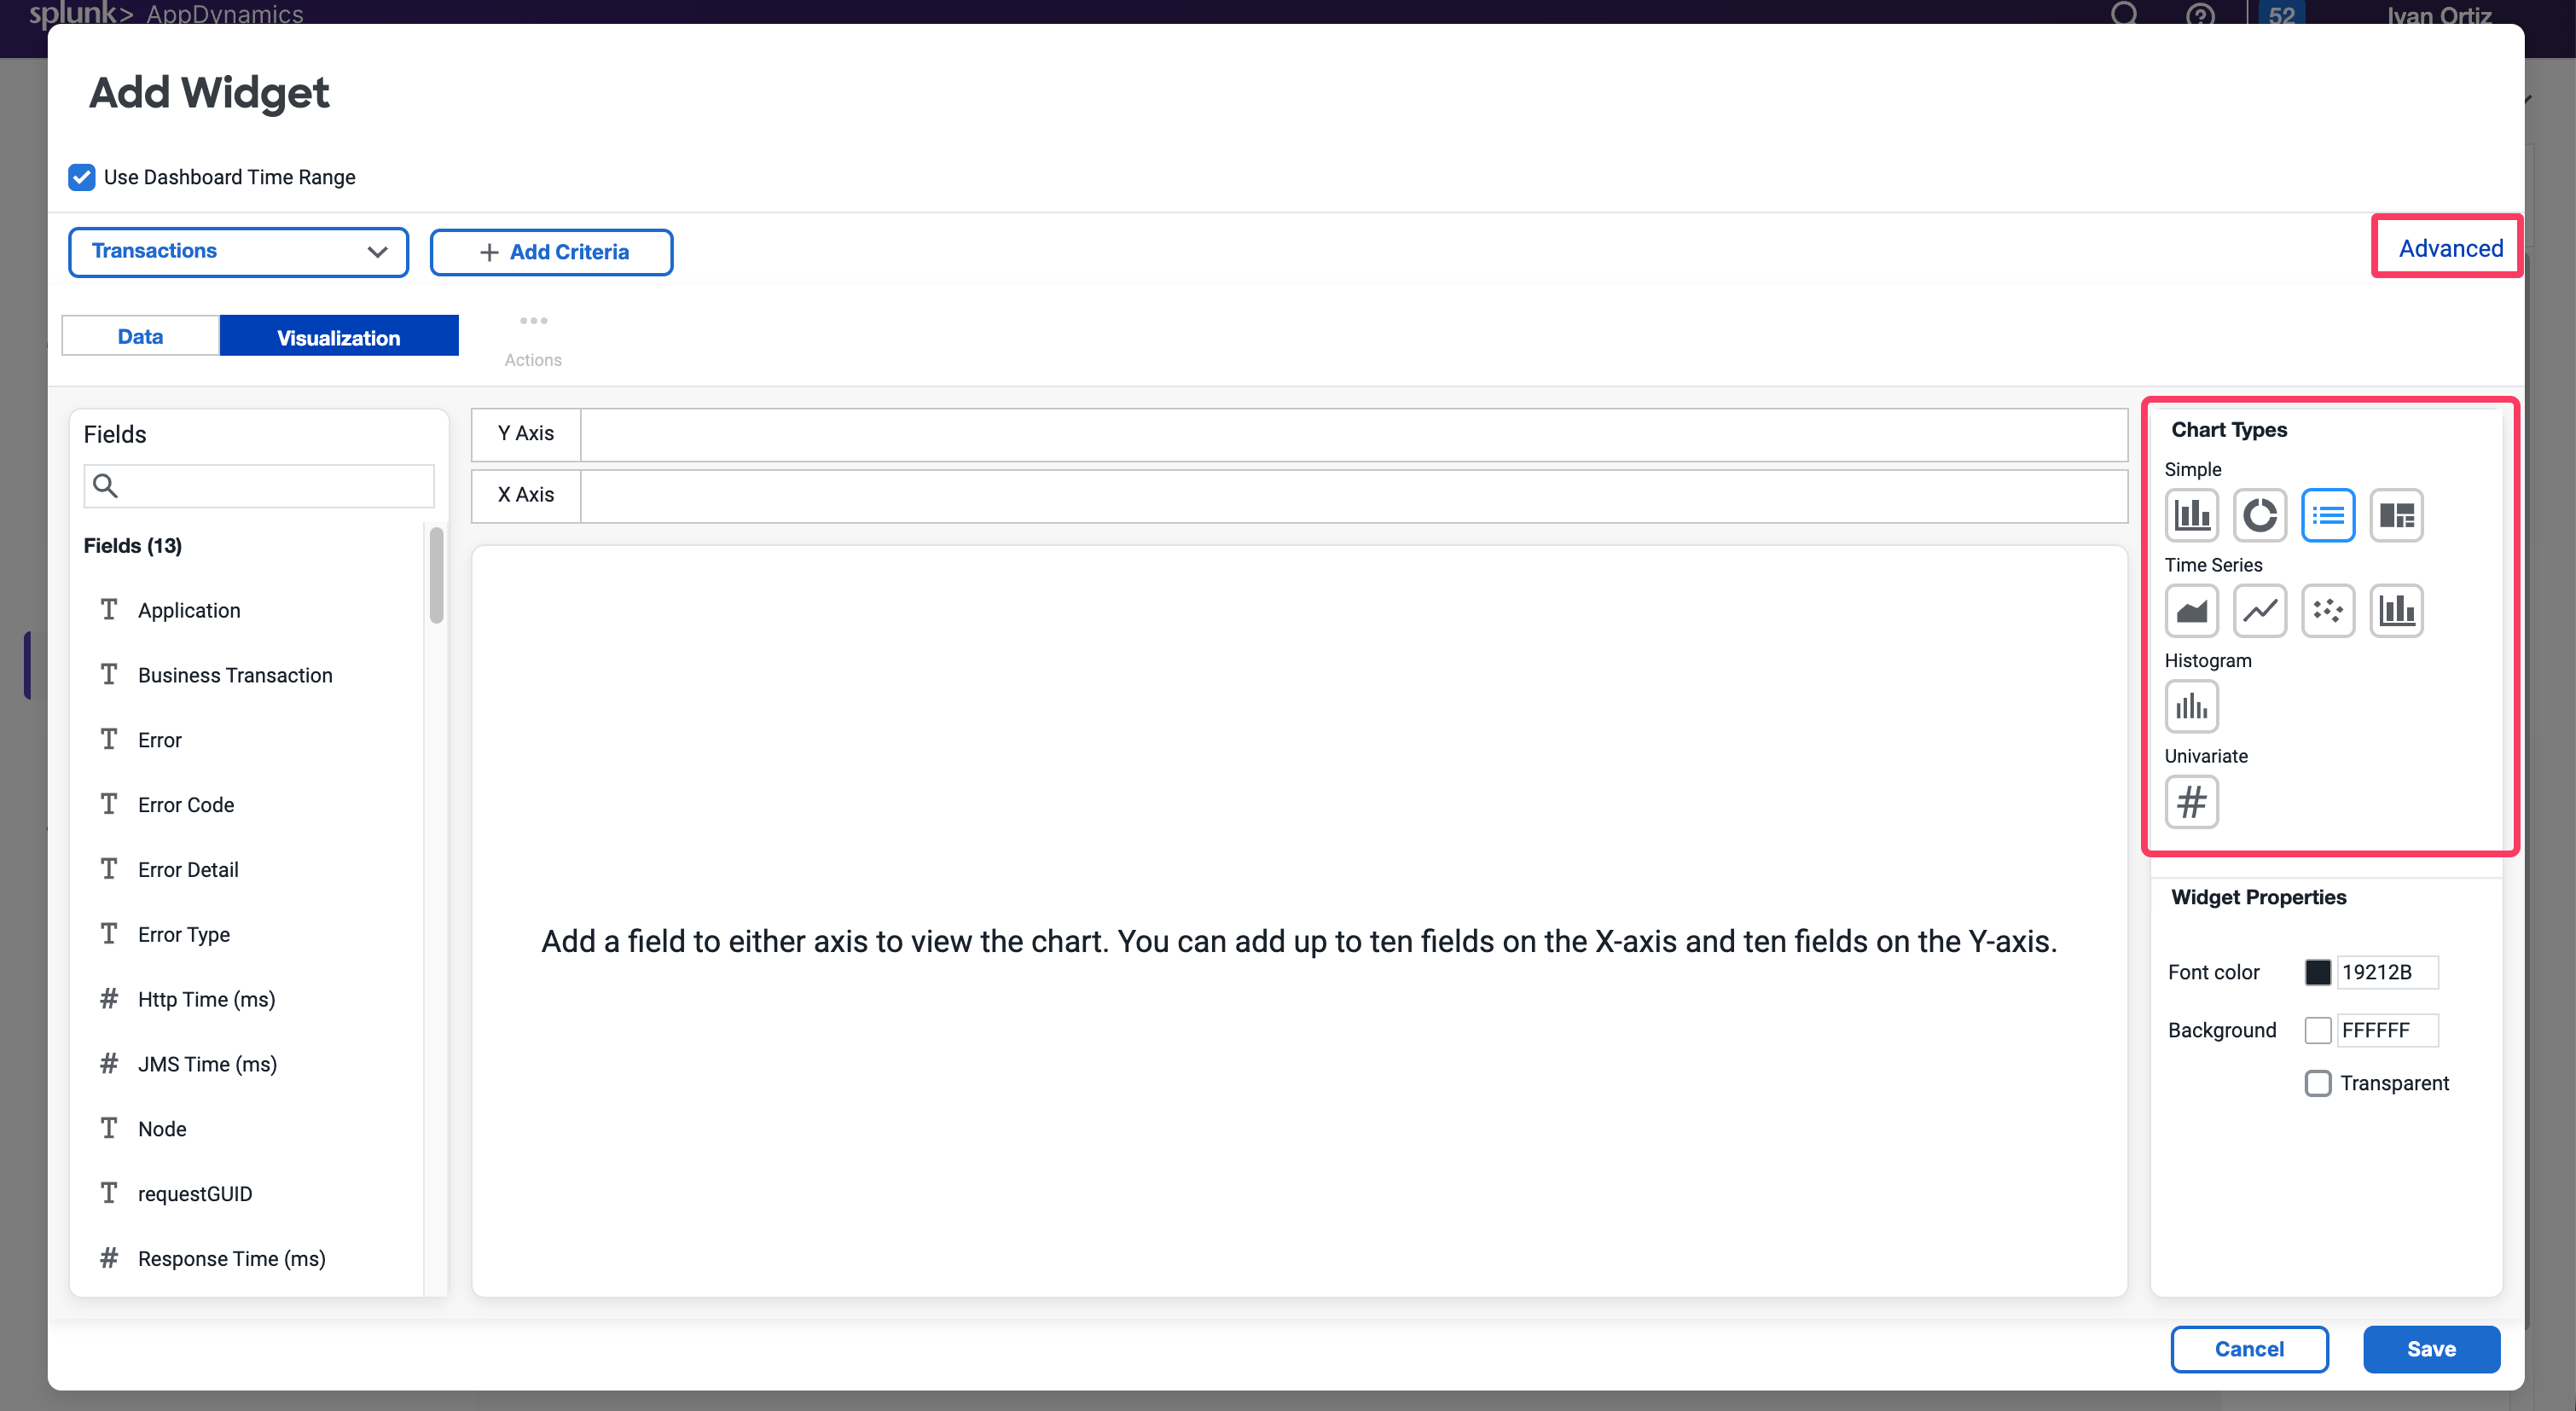
There are many chart types that you can create in the Customer Widget Builder. You can simply drag or drop information or create an AD Query in the Advanced pane..
For now, we will cover Numeric, Bar and Pie Charts.
Numeric charts
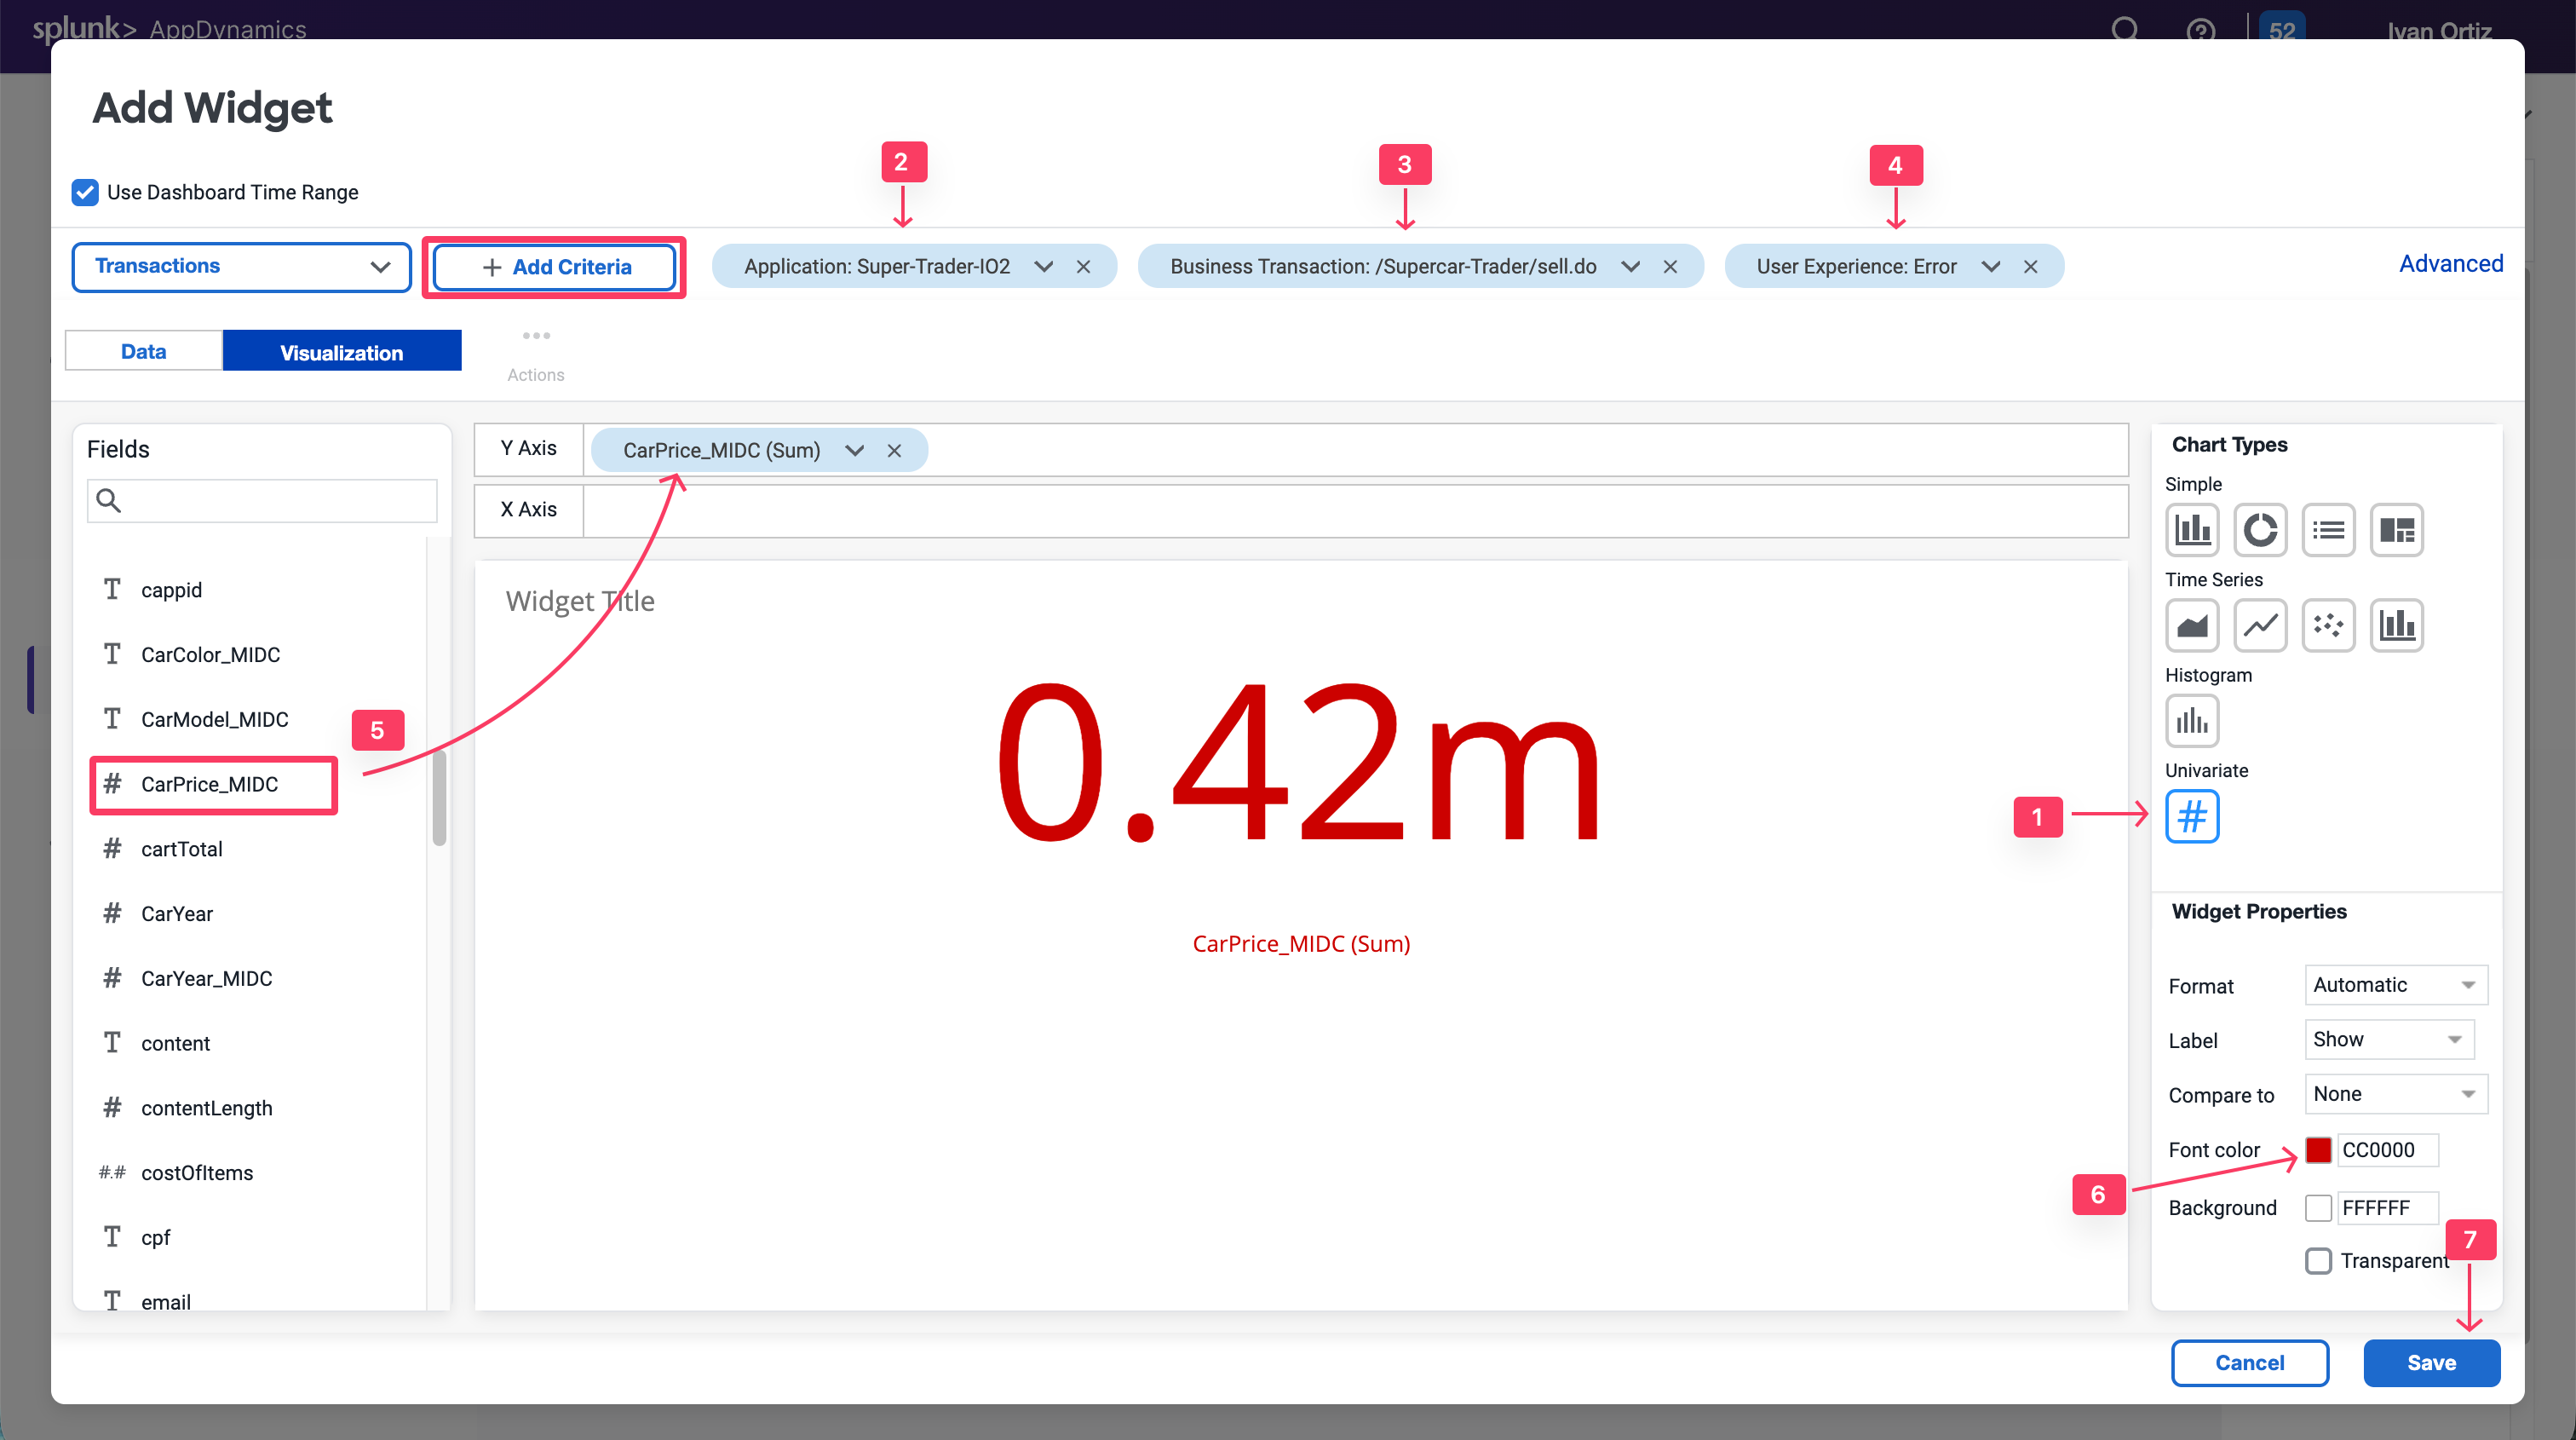
Exercise: Quantifying the dollar amount impacted by errors enables you to show the impact of IT performance on the business revenue.
Select the Numeric chart type.
Add a Filter on the Application field and Select your application name: Supercar-Trader-YOURINITIALS
Add a filter on the /Supercar-Trader/sell.do business transactions.
Add a filter on the User Experience Field selecting only the Error to show the impact of errors.
Find the CarPrice_MIDC field on the left panel and drag and drop it into the Y-Axis. Notice that SUM is the Aggregation used to capture the total price per model.
Change the font color to red for better visibility.
Click Save.
Note that you could do the same for the $ Amount Transacted Successfully criterion by changing the user experience filter to only include NORMAL, SLOW and VERY SLOW.
You could also baseline this metric by creating a custom metric in the Analytics module and defining a health rule that indicates if the $ Amount Impacted is equal to or higher than the baseline. You can also add a label for the currency.
Bar charts
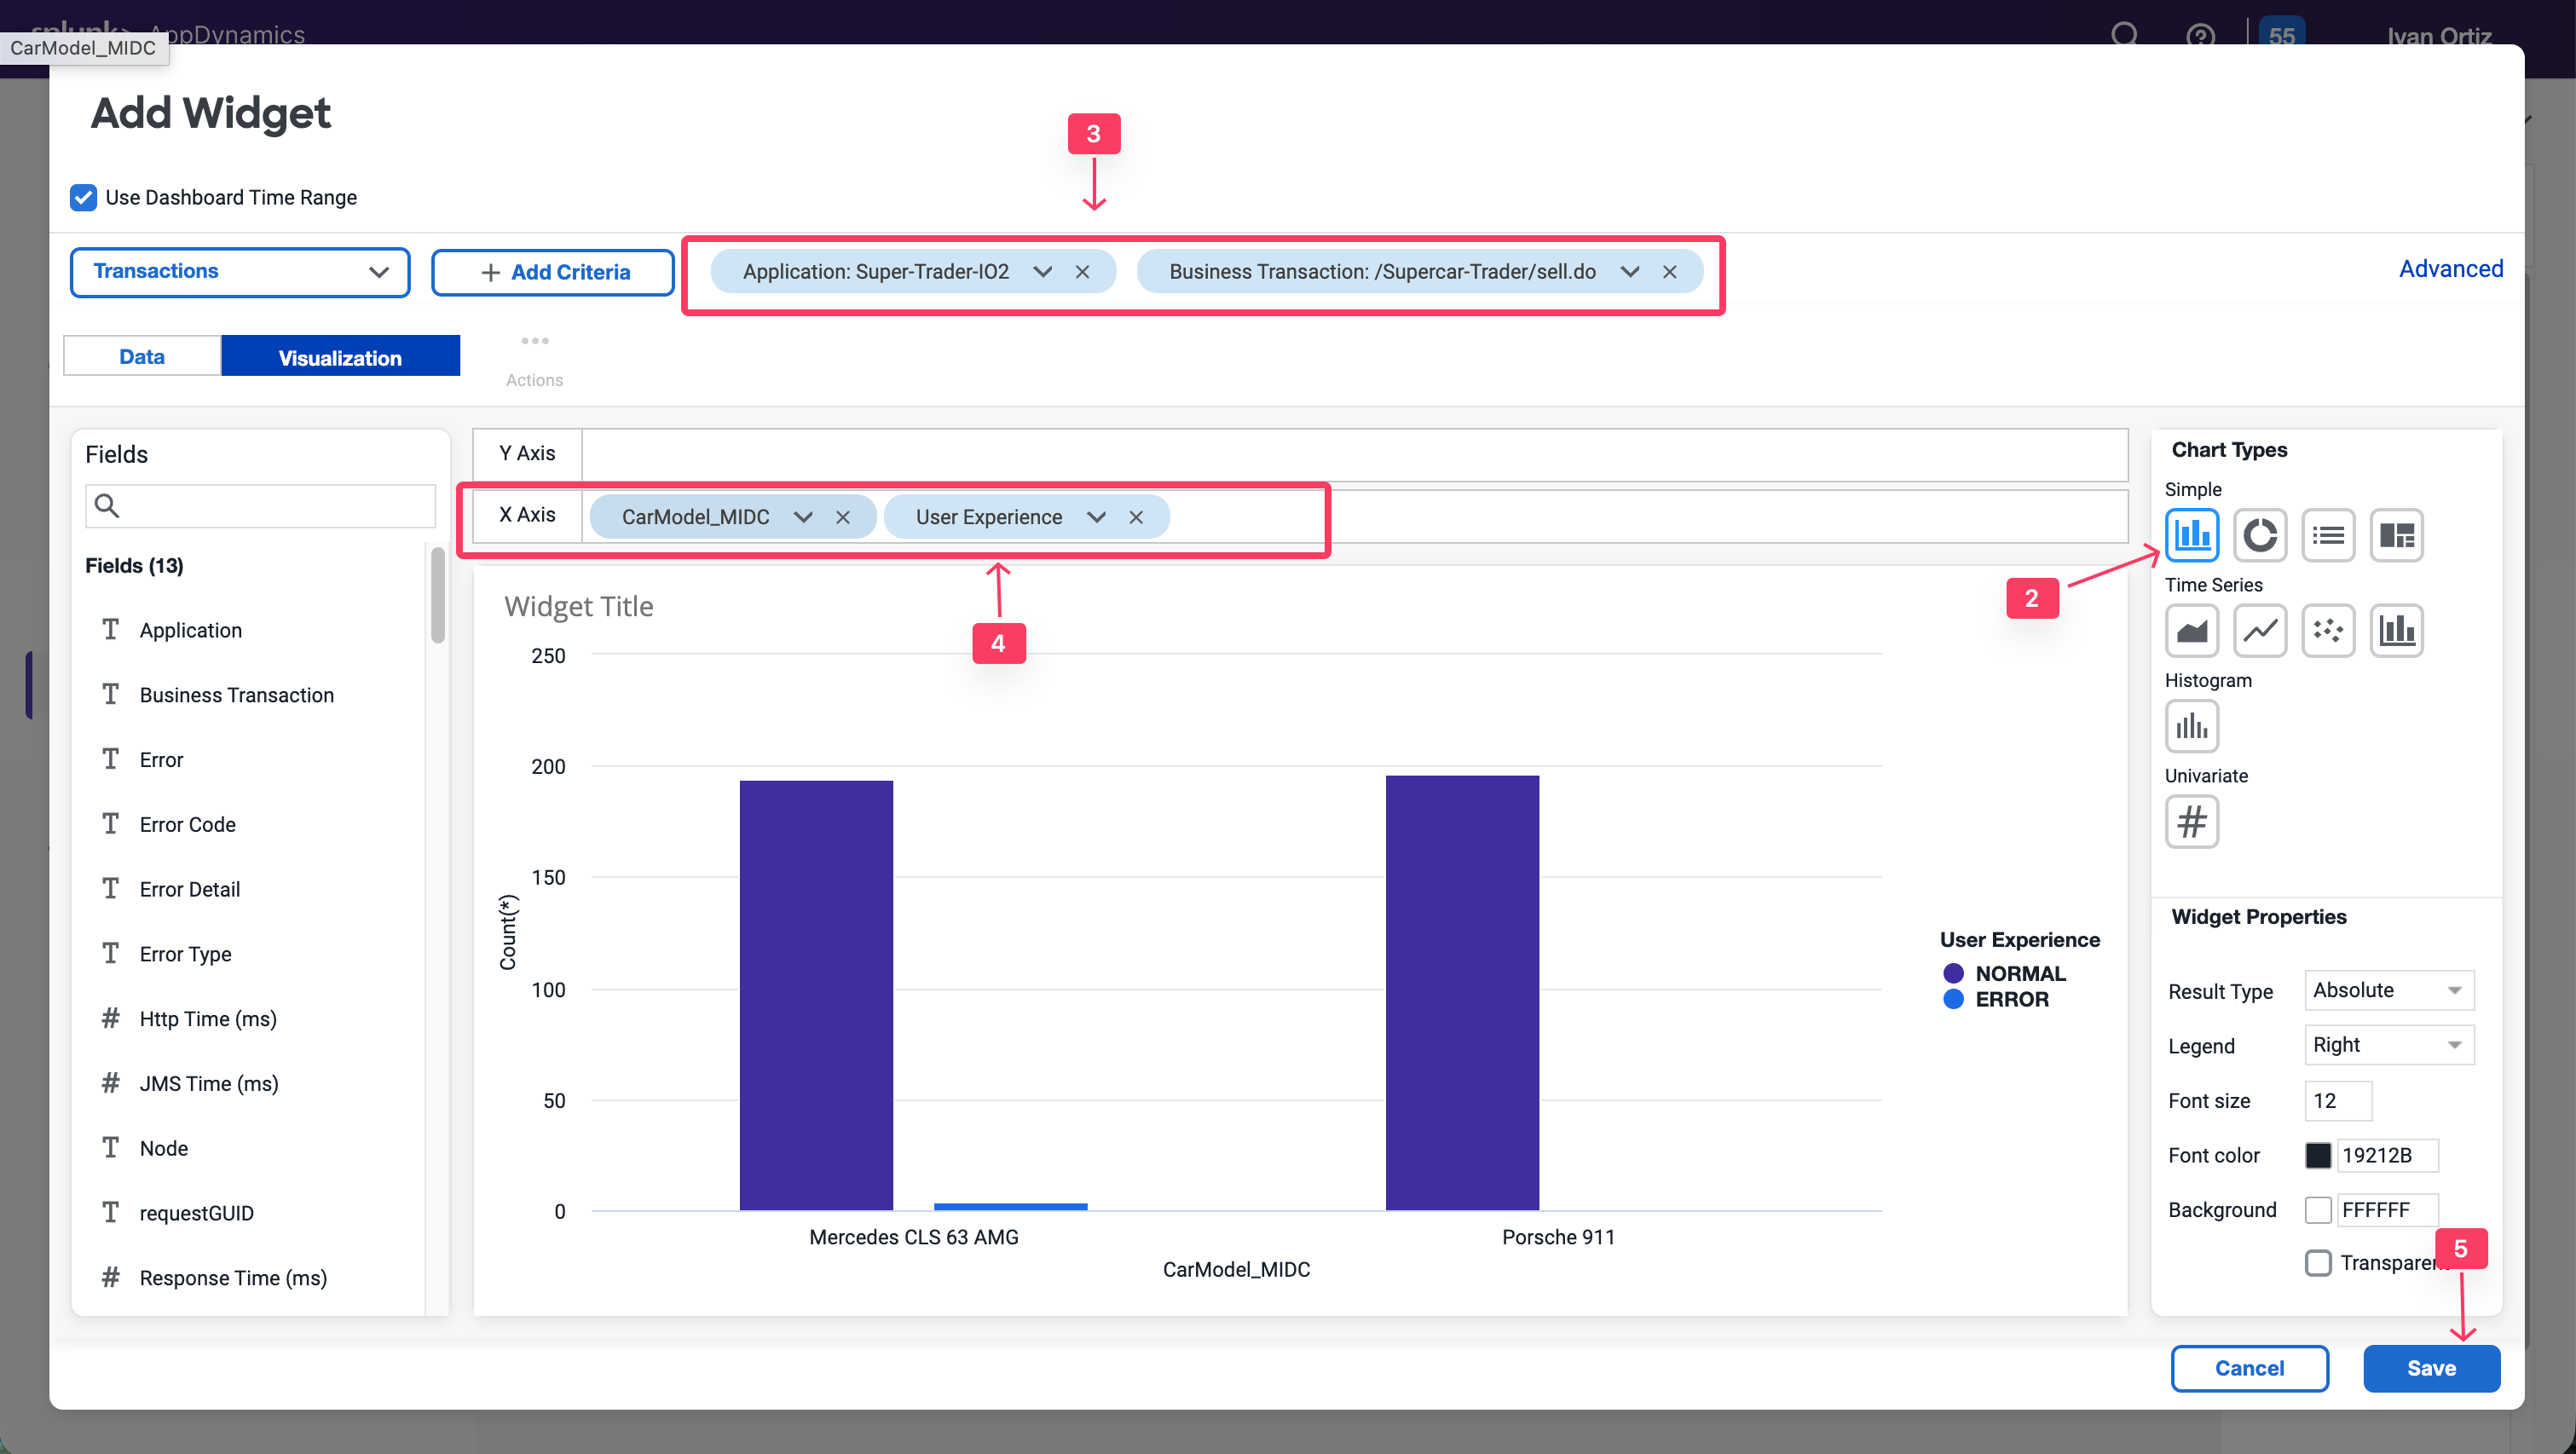
Exercise: You will now create a bar chart to visualize Top Impacted Car Models. The chart will show the car models of all of the SellCar transactions, categorized by the User Experience.
Create a New Widget by clicking + Add Widget, Analytics and Custom Widger Builder
Select the Column chart type.
Add the following filters: Application = Supercar-Trader-YOURINITIALS and Business Transaction = /Supercar-Trader/sell.do.
Add CarModel_MIDC and User Experience to the X-Axis.
Click Save.
This chart type can be adjusted based on your need. For example, you could group the X-AXIS by Customer Type, Company, Organization, and more. Refer to the following example.
Pie charts
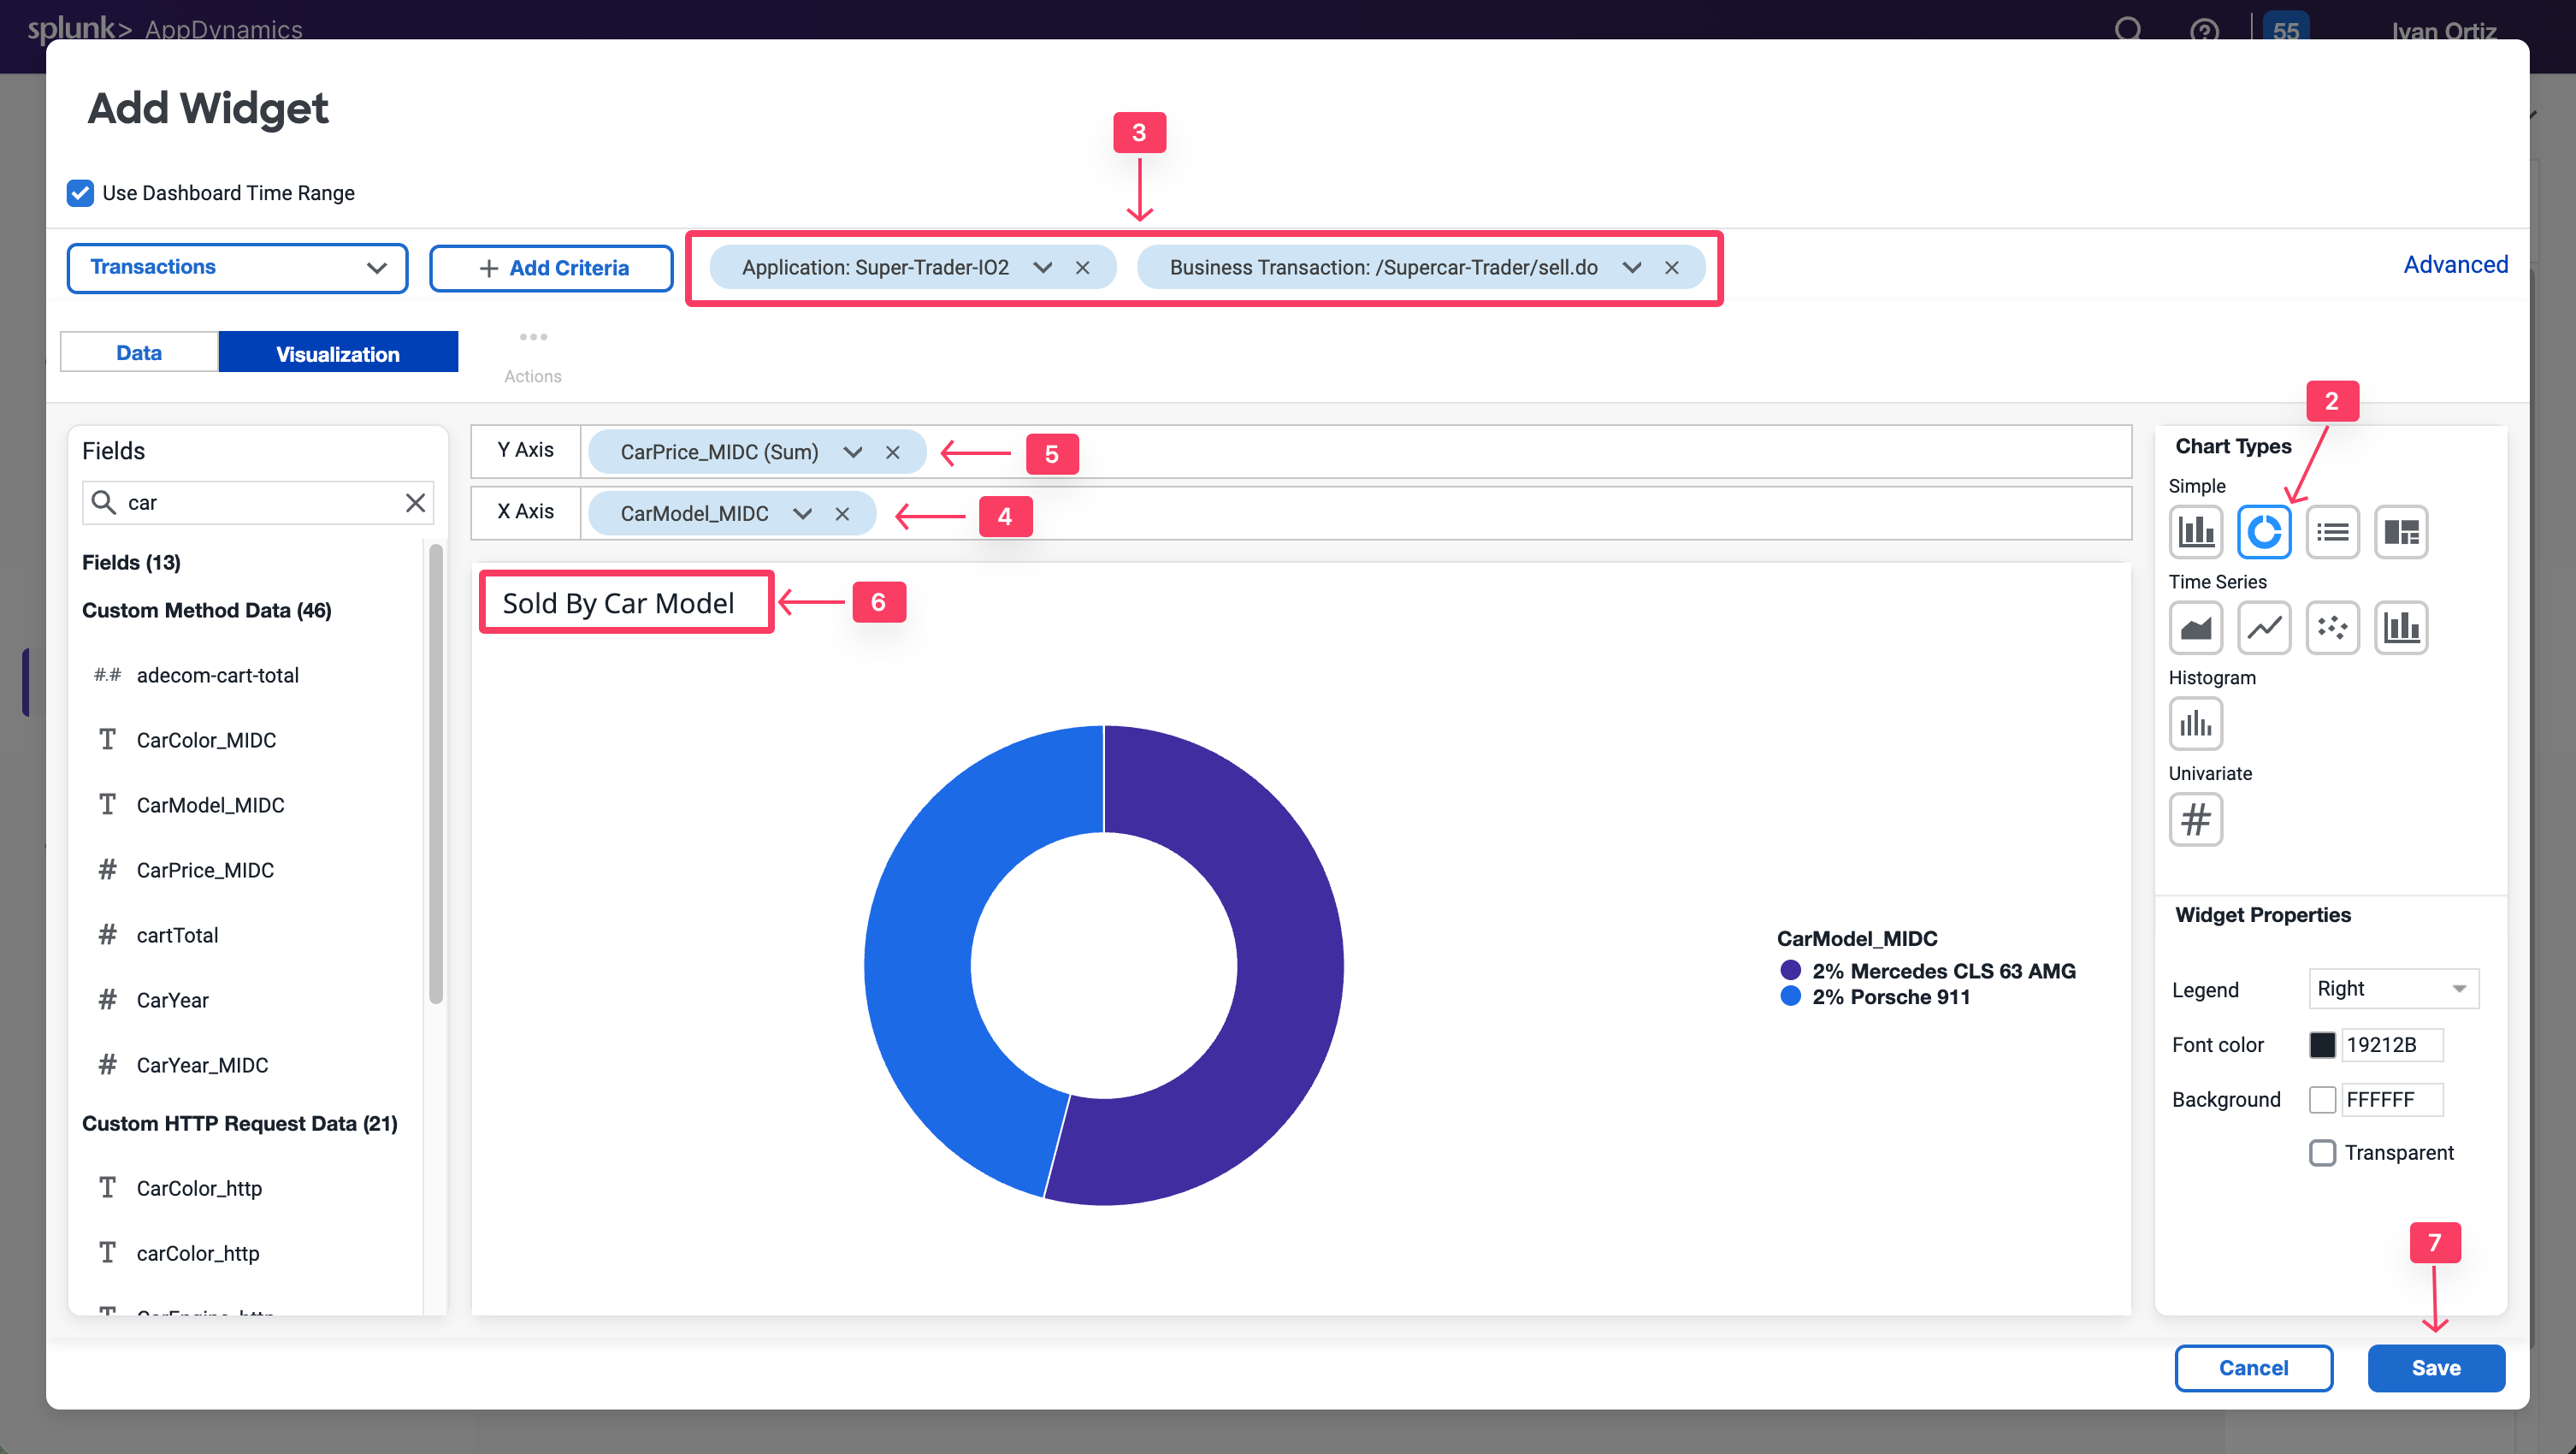
You will now create a pie chart that shows all the car models reported by the sellCar transaction and the sum of prices per model. This will show the most highly-demanded model in the application.
Create a new Widget
Select the Pie chart type.
Add the following filters: Application = Supercar-Trader-YOURINITIALS and Business Transaction = /Supercar-Trader/sell.do.
Add CarModel_MIDC in the X-Axis
Add CarPrice_MIDC in the Y-Axis. Note that SUM is the aggregation used to capture the total price per model.
Add a Title Sold by Car Model
Click Save.
Refer to the following example for more uses of the pie chart widget.
Dashboard components: Conversion funnels
Conversion funnels help visualize the flow of users or events through a multi-step process. This enables you to better understand which steps can be optimized for more successful convergence. You can also use conversion funnels to examine the IT perfomance of every step, to understand how they impact the user experience and identify the cause of user drop-offs.
Note that the funnel is filtered according to the users who executed this path in that specific order, not the total visits per step.
The first step of funnel creation is to select a unique identifier of the transaction that can represent each user navigation through the funnel. Usually, the Session ID is the best choice, since it persists through each step in the funnel.
A Session ID can be captured from the transactions. You’ll need a SessionId data collector to use it as a counter for the Funnel transactions.
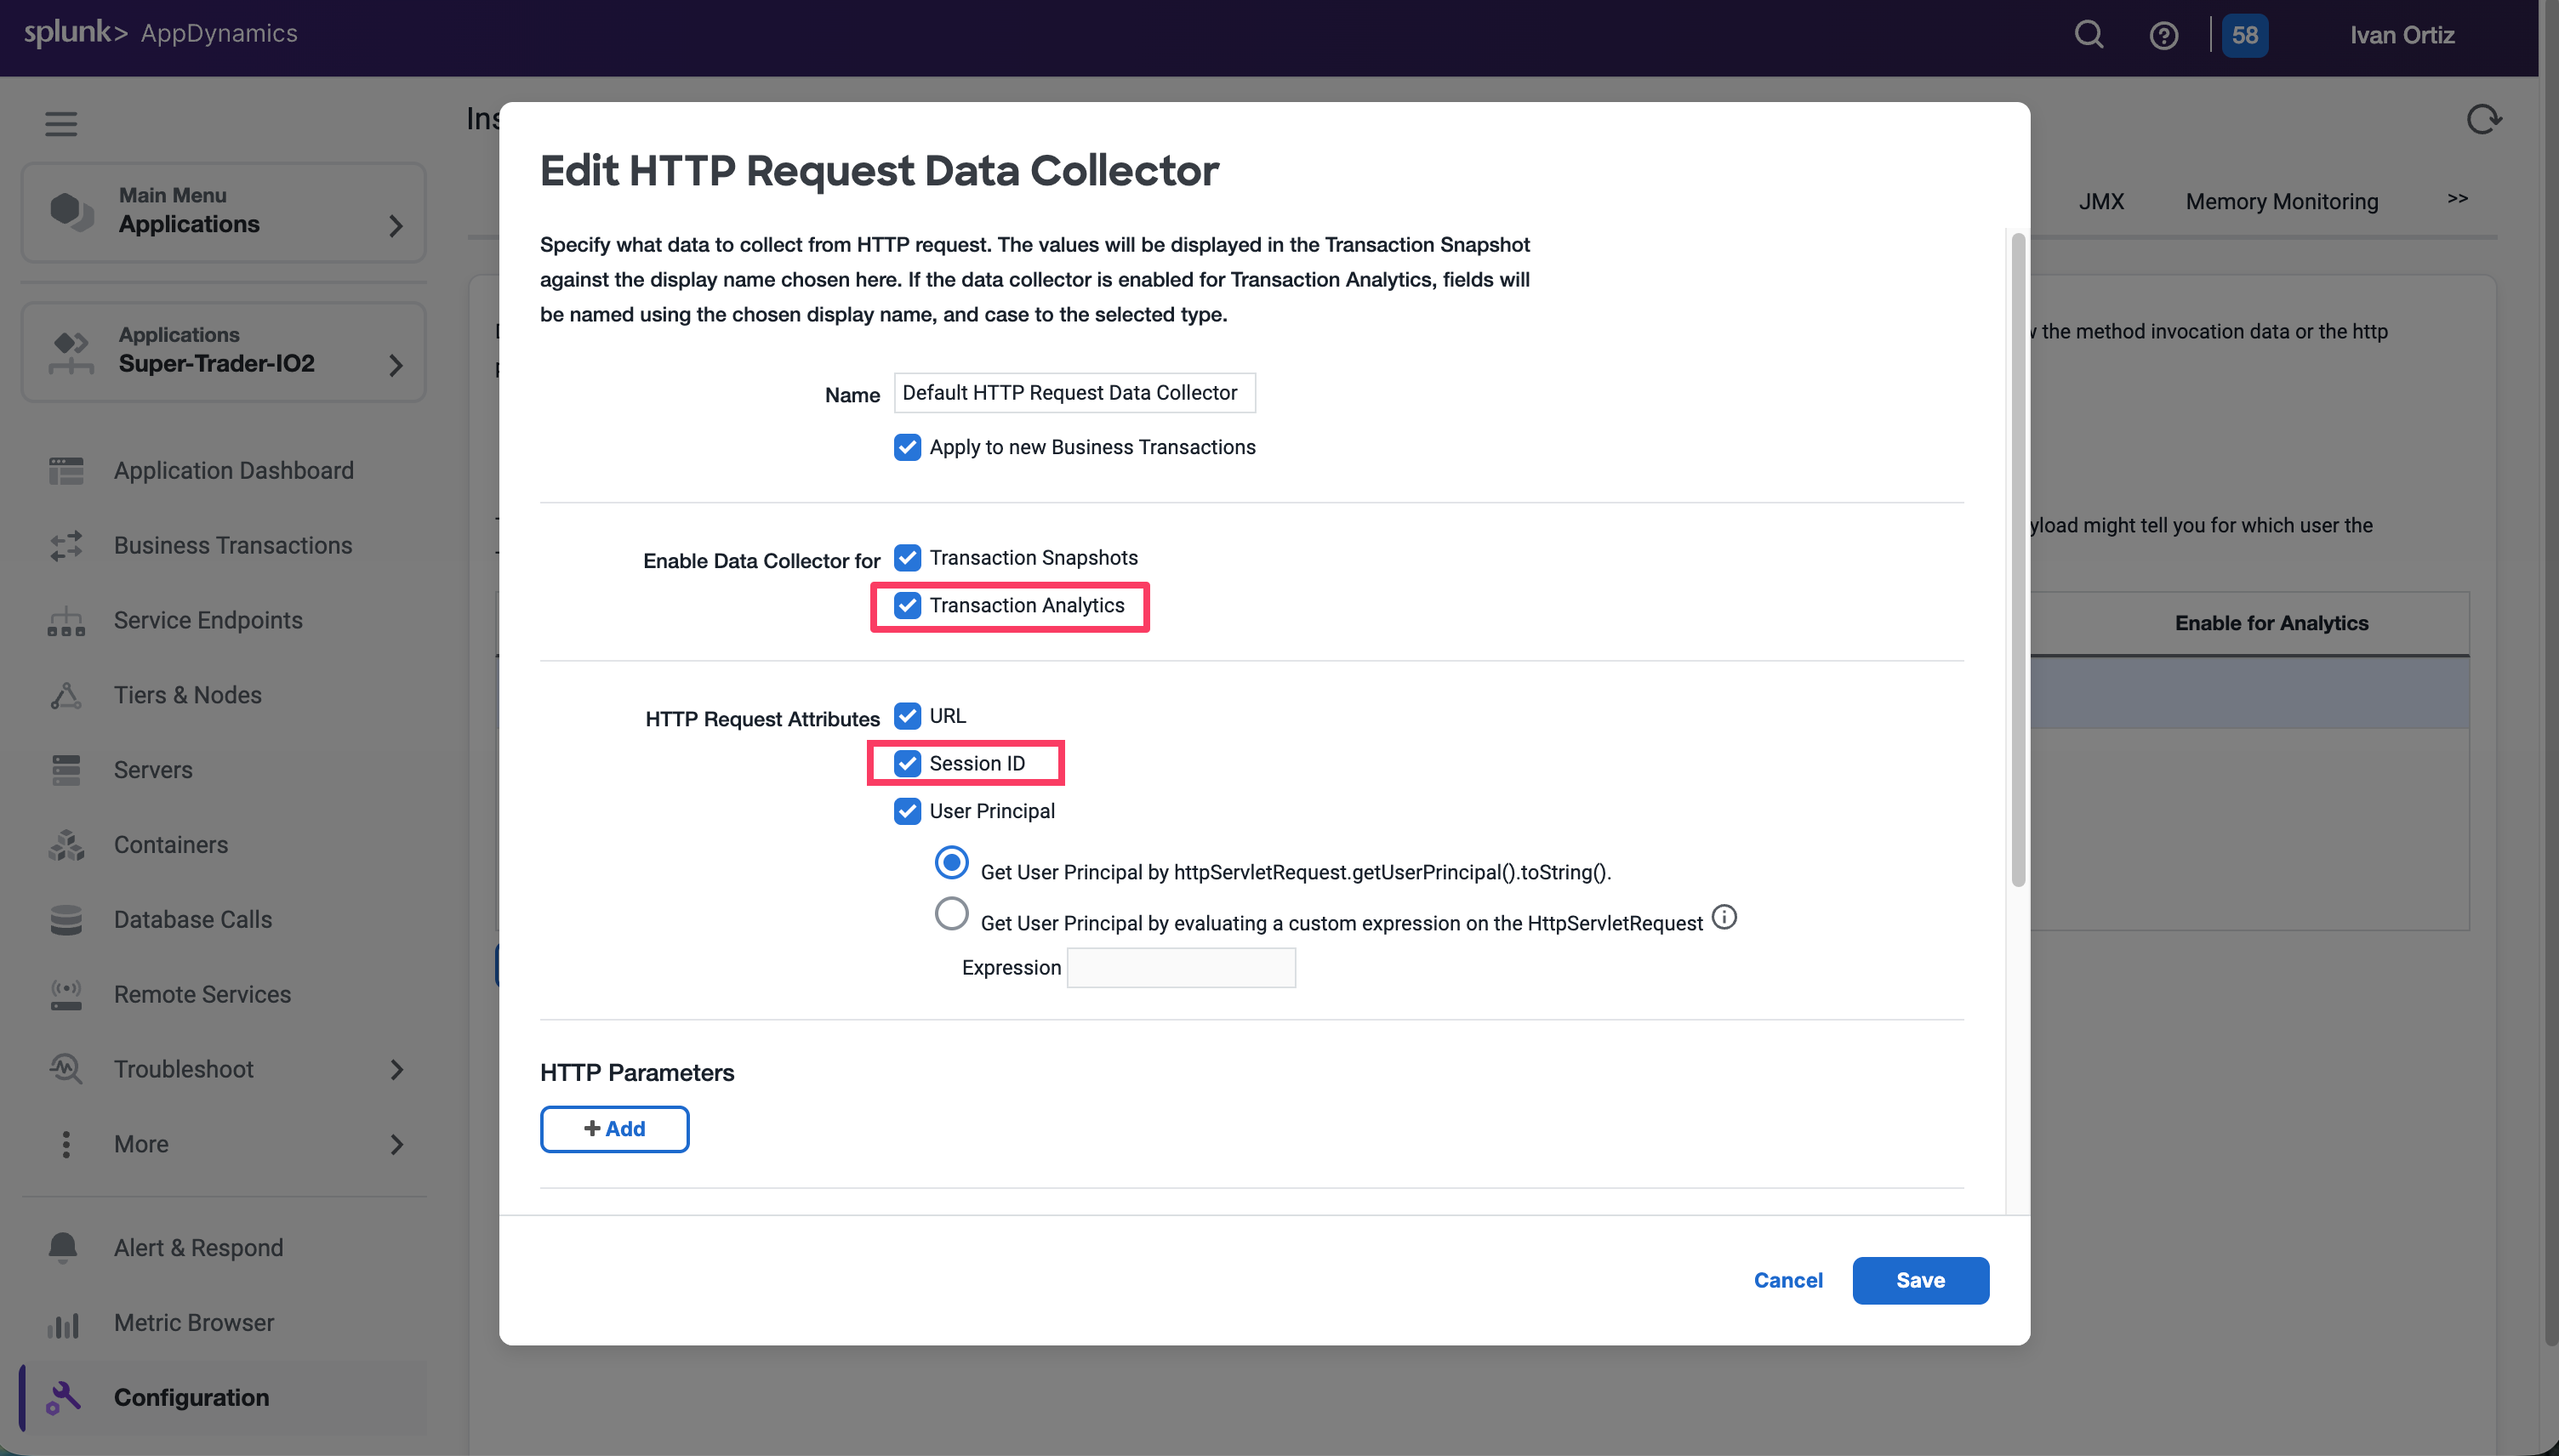
For Java applications, AppDynamics has the capability to Session IDs in the default HTTP data collector. You’ll ensure that it is enabled and apply it to all business transactions to capture the Session ID for every transaction.
Select the Applications tab.
Select Supercar-Trader-YOURINITIALS Application.
Select the Configuration Left tab.
Click Instrumentation.
Select the Data Collectors tab.
Edit the Default HTTP Request Request Data Collectors.
Select Transaction Analytics.
Verify that SessionID is selected.
Click Save.
Now apply some load by navigating multiple times from the /Supercar-Trader/home.do page. Then, directly navigate to /Supercar-Trader/sell.do page on the application.
Now Return to your Dashboard to create the funnel widget.
Toggle the Edit slider.
Click Add Widget.
Select the Analytics tab.
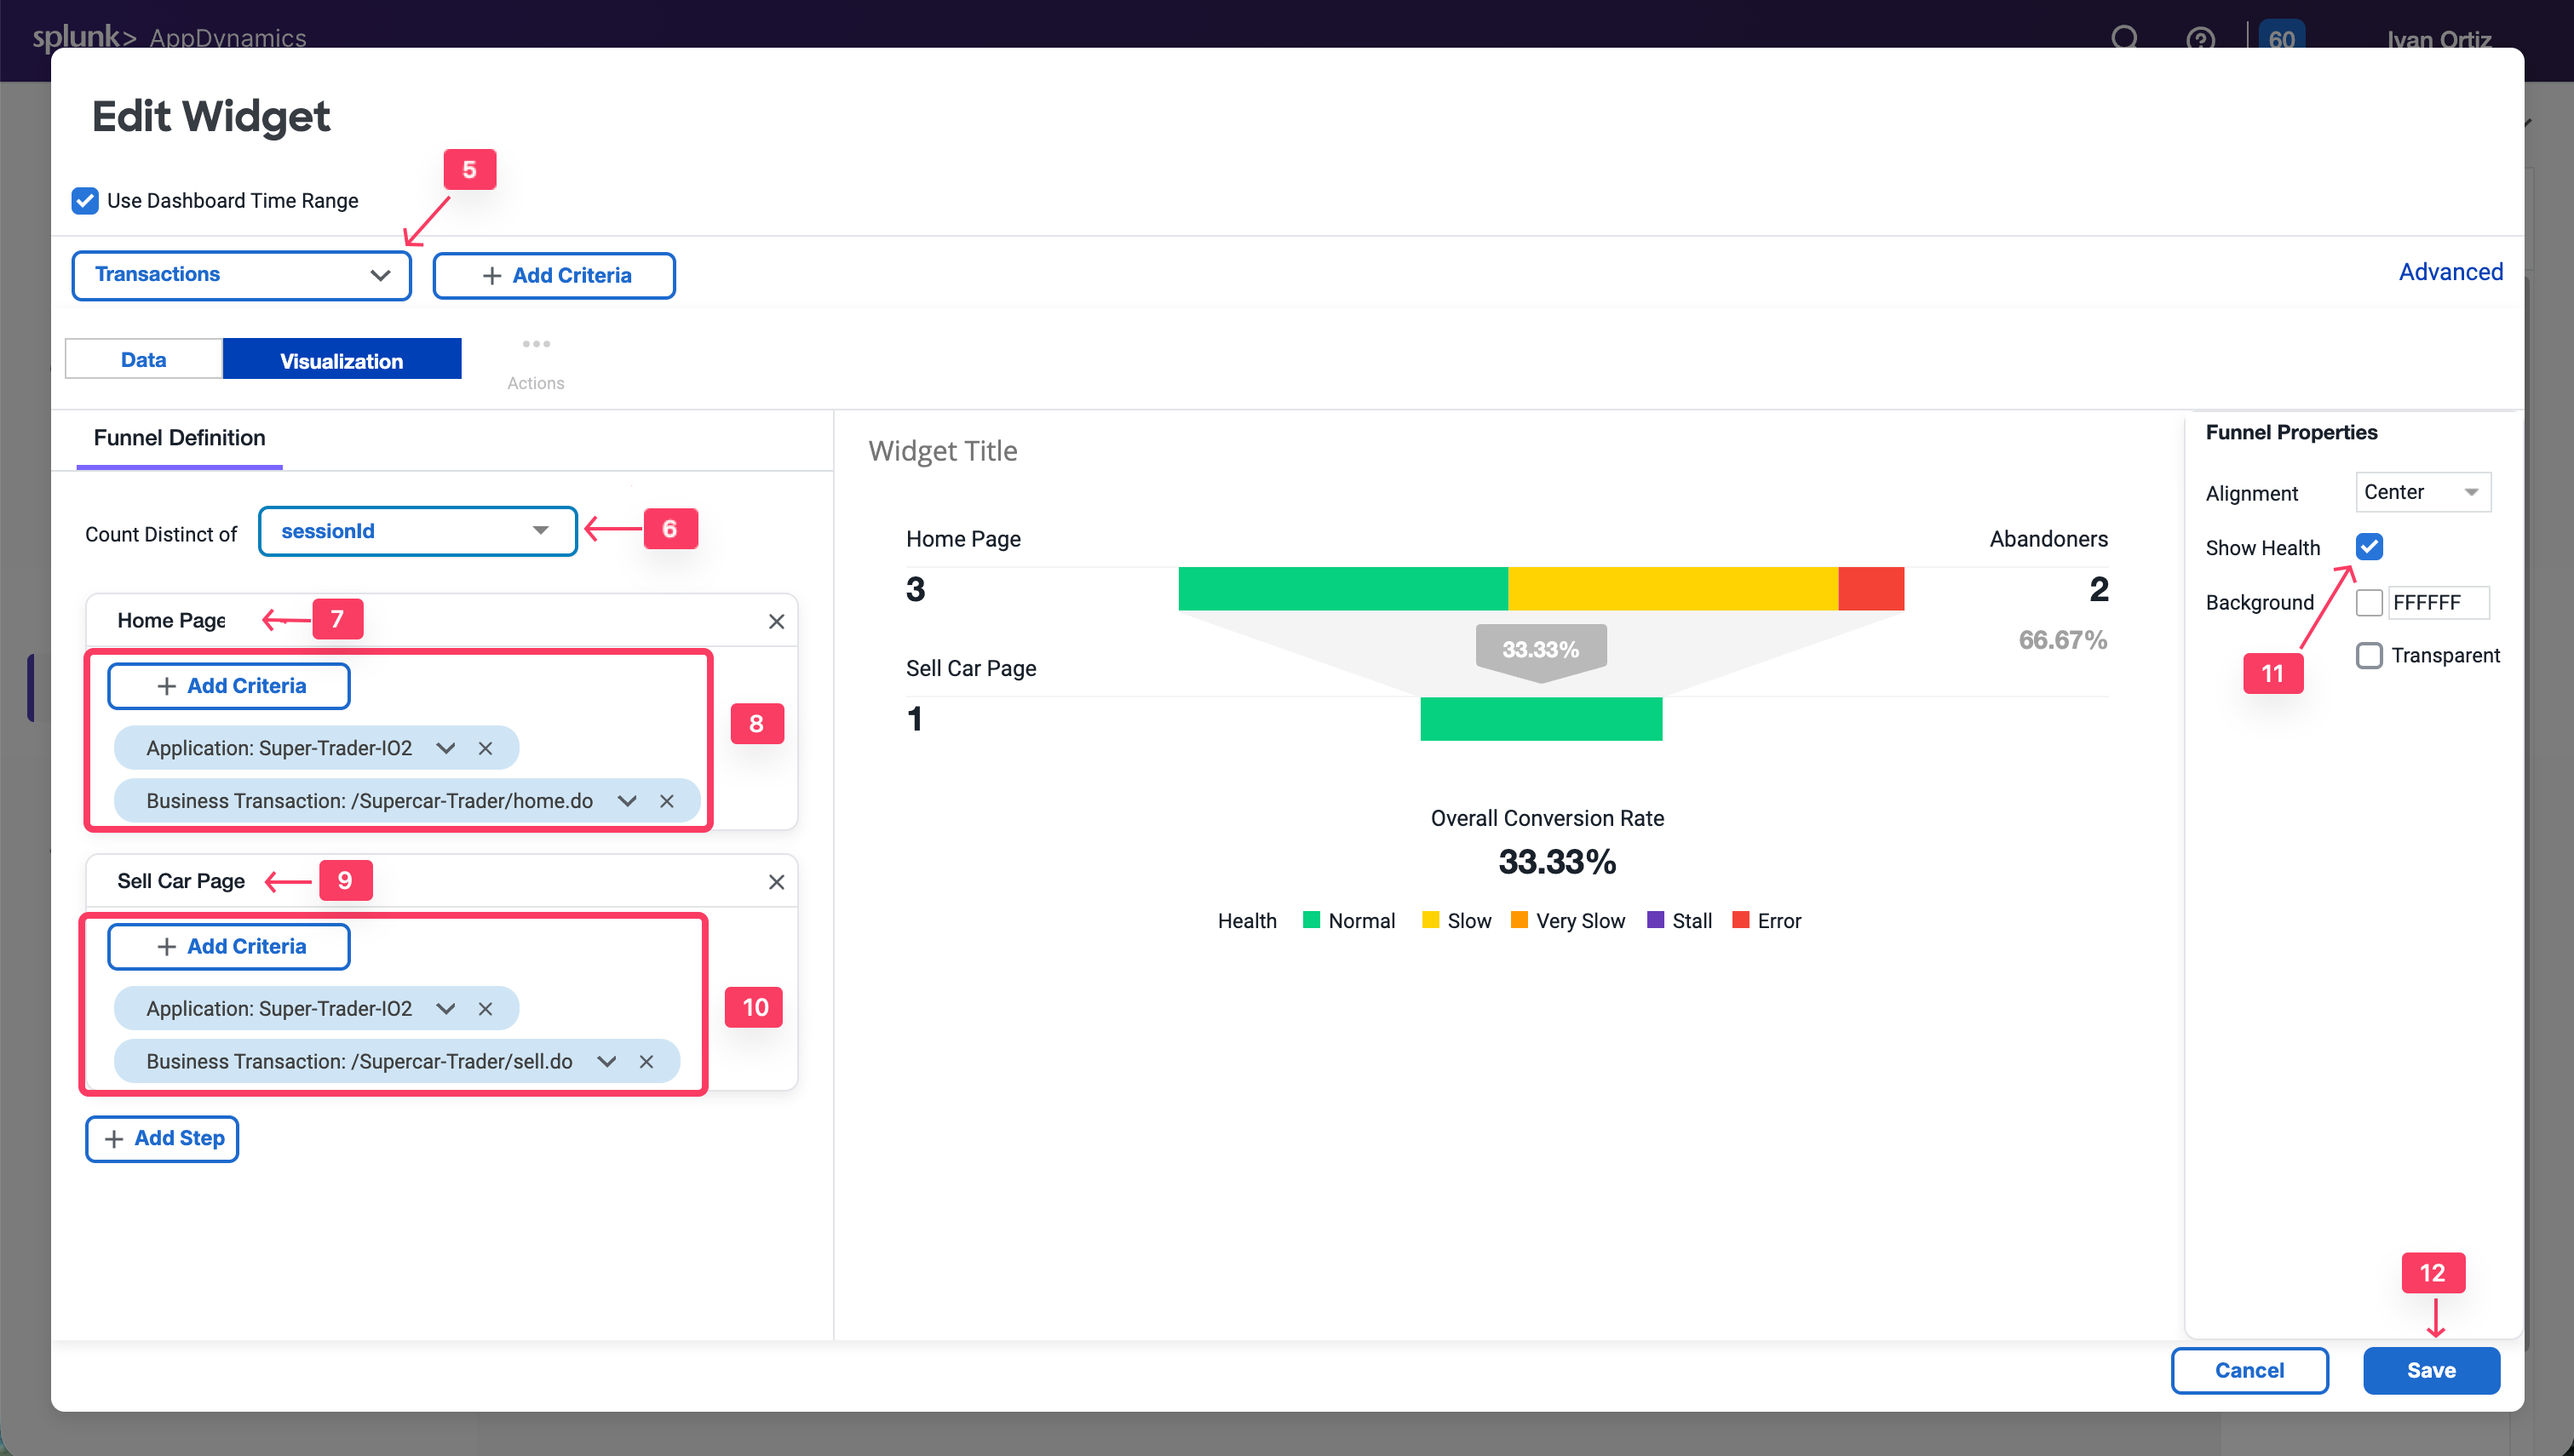
Click Funnel Analysis.
Select Transactions from the drop-down list.
Under Count Distinct of, select uniqueSessionId from the drop-down list.
Click Add Step. Name it Home Page.
Click on Add Criteria. Add the following criteria: Application: Supercar-Trader-YOURINITIALS & Business Transactions: /Supercar-Trader/home.do.
Click Add Step. Name it SellCar Page.
Click on Add Criteria. Add the following criteria: Application: Supercar-Trader-YOURINITIALS & Business Transactions: /Supercar-Trader/sell.do.
Select the Show Health Checkbox on the right panel to visualize the transaction health in the flow map.
Click Save
Build Your Dashboard
20 minutes
Exercise - Build Your Own Dashboard
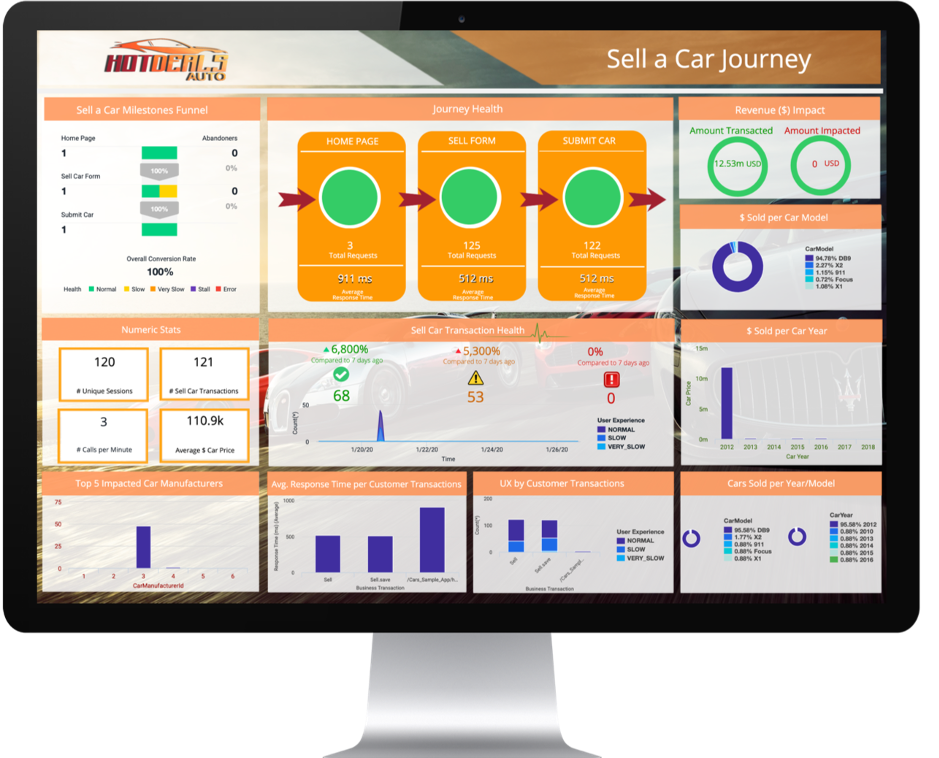
To conclude this Learning Lab, use the business data that was captured in the earlier exercise using method invocation data collectors and your understanding of the dashboard components to build an IT Business Impact Dashboard.
Refer to the following example and build your own dashboard, using the same data and widgets.
Congratulations! You have completed the BusinessIQ Fundamentals Learning Lab!