In this Learning Lab you learn how to use AppDynamics to monitor the health of your browser-based application.
When you have completed this lab, you will be able to:
Create a browser application in the Controller
Configure the Browser Real User Monitoring (BRUM) agent to monitor your web application’s health.
Troubleshoot performance issues and find the root cause, whether it occurs on the browser side or the server side of the transaction.
Workshop Environment
The workshop environment has two hosts:
The first host runs the AppDynamics Controller and will be referred to from this point on as the Controller.
The second host runs the Supercar Trader application used in the labs. It will be the host where you will install the AppDynamics agents and will be referred to from this point on as the Application VM.
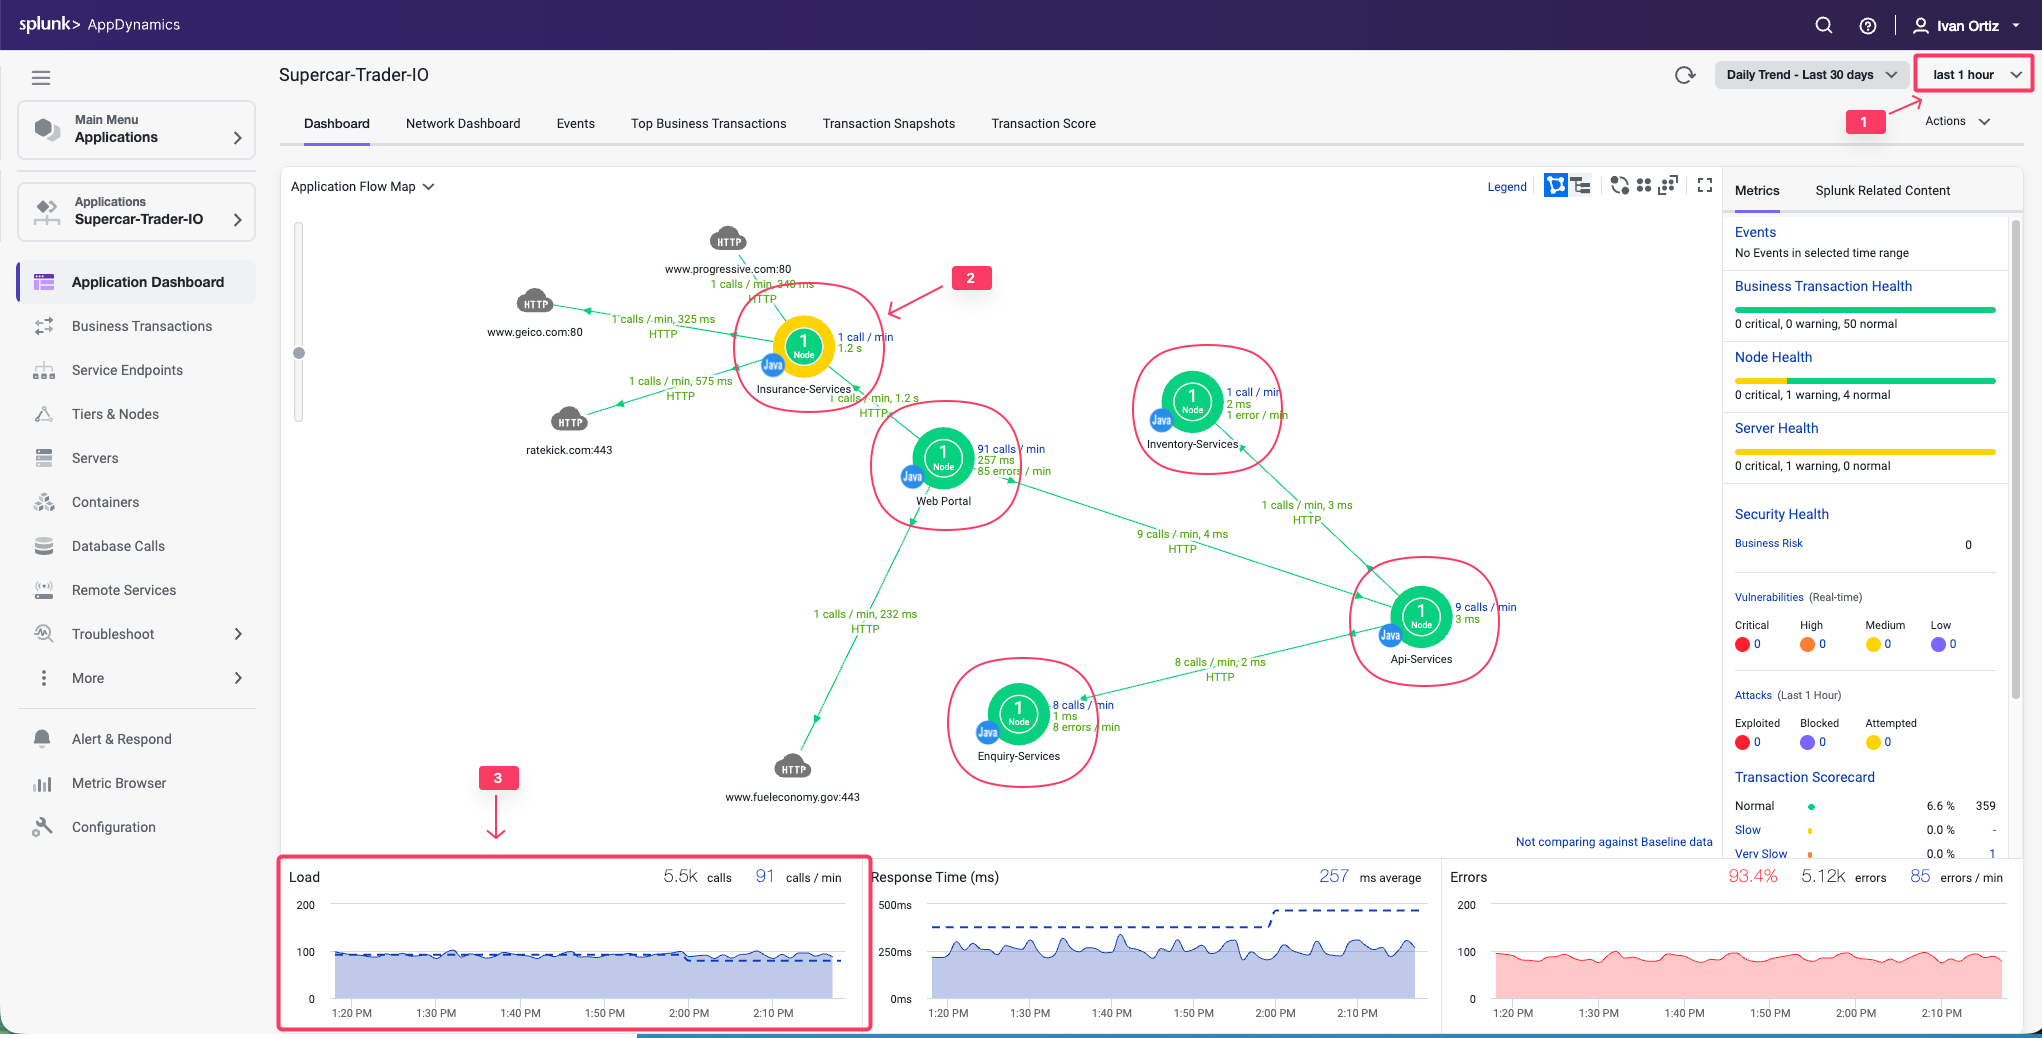
Verify you see the five different Tiers on the flow map.
Verify there has been consistent load over the last 1 hour.
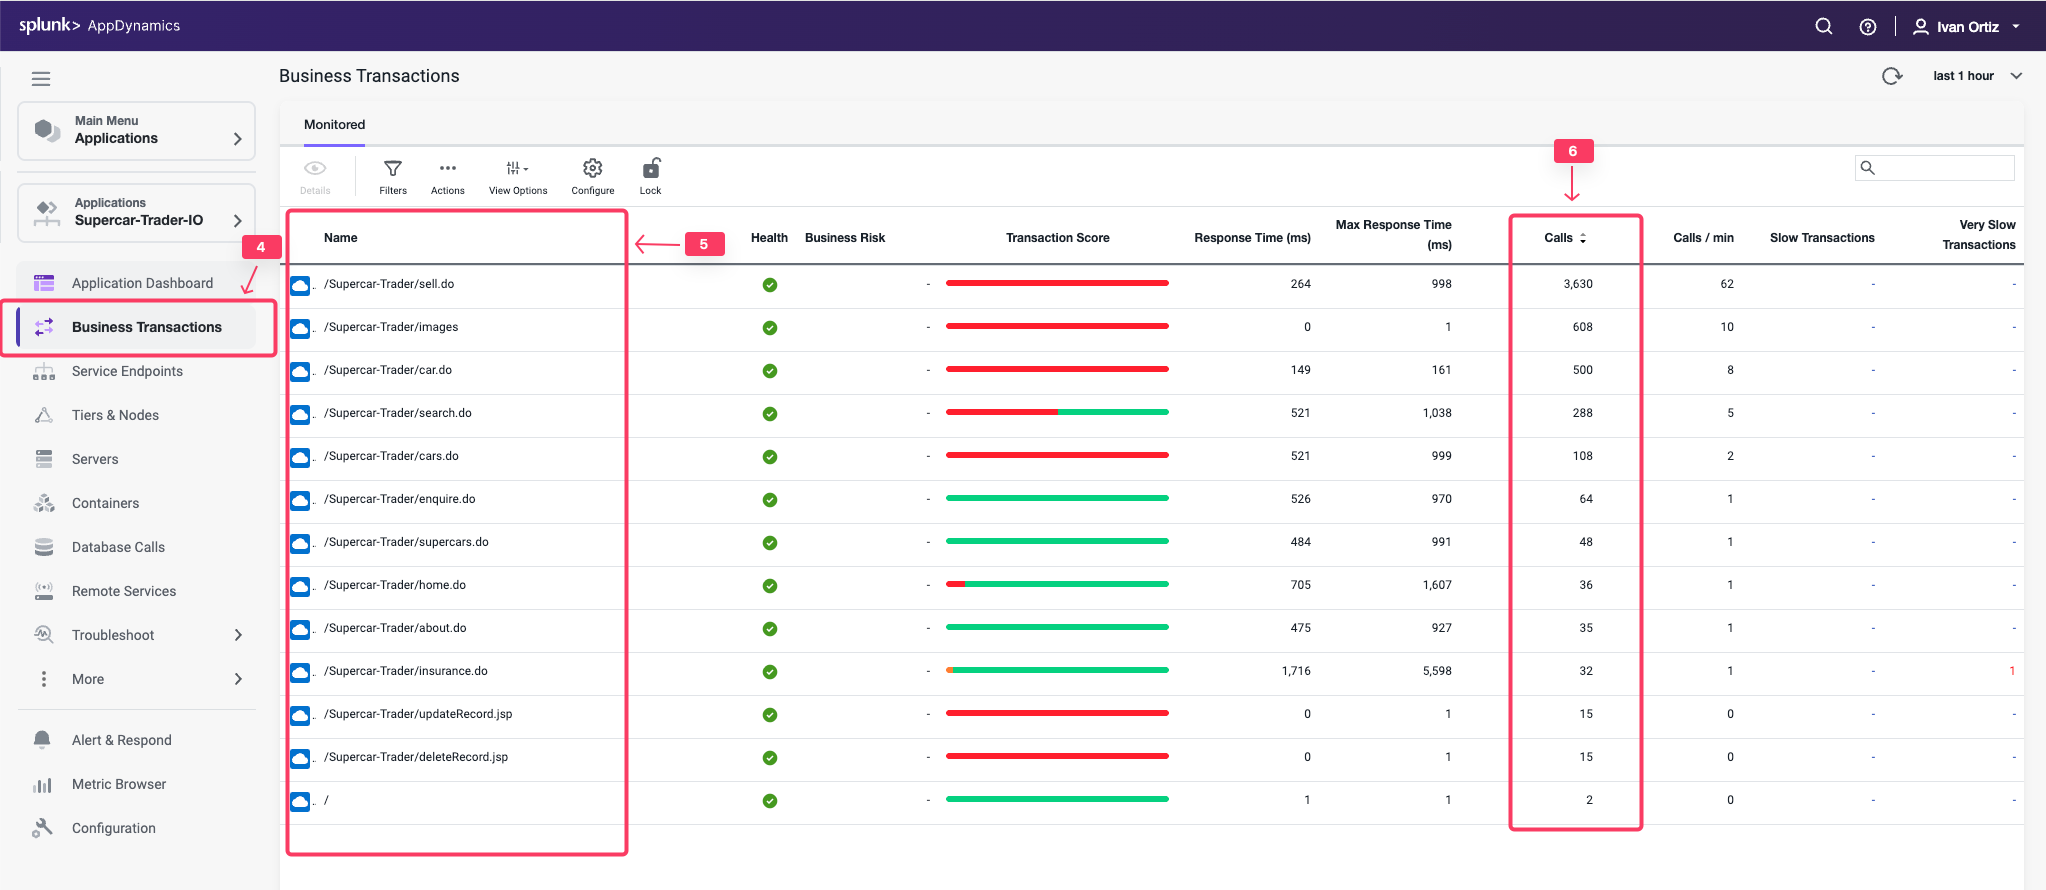
Check the list of business transactions:
Click the Business Transactions option on the left menu.
Verify you see the eleven business transactions seen below.
Verify that they have some number of calls during the last hour.
Note: If you don’t see the Calls column, you can click the View Options toolbar button to show that column.
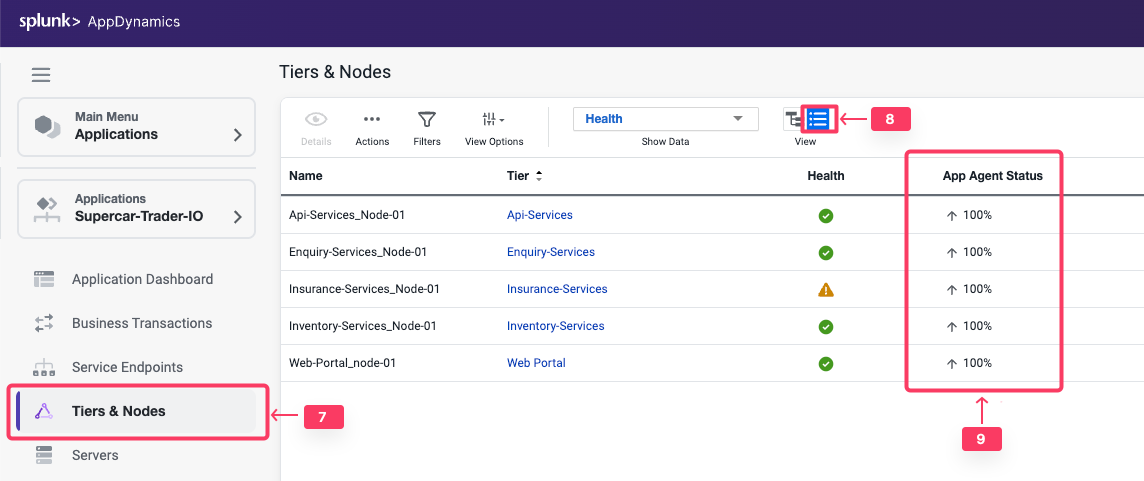
Check the agent status for the Nodes:
Click the Tiers & Nodes option on the left menu.
Click Grid View.
Verify that the App Agent Status for each Node is greater than 90% during the last hour.
Restart the Application and Load Generation if Needed
If any of the checks you performed in the previous steps could not be verified, SSH into your Application VM and follow these steps to restart the application and transaction load.
Use the following commands to stop the running instance of Apache Tomcat.
cd /usr/local/apache/apache-tomcat-9/bin
./shutdown.sh
Use the command below to check for remaining application JVMs still running.
ps -ef | grep Supercar-Trader
If you find any remaining application JVMs still running, kill the remaining JVMs using the command below.
sudo pkill -f Supercar-Trader
Use the following commands to stop the load generation for the application. Wait until all processes are stopped.
cd /opt/appdynamics/lab-artifacts/phantomjs
./stop_load.sh
Restart the Tomcat server:
cd /usr/local/apache/apache-tomcat-9/bin
./startup.sh
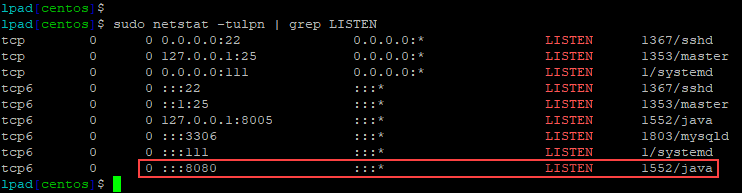
Wait for two minutes and use the following command to ensure Apache Tomcat is running on port 8080.
sudo netstat -tulpn | grep LISTEN
You should see output similar to the following image showing that port 8080 is in use by Apache Tomcat.
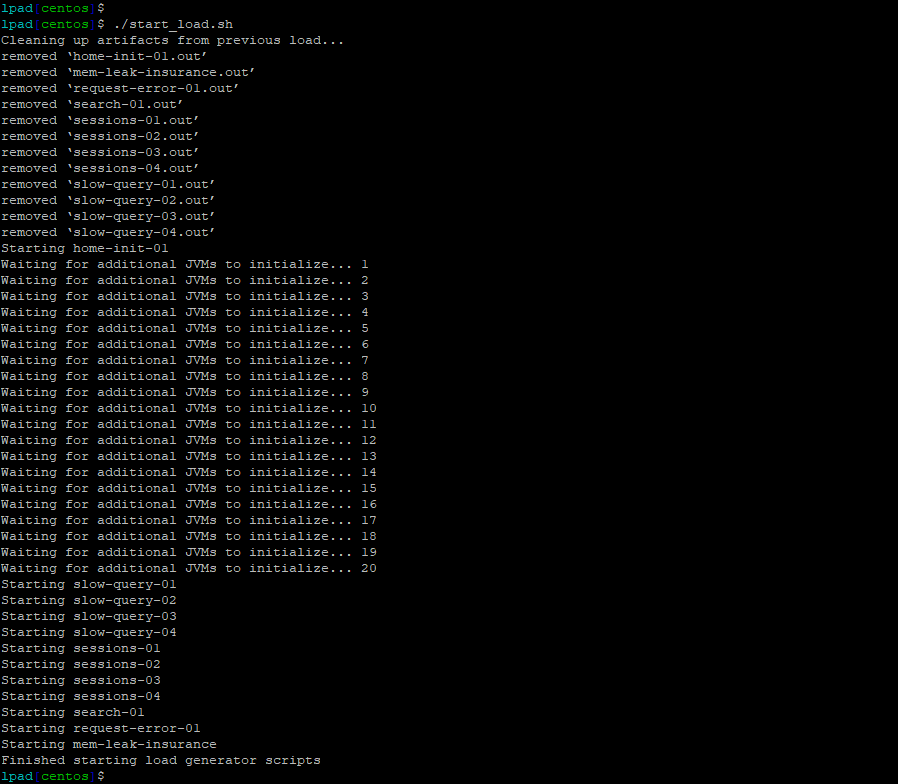
Use the following commands to start the load generation for the application.
cd /opt/appdynamics/lab-artifacts/phantomjs
./start_load.sh
You should see output similar to the following image.
Create Browser Application
2 minutes
In this exercise you will complete the following tasks:
Access your AppDynamics Controller from your web browser.
Use the following steps to create your new browser application.
Note
It is very important that you create a unique name for your browser application in Step 5 below.
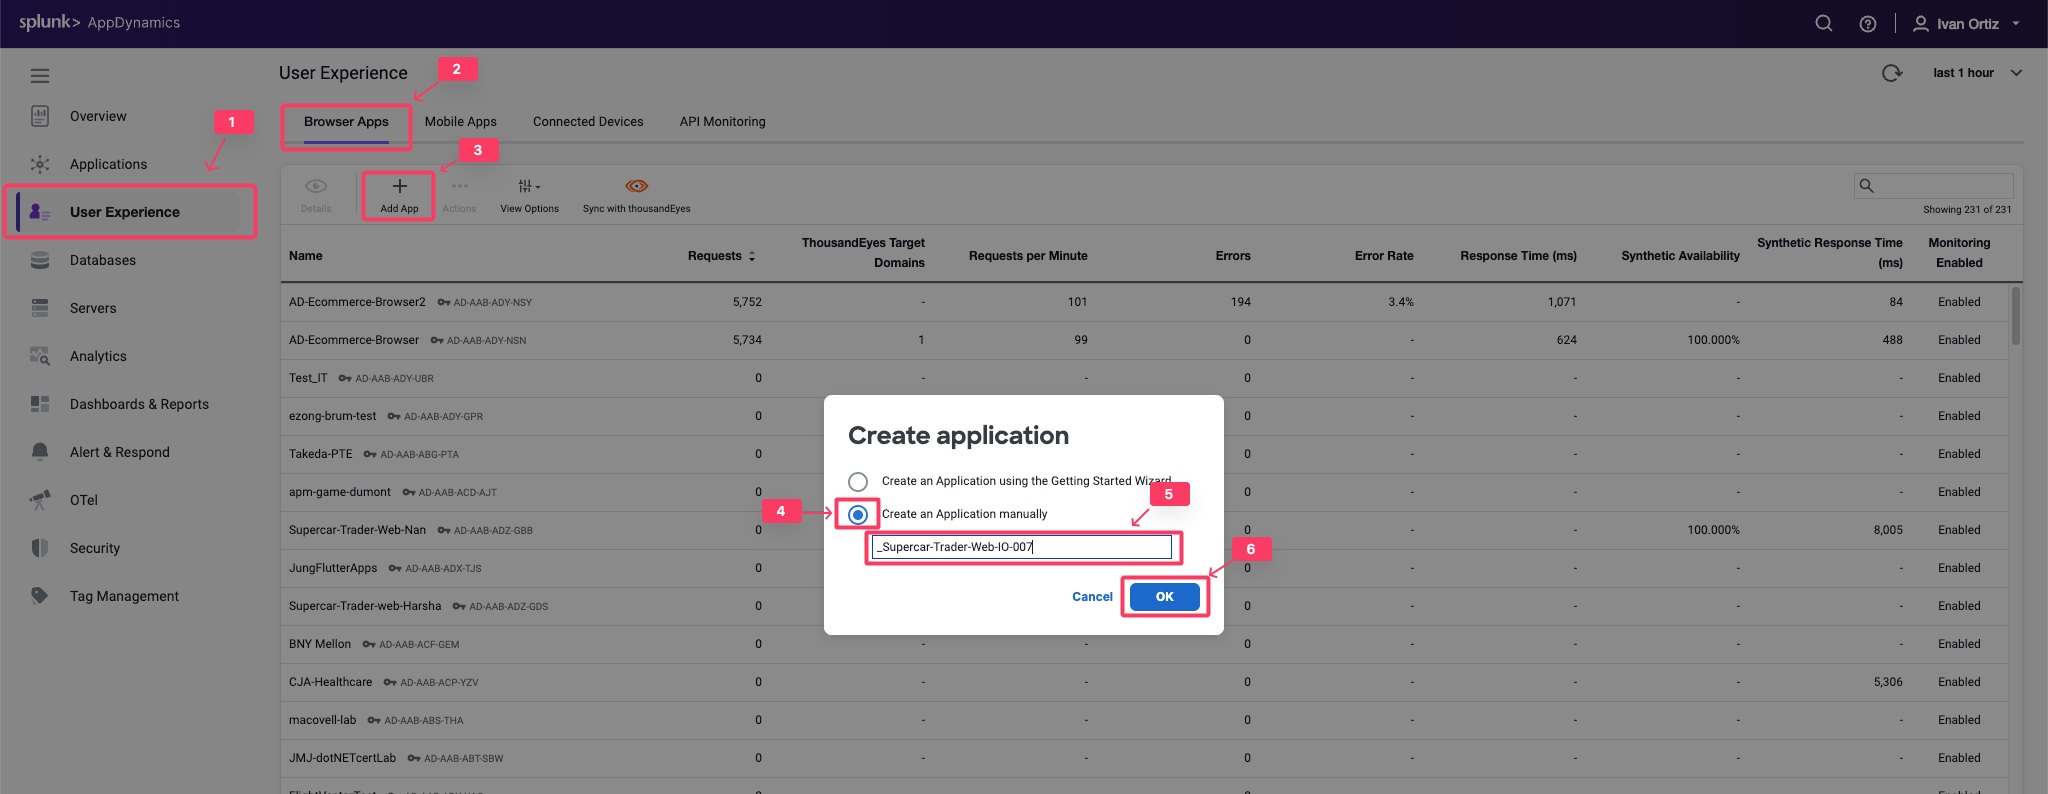
Click the User Experience tab on the top menu.
Click the Browser Apps option under User Experience.
Click Add App.
Choose the option Create an Application manually.
Type in a unique name for your browser application in the format Supercar-Trader-Web-<your_initials_or_name>-<four_random_numbers>
Example 1: Supercar-Trader-Web-JFK-3179
Example 2: Supercar-Trader-Web-JohnSmith-0953
Click OK.
You should now see the Browser App Dashboard for the Supercar-Trader-Web-##-#### application.
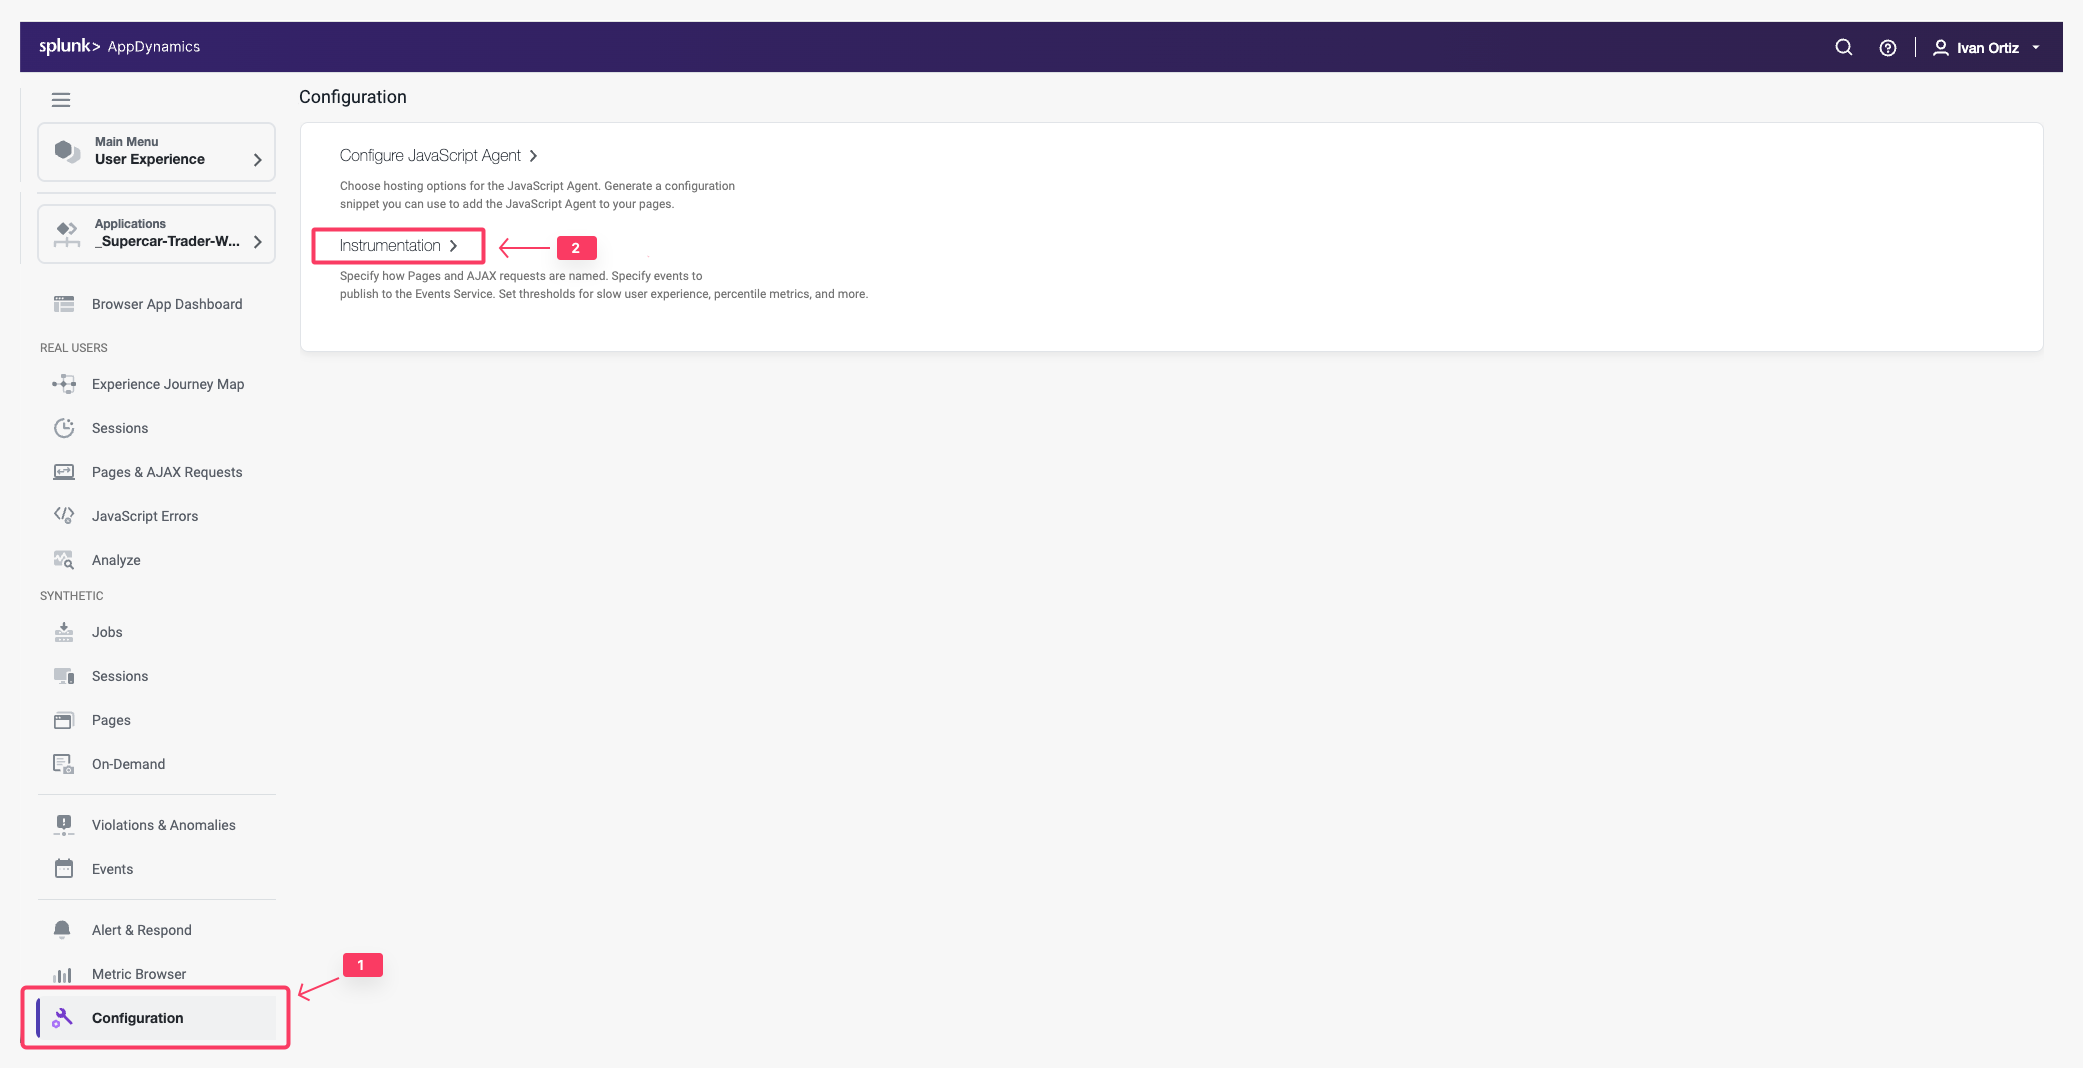
Click the Configuration tab on the left menu.
Click the Instrumentation option.
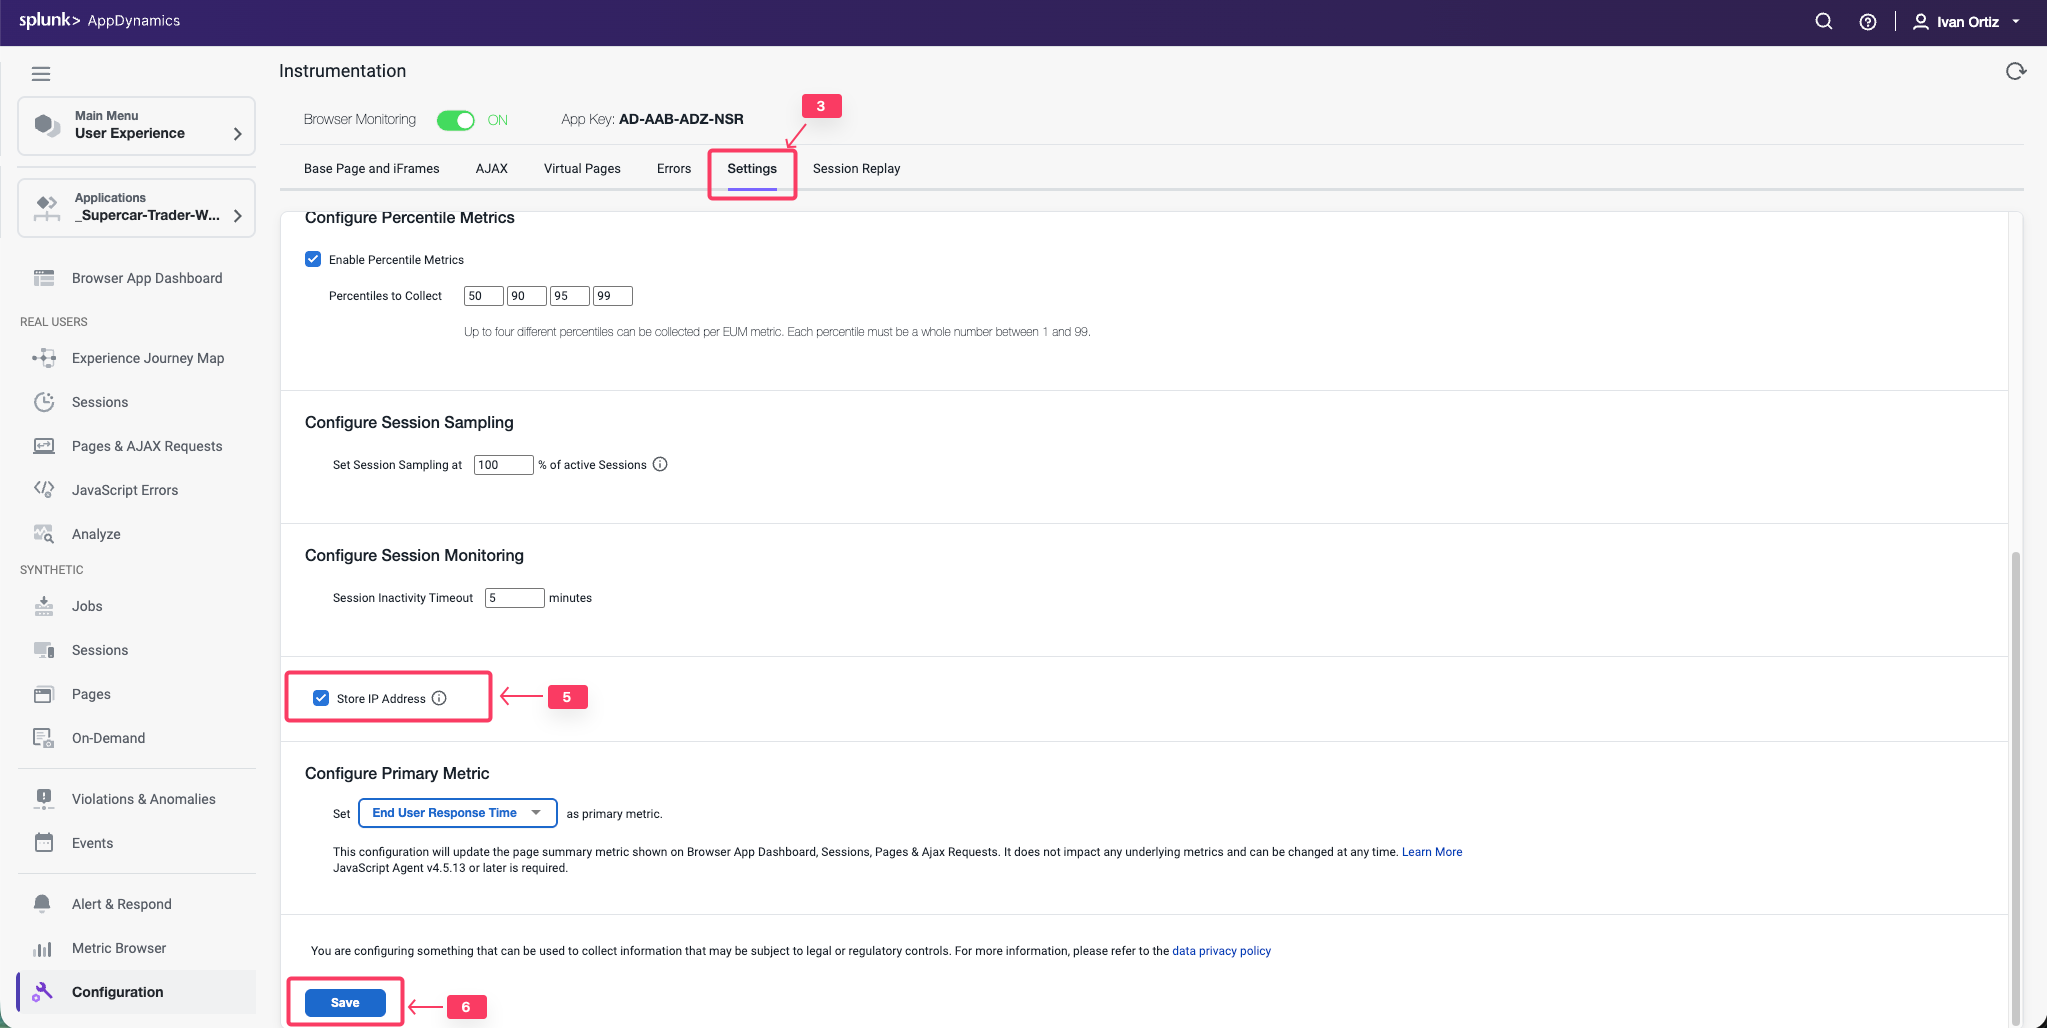
Change the default configuration to have the IP Address stored along with the data captured by the browser monitoring agent by following these steps.
Click the Settings tab.
Use the scroll bar on the right to scroll to the bottom of the screen.
Check the Store IP Address check box.
Click Save.
You can read more about configuring the Controller UI for Browser RUM here.
Configure Agent Injection
3 minutes
In this exercise you will complete the following tasks:
Enable JavaScript Agent injection.
Select Business Transactions for injection.
Enable JavaScript Agent injection
While AppDynamics supports various methods for injecting the JavaScript Agent, you will be using the Auto-Injection method in this lab. Follow these steps to enable the Auto-Injection of the JavaScipt Agent.
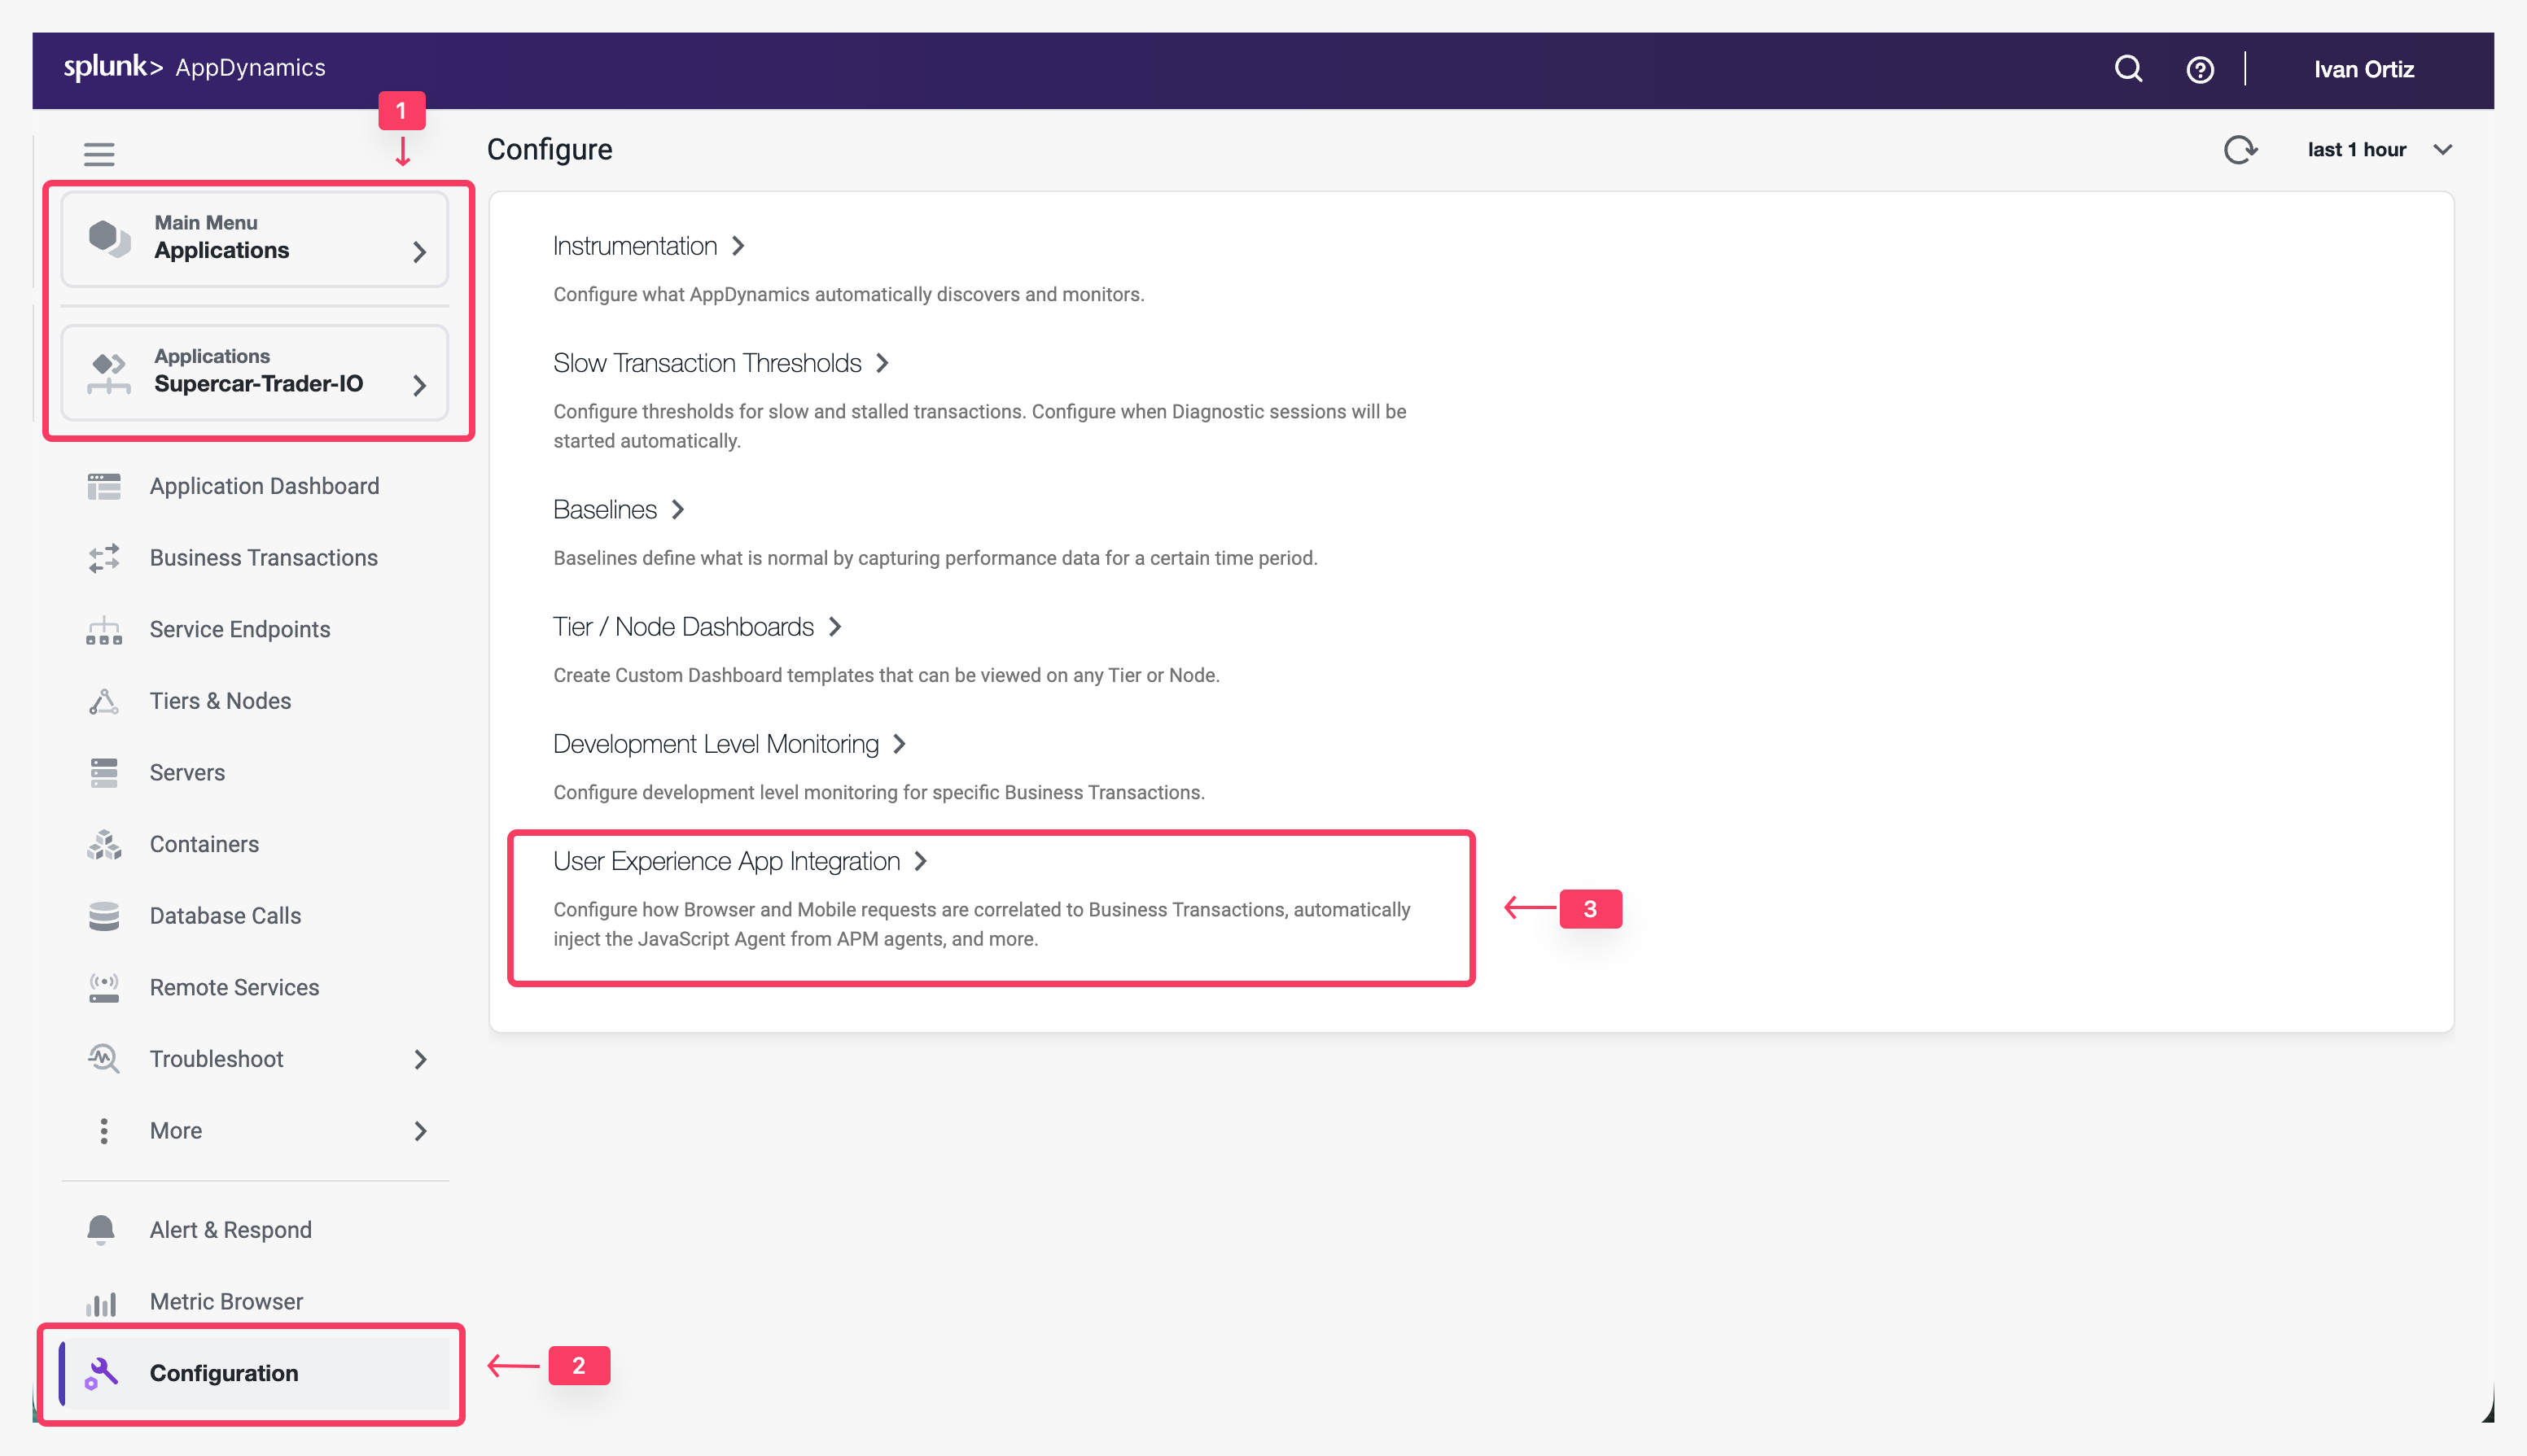
Click the Applications tab on the left menu and drill into your Supercar-Trader-## application.
Click the Configuration tab on the left menu at the bottom.
Click the User Experience App Integration option.
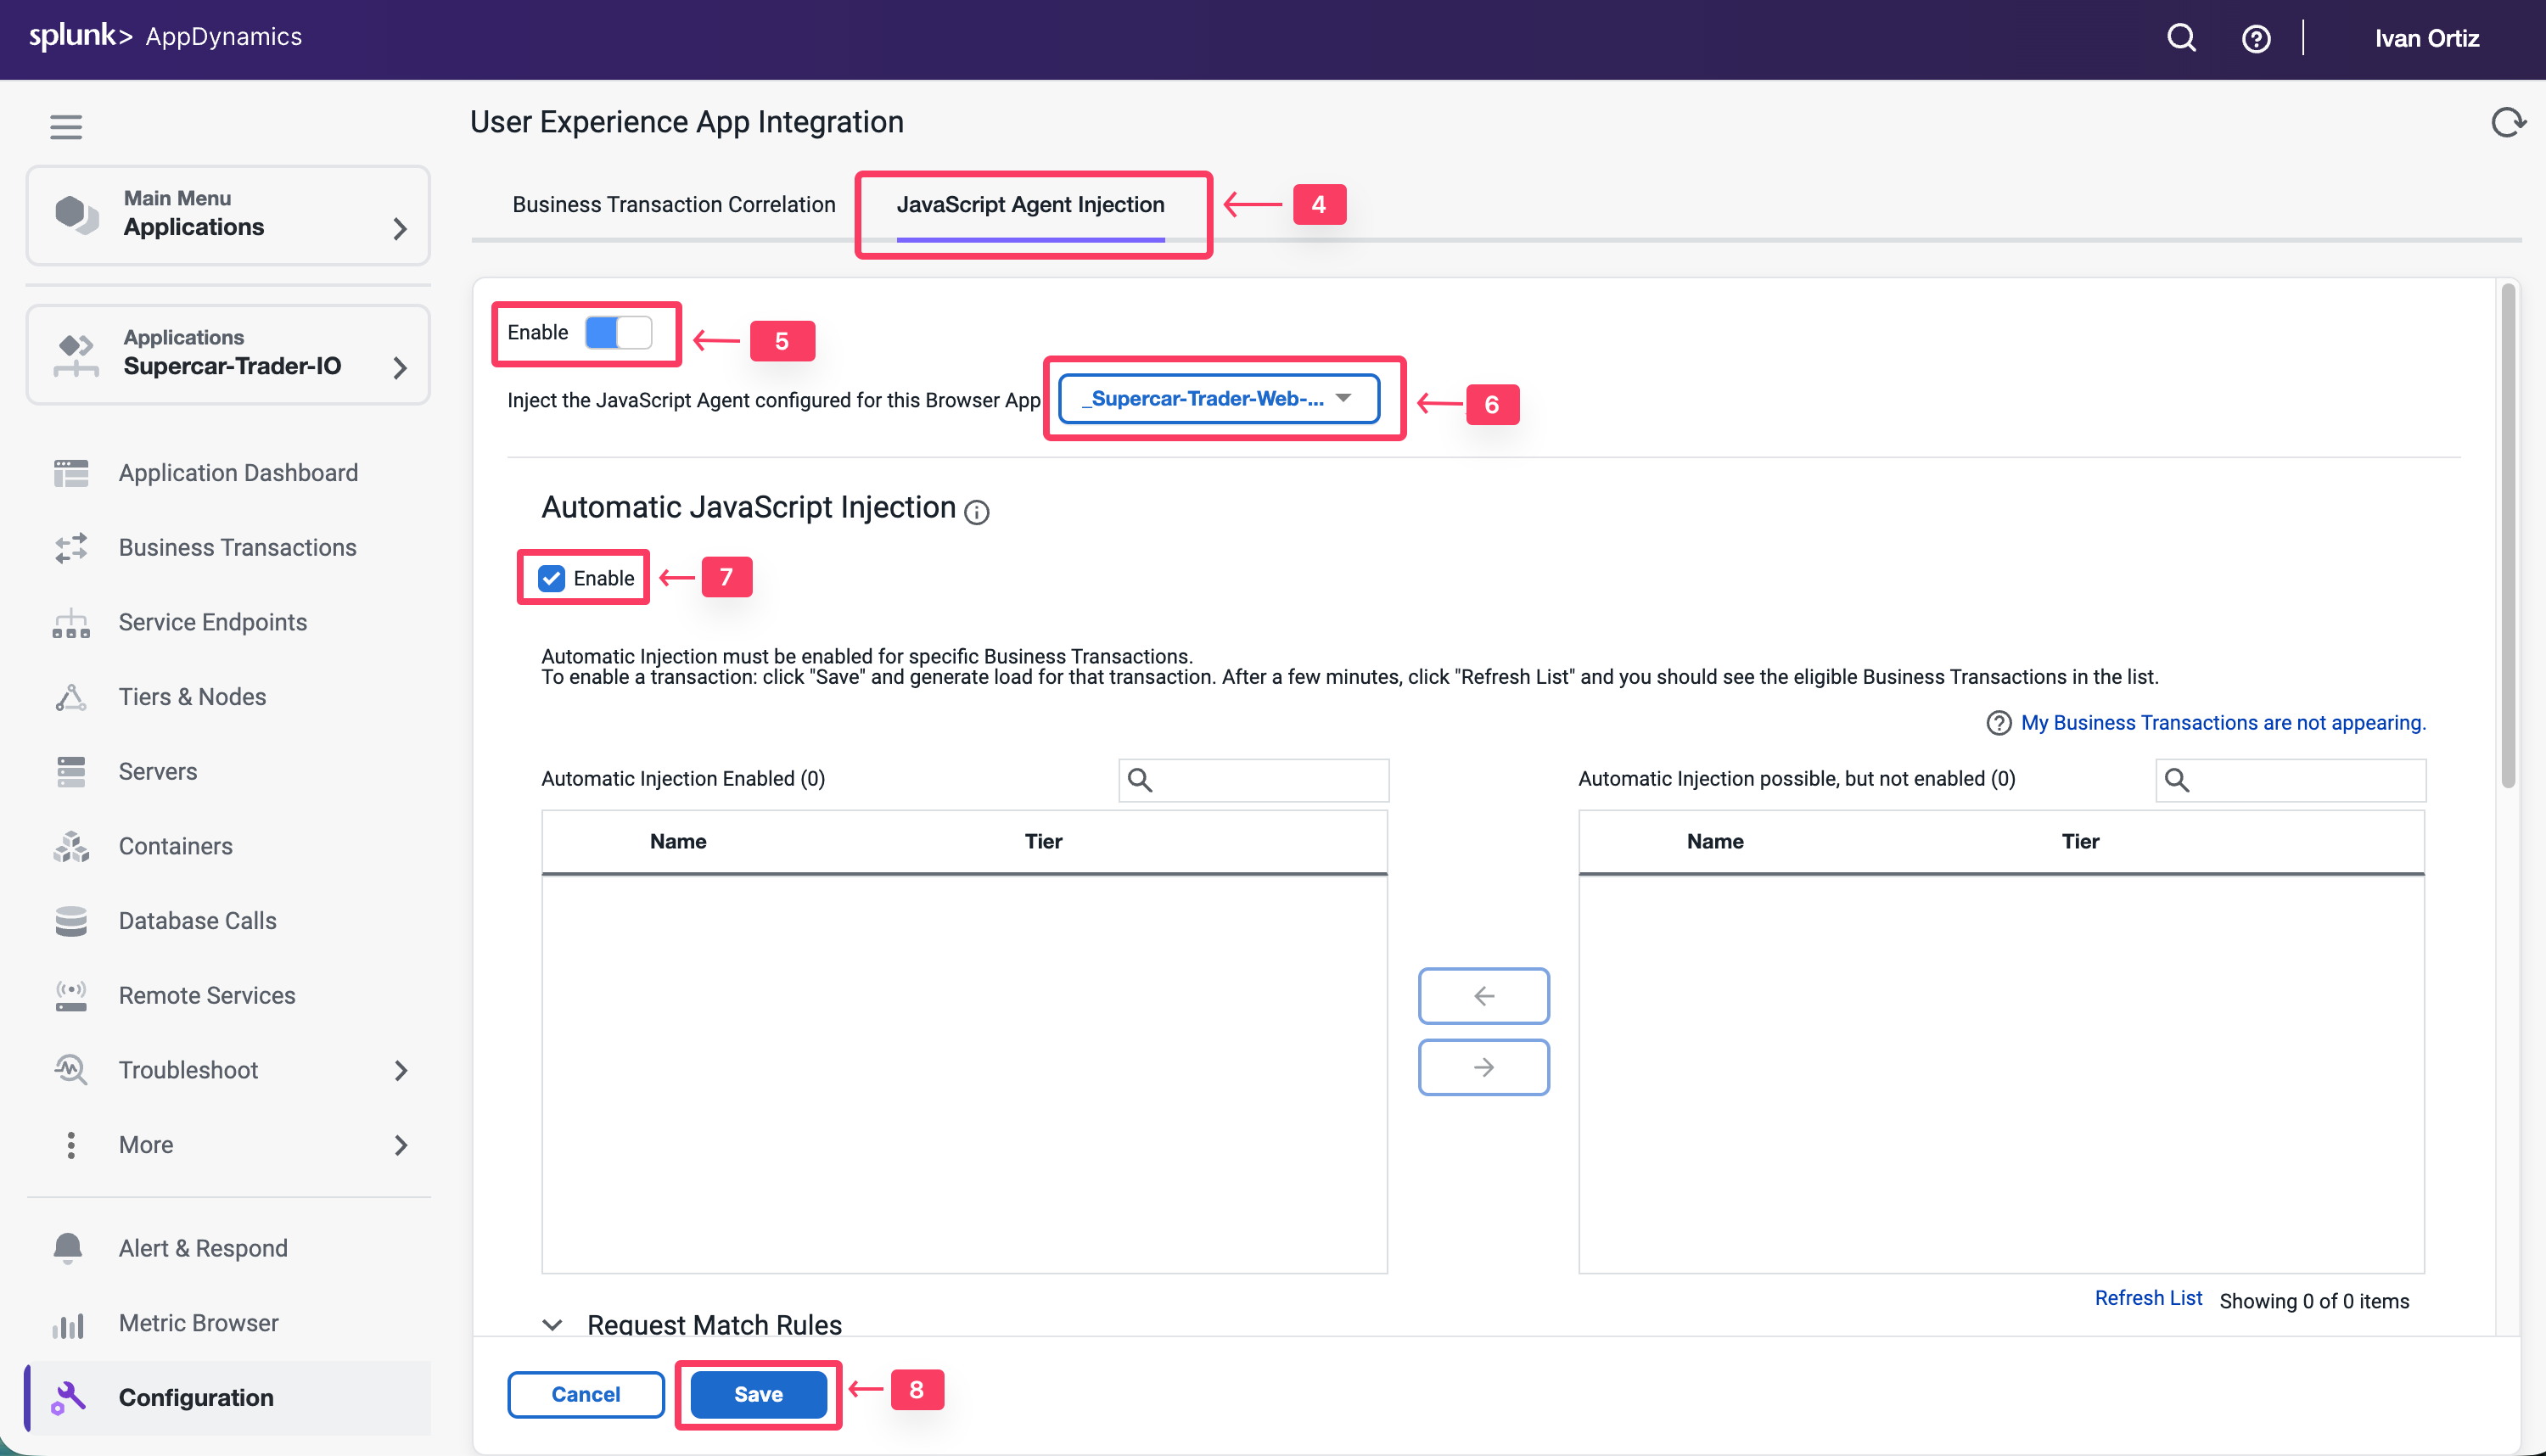
Click the JavaScript Agent Injection tab.
Click Enable so that it turns blue.
Ensure that Supercar-Trader-Web-##-#### is the selected browser app. Choose the application that you created in the previous section
Check the Enable check box under Enable JavaScript Injection
Click Save.
It takes a few minutes for the Auto-Injection to discover potential Business Transactions. While this is happening, use these steps to enable the Business Transaction Correlation. For newer APM agents this is done automatically
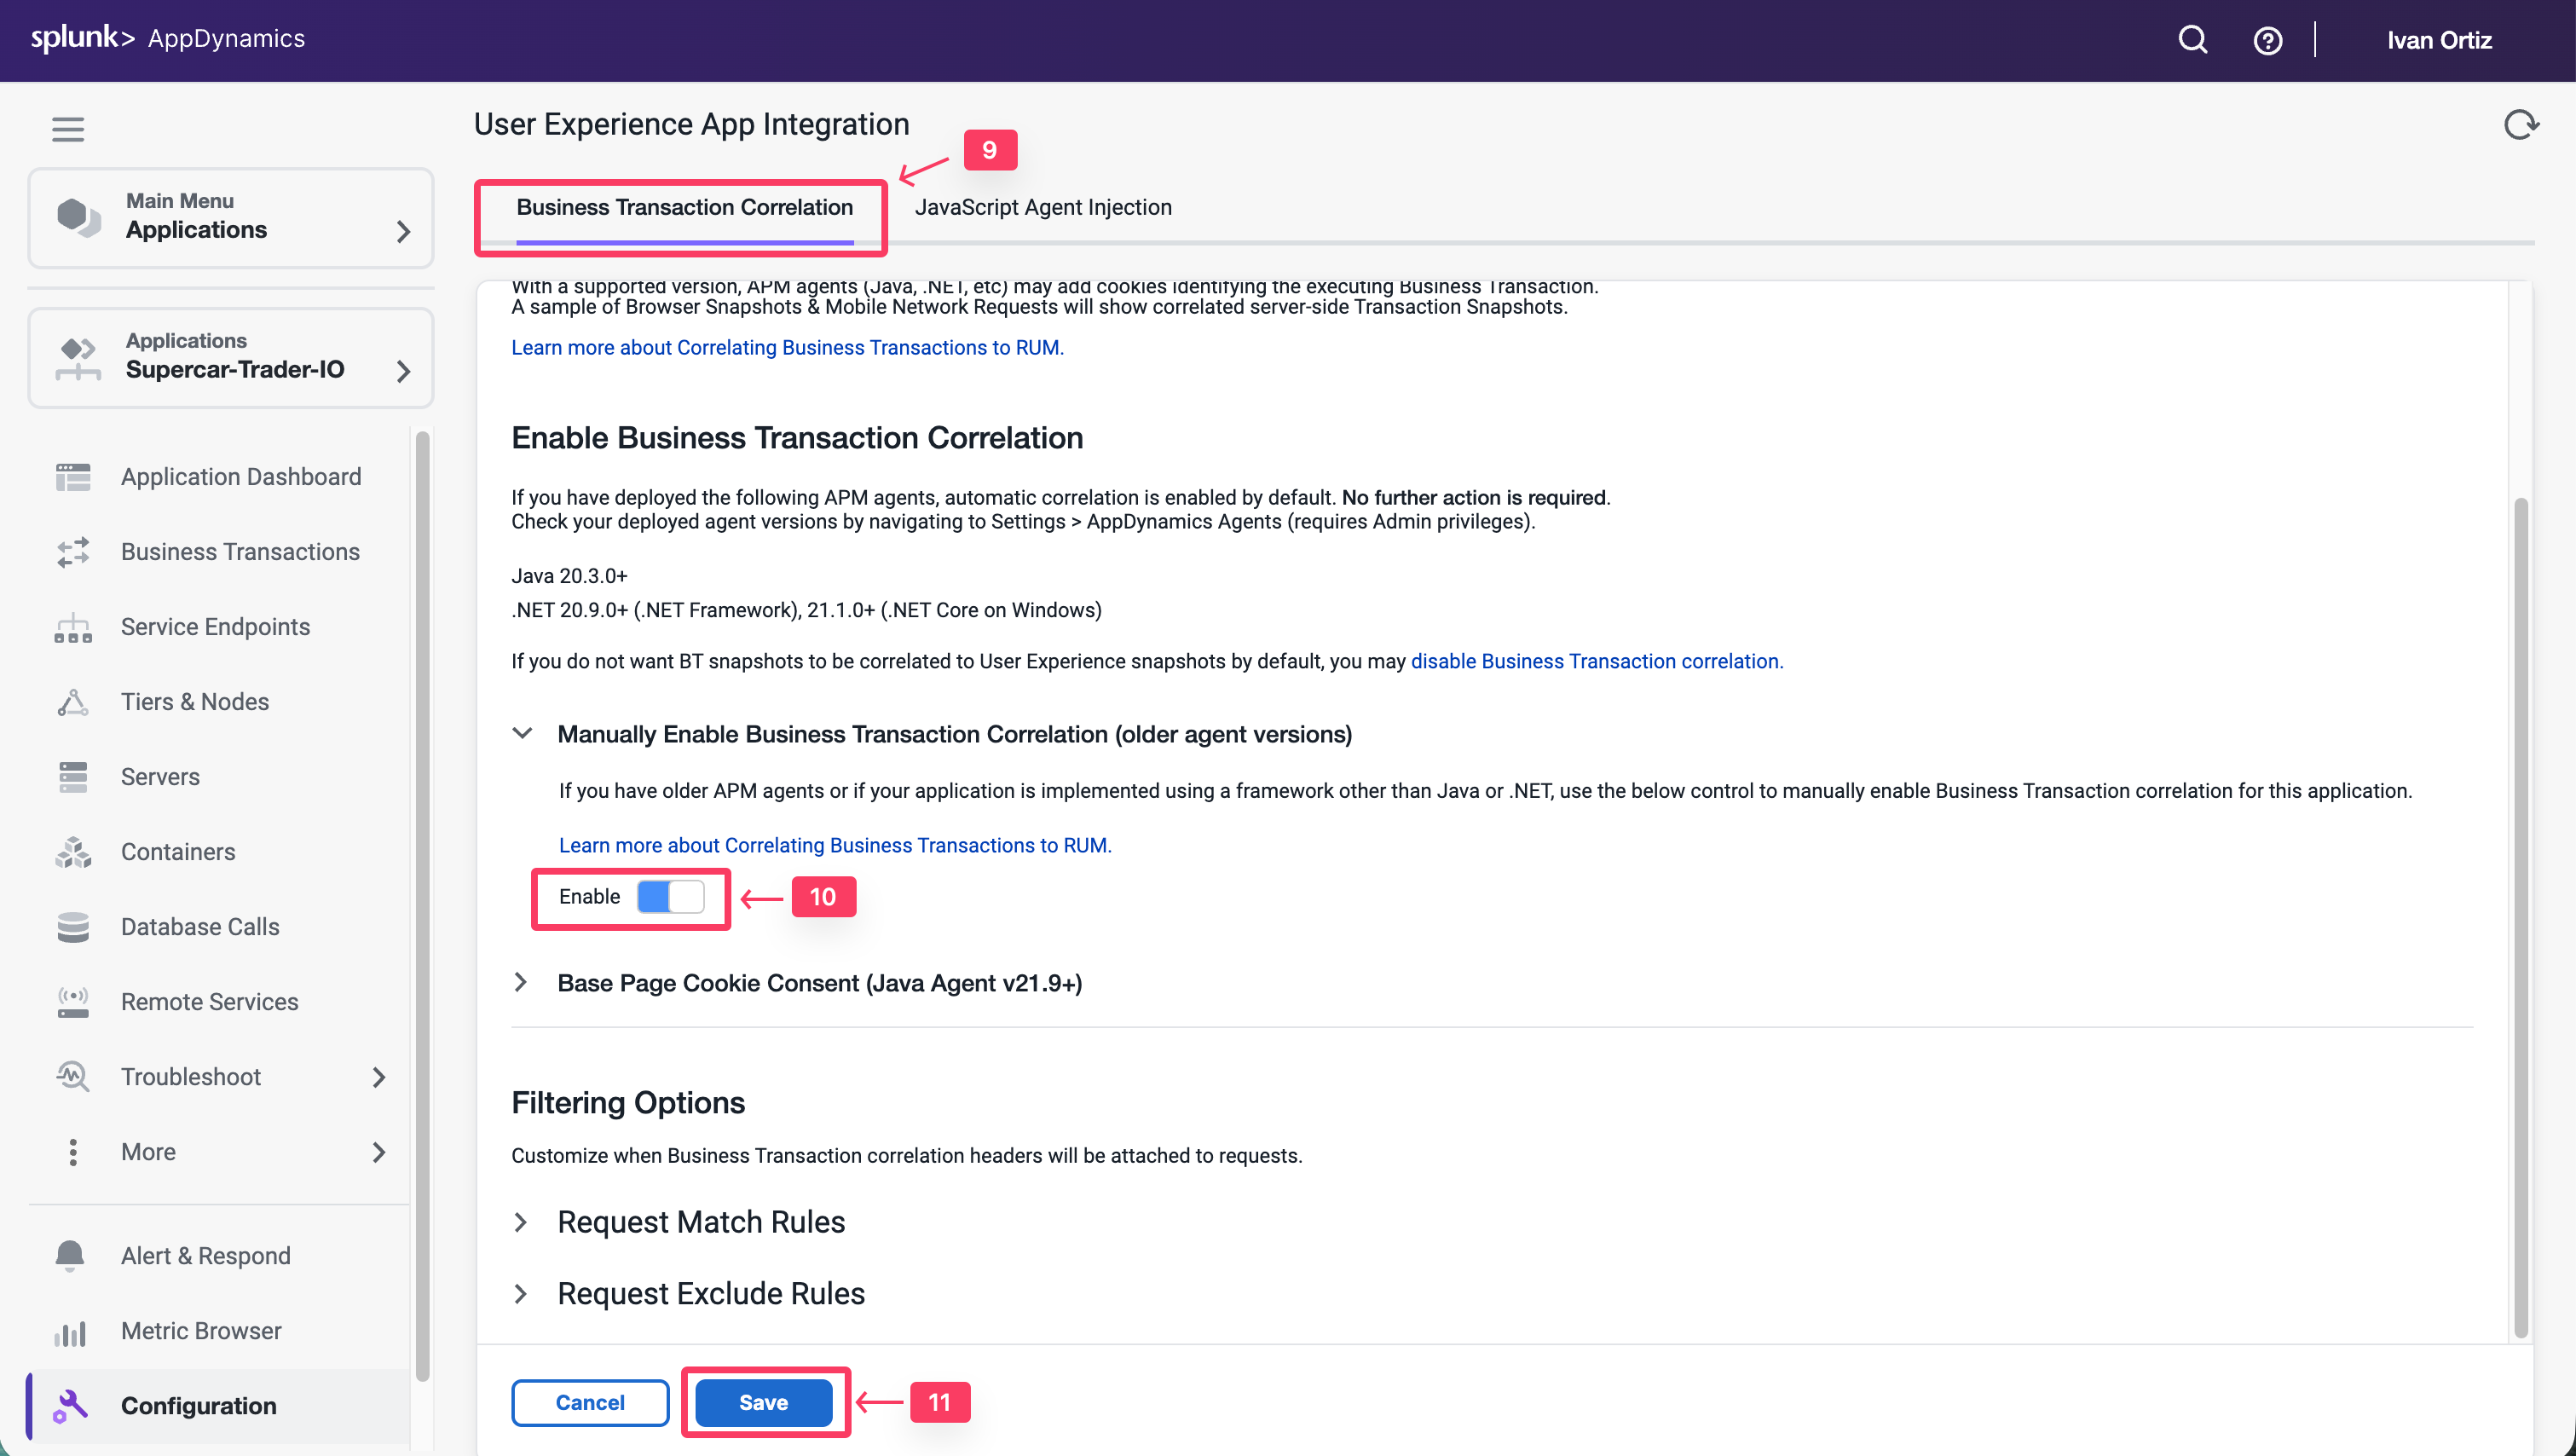
Click the Business Transaction Correlation tab.
Click the Enable button under the Manually Enable Business Transactions section.
Click Save.
Select Business Transactions for injection
Use the following steps to select the Business Transactions for Auto-Injection.
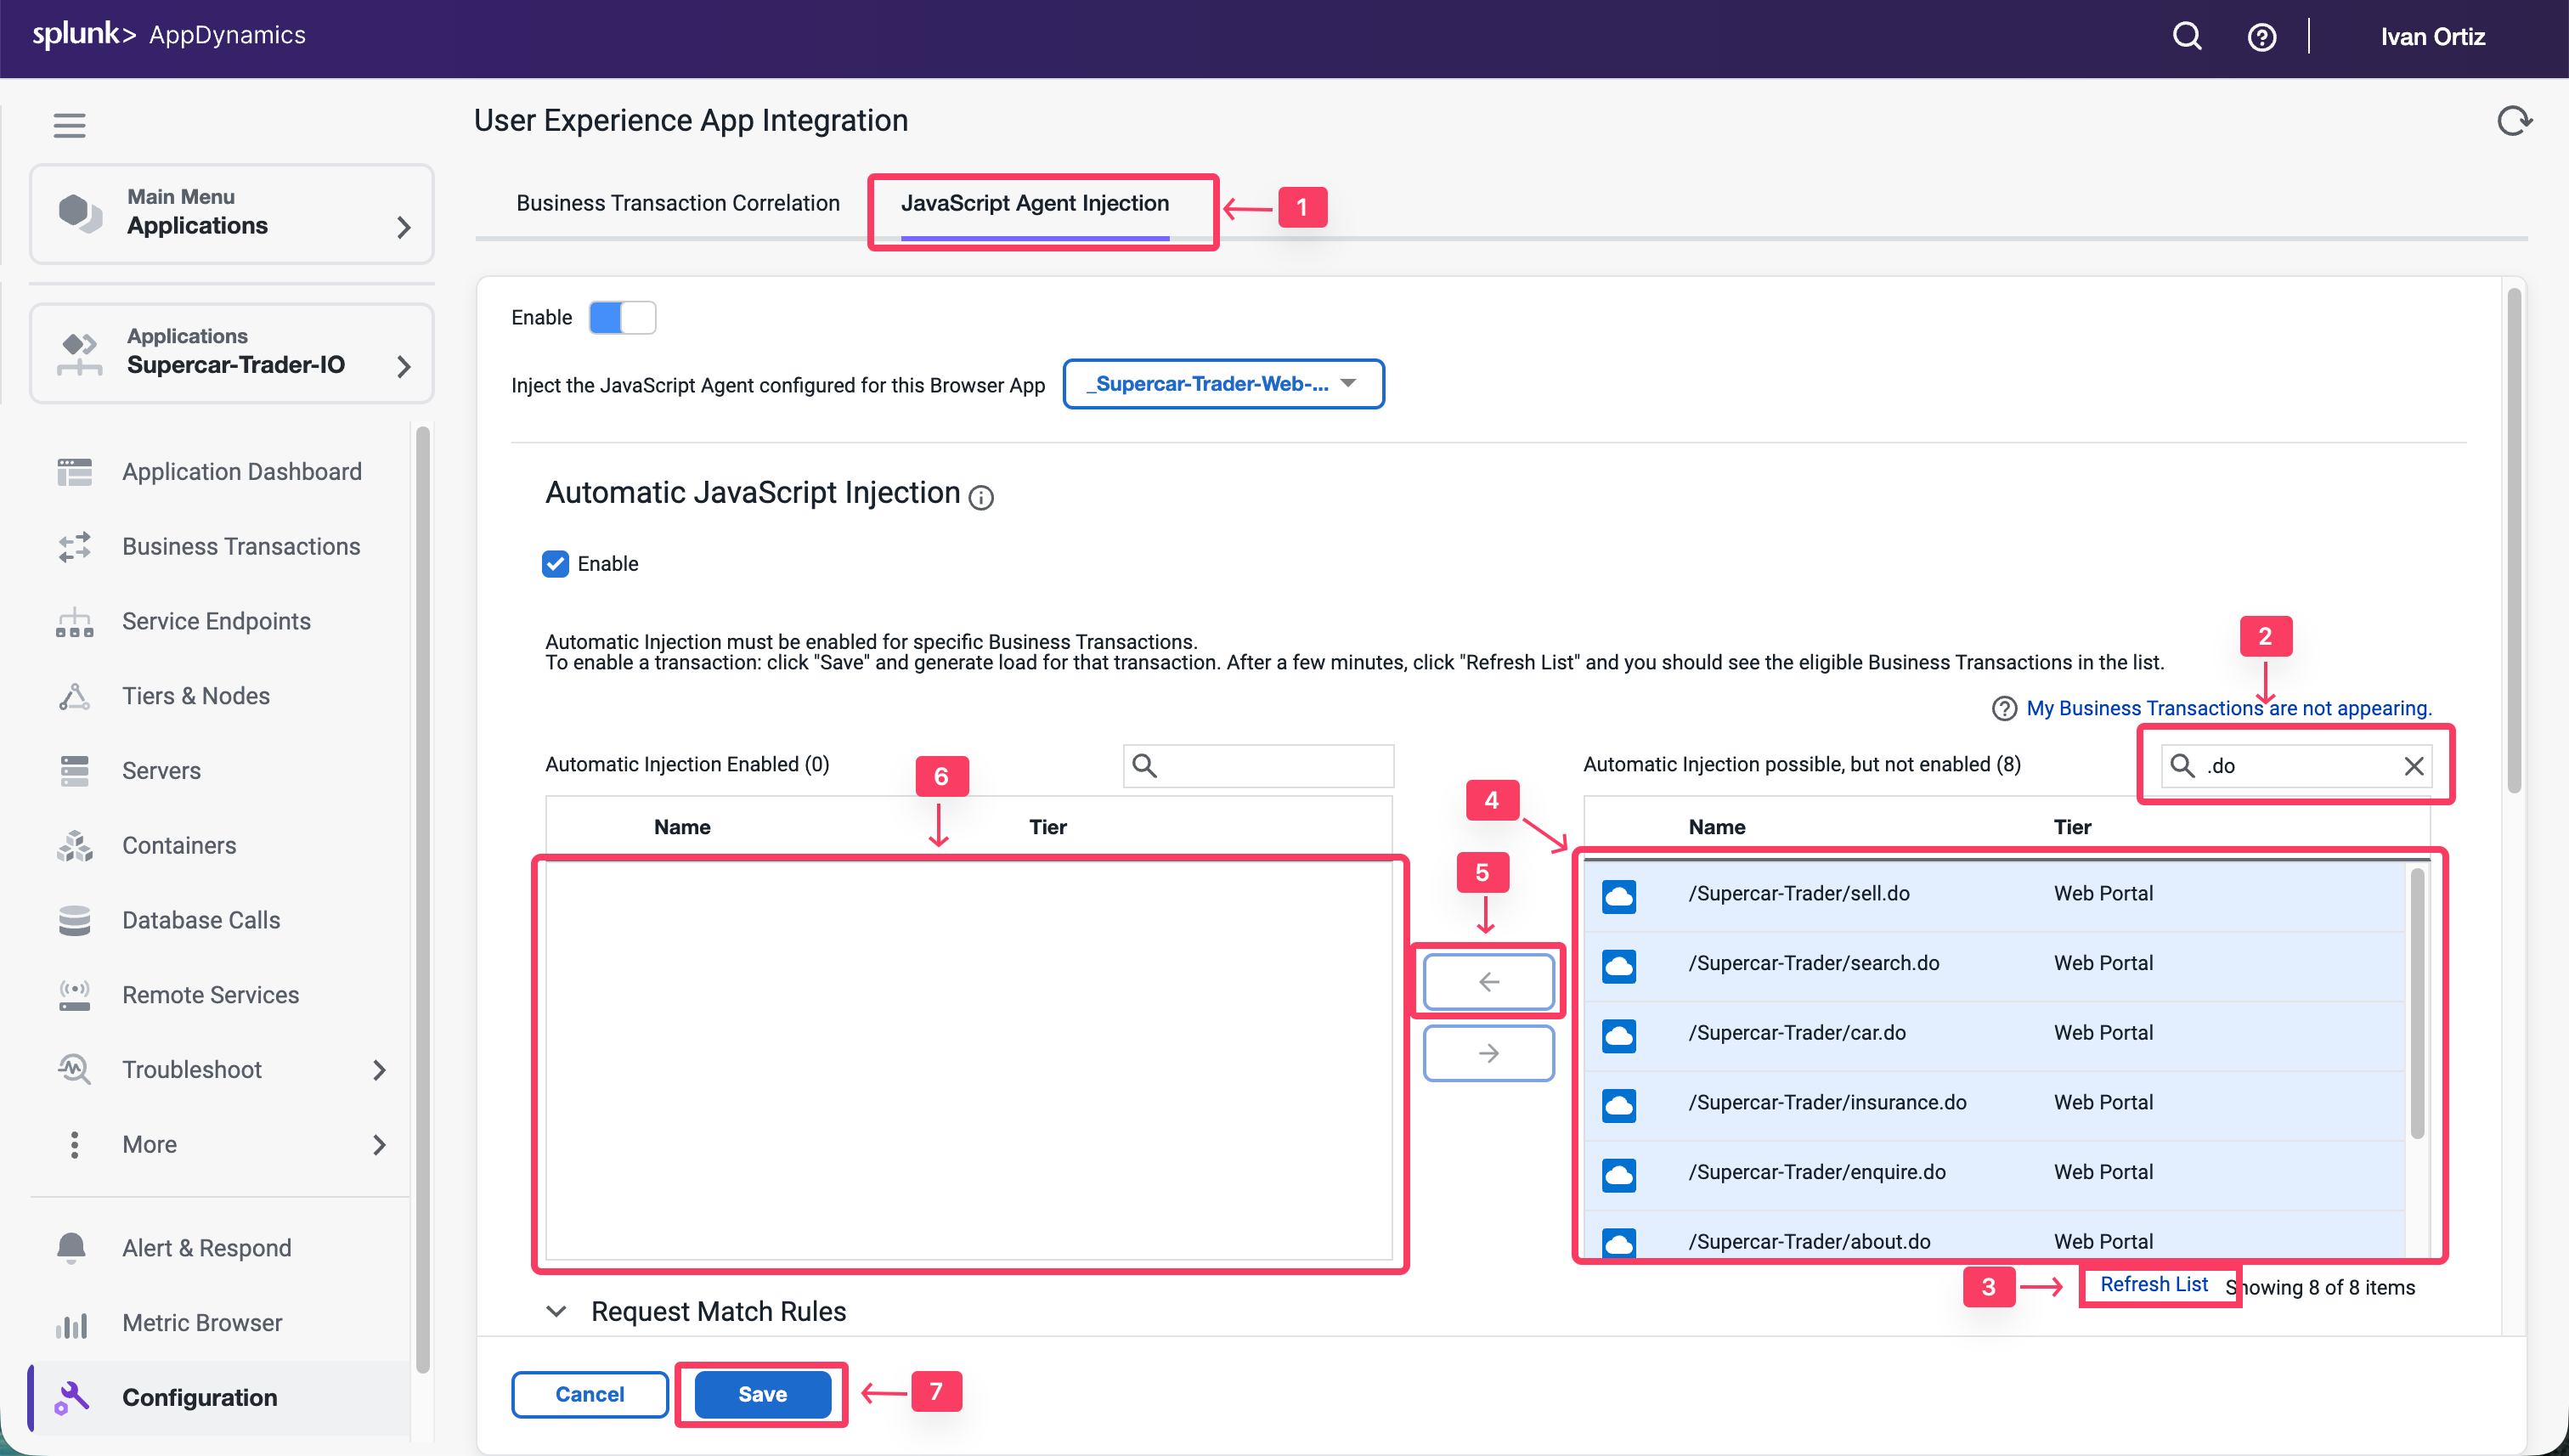
Click the JavaScript Agent Injection tab.
Type .do in the search box.
Click the Refresh List link for the Business Transactions until all 9 BTs show up.
Select all Business Transactions from the right list box.
Click the arrow button to move them to the left list box.
Ensure that all Business Transactions are moved into the left list box.
Click Save.
You can read more about configuring Automatic Injection of the JavaScript Agent here.
Wait a few minutes for load to start showing up in your Browser Application.
Monitor and Troubleshoot - Part 1
2 minutes
In this exercise you will complete the following tasks:
Review the Browser Application Overview Dashboard
Review the Browser Application Geo Dashboard
Review the Browser Application Usage Stats Dashboard
Navigate the Supercar-Trader application web pages
Review the Browser Application Overview Dashboard
Navigate to the User Experience dashboard and drill into the browser application overview dashboard by following these steps.
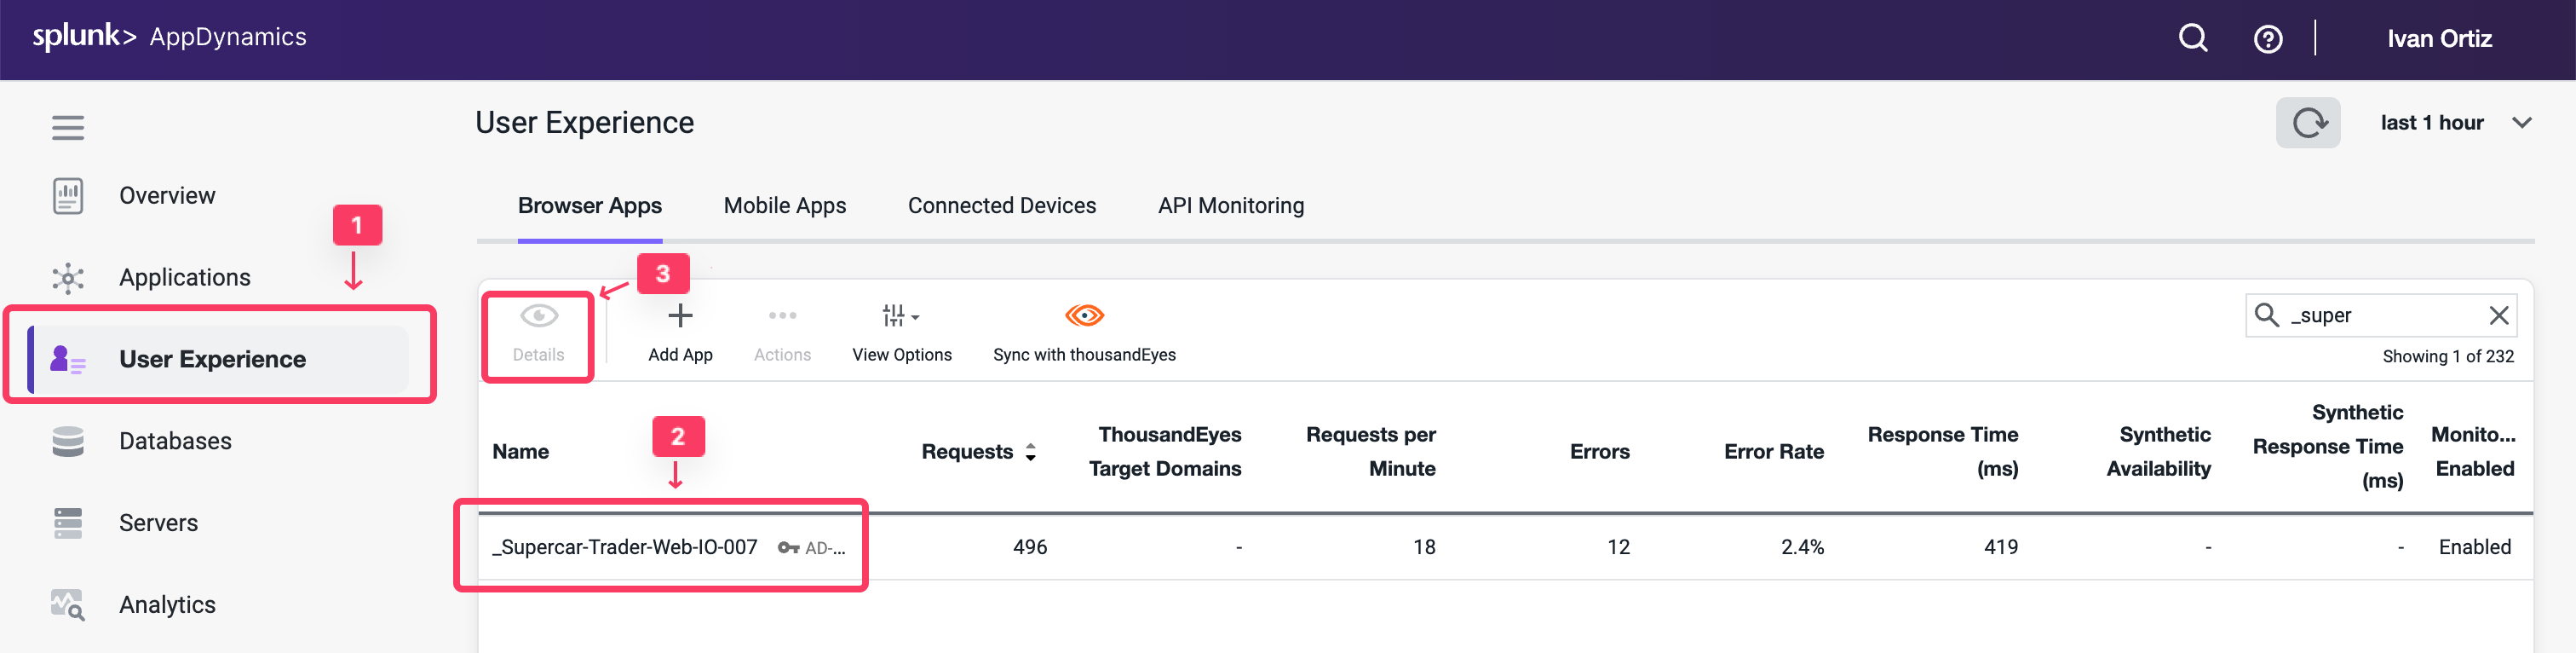
Click the User Experience tab on the left menu.
Search for you Web Application Supercar-Trader-Web-##-###.
Click Details or double click on your application name
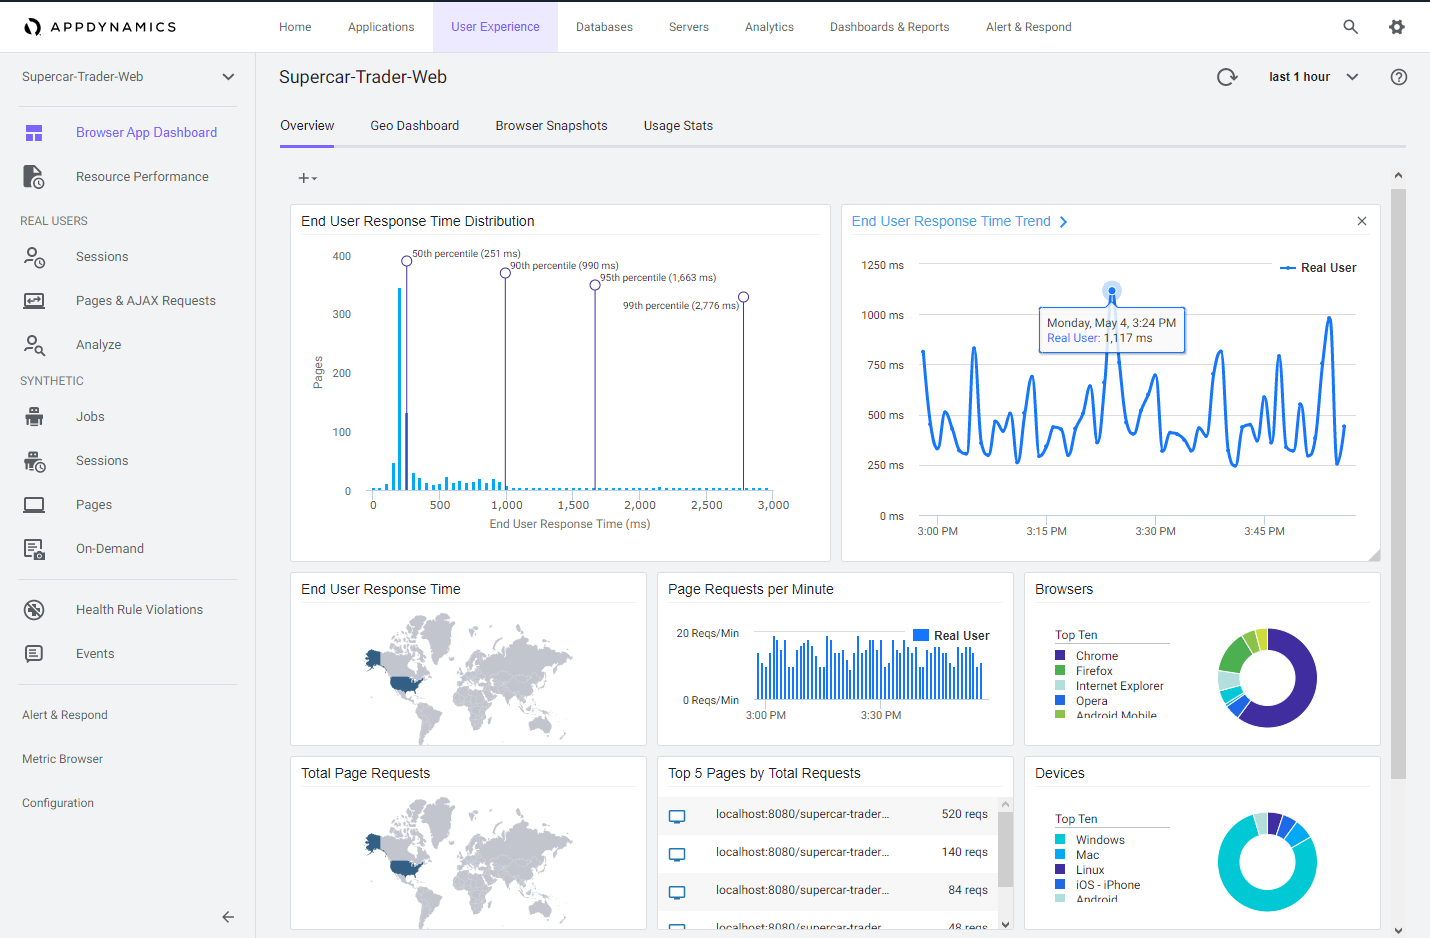
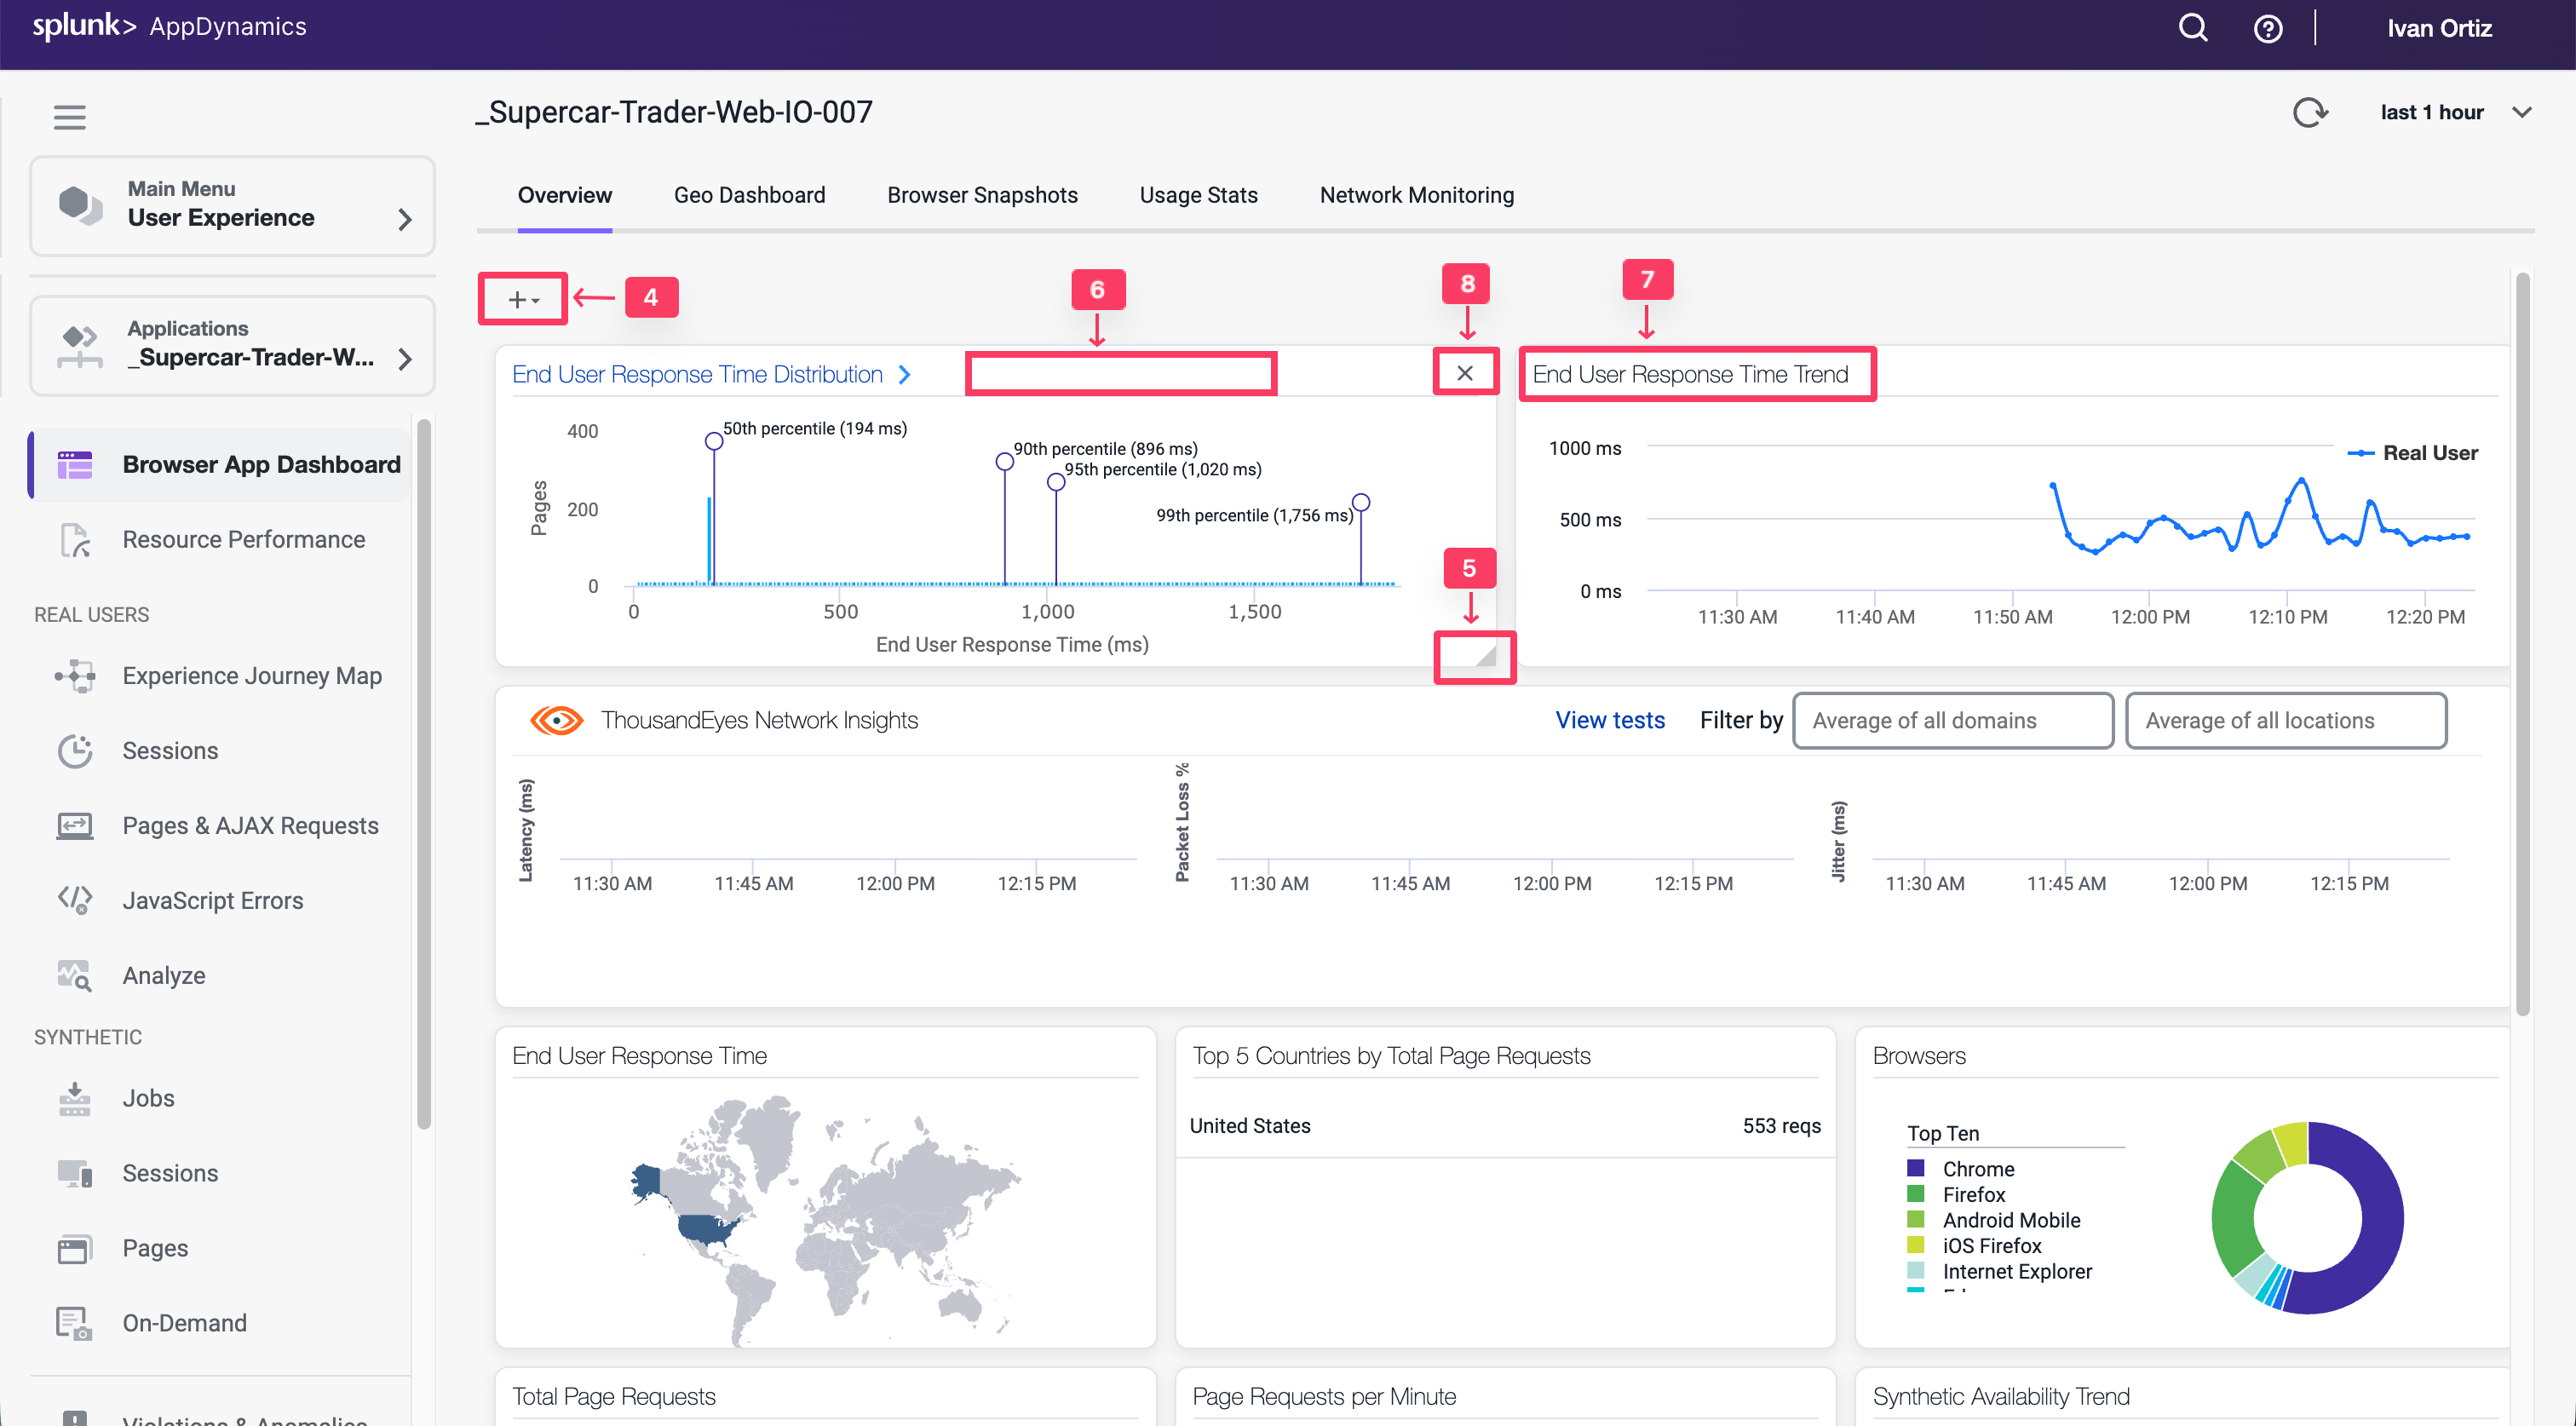
The Overview dashboard displays a set of configurable widgets. The default widgets contain multiple graphs and lists that feature common high-level indicators of application performance, including:
End User Response Time Distribution
End User Response Time Trend
Total Page Requests by Geo
End User Response Time by Geo
Top 10 Browsers
Top 10 Devices
Page Requests per Minute
Top 5 Pages by Total Requests
Top 5 Countries by Total Page Requests
Explore the features of the dashboard.
Click + to choose additional graphs and widgets to add to the dashboard.
Click and drag the bottom right corner of any widget to resize it.
Select the outlined area in any widget to move and place it on the dashboard.
Click on the title of any widget to drill into the detail dashboard.
Click X in the top right corner of any widget to remove it from the dashboard.
Any changes you make to the dashboard widget layout will automatically be saved.
You can read more about the Browser Application Overview dashboard here.
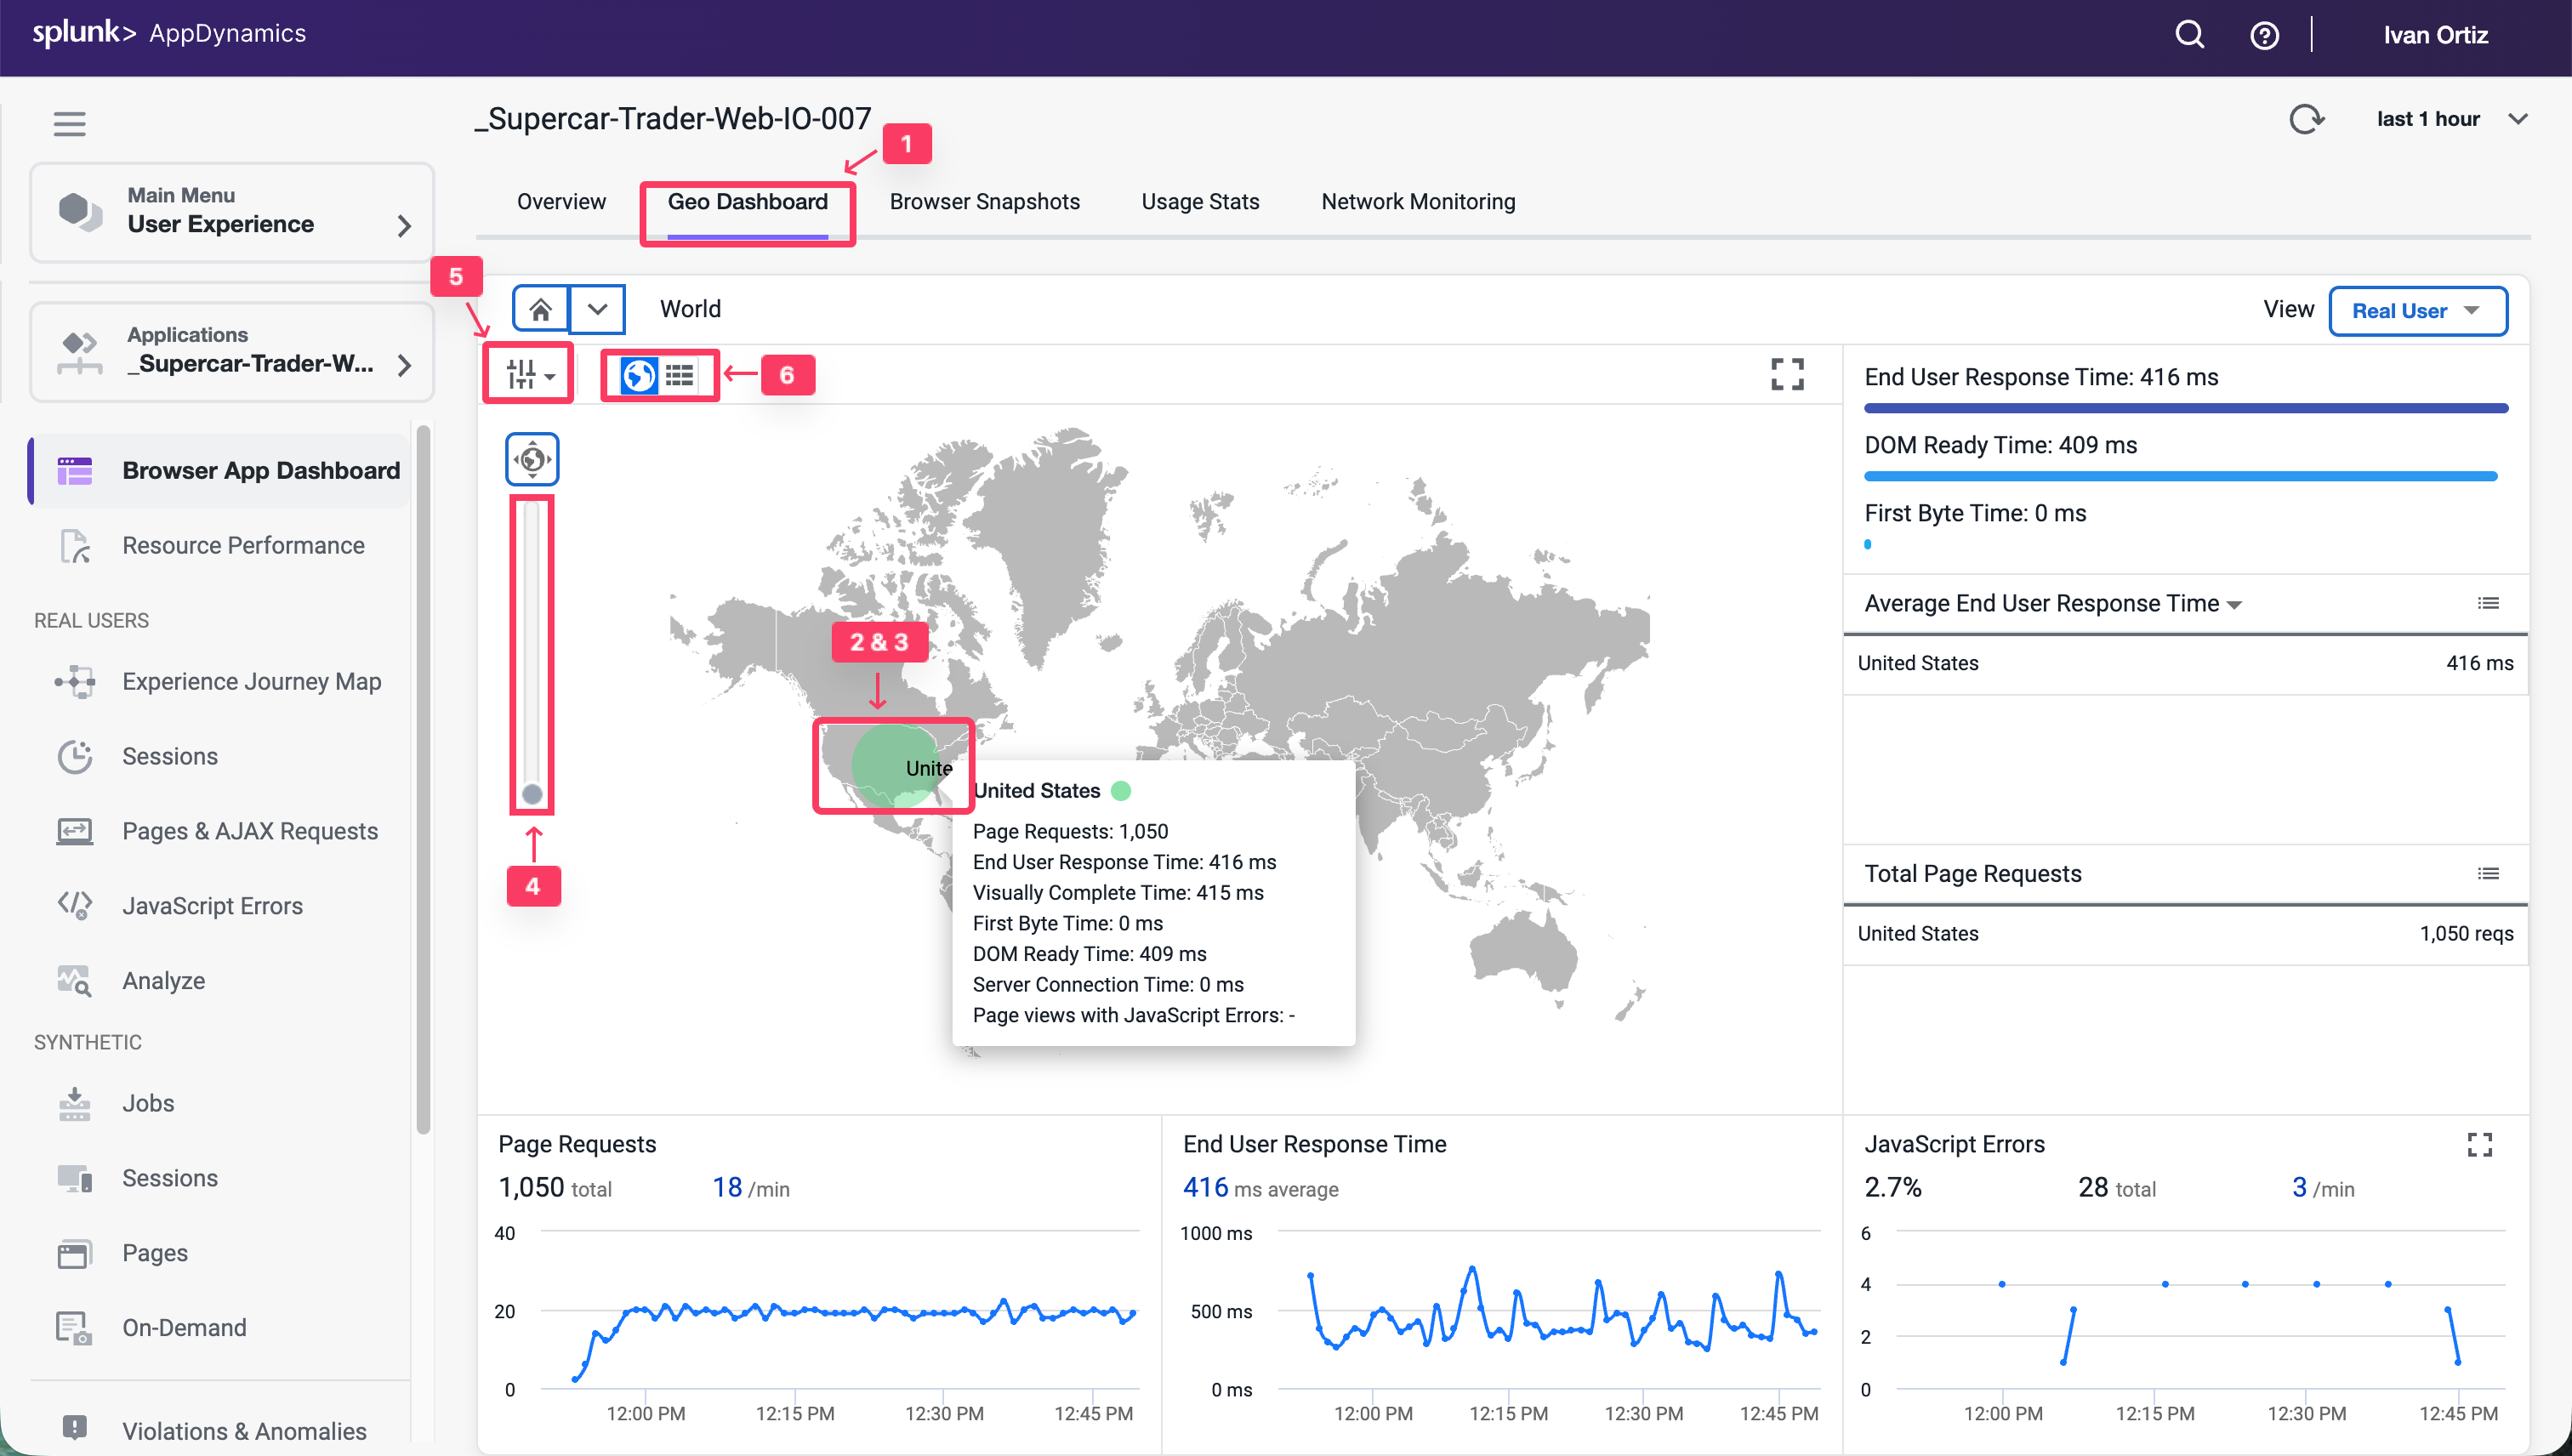
Review the Browser Application Geo Dashboard
The Geo Dashboard displays key performance metrics by geographic location based on page loads. The metrics displayed throughout the dashboard are for the region currently selected on the map or in the grid. The Map view displays load circles with labels for countries that are in the key timing metrics given in the right panel. Some countries and regions, however, are only displayed in the grid view.
Navigate to the Browser Application Geo dashboard and explore the features of the dashboard described below.
Click the Geo Dashboard option.
Click on one of the load circles to drill down to the region.
Hover over one of the regions to show the region details.
Use the zoom slider to adjust the zoom level.
Click Configuration to explore the map options.
Switch between the grid view and map view.
You can read more about the Browser Application Geo dashboard here.
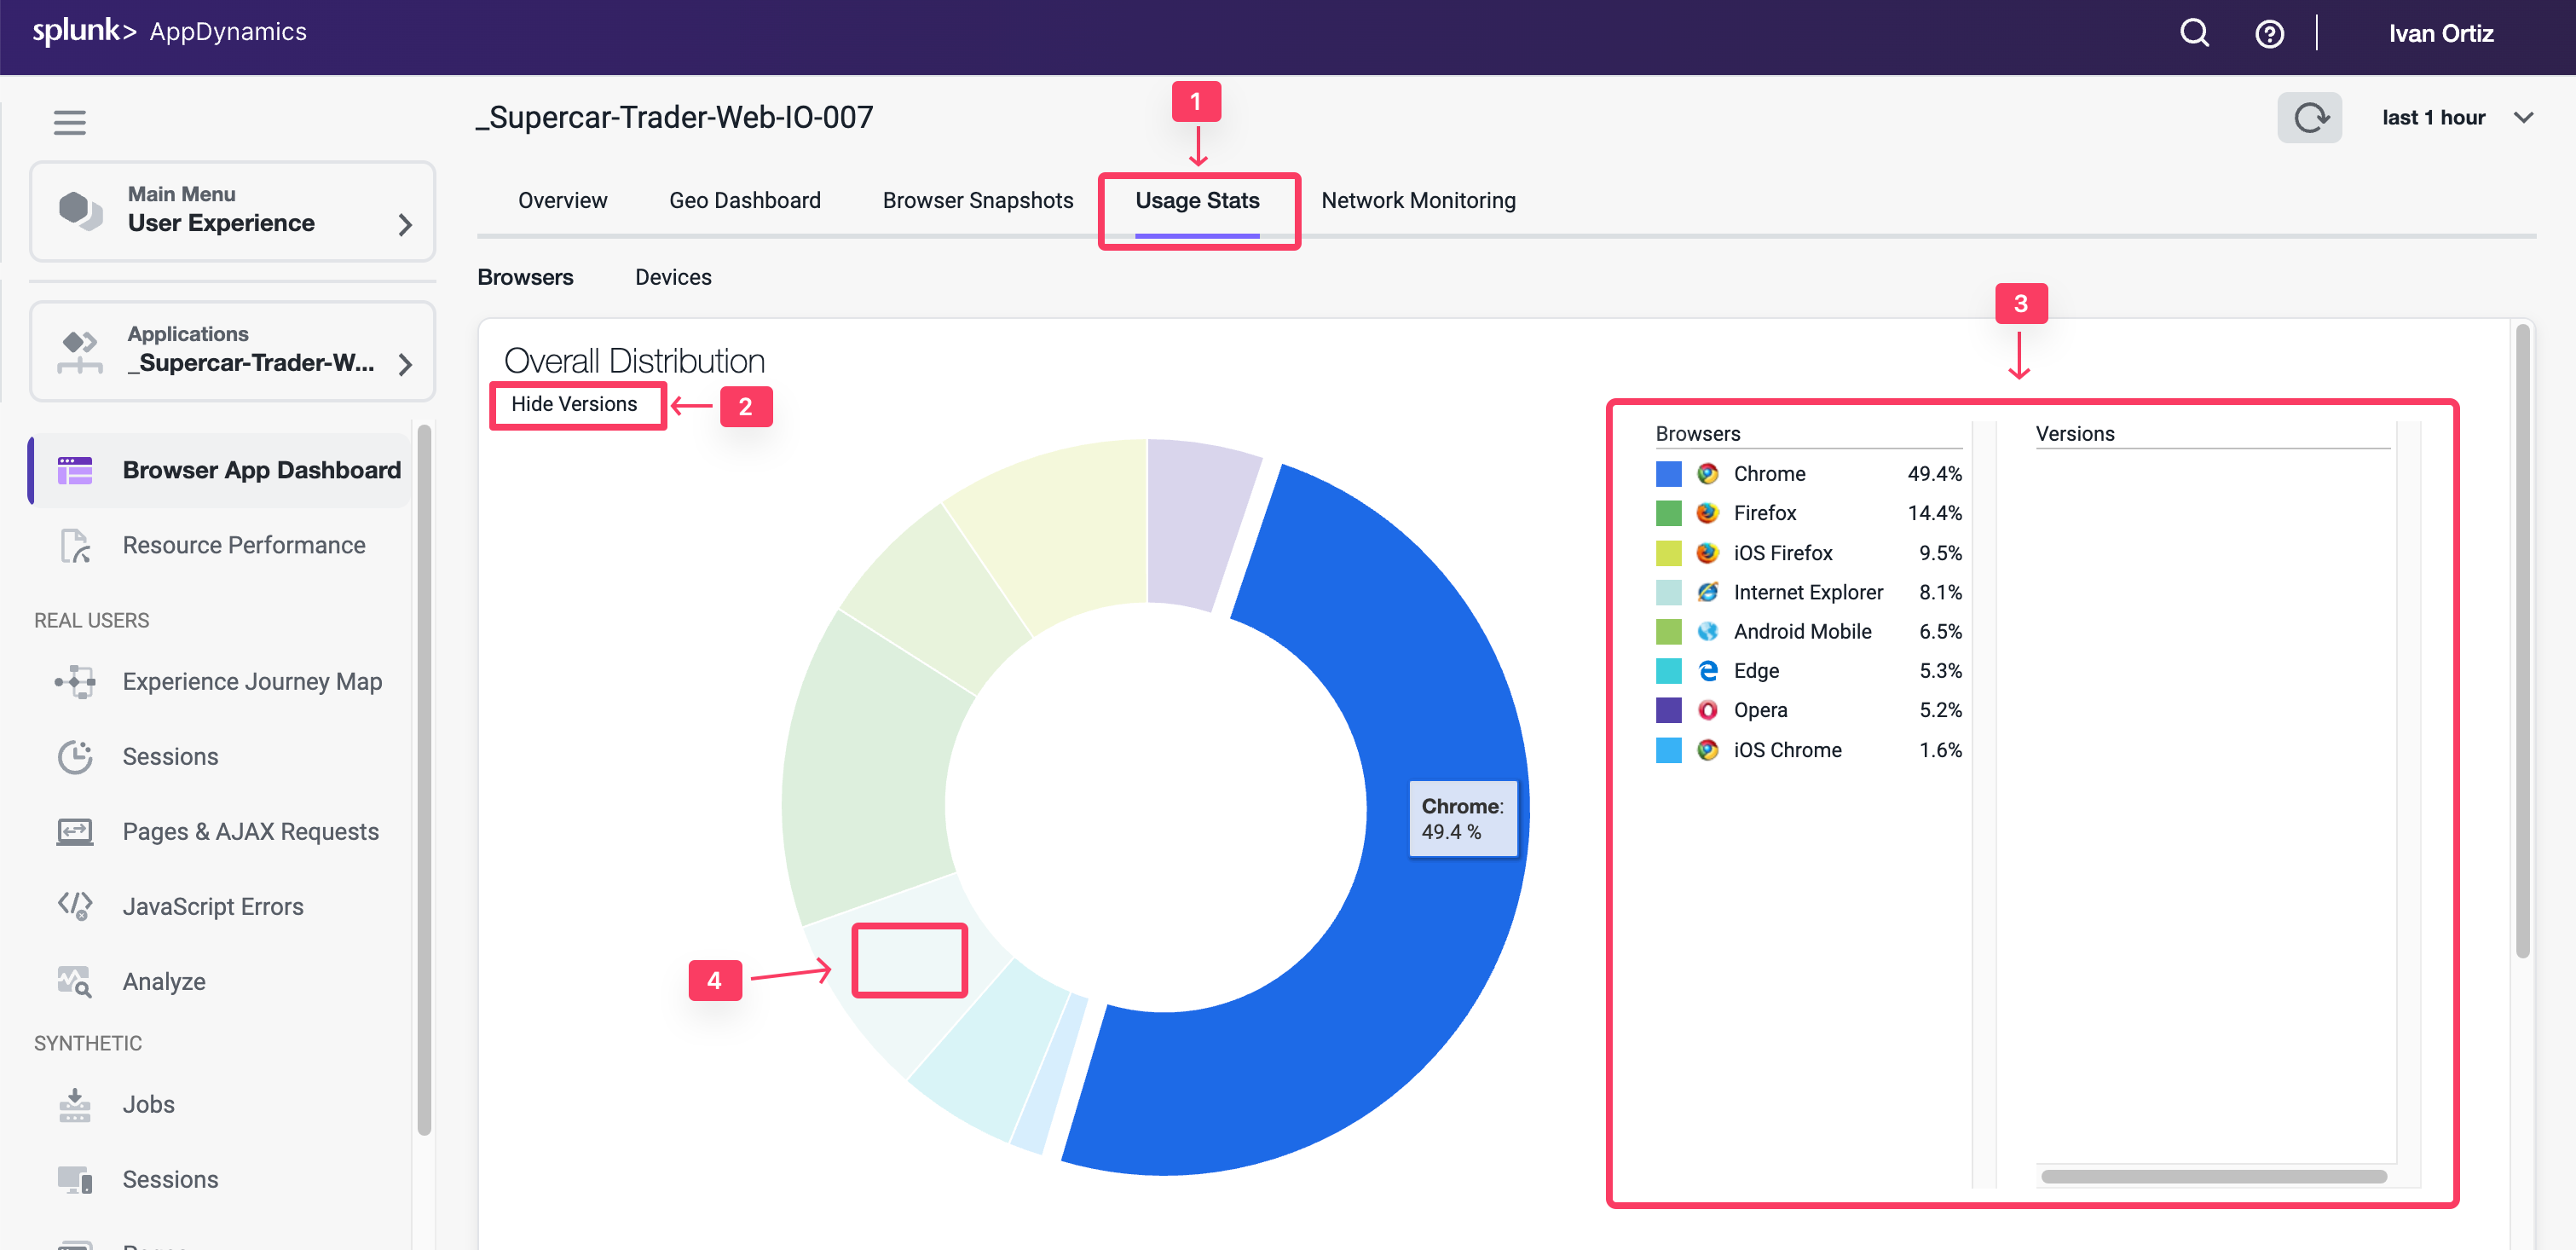
Review the Browser Application Usage Stats Dashboard
The Usage Stats dashboard presents an aggregated page-load usage data based on your users browser type and device/platform.
The Browser Application Usage Stats dashboard helps you discover:
The slowest browsers in terms of total end-user response time.
The slowest browsers to render the response page.
The browsers that most of your end users use.
The browsers that most of your end users use in a particular country or region.
Navigate to the Browser Application Usage Stats dashboard and explore the features of the dashboard described below.
Click the Usage Stats option.
Click the Show Versions option.
Look at the different browsers and versions by load.
Hover over the sections in the pie chart to see the details.
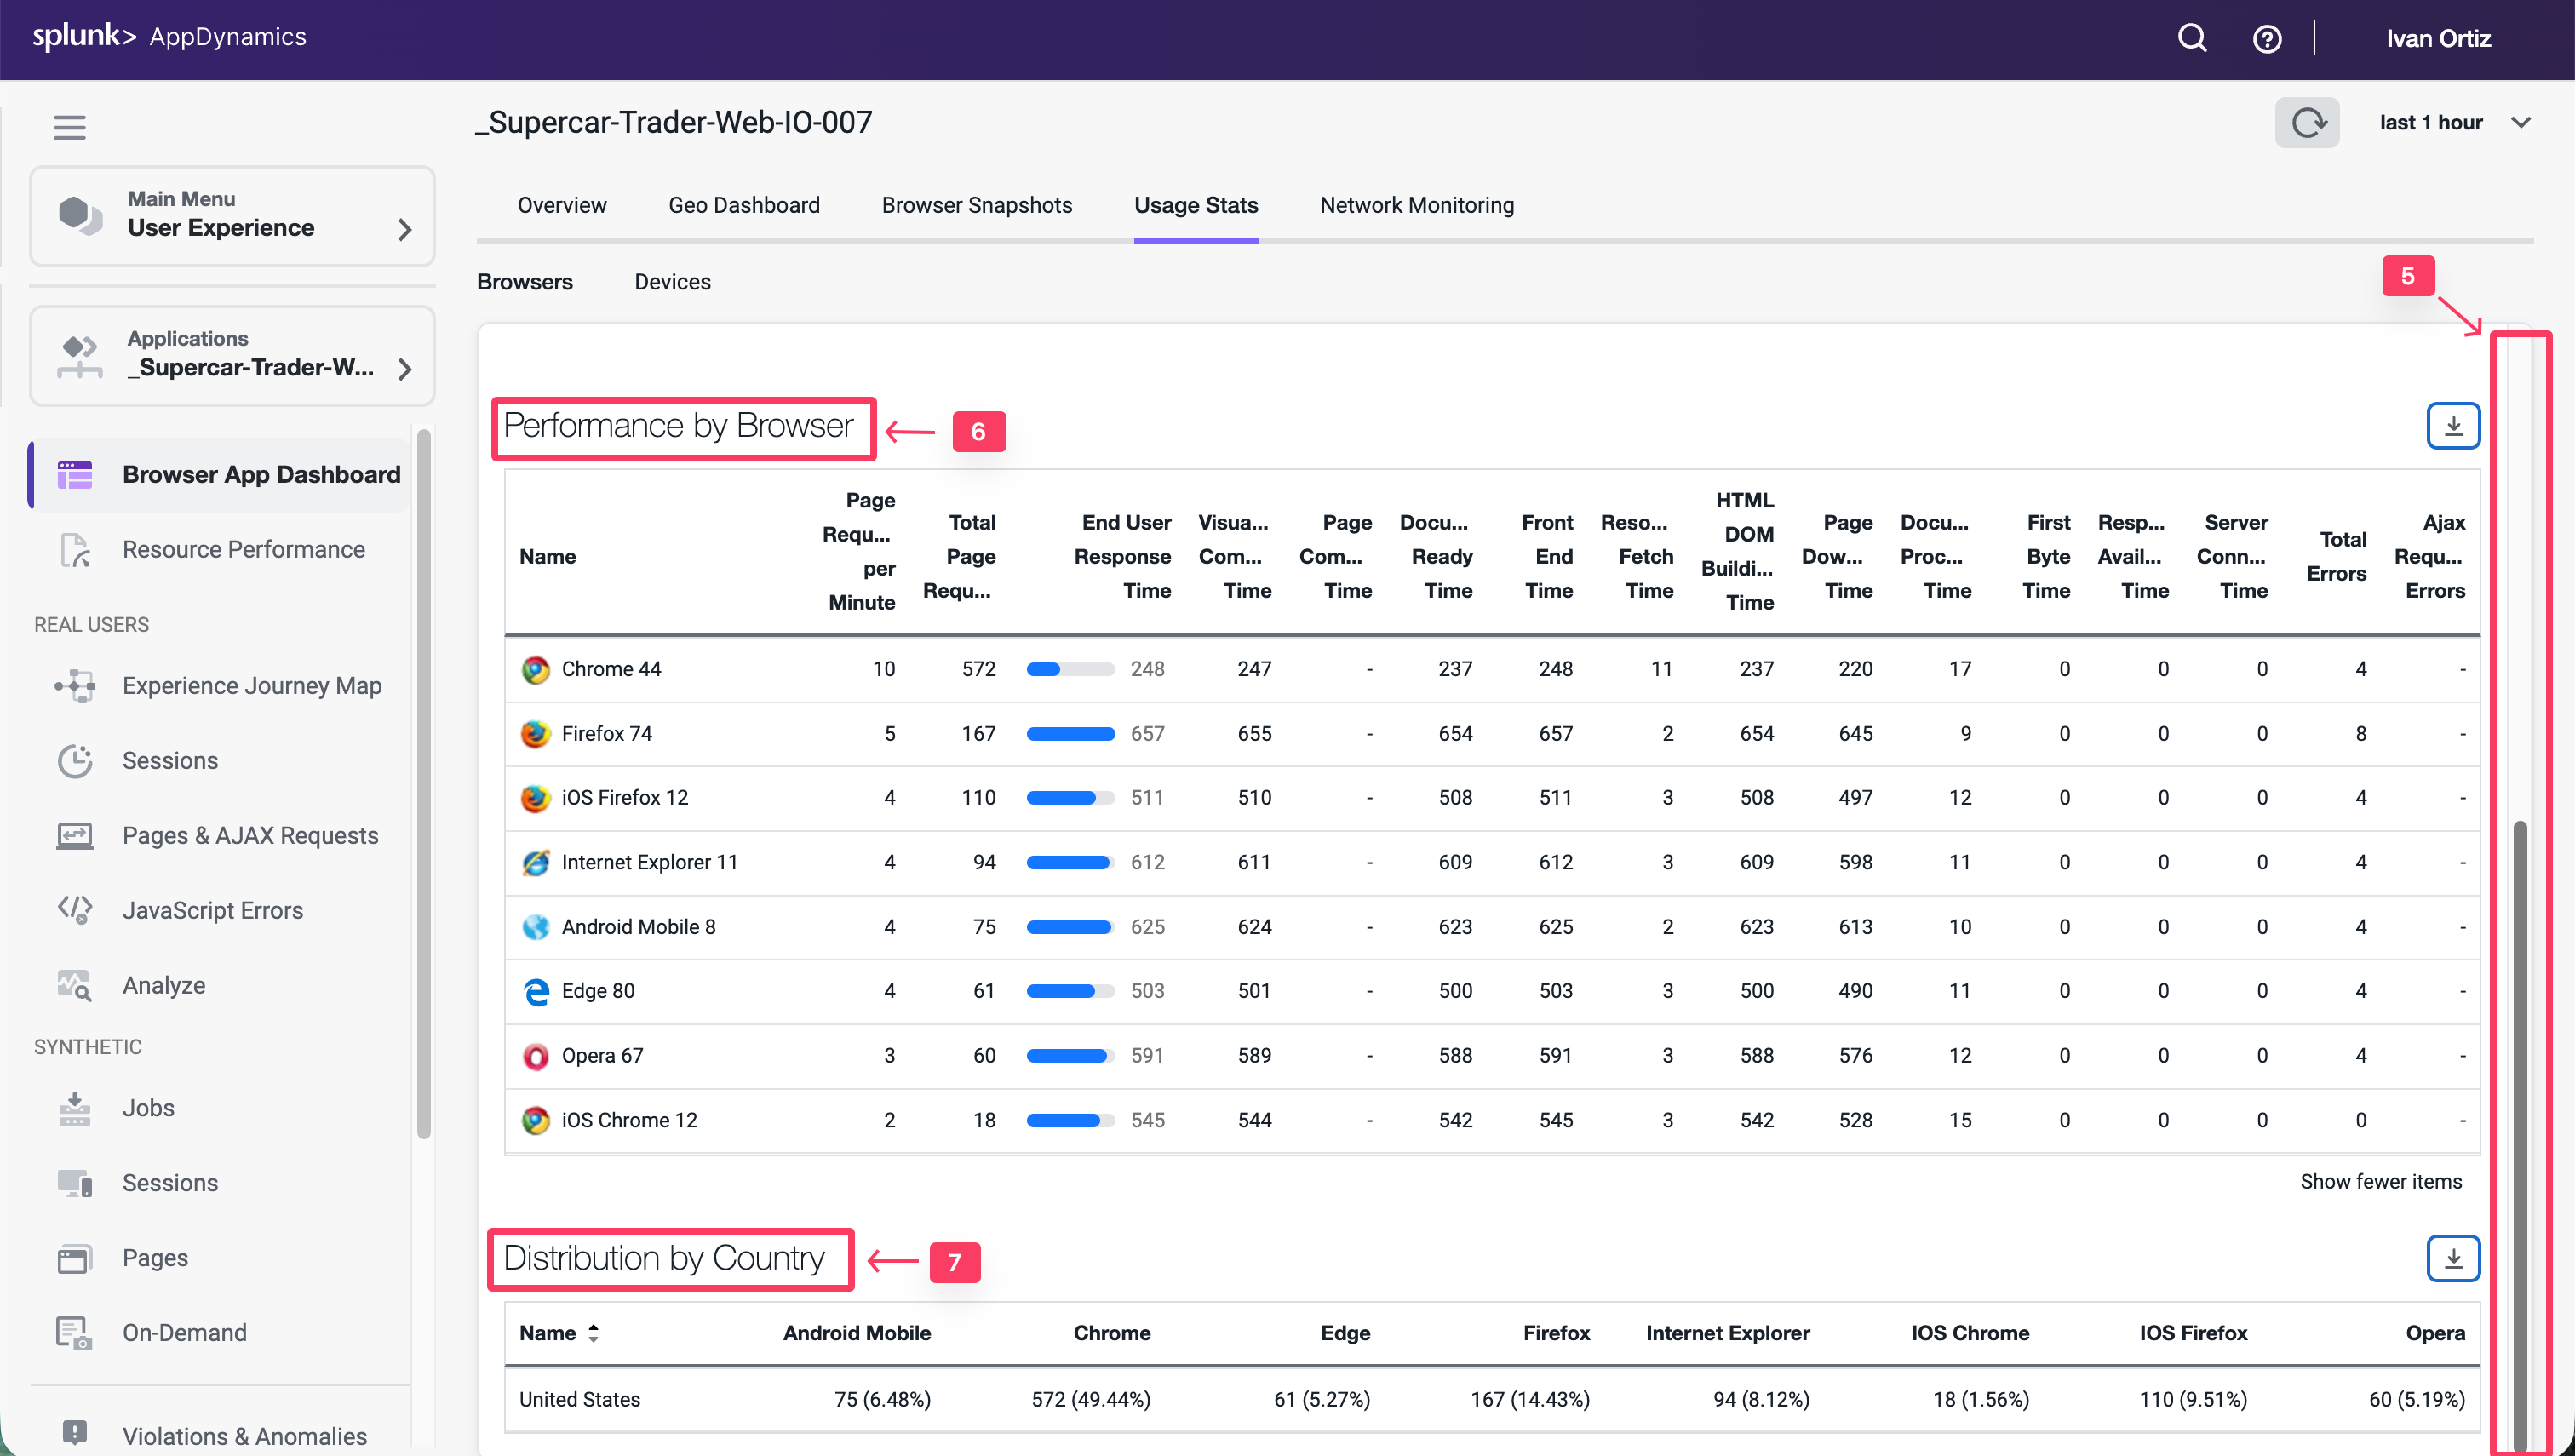
Use these steps to explore more metrics by browser and version.
Use the scroll bar on the right to scroll to the bottom of the page.
Explore the available metrics by browser and version.
Explore the available metrics by country.
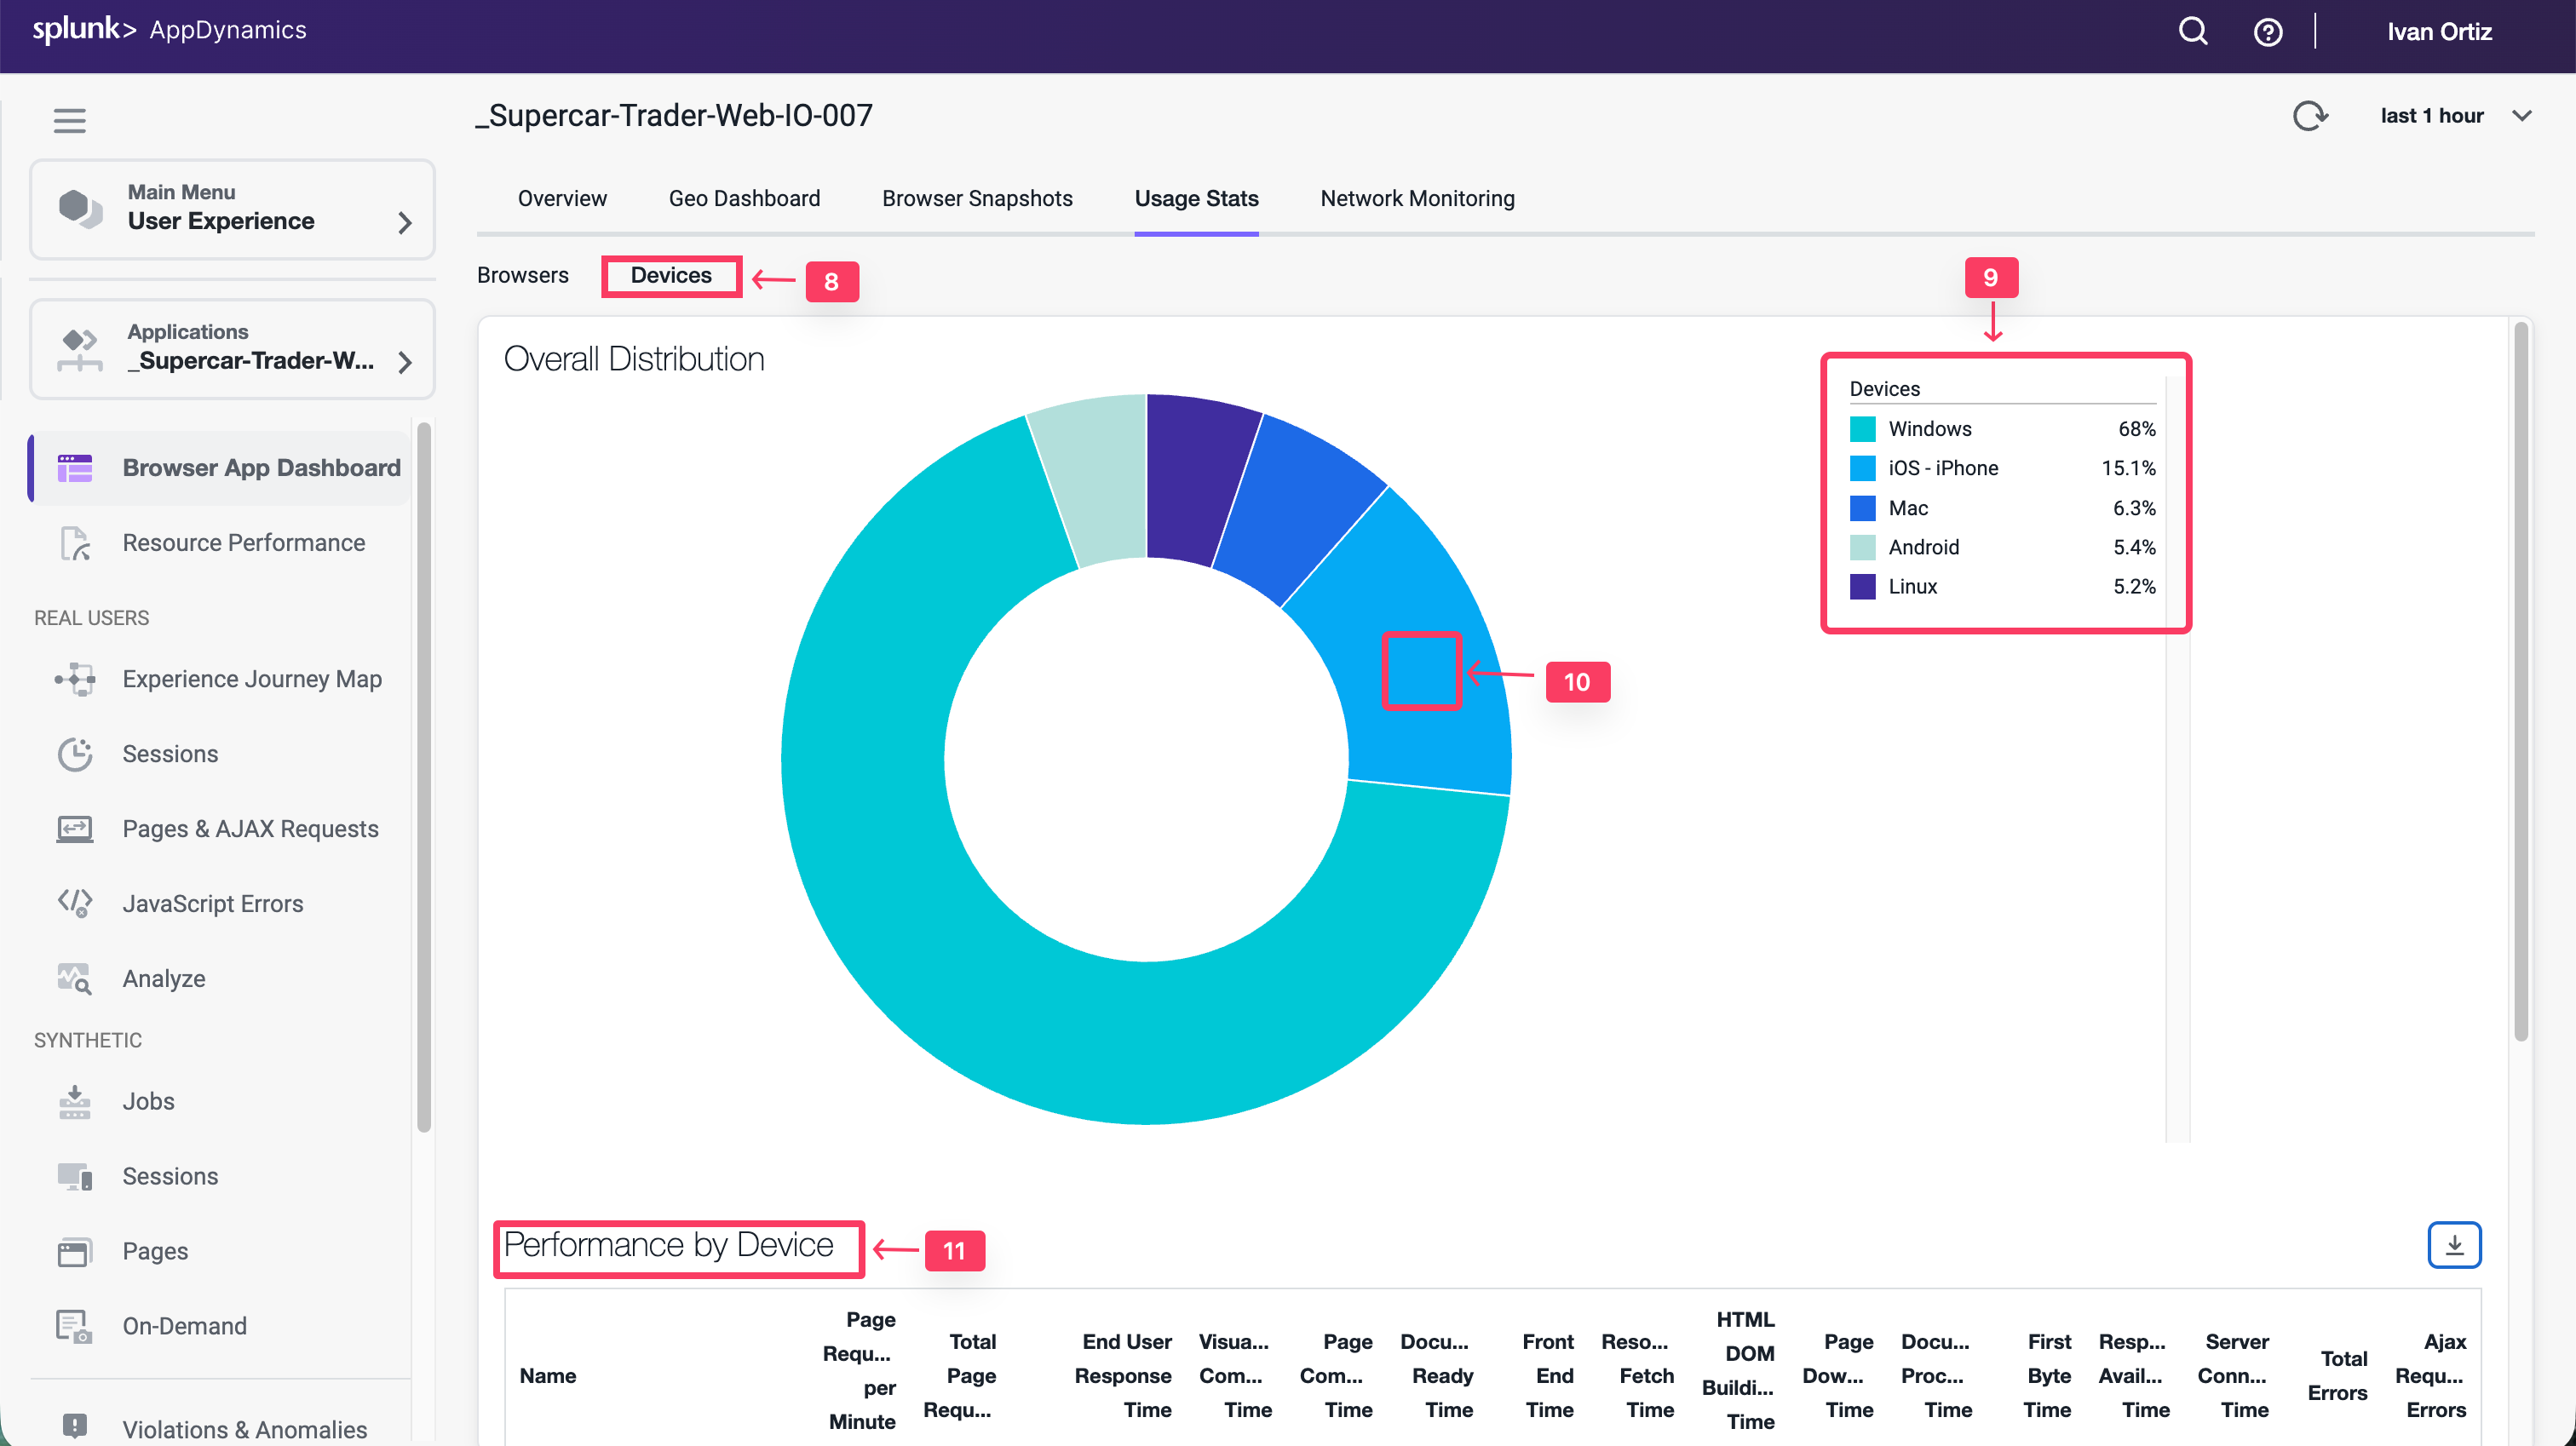
Navigate to the Devices dashboard and explore the features of the dashboard described below.
Click the Devices option.
Look at the load by device break out.
Hover over the sections in the pie chart to see the details.
Explore the available performance metrics by device.
You can read more about the Browser Application Usage Stats dashboard here.
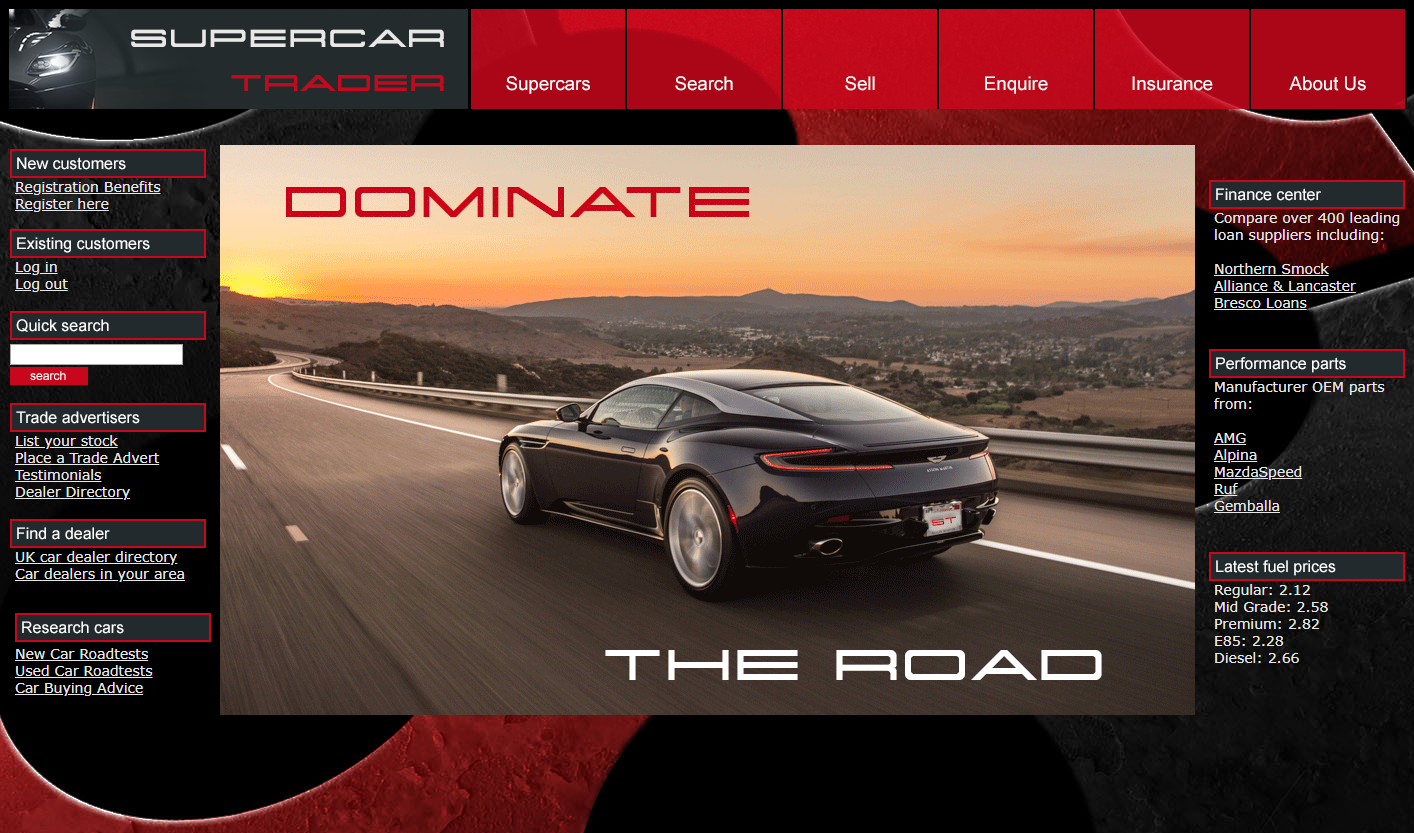
Navigate the Supercar-Trader application web pages
Now that you have the Browser Real User Monitoring agent configured and explored the first series of features, let’s generate some additional load and record your unique browser session by navigating the web pages of the Supercar-Trader application.
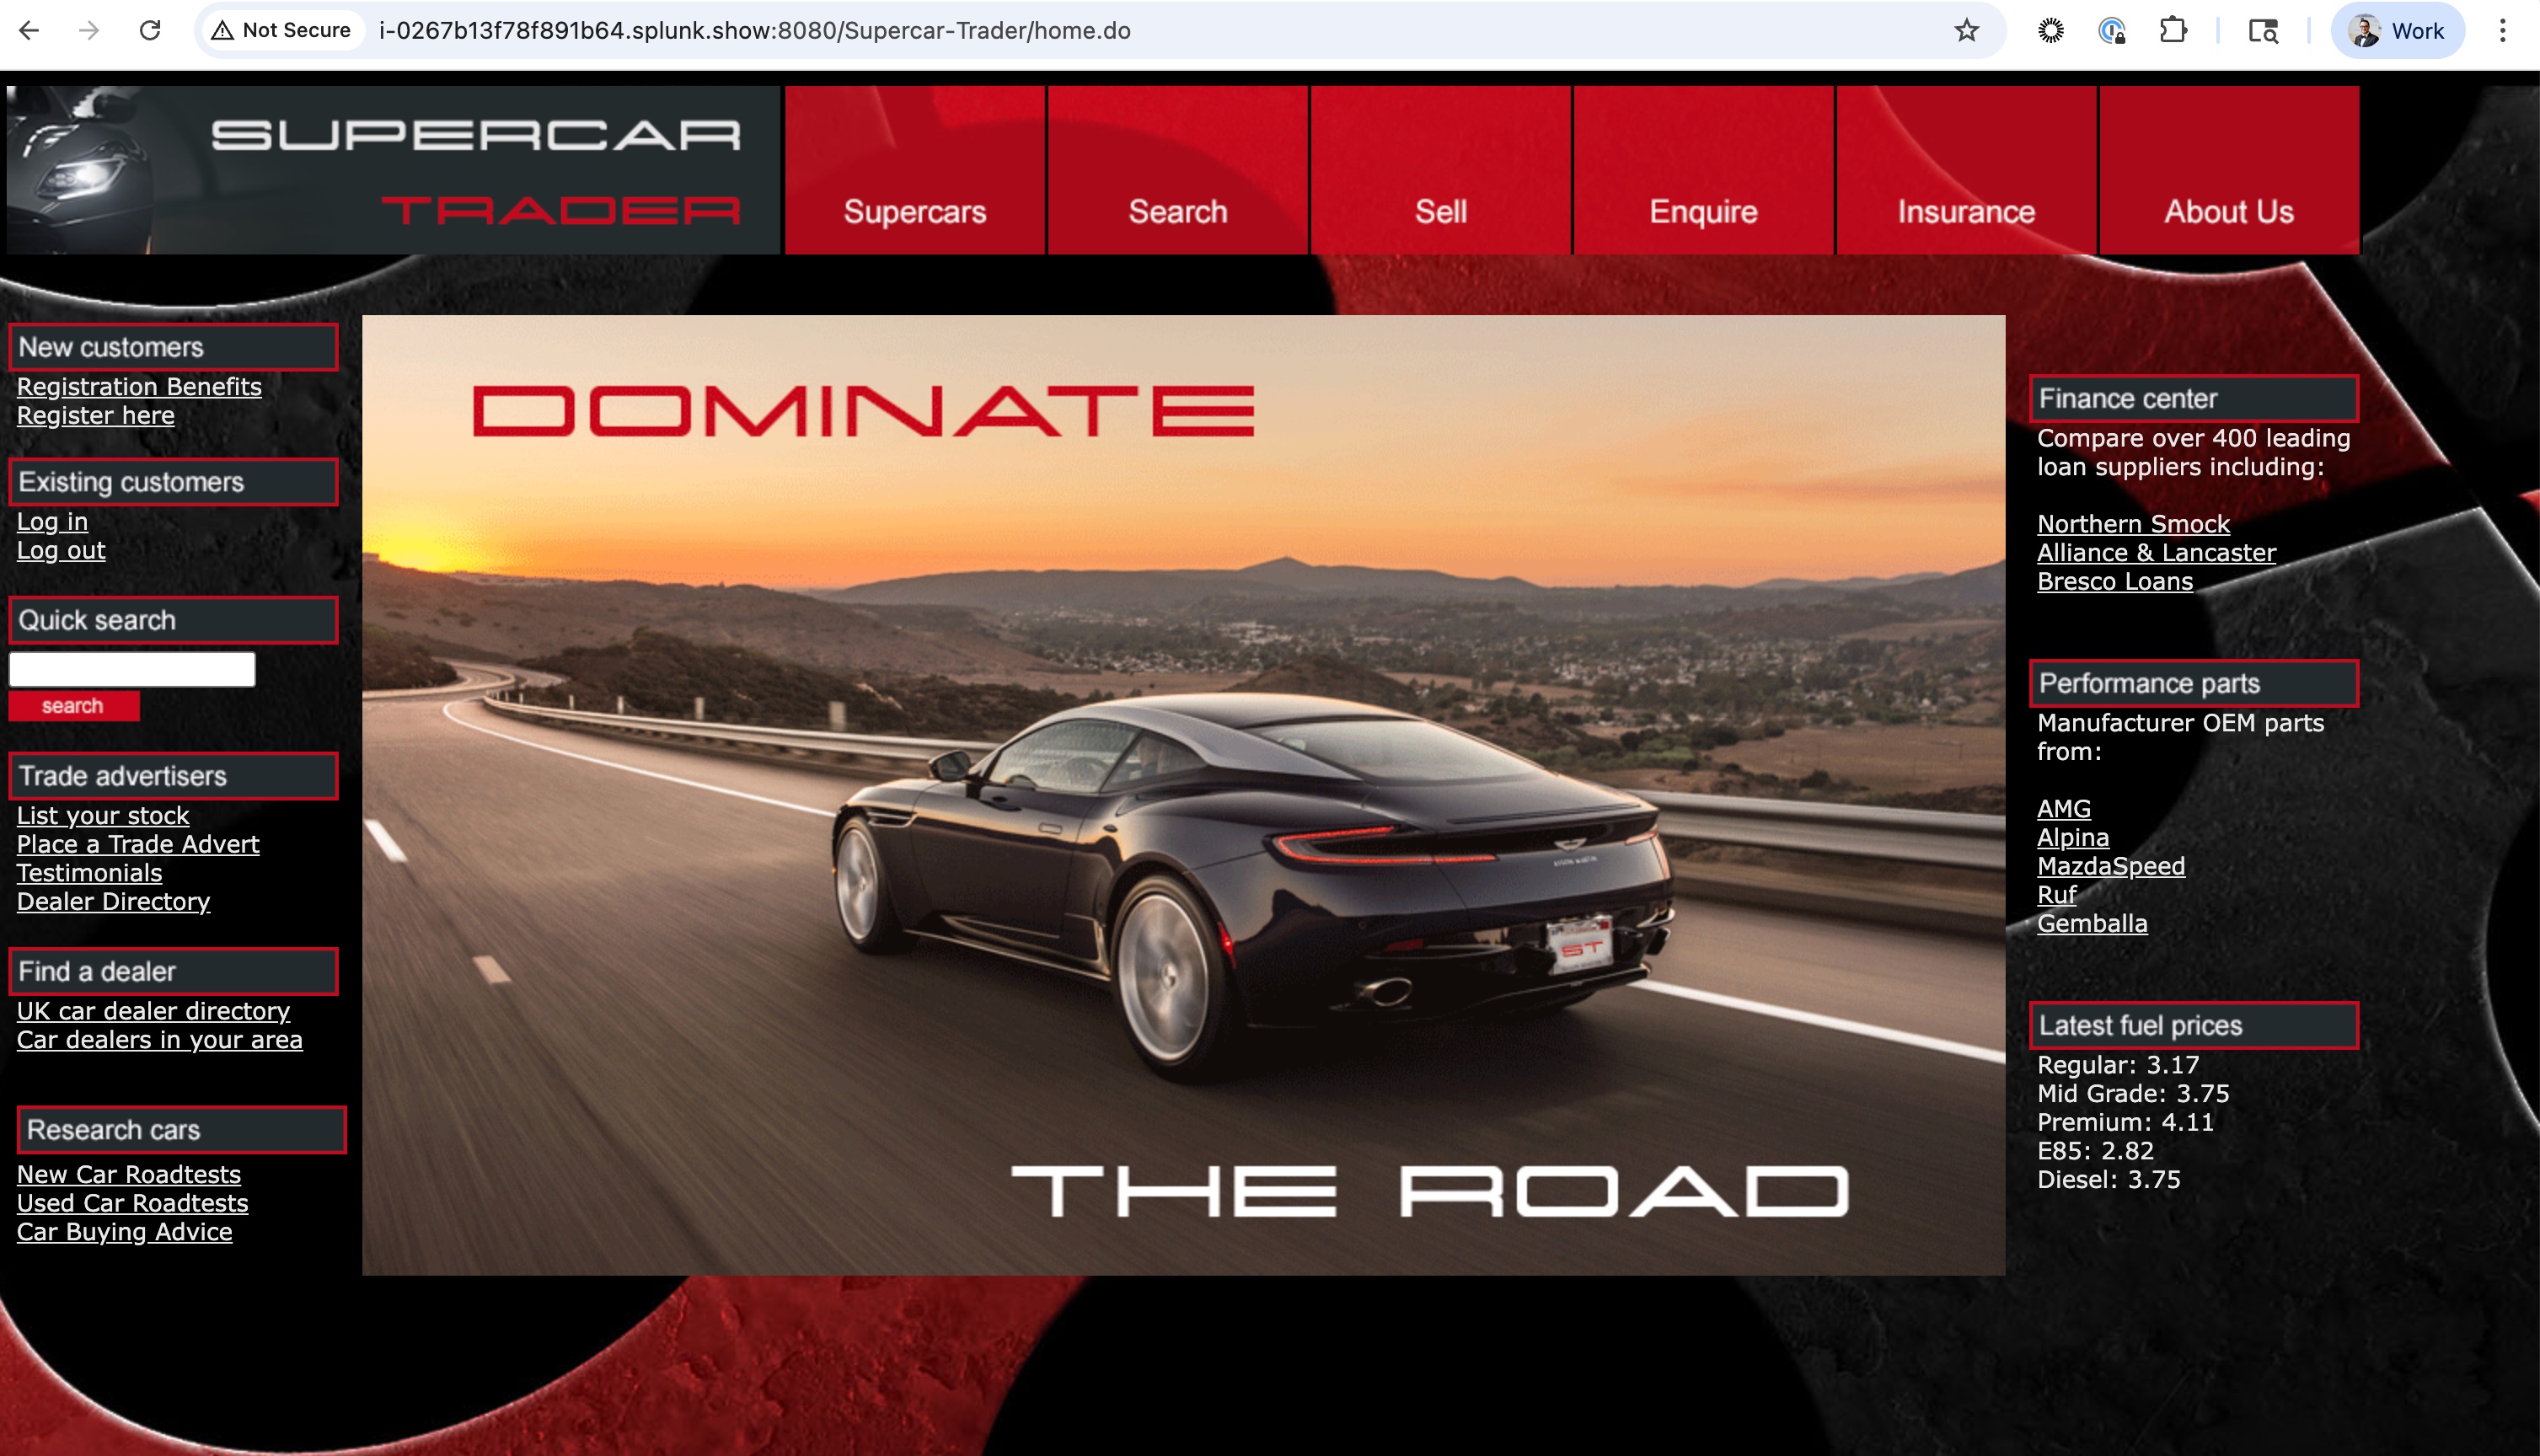
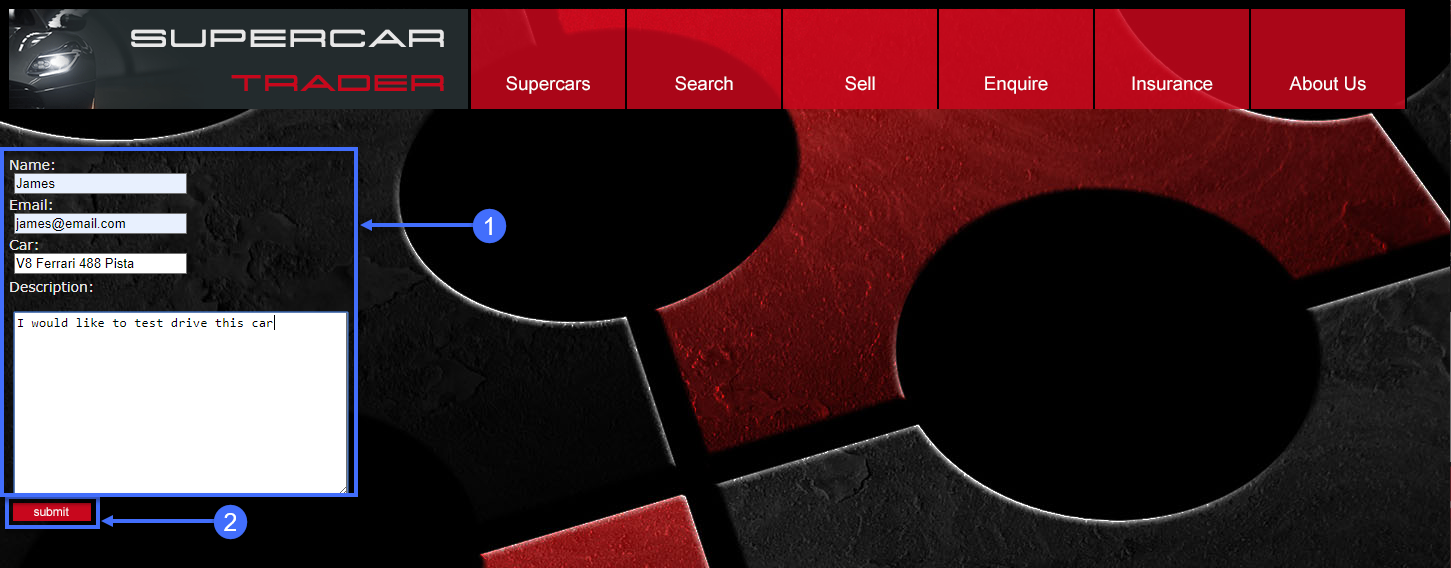
Open the main page of the app with your web browser. In the example URL below, substitute the IP Address or fully qualified domain name of your Application VM.
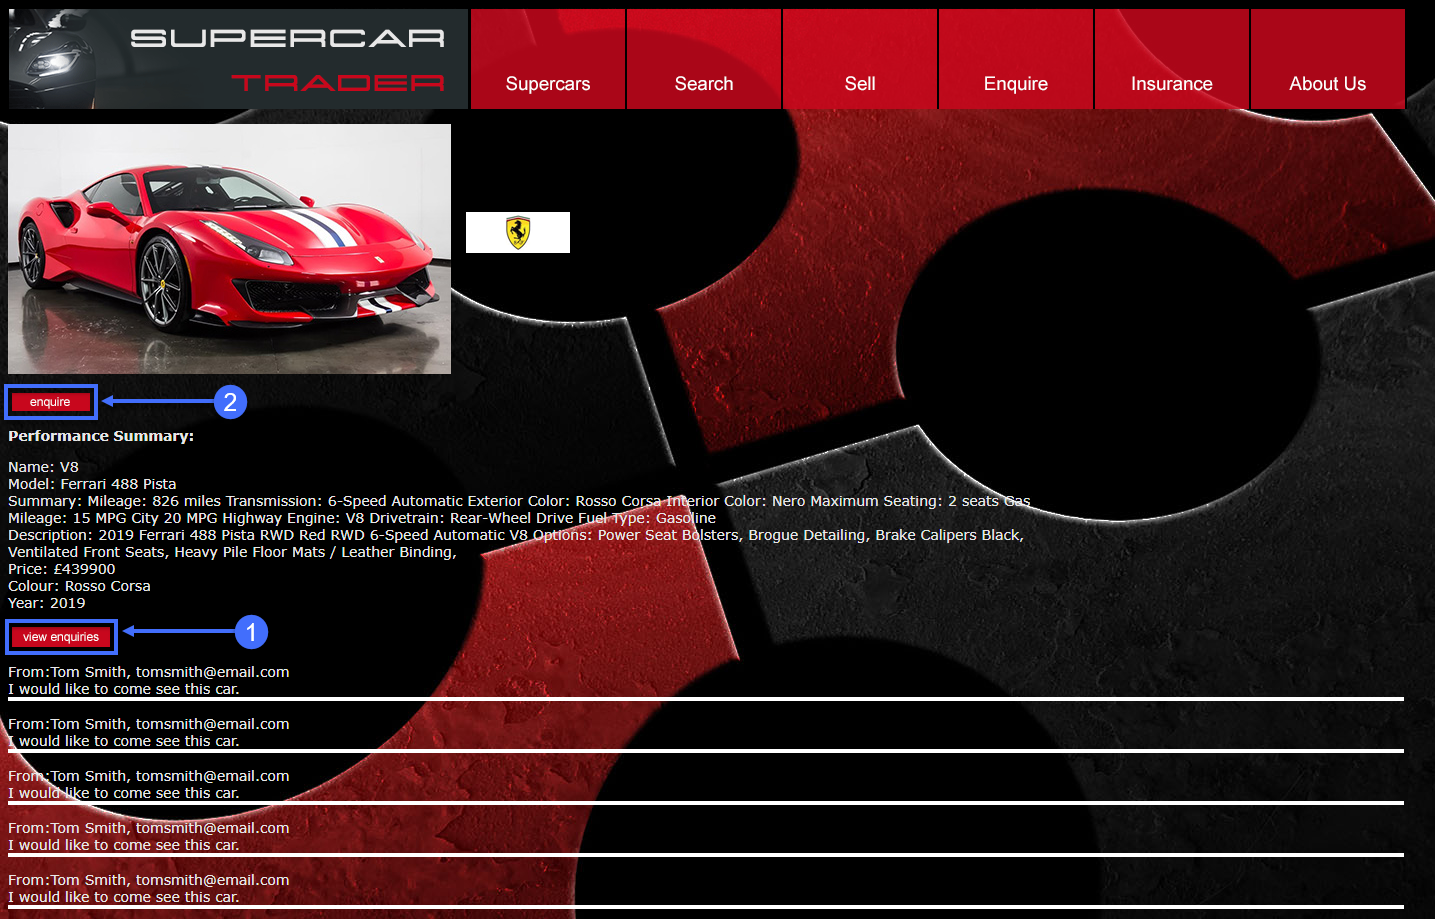
Complete the fields on the enquiry form with appropriate data.
Click Submit.
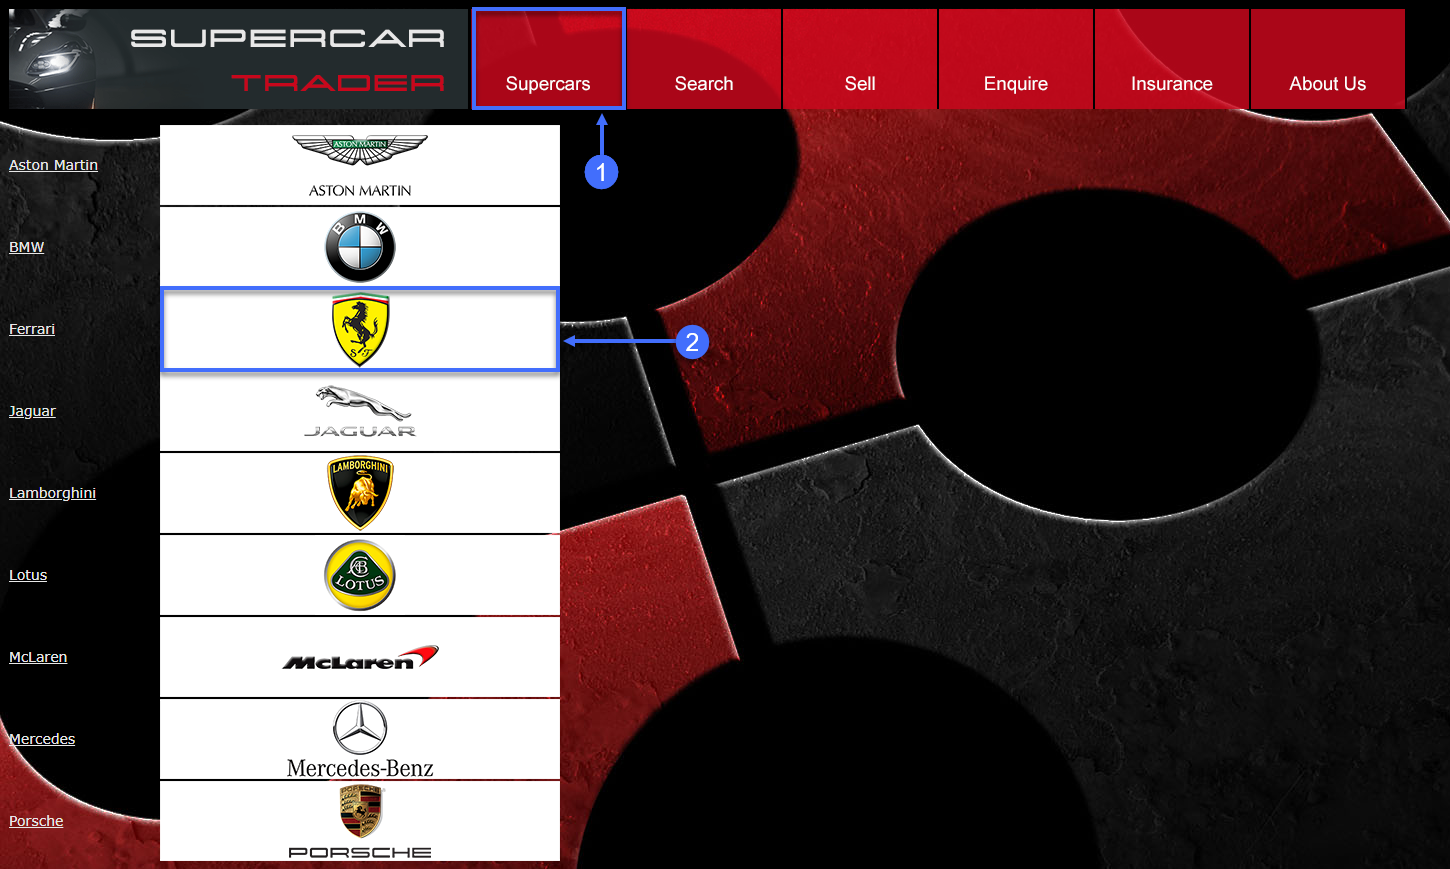
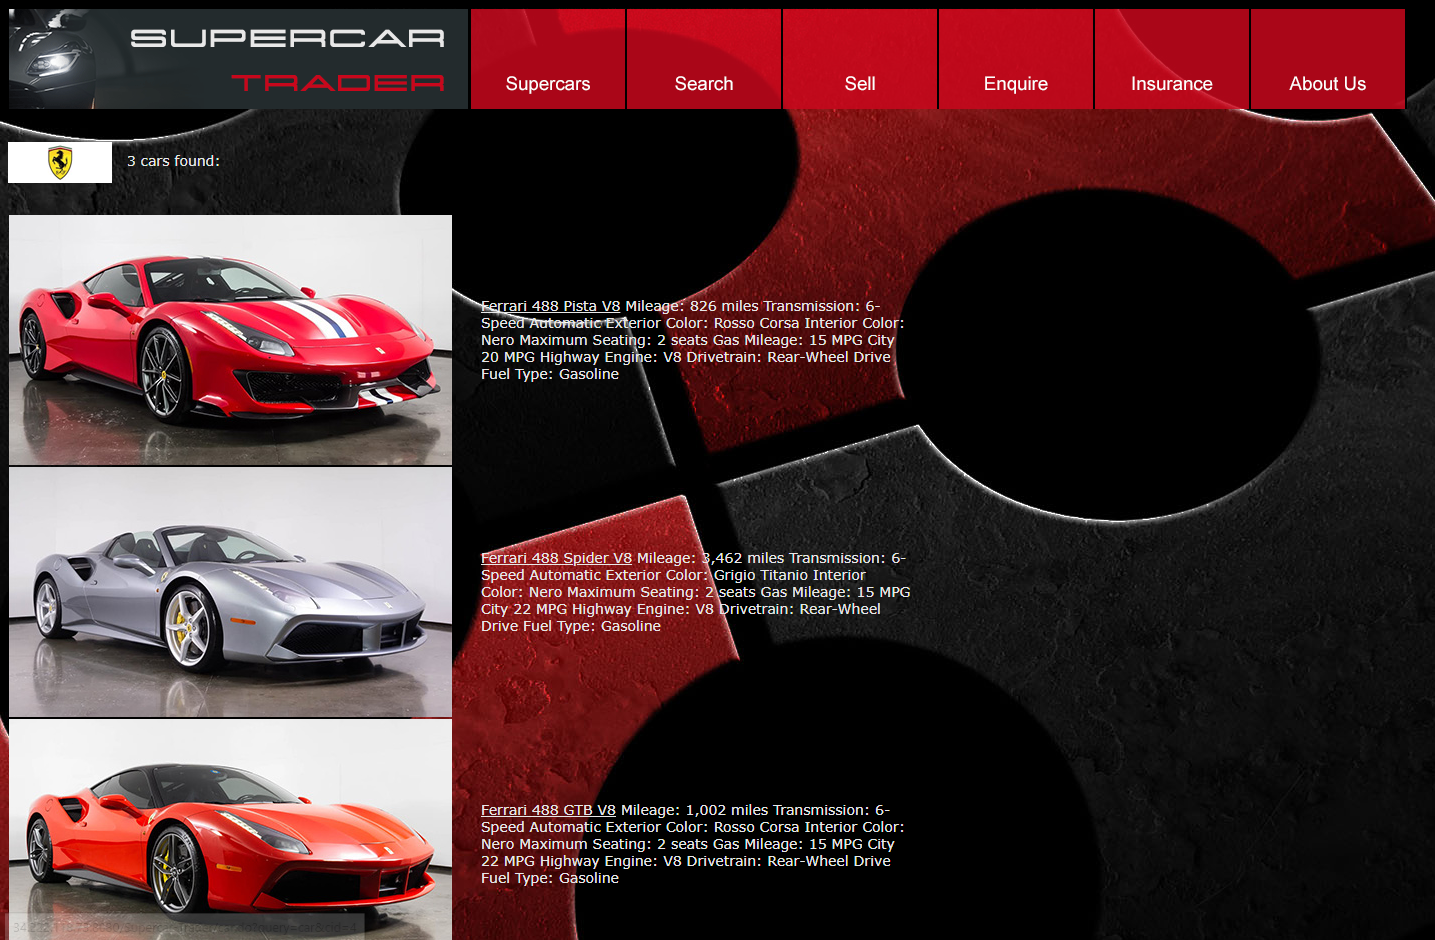
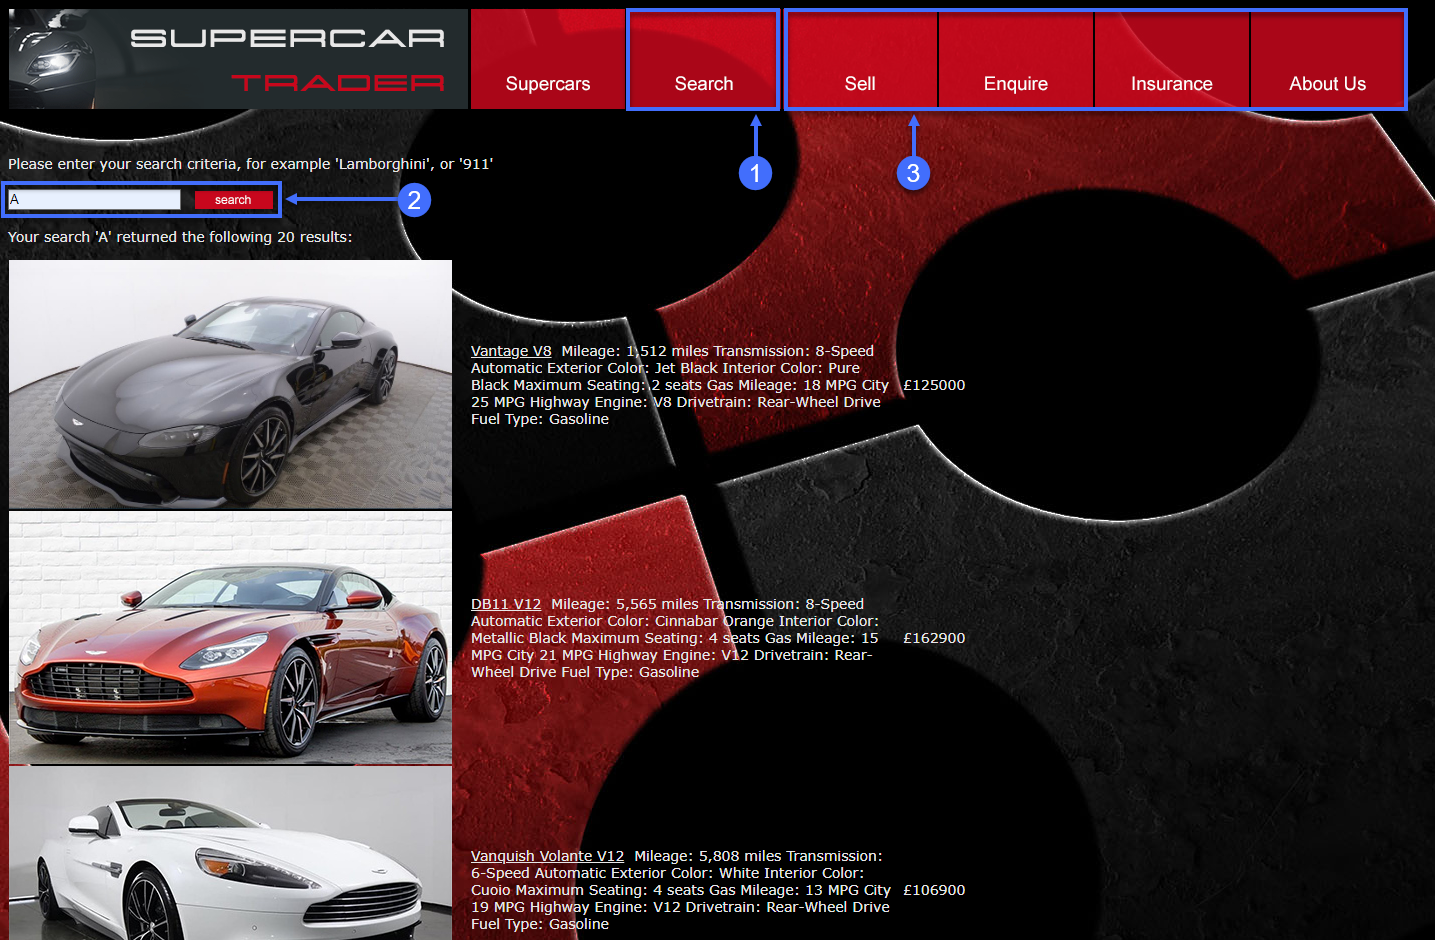
Search for cars and continue browsing the site.
Click on the Search tab on the top menu.
Type the letter A into the search box and click Search.
Click on the remaining tabs to explore the web site.
Monitor and Troubleshoot - Part 2
2 minutes
In this exercise you will complete the following tasks:
Review the Browser Session you created.
Review the Pages & AJAX Requests Dashboard.
Review the Dashboard for a specific Base Page.
Troubleshoot a Browser Snapshot.
Review the Browser Session you created
You can think of sessions as a time-based context to analyze a user’s experience interacting with an application. By examining browser sessions, you can understand how your applications are performing and how users are interacting with them. This enables you to better manage and improve your application, whether that means modifying the UI or optimizing performance on the server side.
Navigate to the Sessions dashboard and find the browser session that you created in the last exercise from navigating the pages of the web application. Follow these steps.
Note
You may need to wait ten minutes after you hit the last page in the web application to see your browser session show up in the sessions list. If you don’t see your session after ten minutes, this could be due to a problem with the Java Agent version in use.
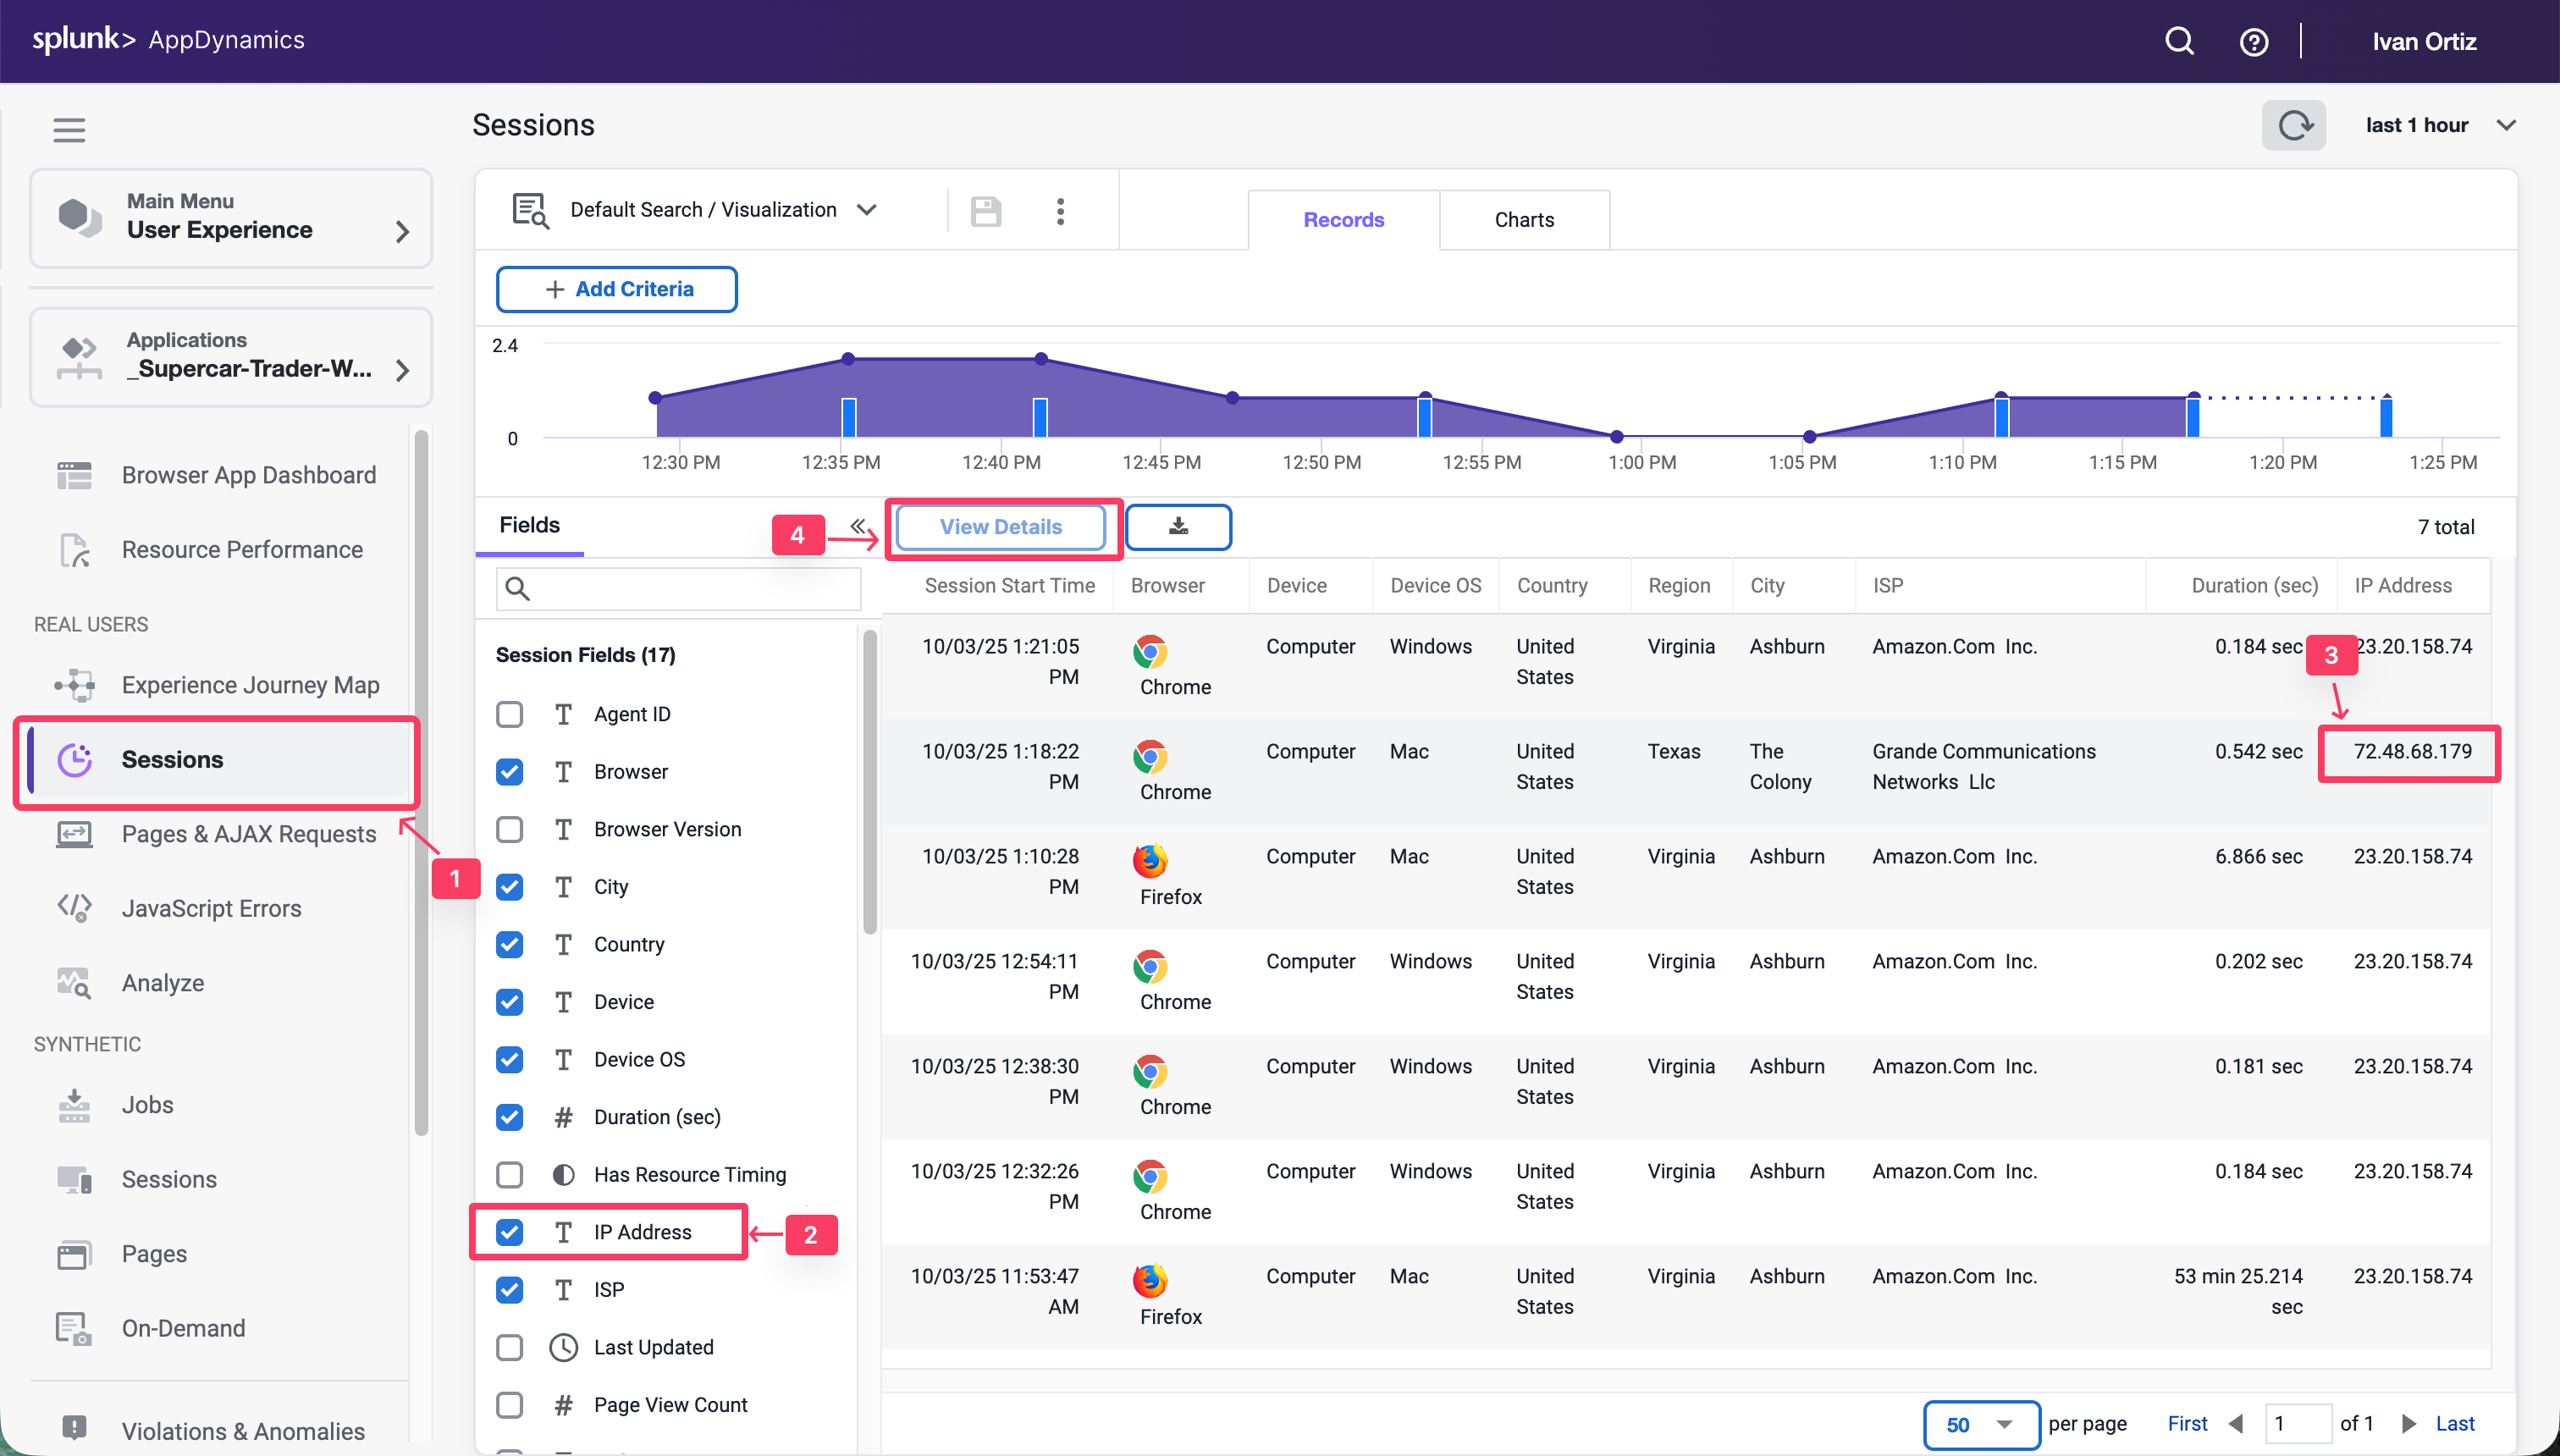
Click the Sessions tab on the left menu.
Check the IP Address in the Session Fields list.
Find the session you created by your IP Address.
Click on your session, then click View Details.
Once you find and open the session you created, follow these steps to explore the different features of the session view.
Note: Your session may not have a View Snapshot link in any of the pages (as seen in step five). You will find a session that has one to explore later in this exercise.
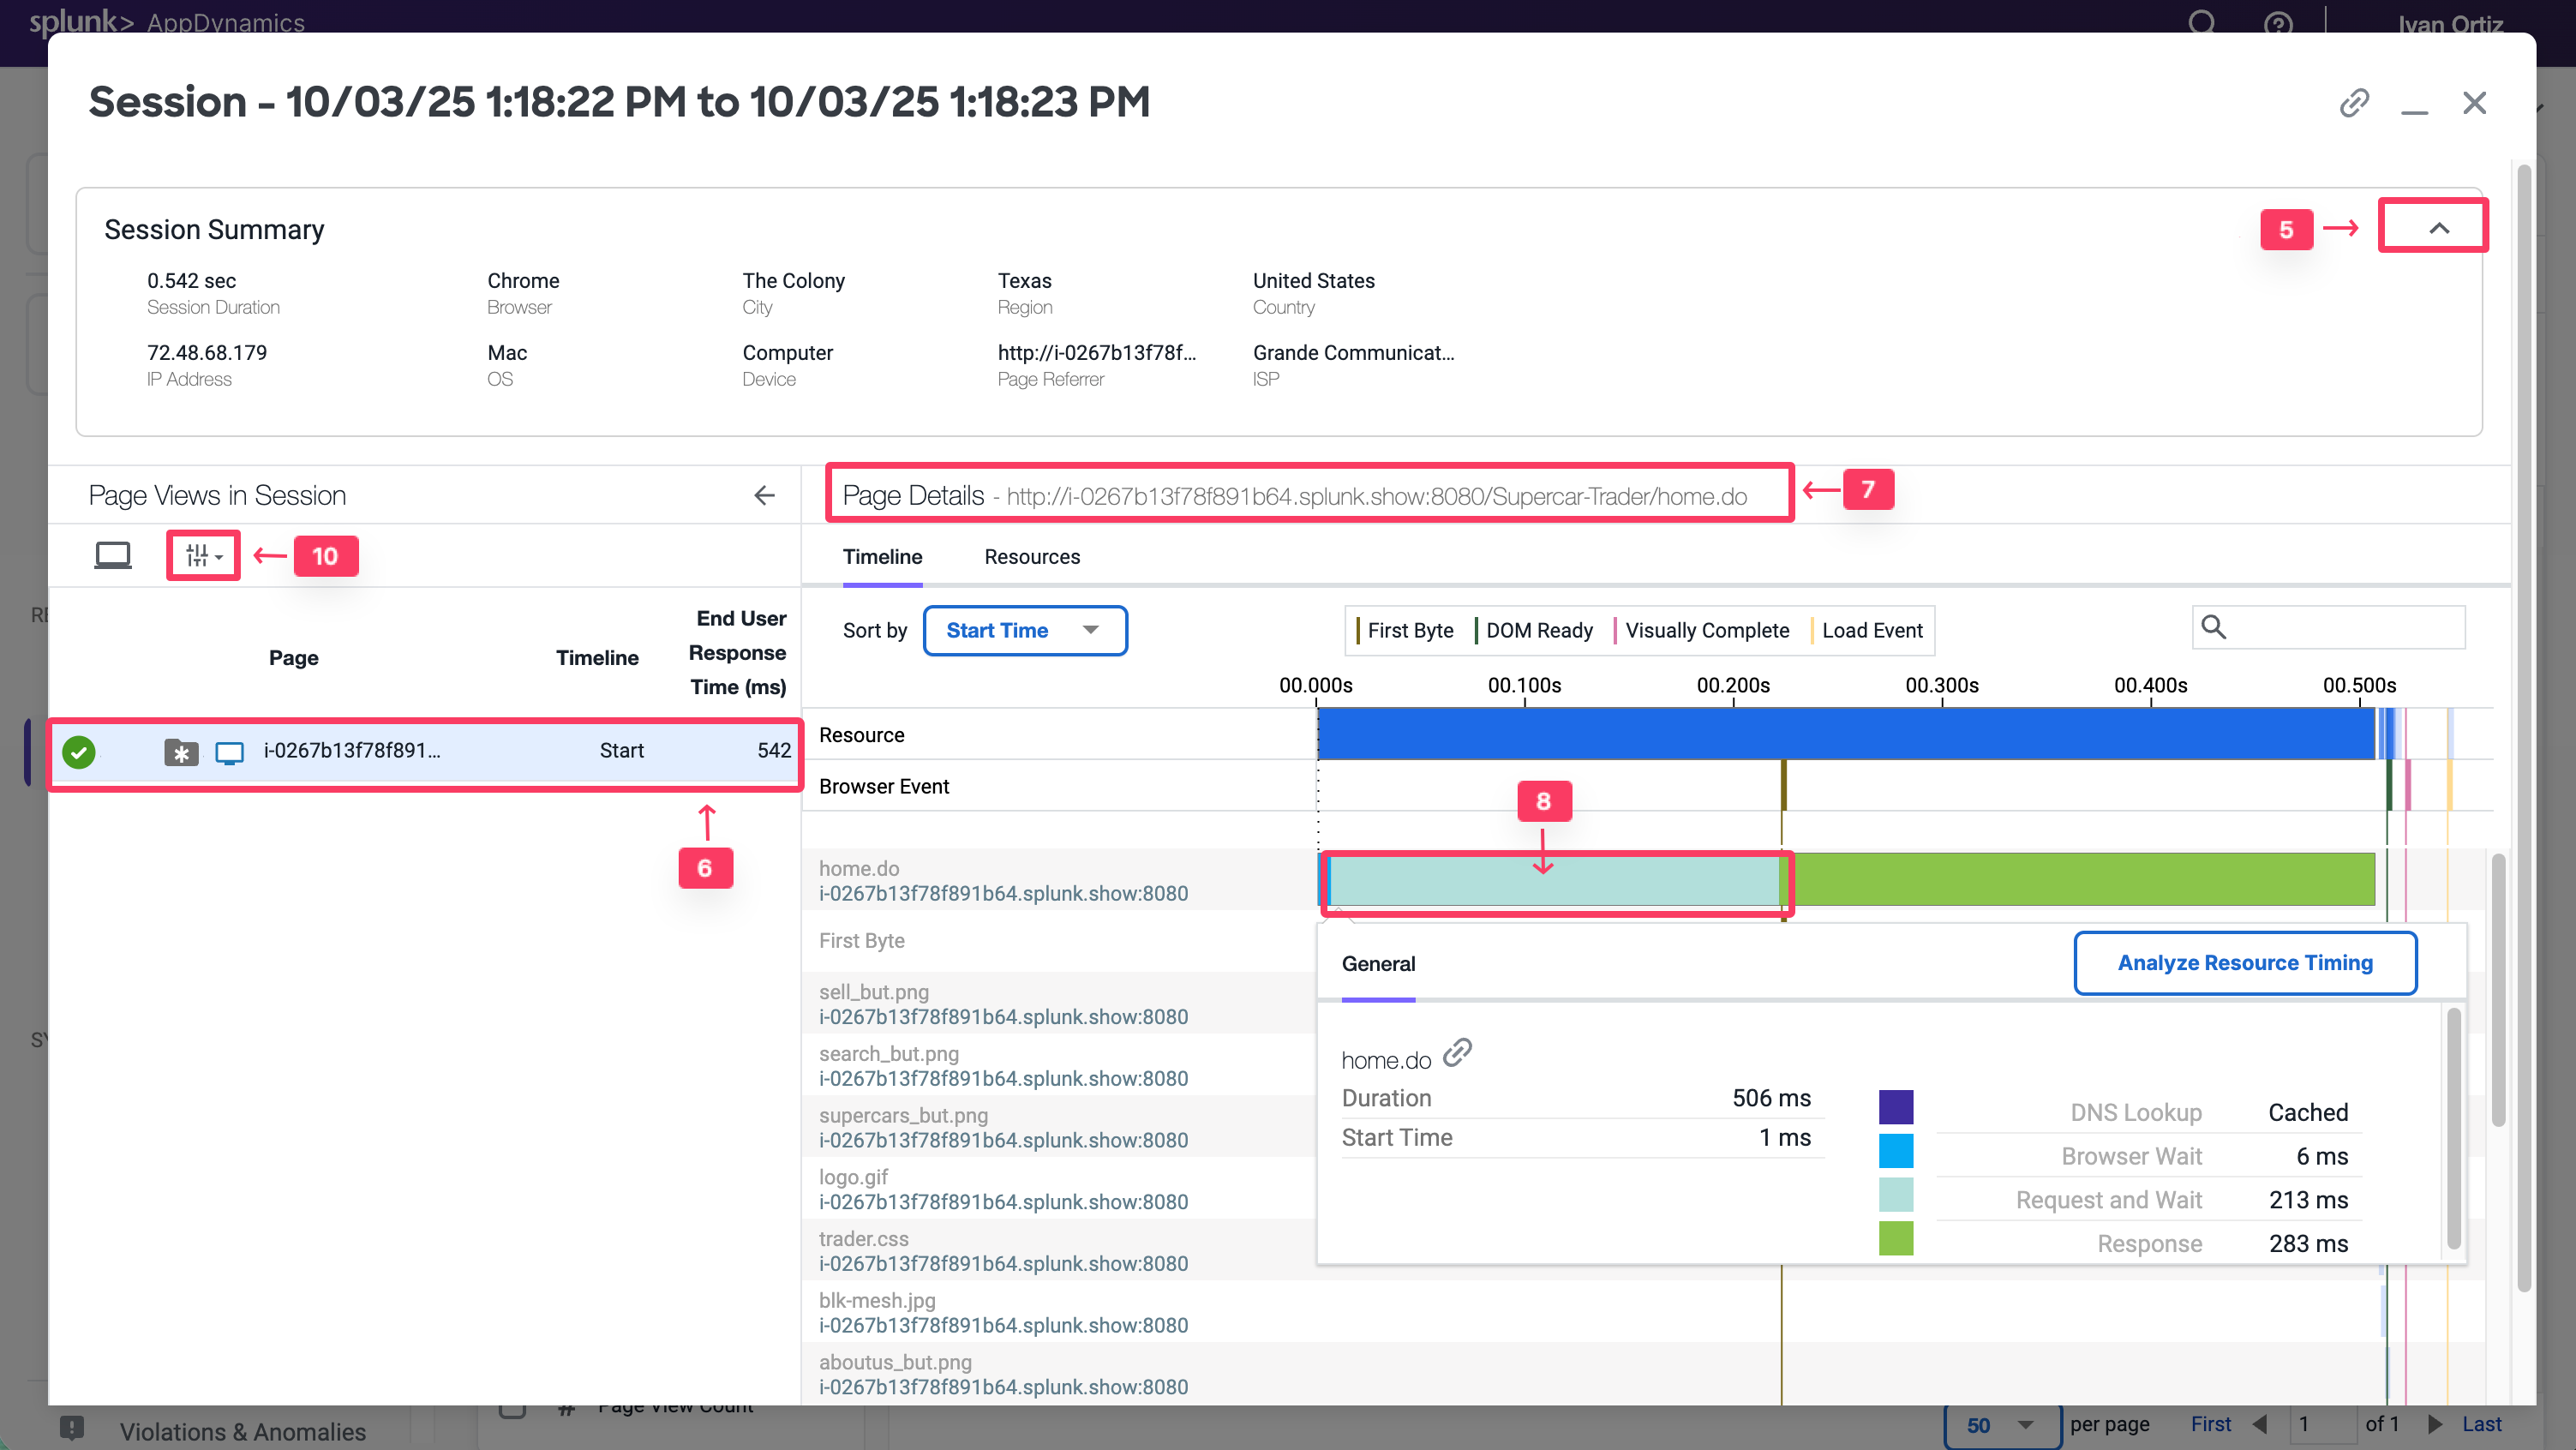
Click the Session Summary link to view the summary data.
When you click on a page listed on the left, you see the details of that page on the right.
You can always see the full name of the page you have selected in the left list.
Click on a horizontal blue bar in the waterfall view to show the details of that item.
Some pages may have a link to a correlated snapshot that was captured on the server side.
Click the configuration icon to change the columns shown in the pages list.
You can read more about the Browser RUM Sessions here.
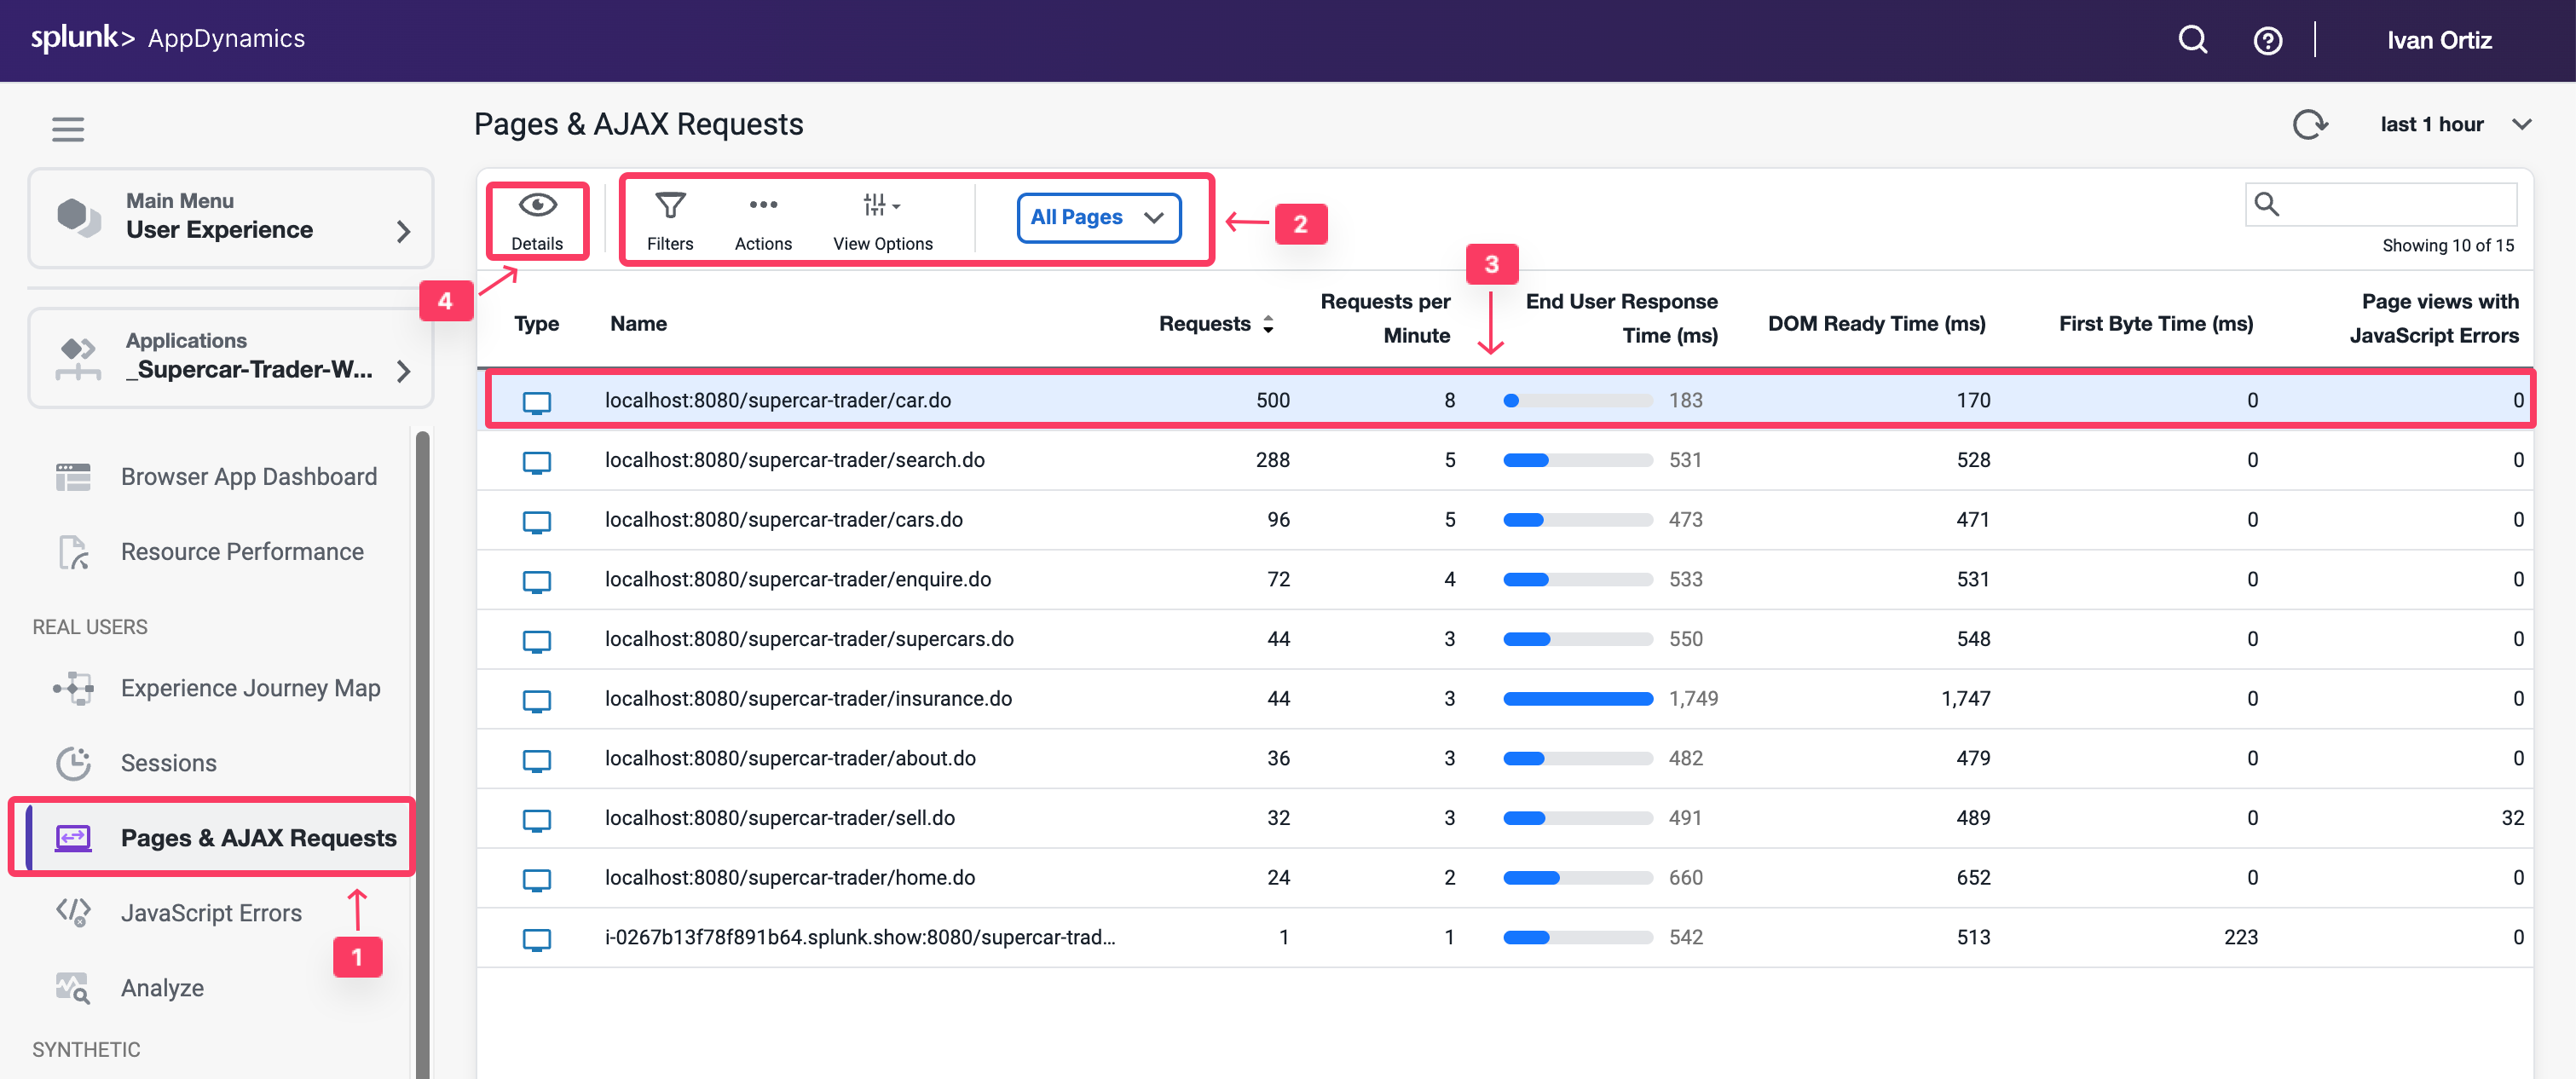
Review the Pages & AJAX Requests Dashboard
Navigate to the Pages & AJAX Requests dashboard, review the options there, and open a specific Base Page dashboard by following these steps.
Click the Pages & AJAX Requests tab on the left menu.
Explore the options on the toolbar.
Click the localhost:8080/supercar-trader/car.do page.
Click Details to open the Base Page dashboard.
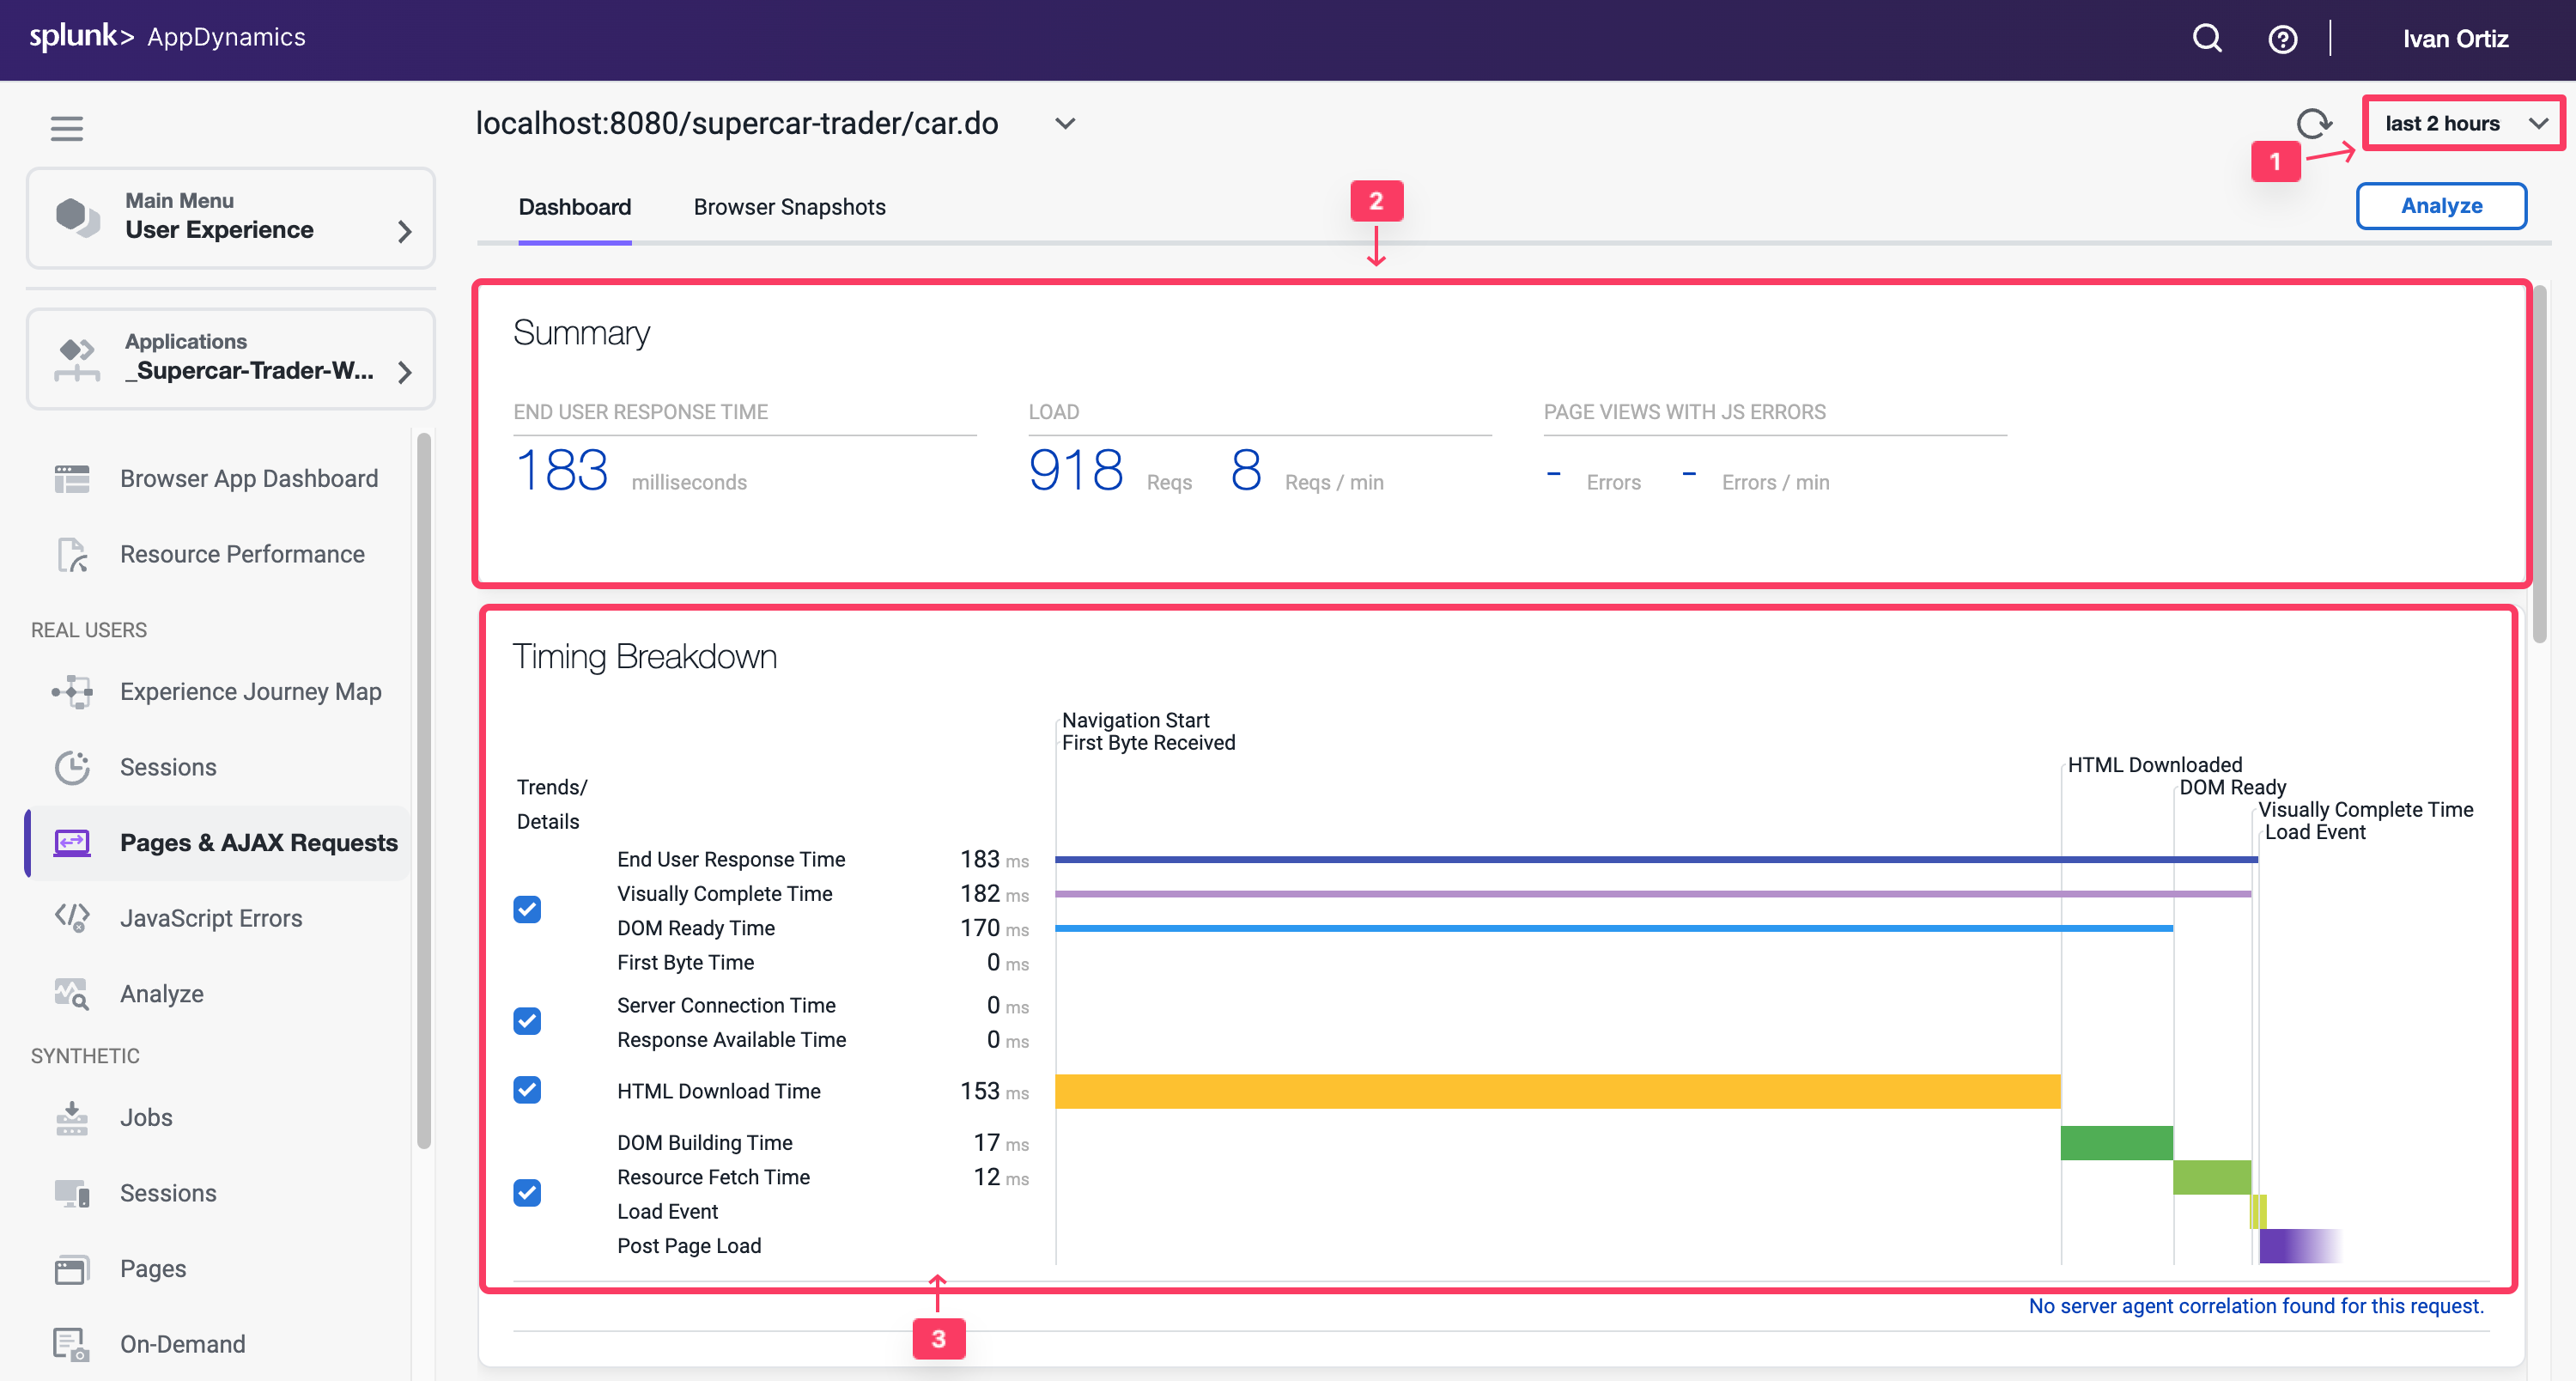
Review the Dashboard for a specific Base Page
At the top of the Base Page dashboard you will see key performance indicators, End User Response Time, Load, Cache Hits, and Page Views with JS errors across the period selected in the timeframe dropdown from the upper-right side of the Controller UI. Cache Hits indicates a resource fetched from a cache, such as a CDN, rather than from the source.
In the Timing Breakdown section you will see a waterfall graph that displays the average times needed for each aspect of the page load process. For more information on what each of the metrics measures, hover over its name on the left. A popup appears with a definition. For more detailed information, see Browser RUM Metrics.
Review the details for the localhost:8080/supercar-trader/car.do Base Page by following these steps.
Change the timeframe dropdown to last 2 hours.
Explore the key performance indicators.
Explore the metrics on the waterfall view.
Use the vertical scroll bar to move down the page.
Explore the graphs for all of the KPI Trends.
You can read more about the Base Page dashboard here.
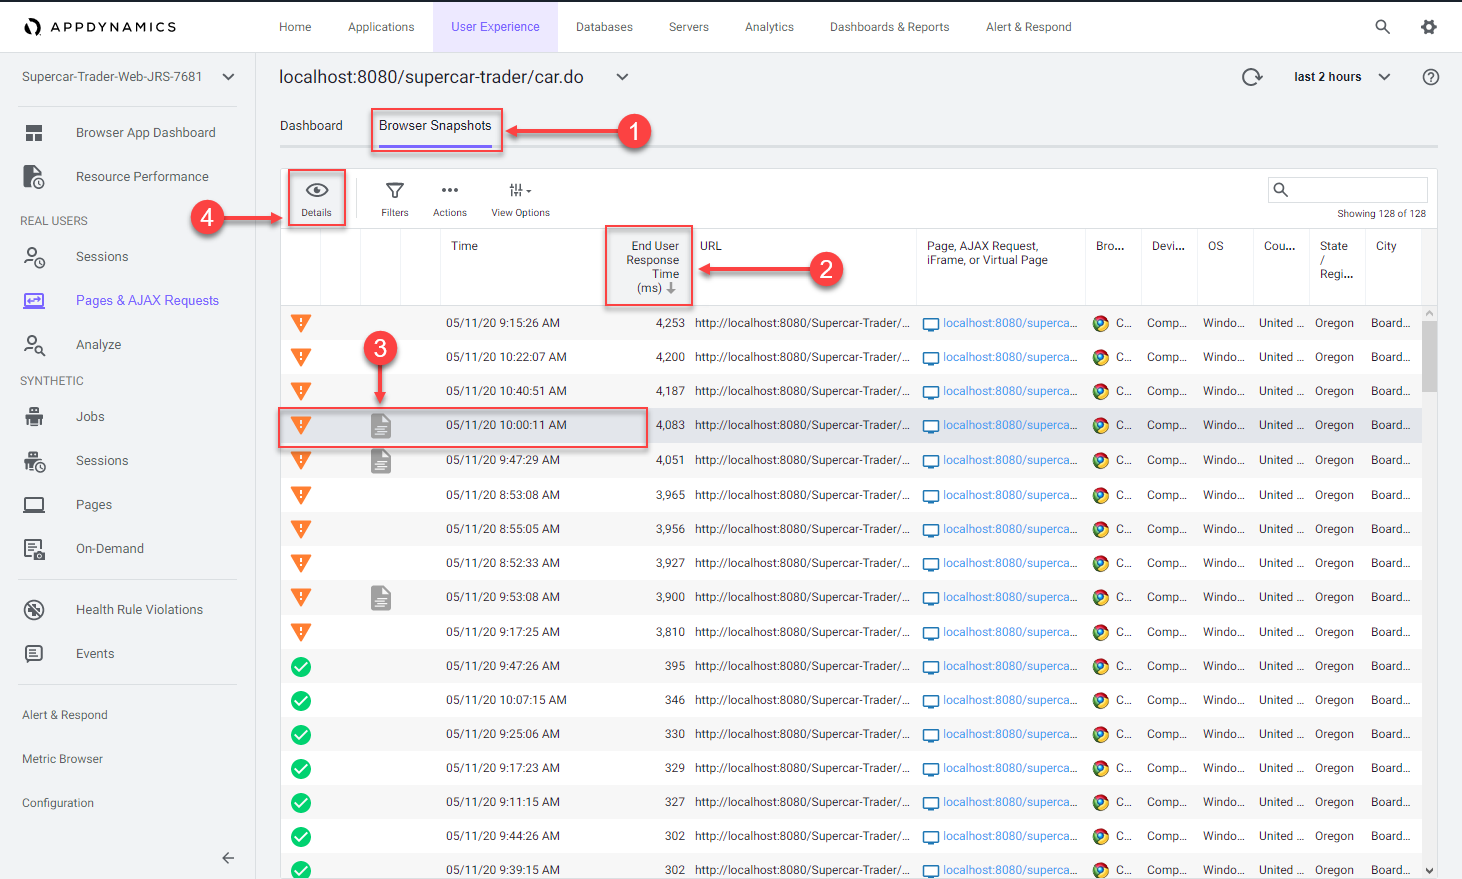
Troubleshoot a Browser Snapshot
Note
Your application may not have any browser snapshots as such you will not be able to follow the entire workflow. You can switch to the browser application AD-Ecommerce-Browser if you would like to follow this section with a different demo application
Navigate to the Browser Snapshots list dashboard and open a specific Browser Snapshot by following these steps.
Click the Browser Snapshots option.
Click the End User Response Time column header twice to show the largest response times at the top.
Click on a browser snapshot that has a gray or blue icon in the third column from the left.
Click Details to open the browser snapshot.
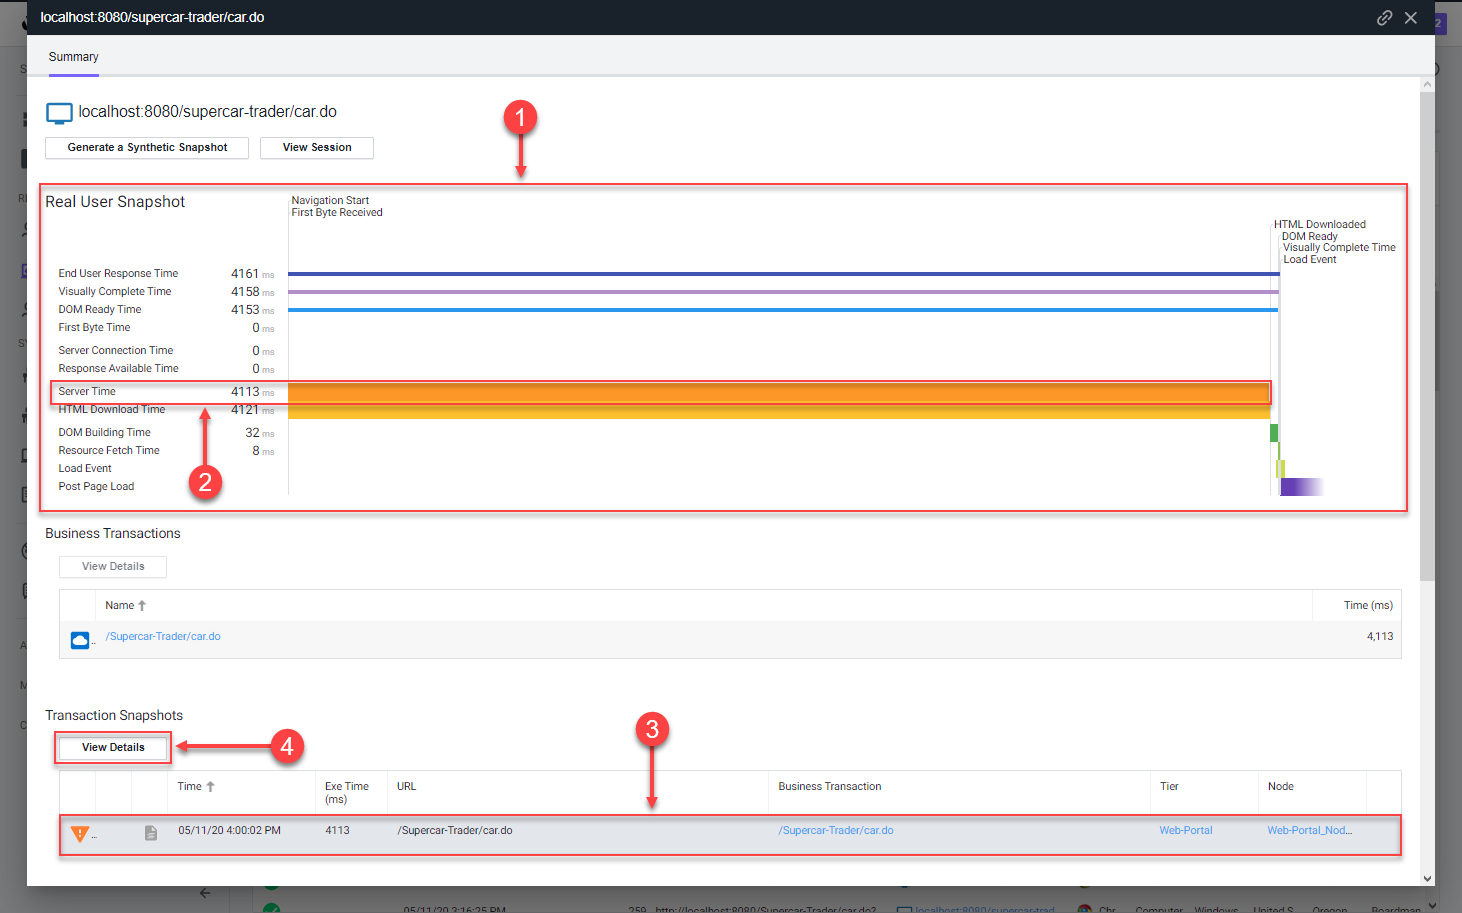
Once you open the browser snapshot, review the details and find root cause for the large response time by following these steps.
Review the waterfall view to understand where the response time was impacted.
Notice the extended Server Time metric. Hover over the label for Server Time to understand its meaning.
Click the server side transaction that was automatically captured and correlated to the browser snapshot.
Click View Details to open the associated server side snapshot.
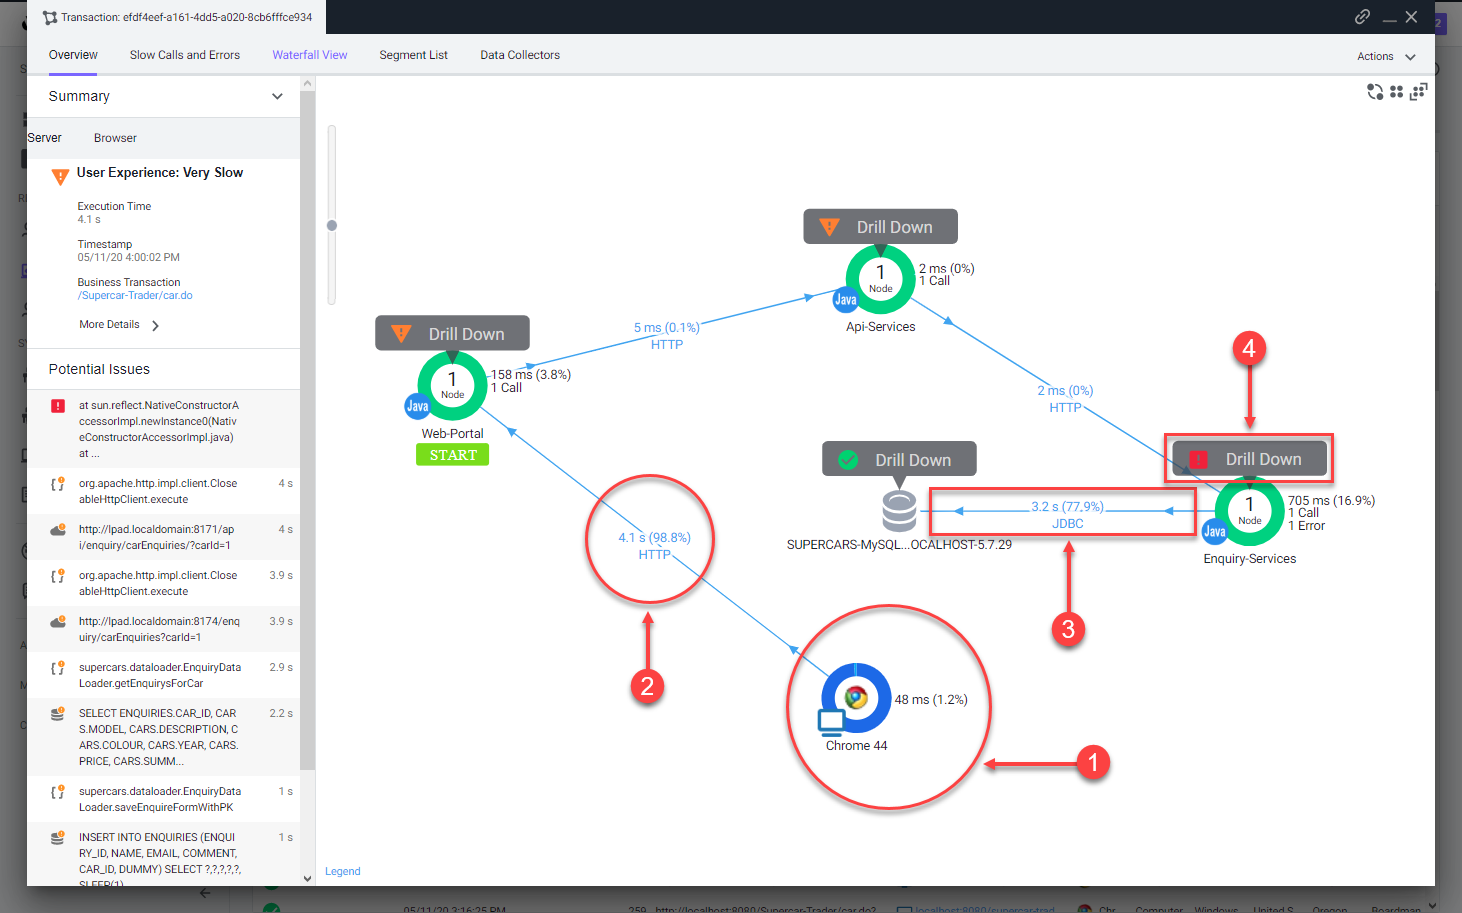
Once you open the correlated server side snapshot, use the steps below to pinpoint the root cause of the performance degredation.
You can see that the percentage of transaction time spent in the browser was minimal.
The timing between the browser and the Web-Portal Tier represents the initial connection from the browser until the full response was returned.
You will see that the JDBC call was taking the most time.
Click Drill Down to look at the code level view inside the Enquiry-Services Tier.
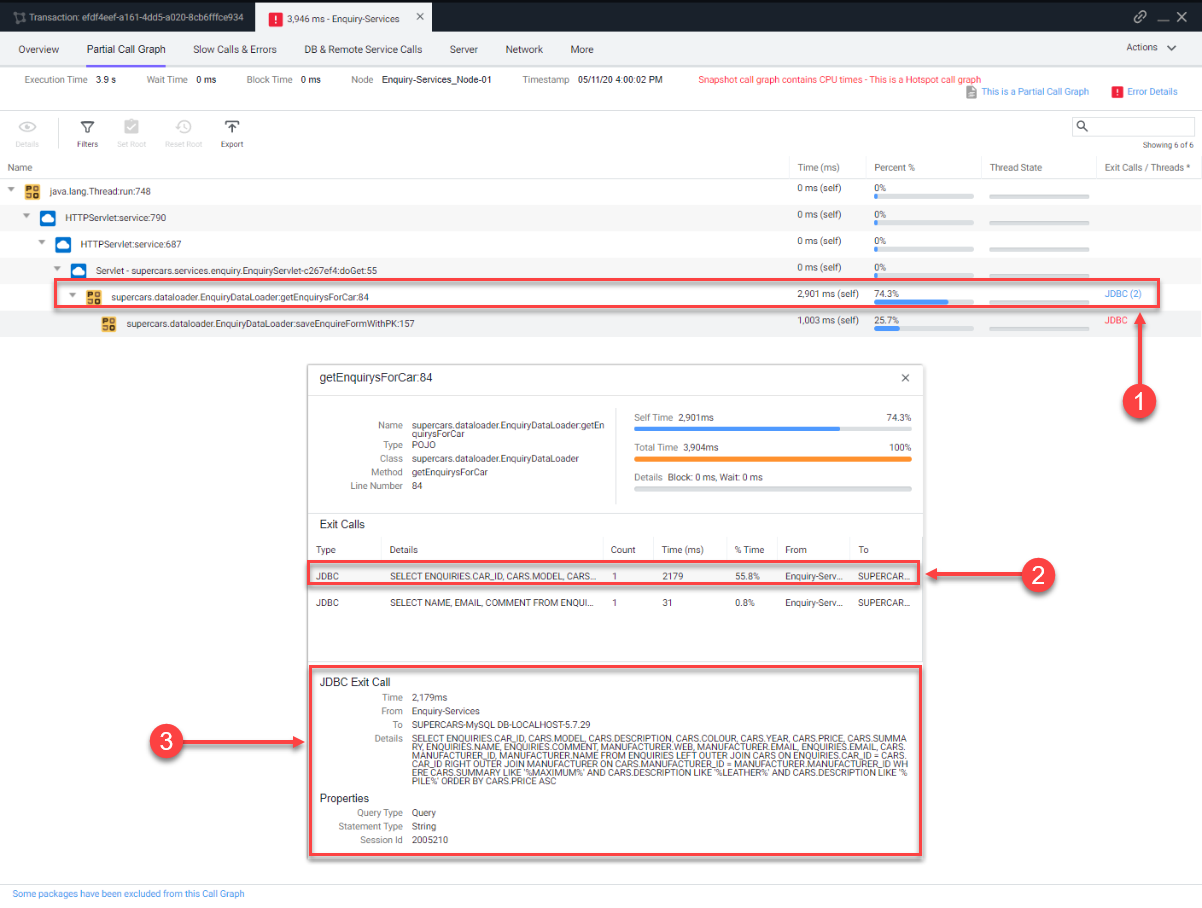
Once you open the snapshot segment for the Enquiry-Services Tier, you can see that there were JDBC calls to the database that caused issues with the transaction.
Click the JDBC link with the largest time to open the detail panel for the JDBC calls.
The detail panel for the JDBC exit calls shows the specific query that took most of the time.
You can see the full SQL statement along with the SQL parameter values
You can read more about the Browser Snapshots here and here.