In this Lab you learn about AppDynamics Database Visibility Monitoring.
When you have completed this lab, you will be able to:
Download the AppDynamics Database Visibility Agent.
Install the AppDynamics Database Visibility Agent.
Configure a Database Collector in the Controller.
Monitor the health of your databases.
Troubleshoot database performance issues.
Workshop Environment
The lab environment has two hosts:
The first host runs the AppDynamics Controller and will be referred to from this point on as the Controller.
The second host runs the Supercar Trader application used in the labs. It will be the host where you will install the AppDynamics agents and will be referred to from this point on as the Application VM.
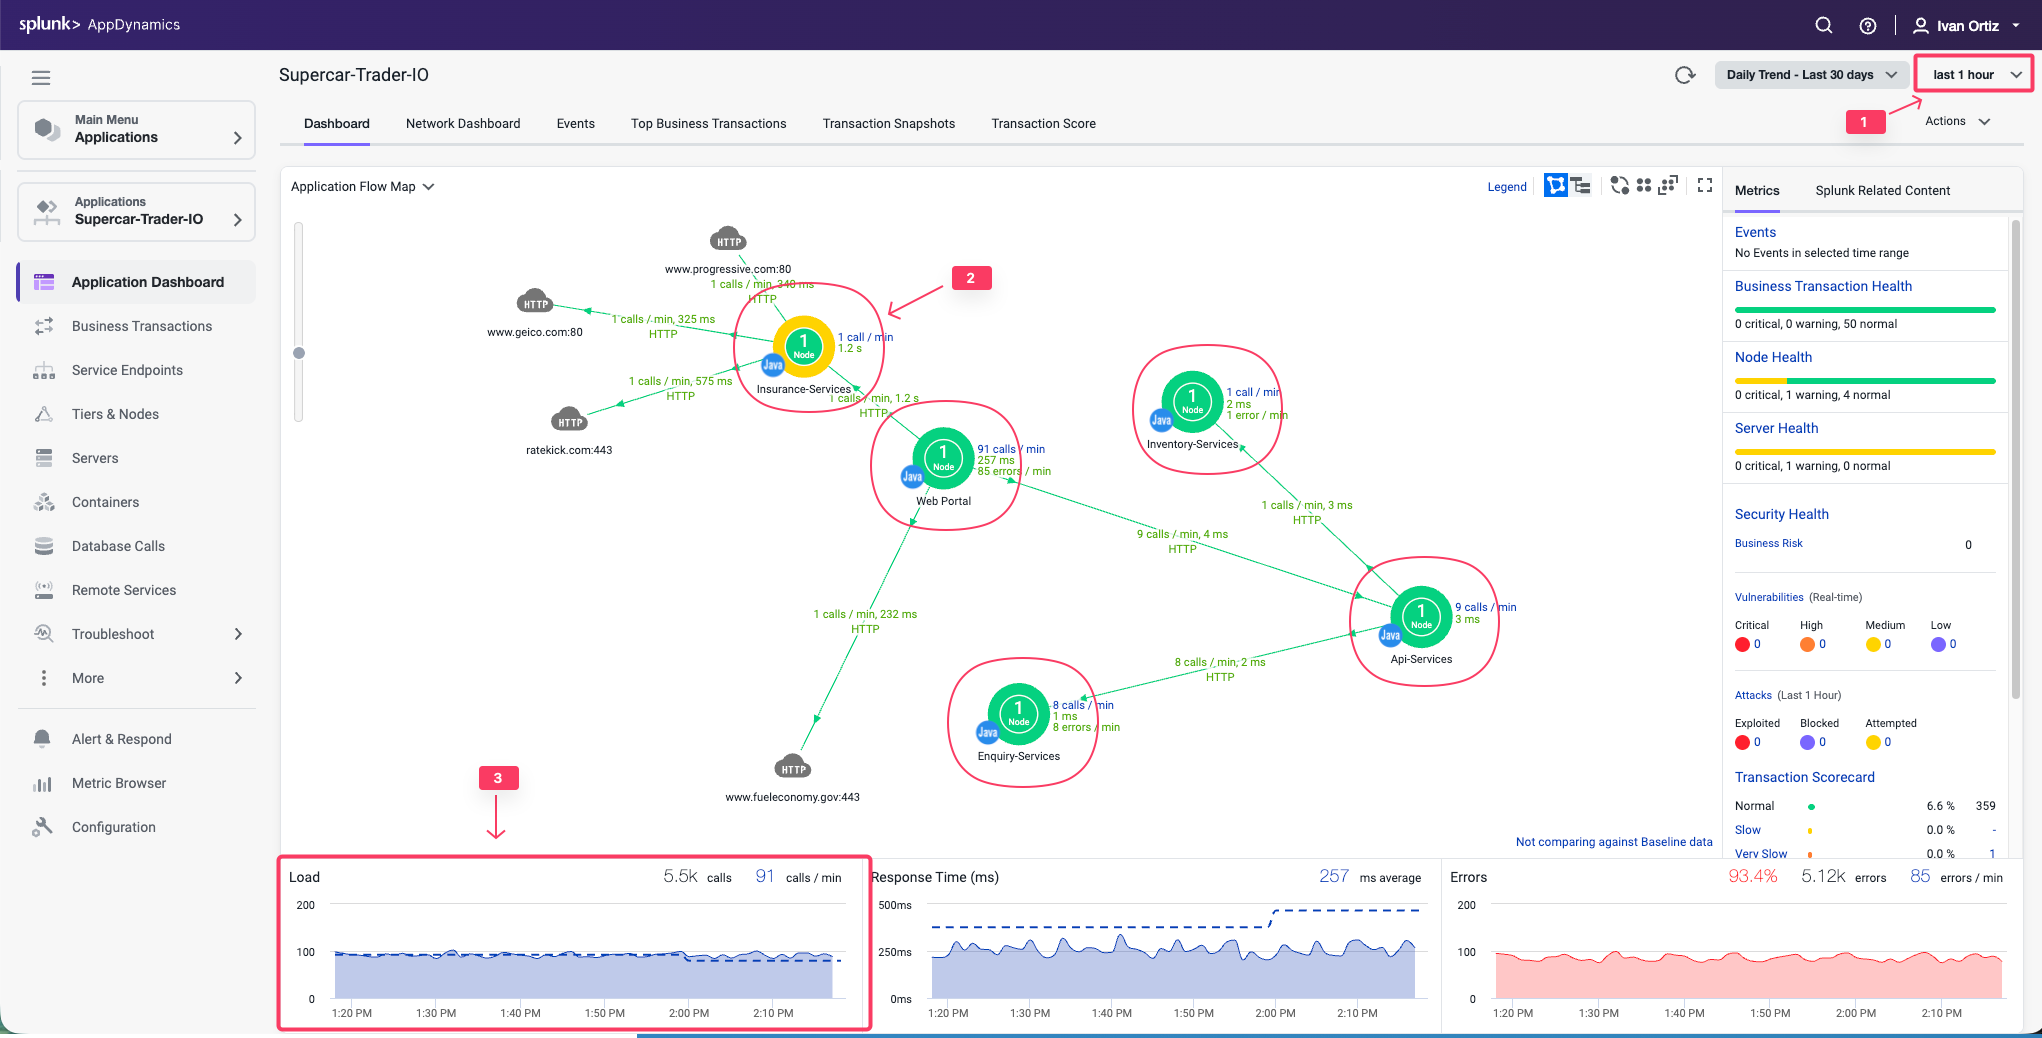
Verify you see the five different Tiers on the flow map.
Verify there has been consistent load over the last 1 hour.
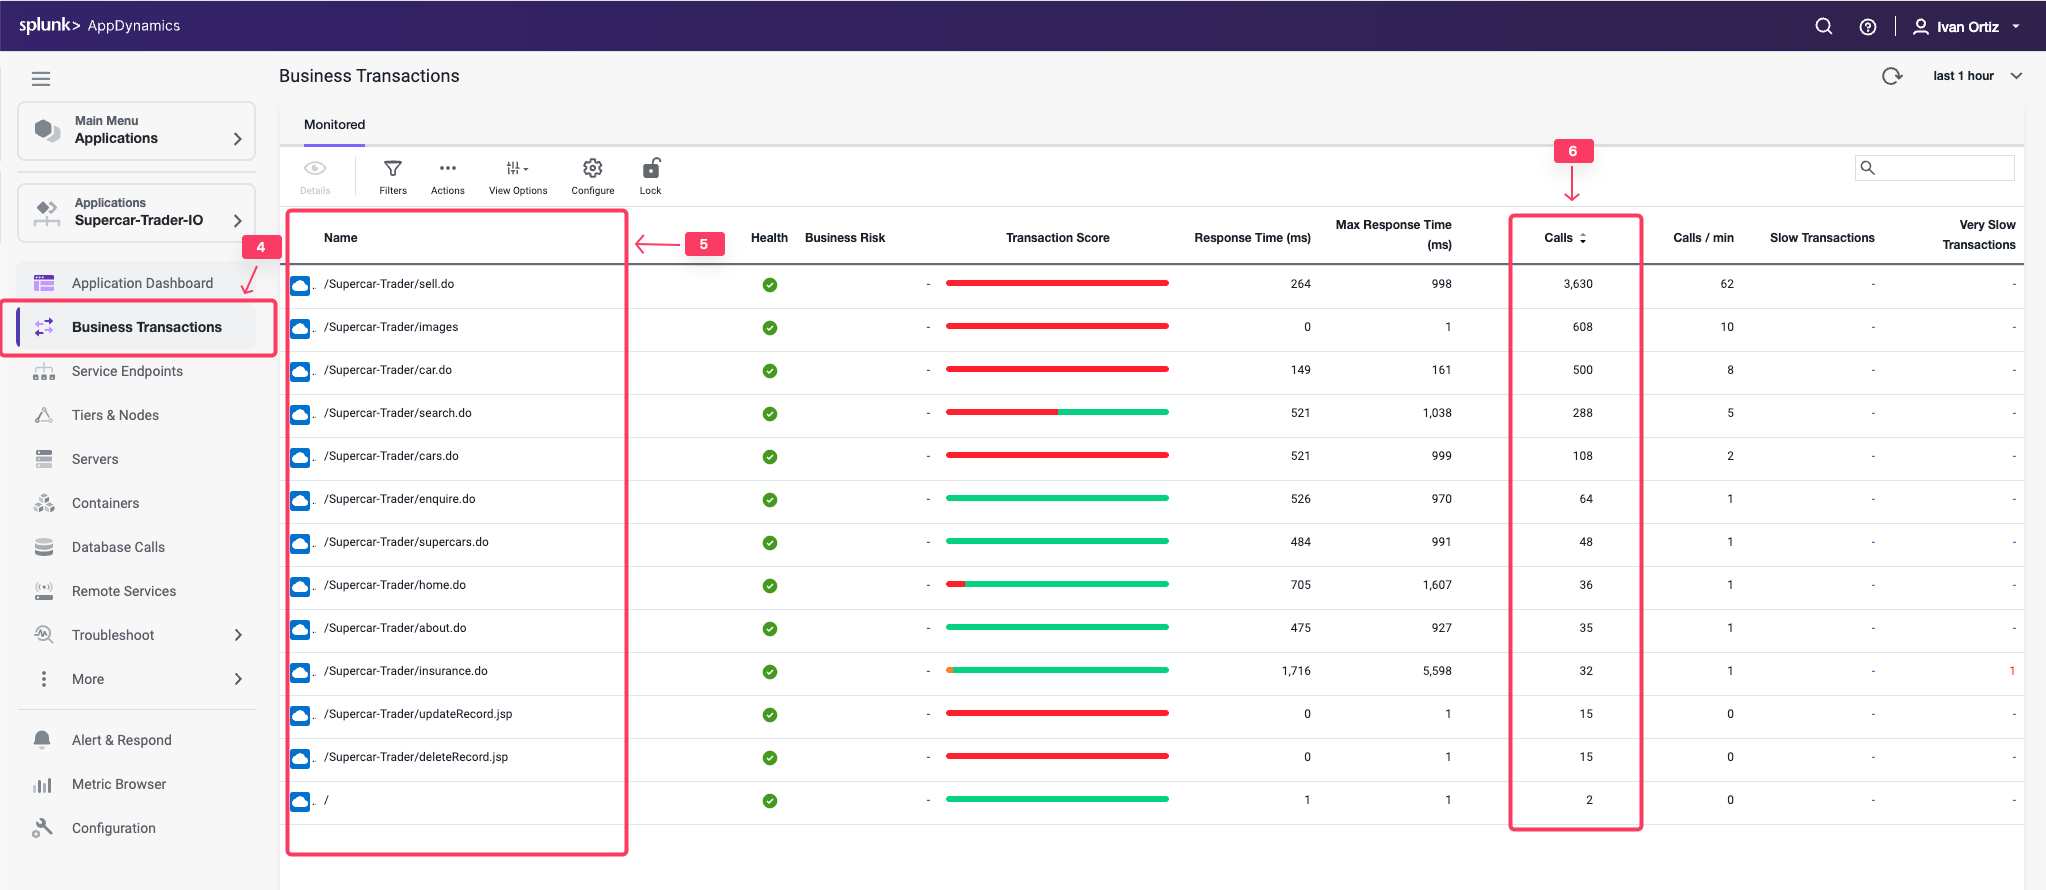
Check the list of business transactions:
Click the Business Transactions option on the left menu.
Verify you see the eleven business transactions seen below.
Verify that they have some number of calls during the last hour.
Note: If you don’t see the Calls column, you can click the View Options toolbar button to show that column.
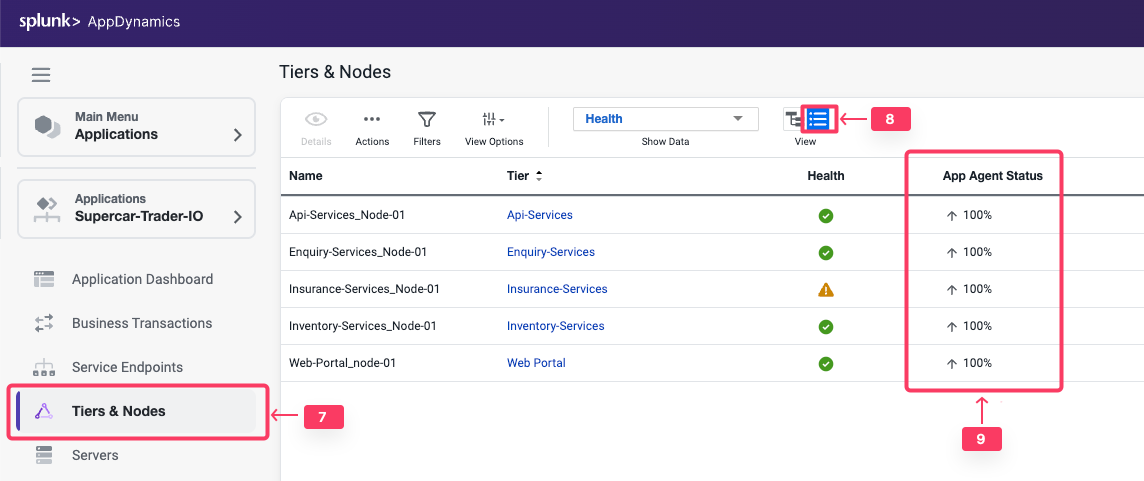
Check the agent status for the Nodes:
Click the Tiers & Nodes option on the left menu.
Click Grid View.
Verify that the App Agent Status for each Node is greater than 90% during the last hour.
Restart the Application and Load Generation if Needed
If any of the checks you performed in the previous steps could not be verified, SSH into your Application VM and follow these steps to restart the application and transaction load.
Use the following commands to stop the running instance of Apache Tomcat.
cd /usr/local/apache/apache-tomcat-9/bin
./shutdown.sh
Use the command below to check for remaining application JVMs still running.
ps -ef | grep Supercar-Trader
If you find any remaining application JVMs still running, kill the remaining JVMs using the command below.
sudo pkill -f Supercar-Trader
Use the following commands to stop the load generation for the application. Wait until all processes are stopped.
cd /opt/appdynamics/lab-artifacts/phantomjs
./stop_load.sh
Restart the Tomcat server:
cd /usr/local/apache/apache-tomcat-9/bin
./startup.sh
Wait for two minutes and use the following command to ensure Apache Tomcat is running on port 8080.
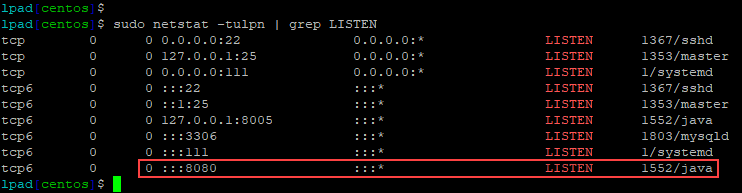
sudo netstat -tulpn | grep LISTEN
You should see output similar to the following image showing that port 8080 is in use by Apache Tomcat.
Use the following commands to start the load generation for the application.
cd /opt/appdynamics/lab-artifacts/phantomjs
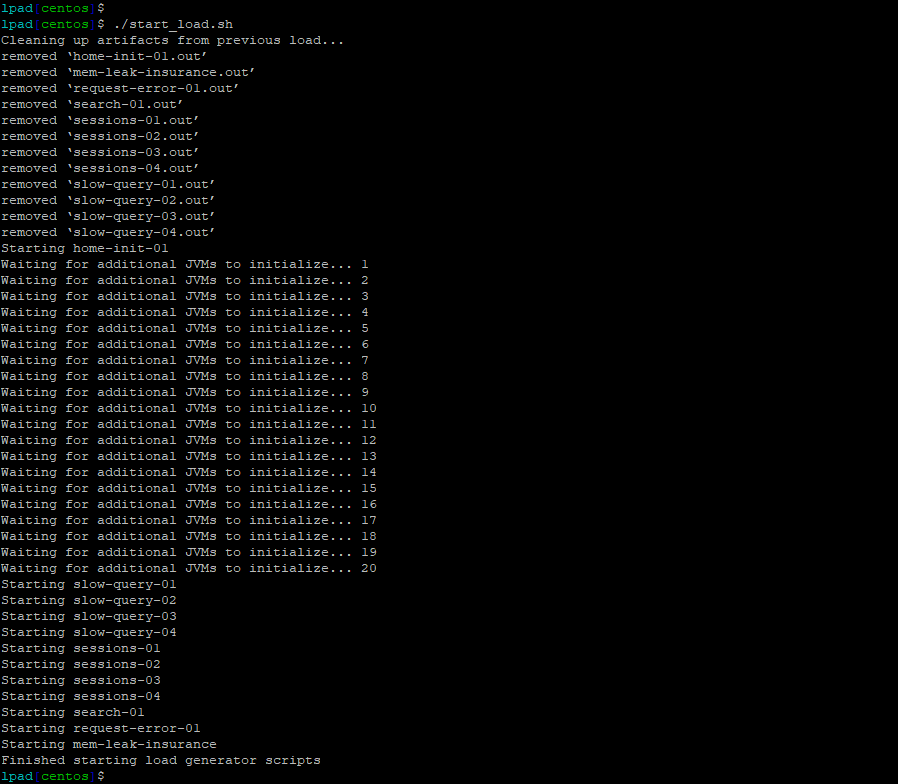
./start_load.sh
You should see output similar to the following image.
Download Database Agent
2 minutes
In this exercise you will access your AppDynamics Controller from your web browser and download the Database Visibility agent from there.
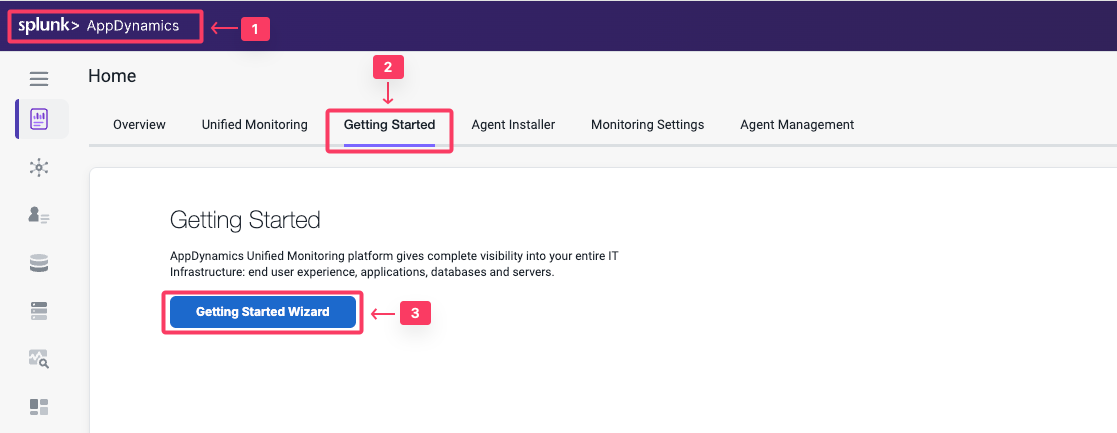
Select the Home tab at the top left of the screen.
Select the Getting Started tab.
Click Getting Started Wizard.
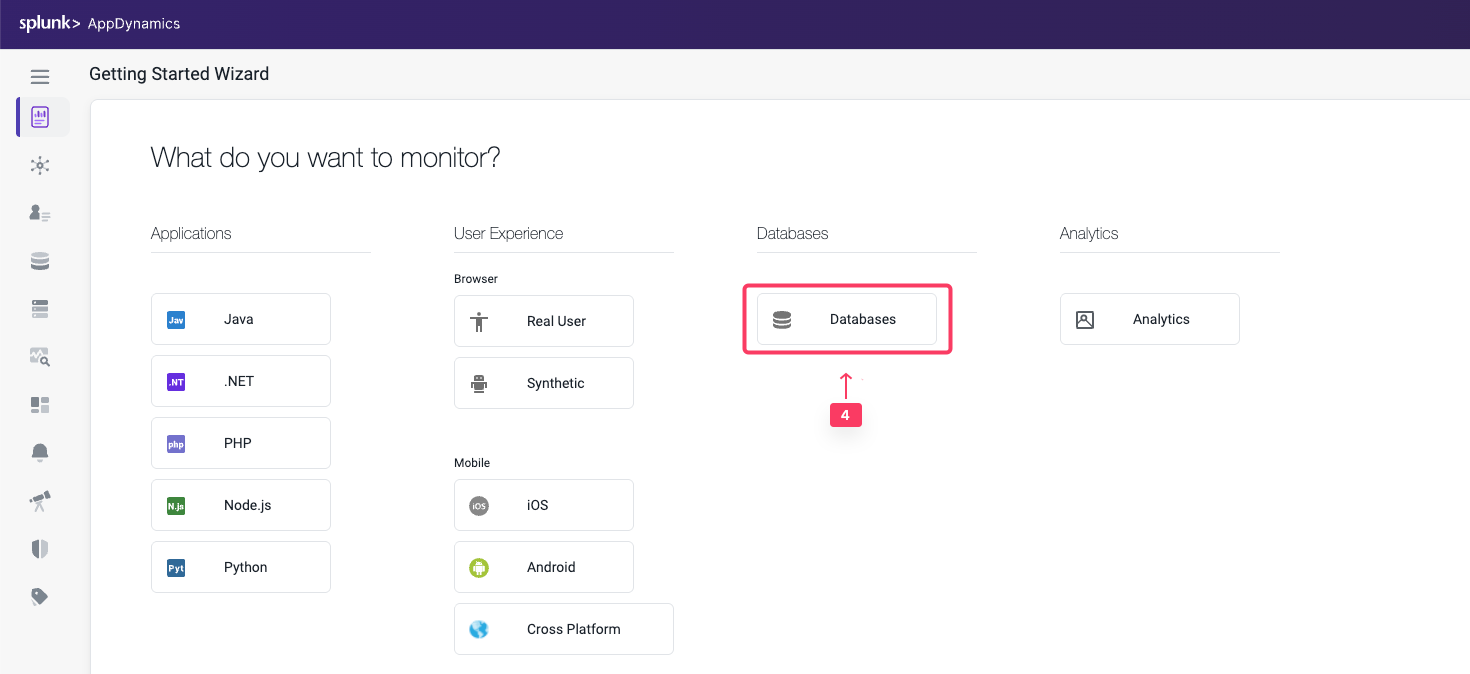
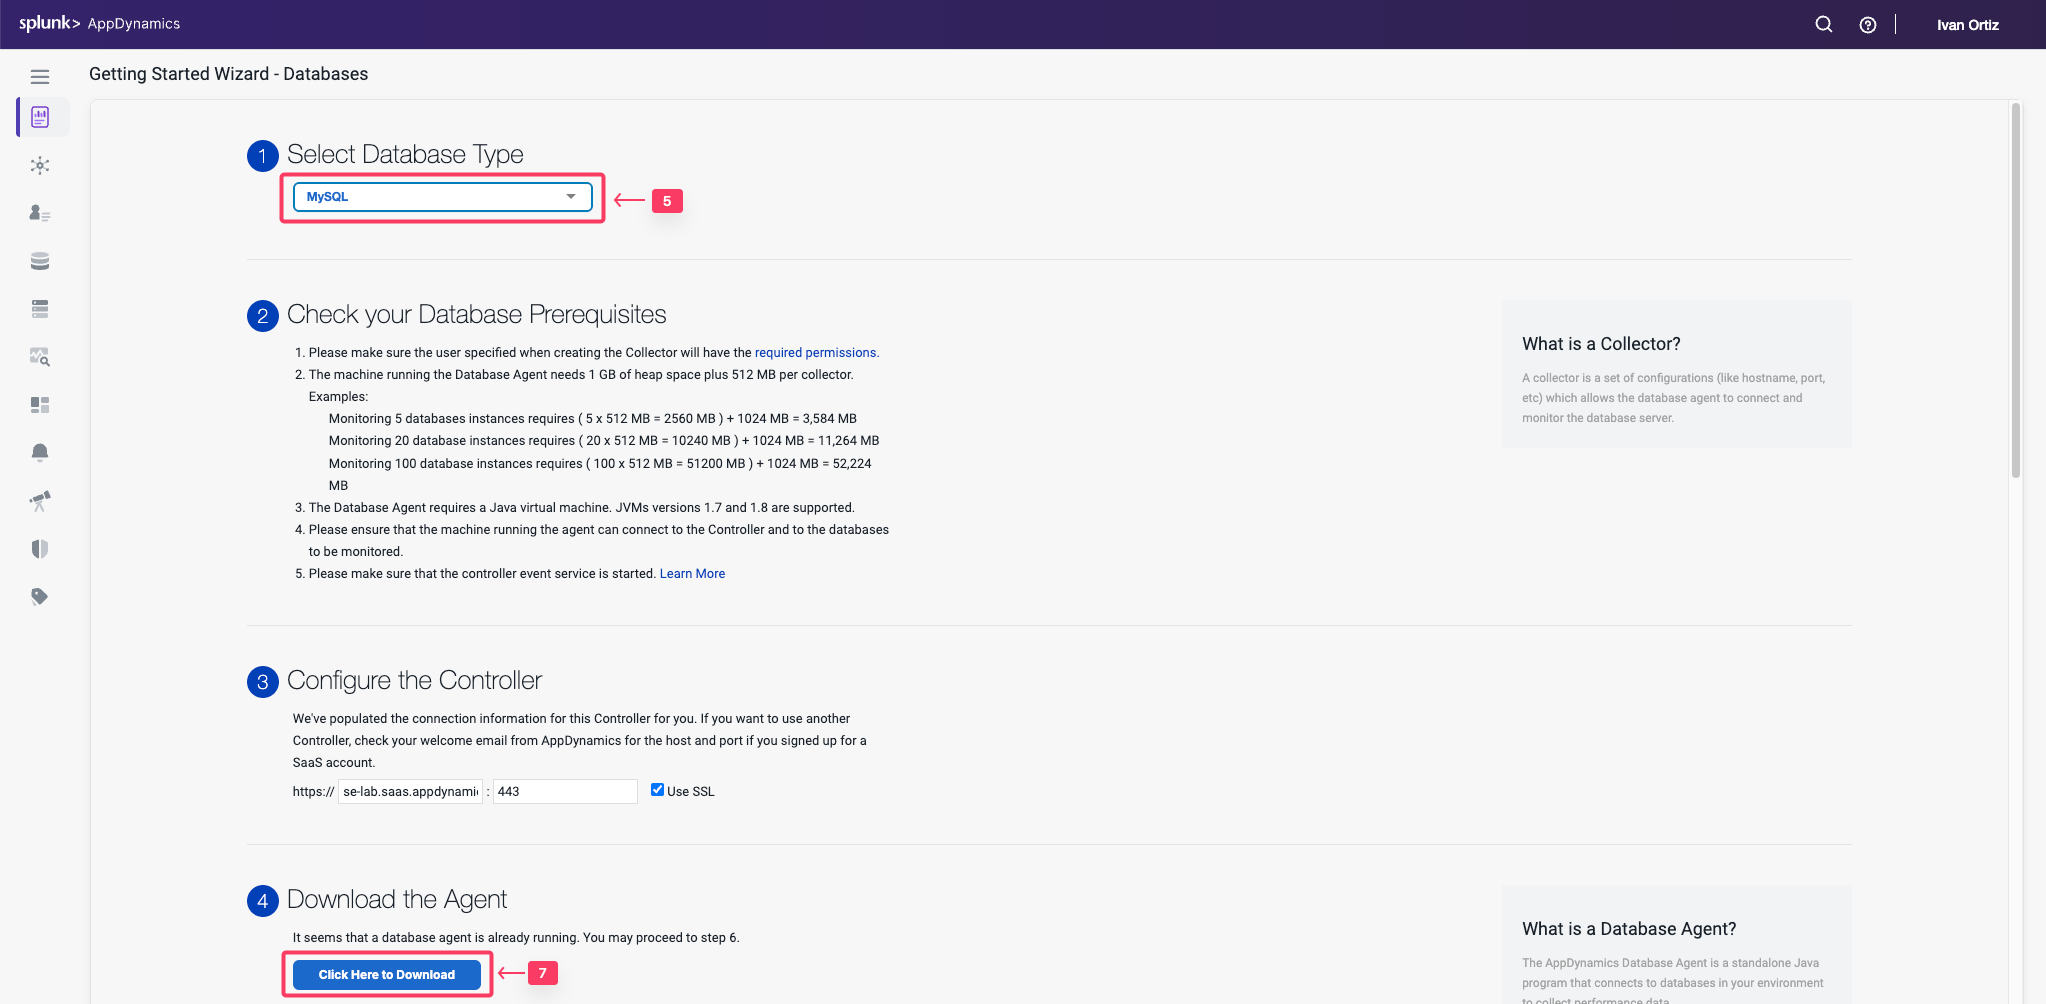
Click Databases.
Download the Database Agent.
Select MySQL from the Select Database Type dropdown menu.
Accept the defaults for the Controller connection.
Click Click Here to Download.
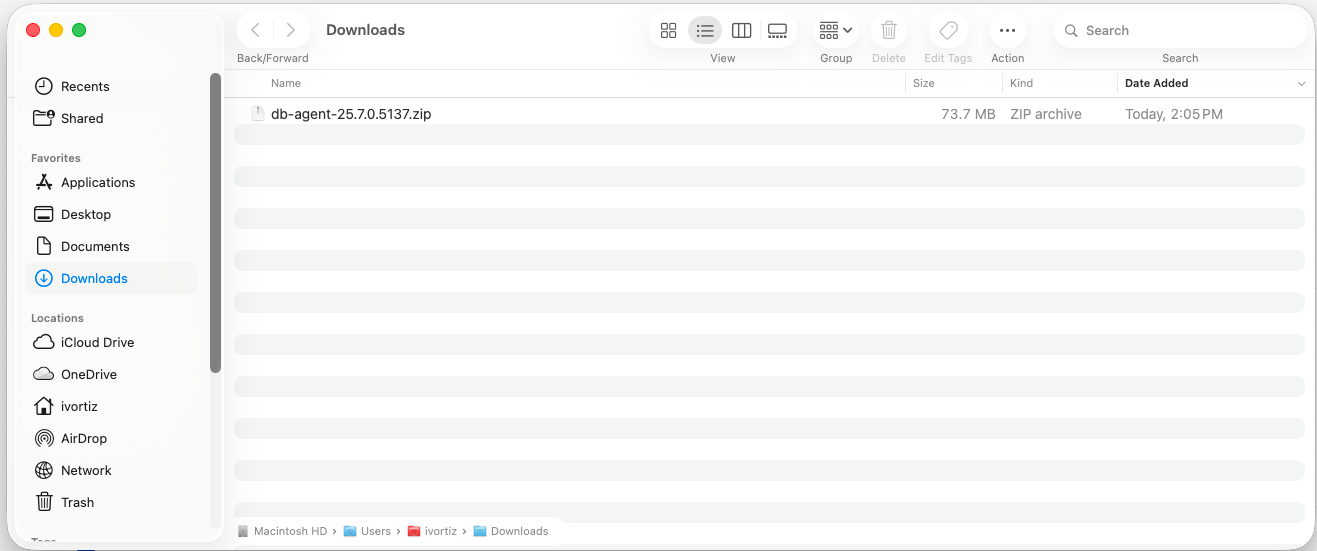
Save the Database Visibility Agent file to your local file system.
Your browser should prompt you to save the agent file to your local file system, similar to the following image(depending on your OS).
Install Database Agent
2 minutes
The AppDynamics Database Agent is a standalone Java program that collects performance metrics about your database instances and database servers. You can deploy the Database Agent on any machine running Java 1.8 or higher. The machine must have network access to the AppDynamics Controller and the database instance that you want to be monitored.
A database agent running on a typical machine with 16 GB of memory can monitor about 25 databases. On larger machines, a database agent can monitor up to 200 databases.
In this exercise you will perform the following tasks:
Upload the Database Visibility agent file to your Application VM
Unzip the file into a specific directory on the file system
Start the Database Visibility agent
Upload Database Agent to The Application VM
By this point you should have received the information regarding the EC2 instance that you will be using for this workshop. Ensure you have the IP address of your EC2 instance, username and password required to ssh into the instance .
On your local machine, open a terminal window and change into the directory where the database agent file was downloaded to. Upload the file into the EC2 instance using the following command. This may take some time to complete. If you are in a Windows OS, you may have to use a programm such as WinSCP.
Update the IP address or public DNS for your instance.
Update the filename to match your exact version.
cd ~/Downloads
scp -P 2222 db-agent-*.zip splunk@i-0267b13f78f891b64.splunk.show:/home/splunk
Create the directory structure where you will unzip the Database agent zip file.
cd /opt/appdynamics
mkdir dbagent
Use the following commands to copy the Database agent zip file to the directory and unzip the file. The name of your Database agent file may be slightly different than the example below.
cp ~/db-agent-*.zip /opt/appdynamics/dbagent/
cd /opt/appdynamics/dbagent
unzip db-agent-*.zip
Start the Database Visibility agent
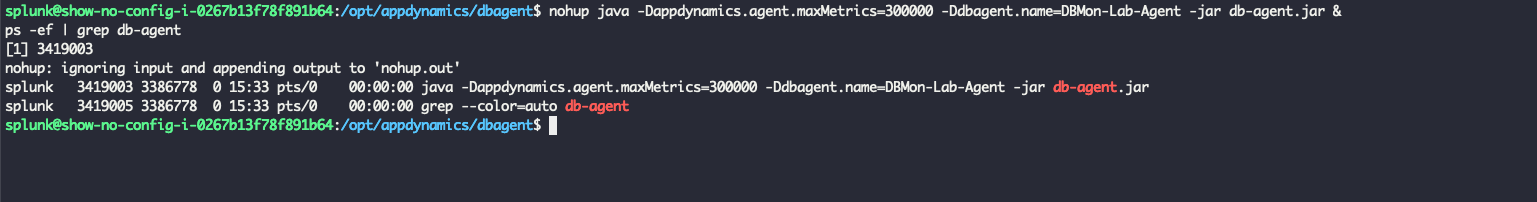
Use the following commands to start the Database agent and verify that it started.
Append your inititals to the db agent name, this will be used in the following section. example: DBMon-Lab-Agent-IO
You should see output similar to the following image.
Configure Database Collector
2 minutes
Configure Database Collector
The Database Agent Collector is the process that runs within the Database Agent to collect performance metrics about your database instances and database servers. One collector collects metrics for one database instance. Multiple collectors can run in one Database Agent. Once the Database Agent is connected to the Controller one or more collectors can be configured in the Controller.
In this exercise you will perform the following tasks:
Access your AppDynamics Controller from your web browser
Use the following steps to change the settings for the query literals and navigate to the collectors configuration.
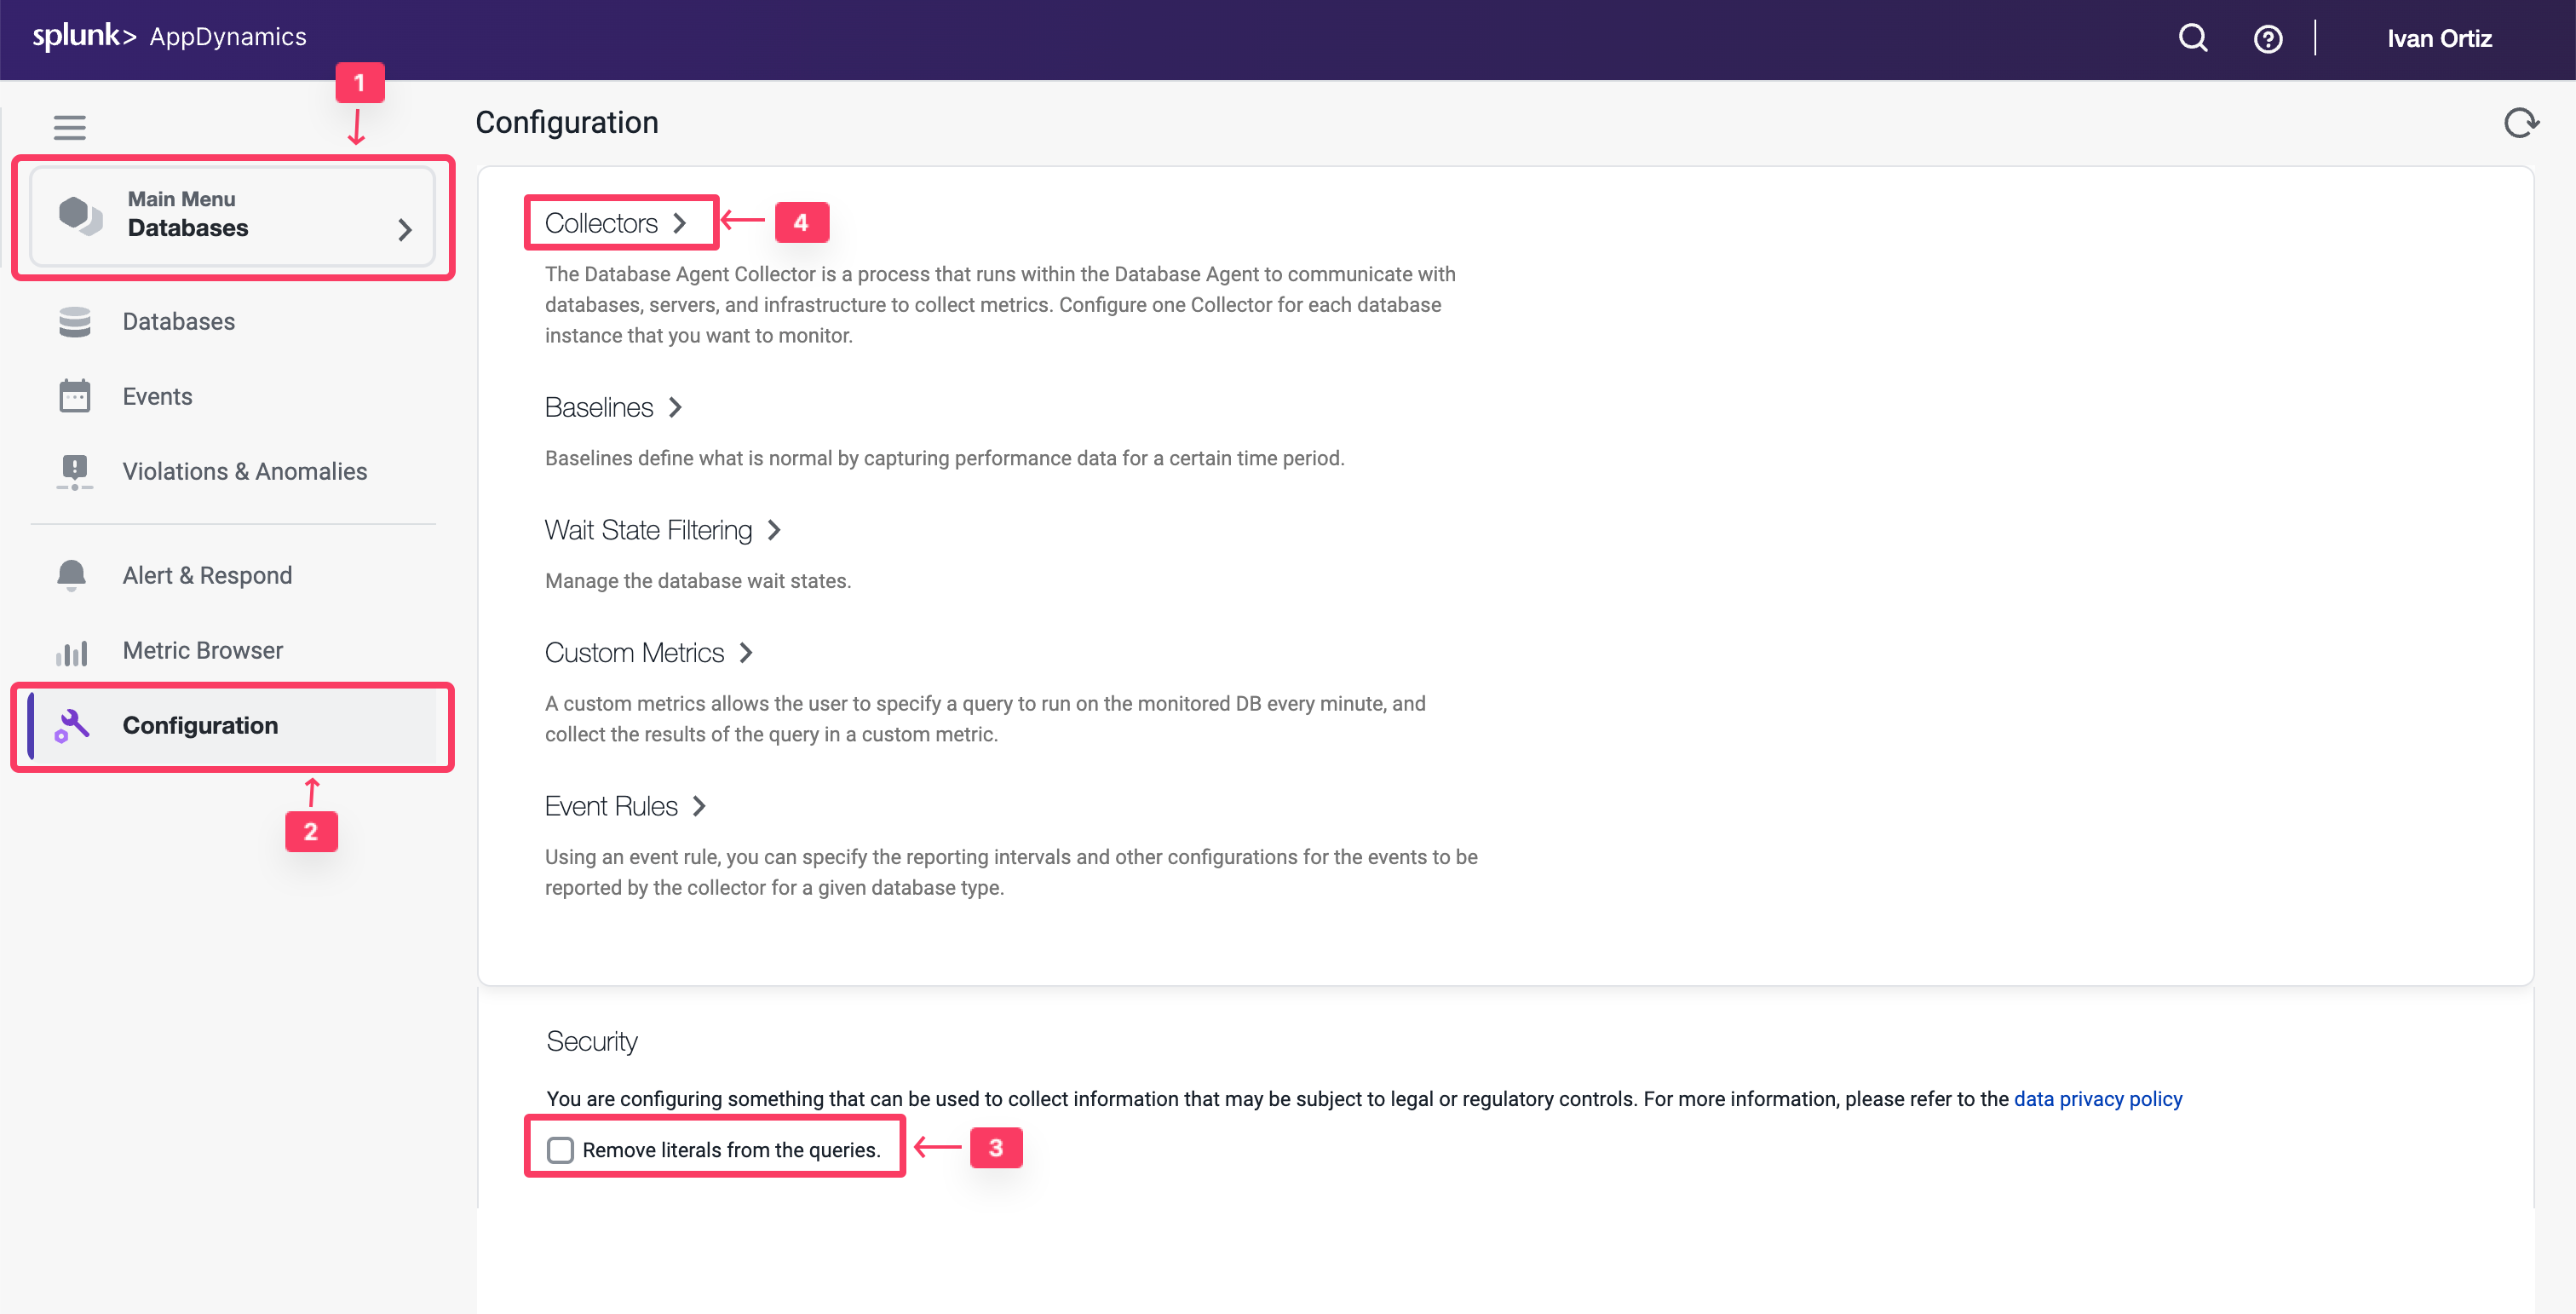
Click the Databases tab on the left menu.
Click the Configuration tab on the bottom left.
Uncheck the checkbox for Remove literals from the queries.
Click the Collectors option.
Use the following steps to configure a new Database collector.
Click Add button.
Select MySQL for the database type.
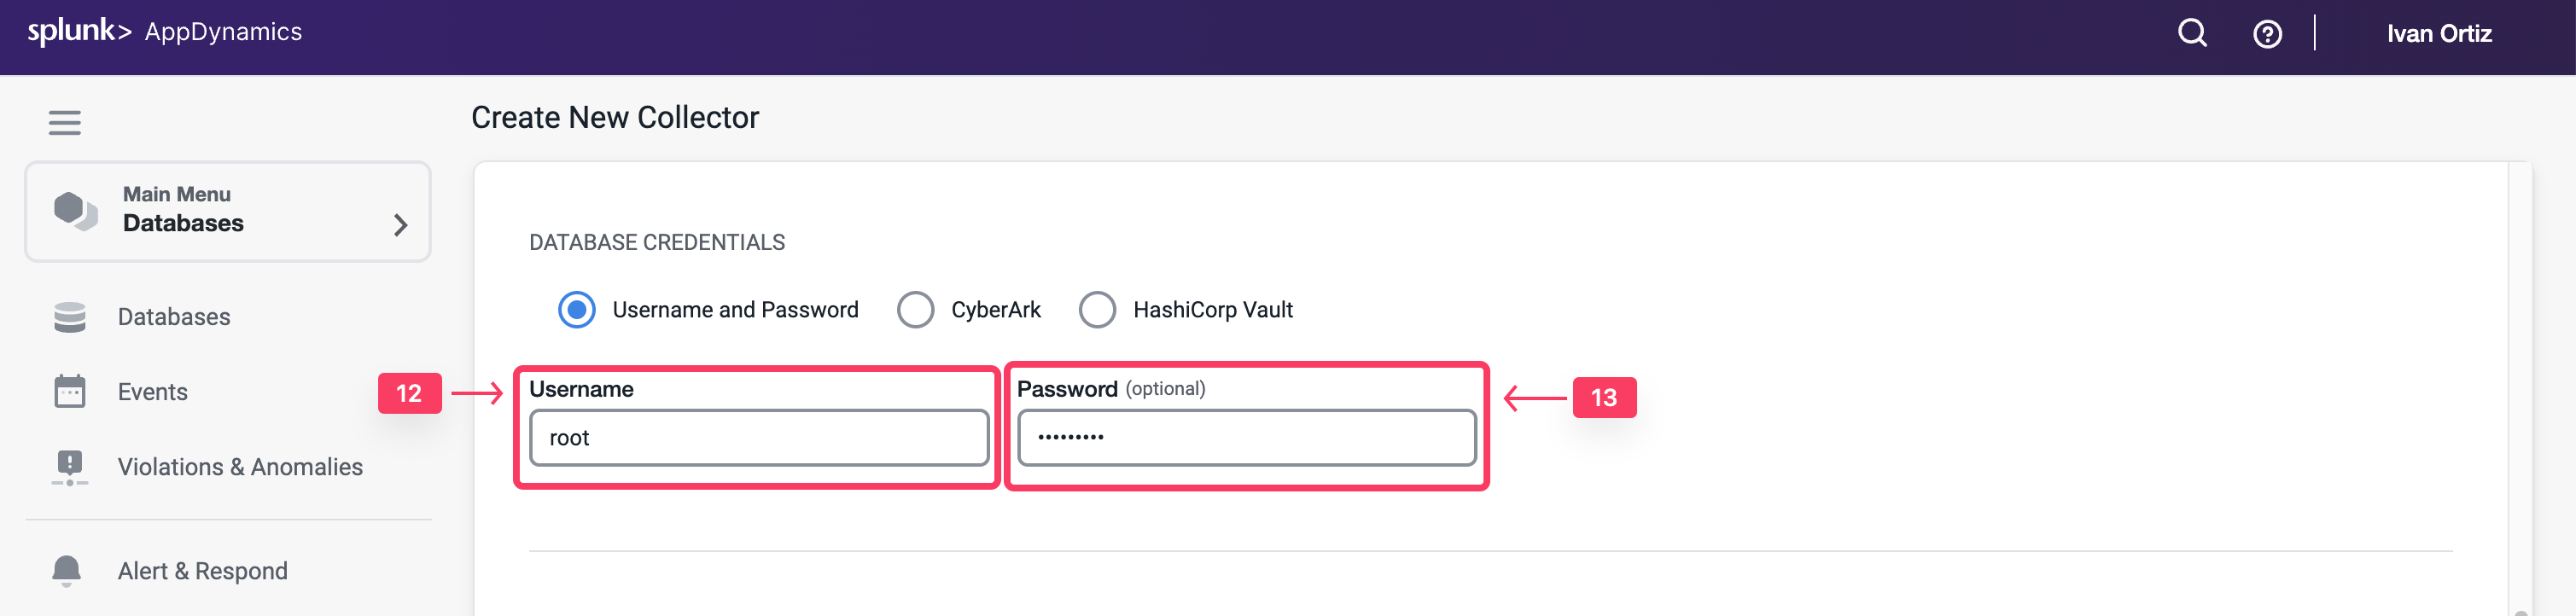
Select DBMon-Lab-Agent for the database agent and enter the following parameters.
Collector Name: Supercar-MySQL-YOURINITIALS
Hostname or IP Address: localhost
Listener Port: 3306
Username: root
Password: Welcome1!
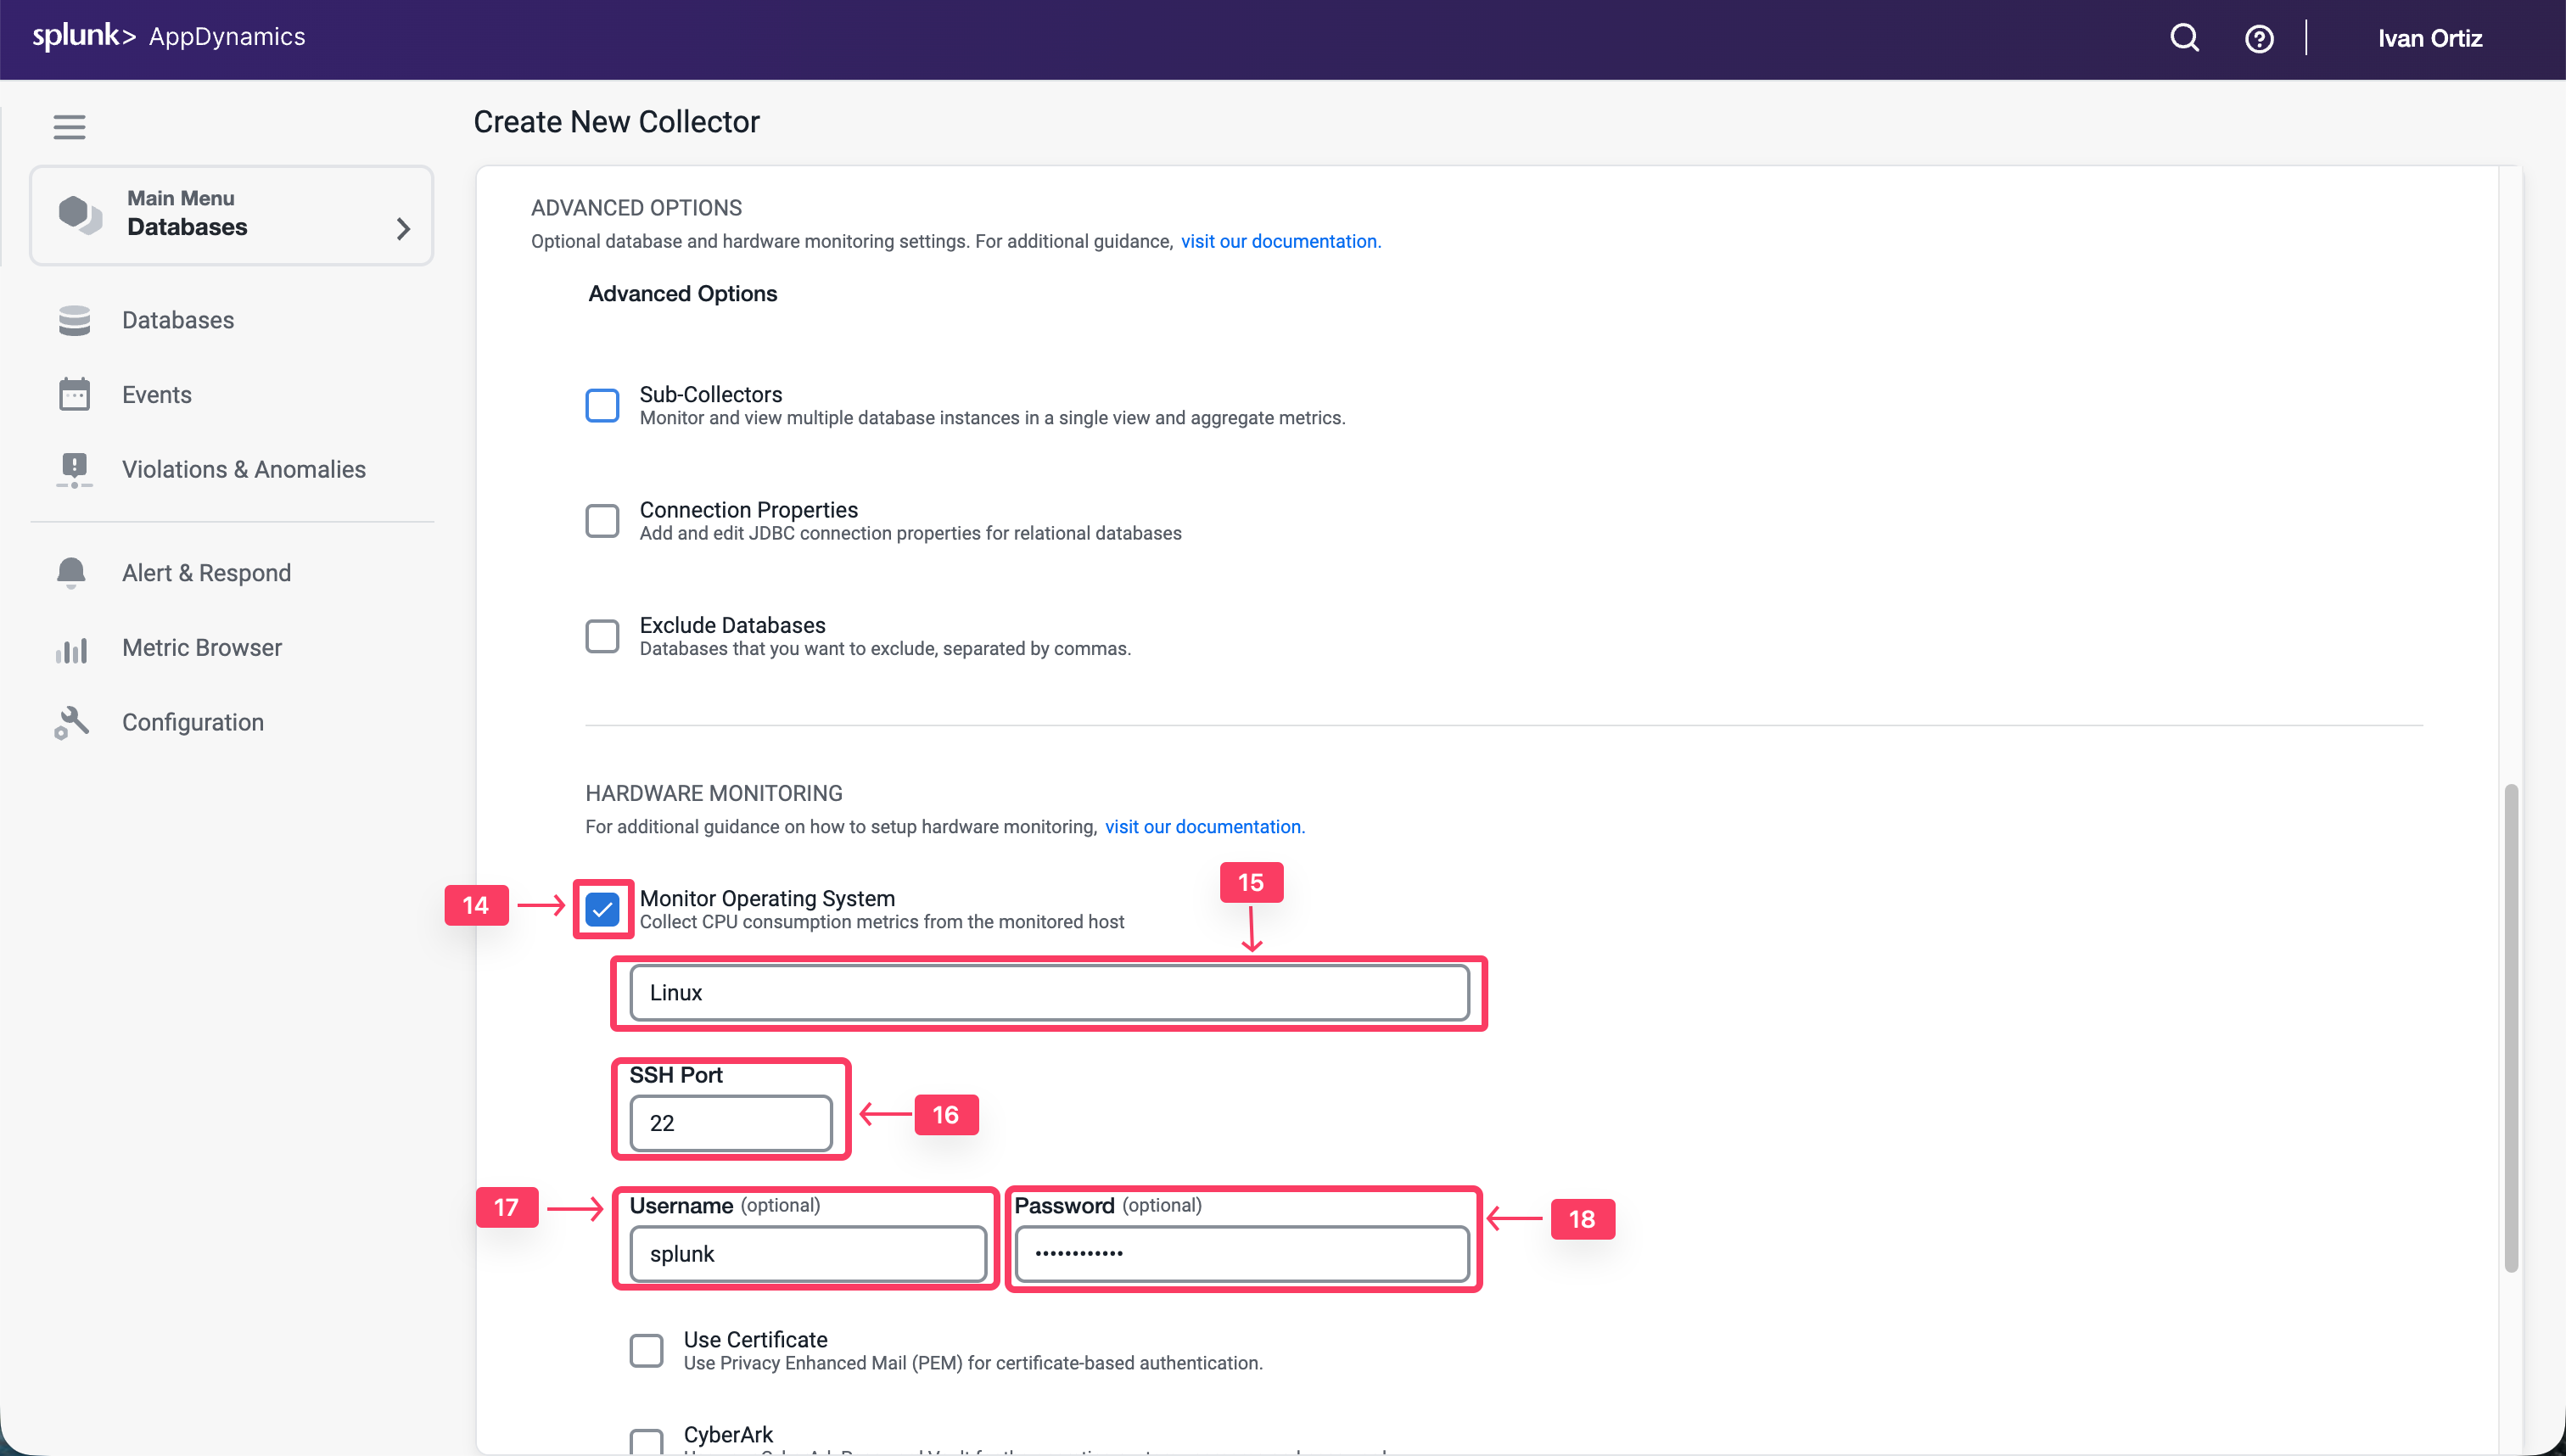
Select the Monitor Operating System checkbox under the Advanced Options
Select Linux as the operating system and enter the following parameters.
SSH Port: 22
Username: splunk
Password: Password Provided by Your Instructor to SSH into the EC2 Instance
Click OK to save the collector.
Confirm that the Database Collector is collecting data
Wait for ten minutes to allow the collector to run and submit data, then follow these steps to verify that the database collector is connecting to the database and collecting database metrics.
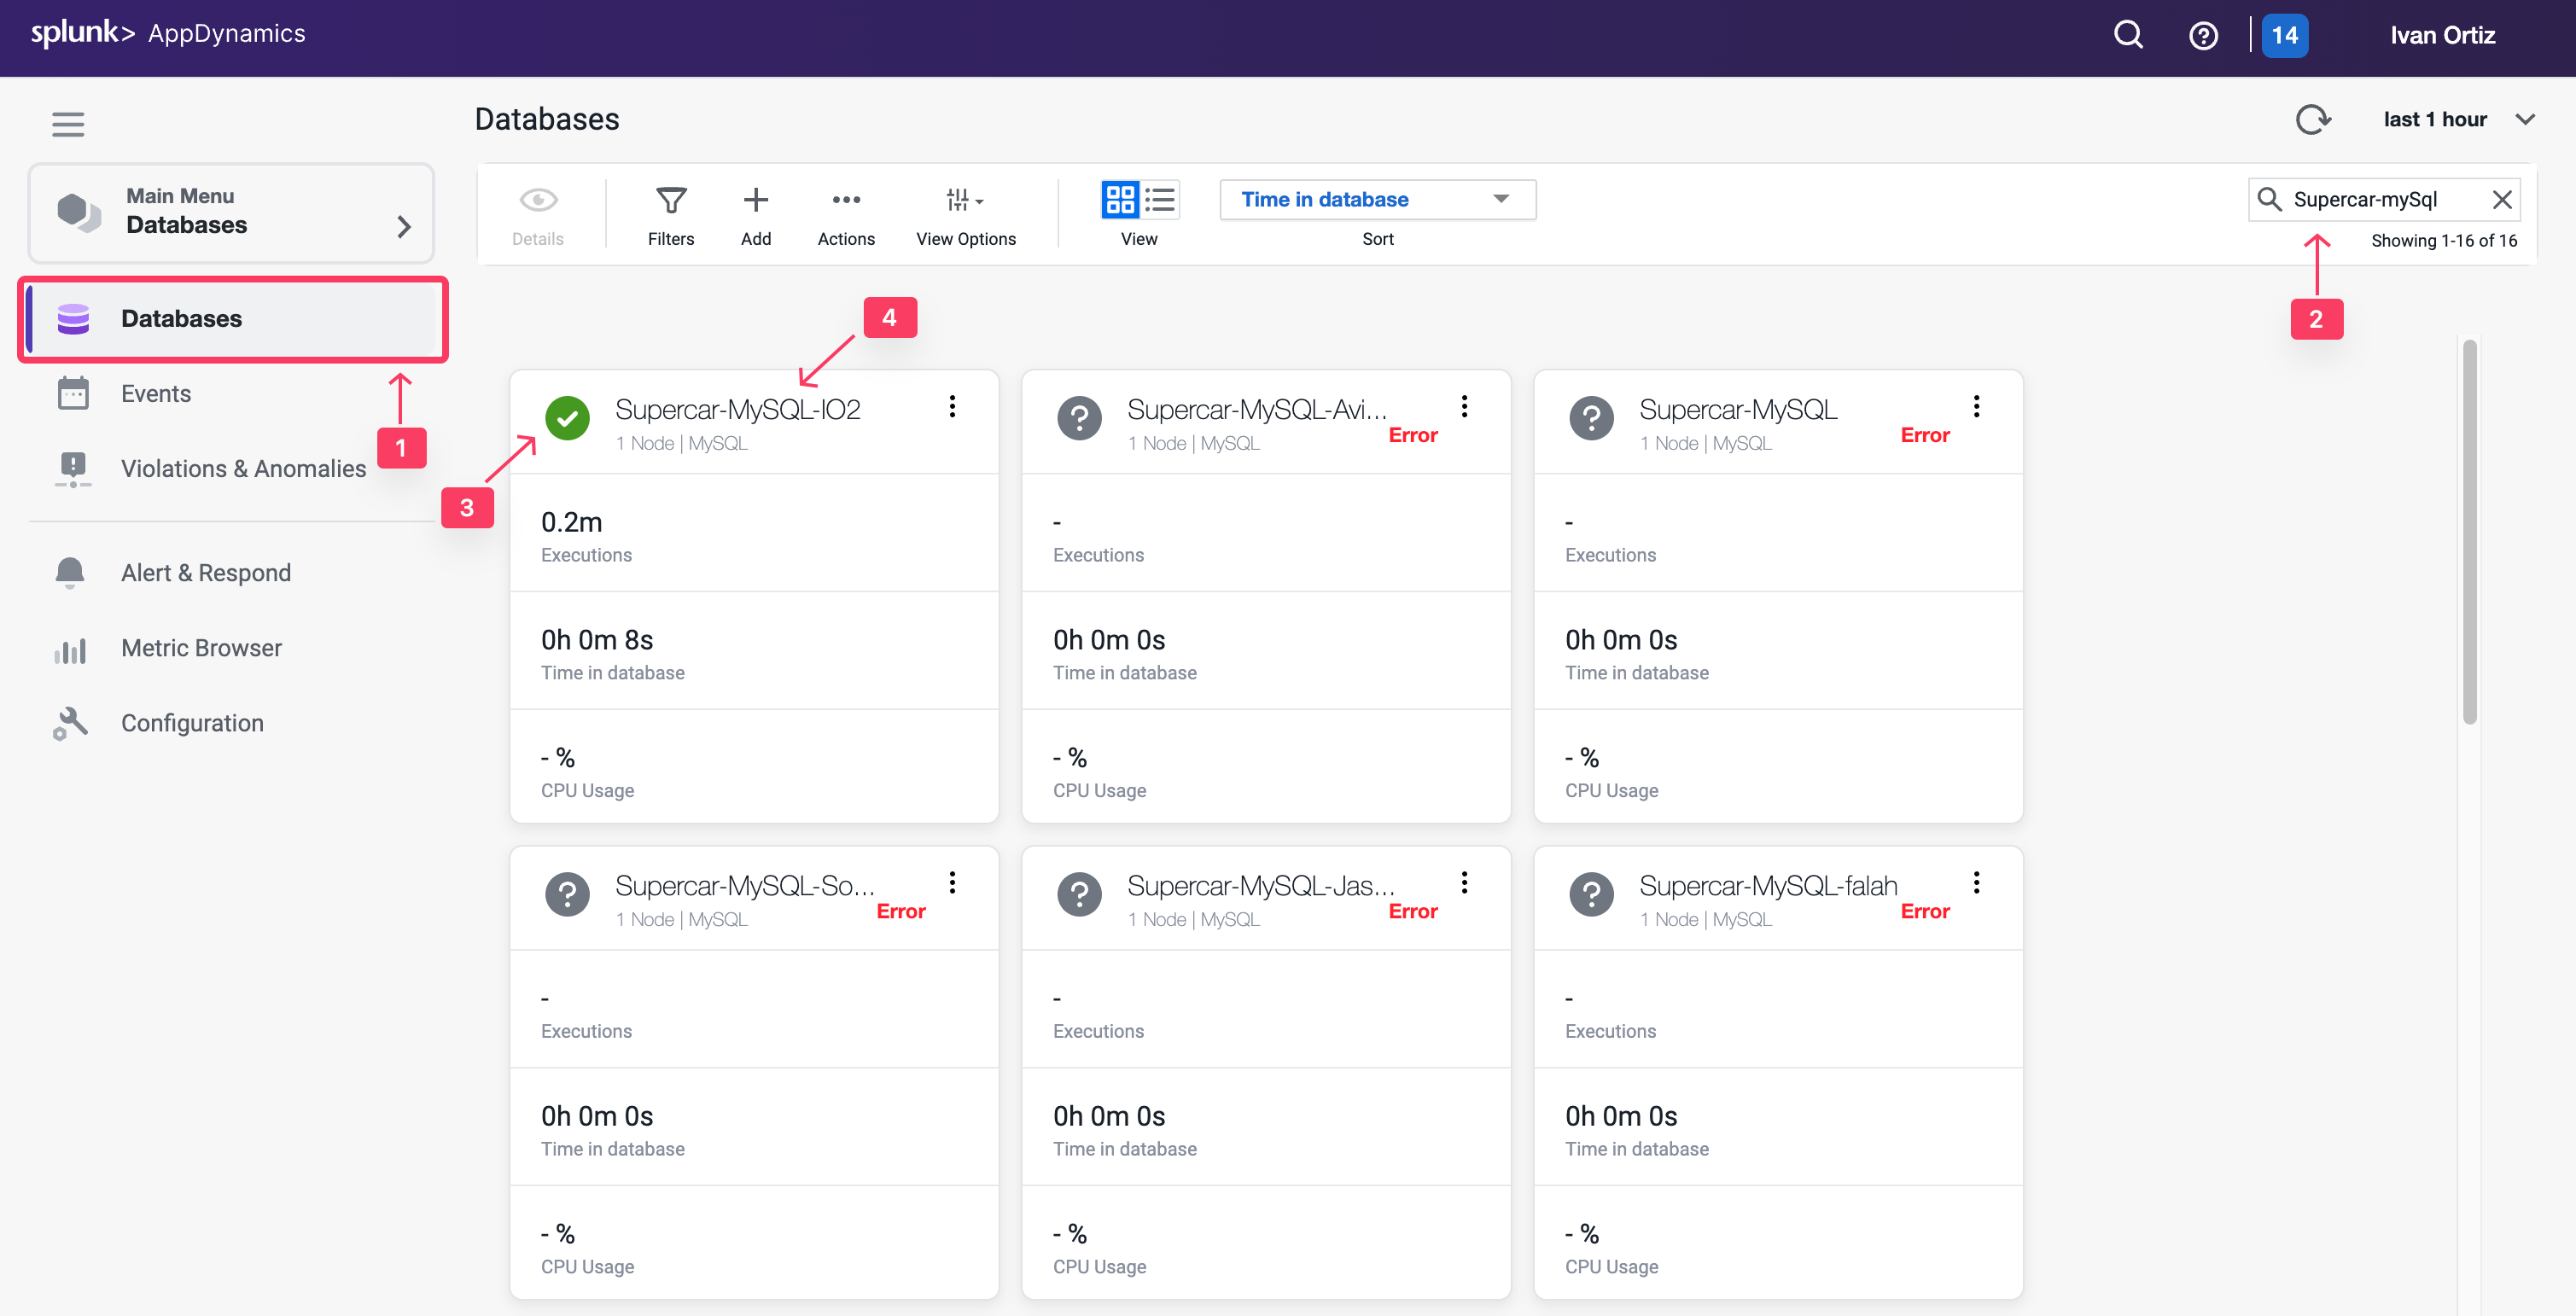
Click the Databases tab on the left menu
Search for the Collector created in the previous section: Supercar-MySQL-YOURINITIALS
Ensure the status is green and there are no errors shown.
Click the Supercar-MySQL link to drill into the database.
Note: It may take up to 18 minutes from the time you configure your collector to see the Top 10 SQL Wait States and any queries on the Queries tab.
You can read more about configuring Database Collectors here
Monitor and Troubleshoot - Part 1
2 minutes
Monitor and Troubleshoot - Part 1
In this exercise you will perform the following tasks:
Review the Overall Database and Server Performance Dashboard
Review the Main Database Dashboard
Review the Reports in the Database Activity Window
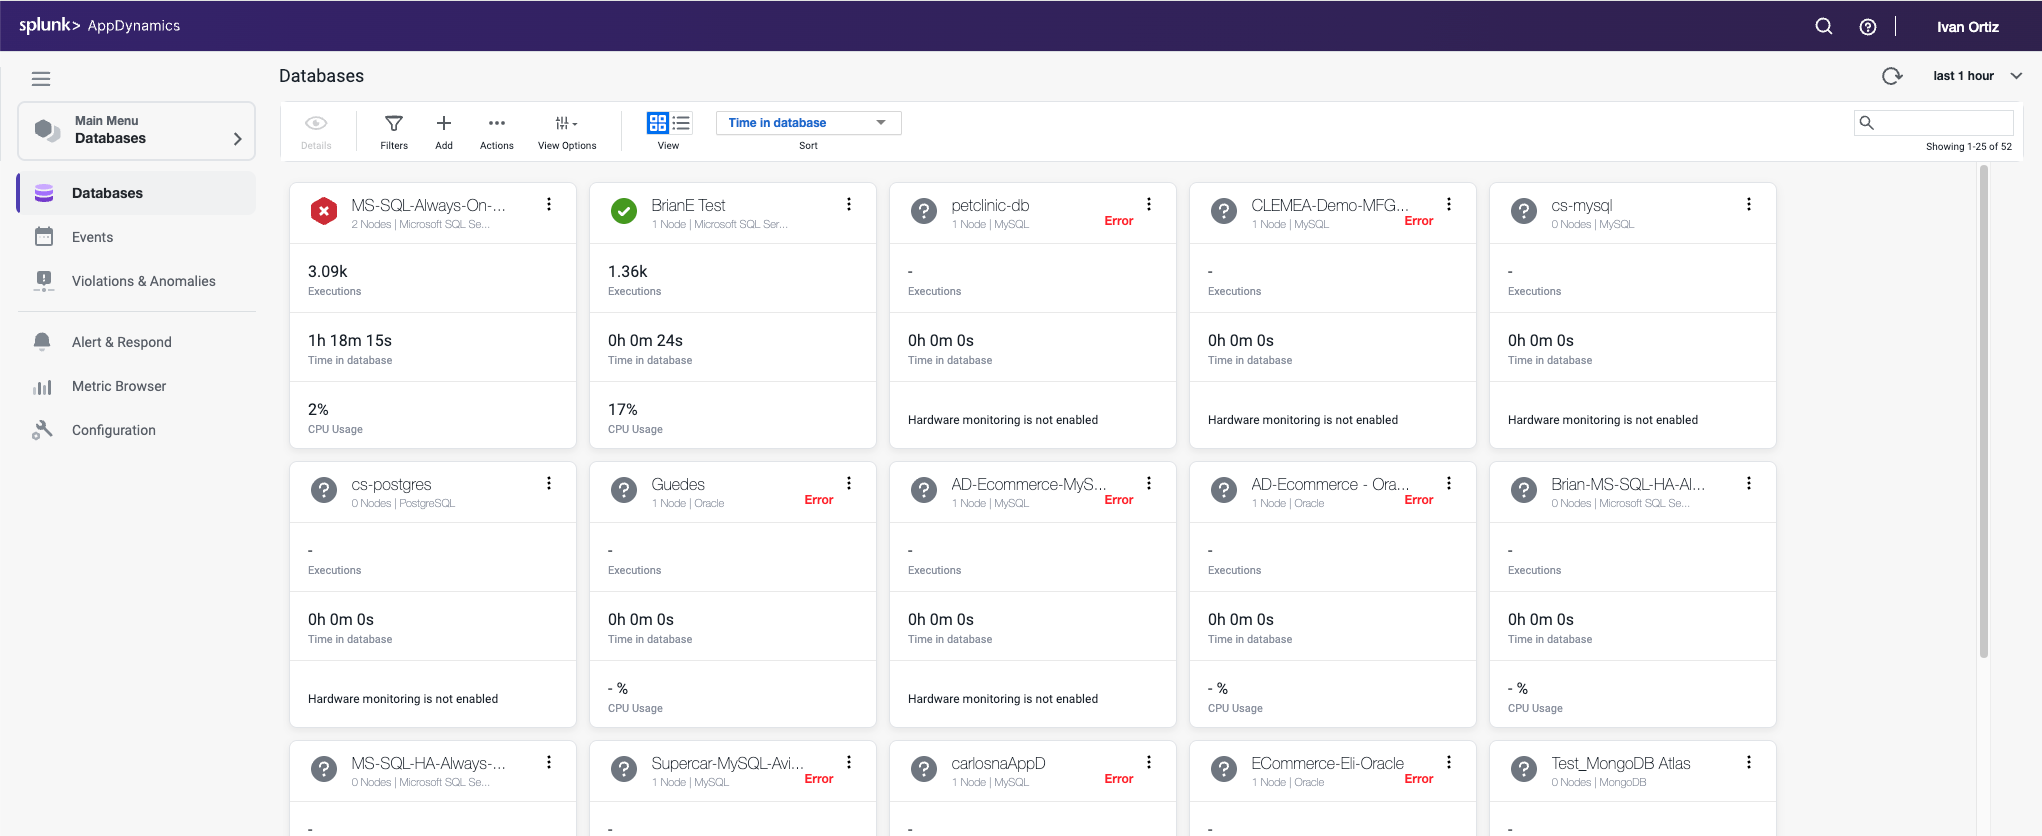
Review the Overall Database and Server Performance Dashboard
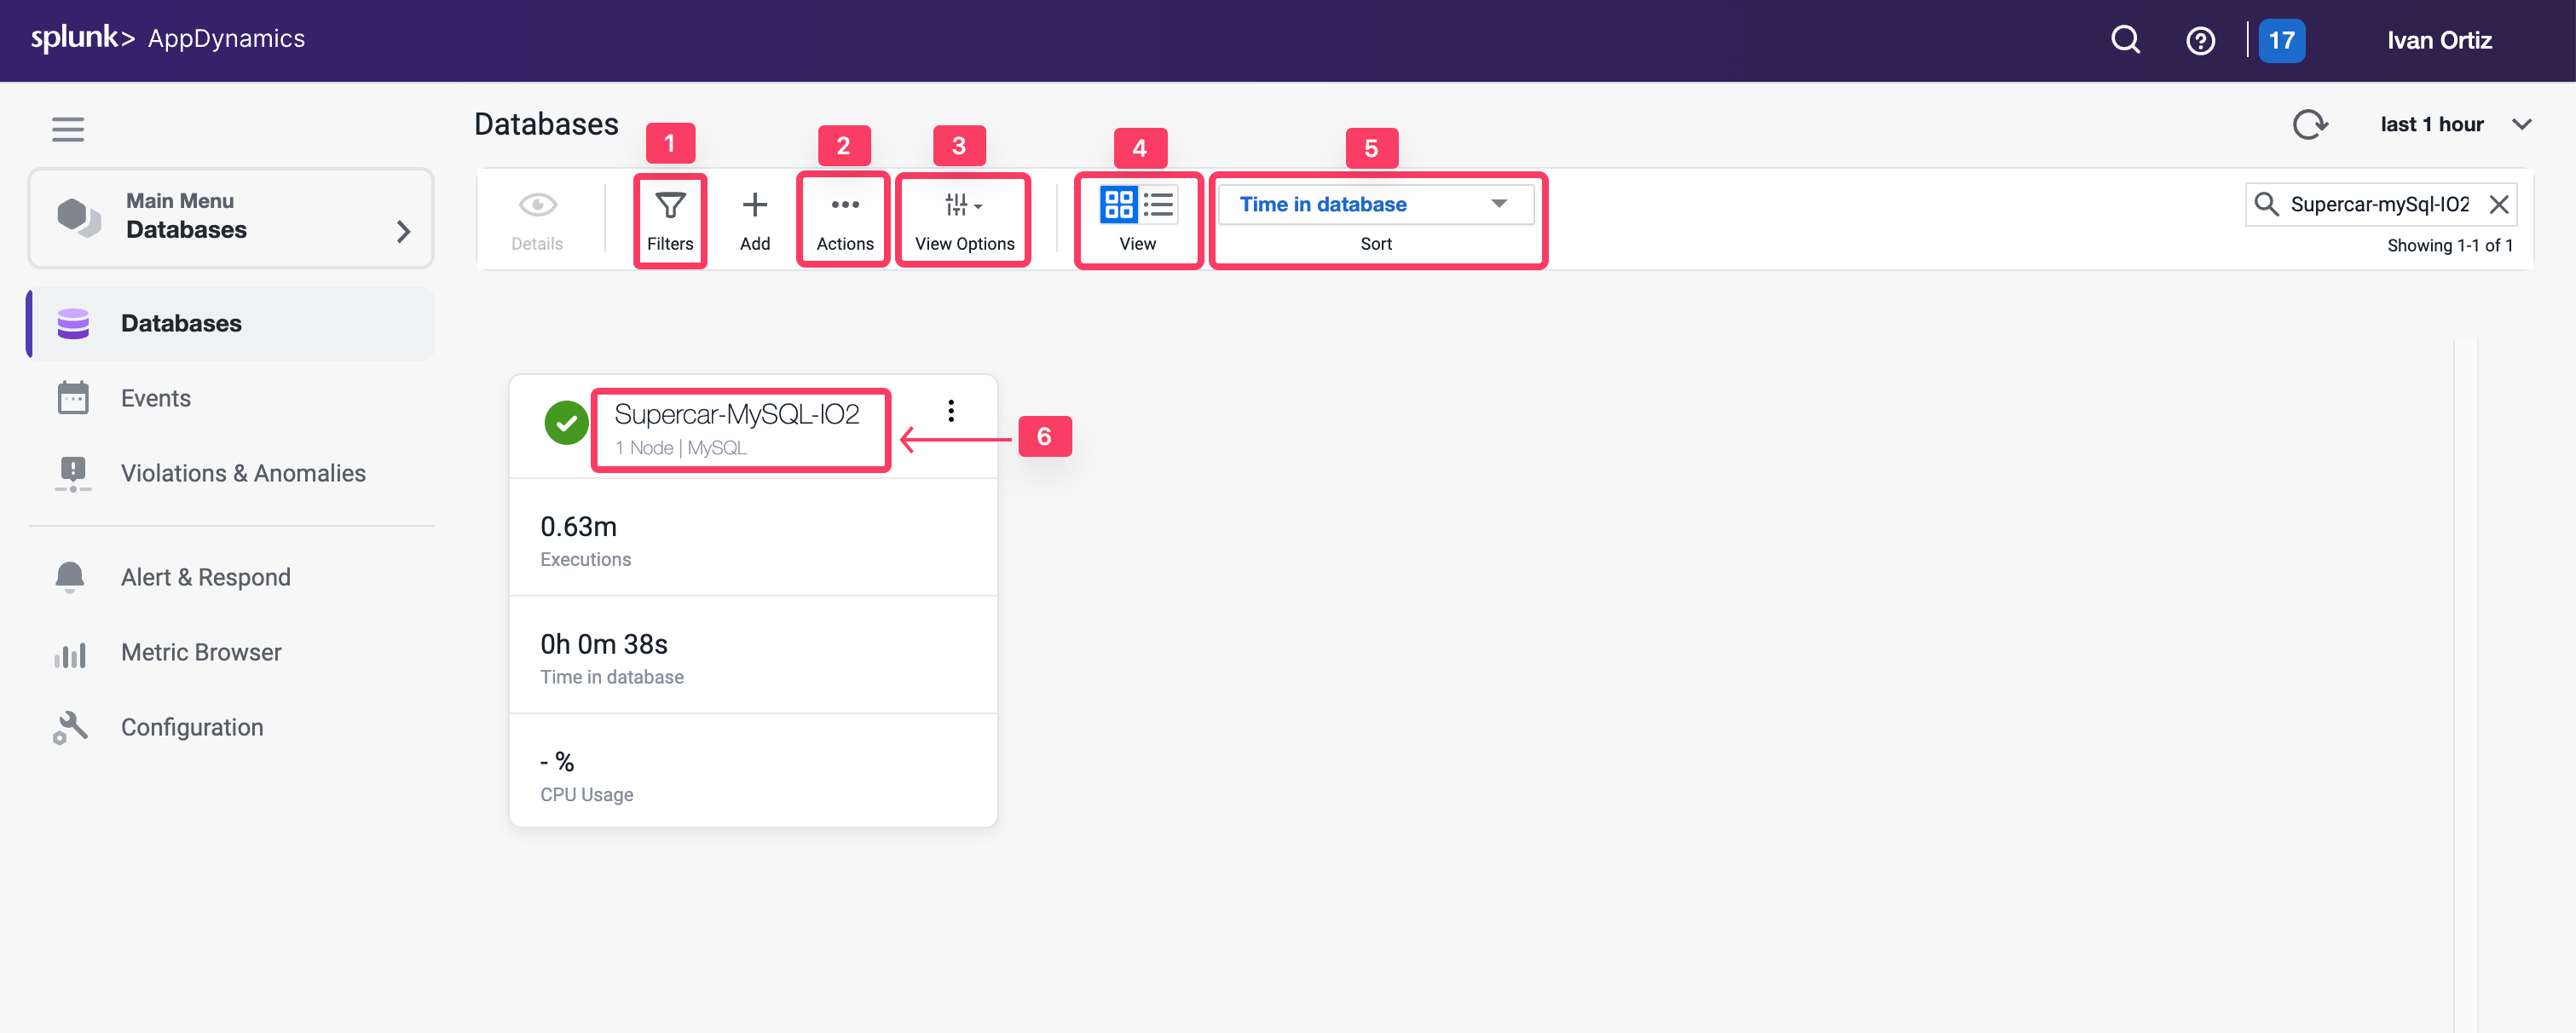
The Overall Database and Server Performance Dashboard allows you to quickly see the health of each database at a glance.
Filters: Enables you to explore the options to filter by health, load, time in database or type.
Actions: Exports the data on this window in a .csv formatted file.
View Options: Toggles the spark charts on and off.
View: Switches between the card and list view.
Sort: Displays the sorting options.
Supercar-MySQL: Drills into the main database dashboard.
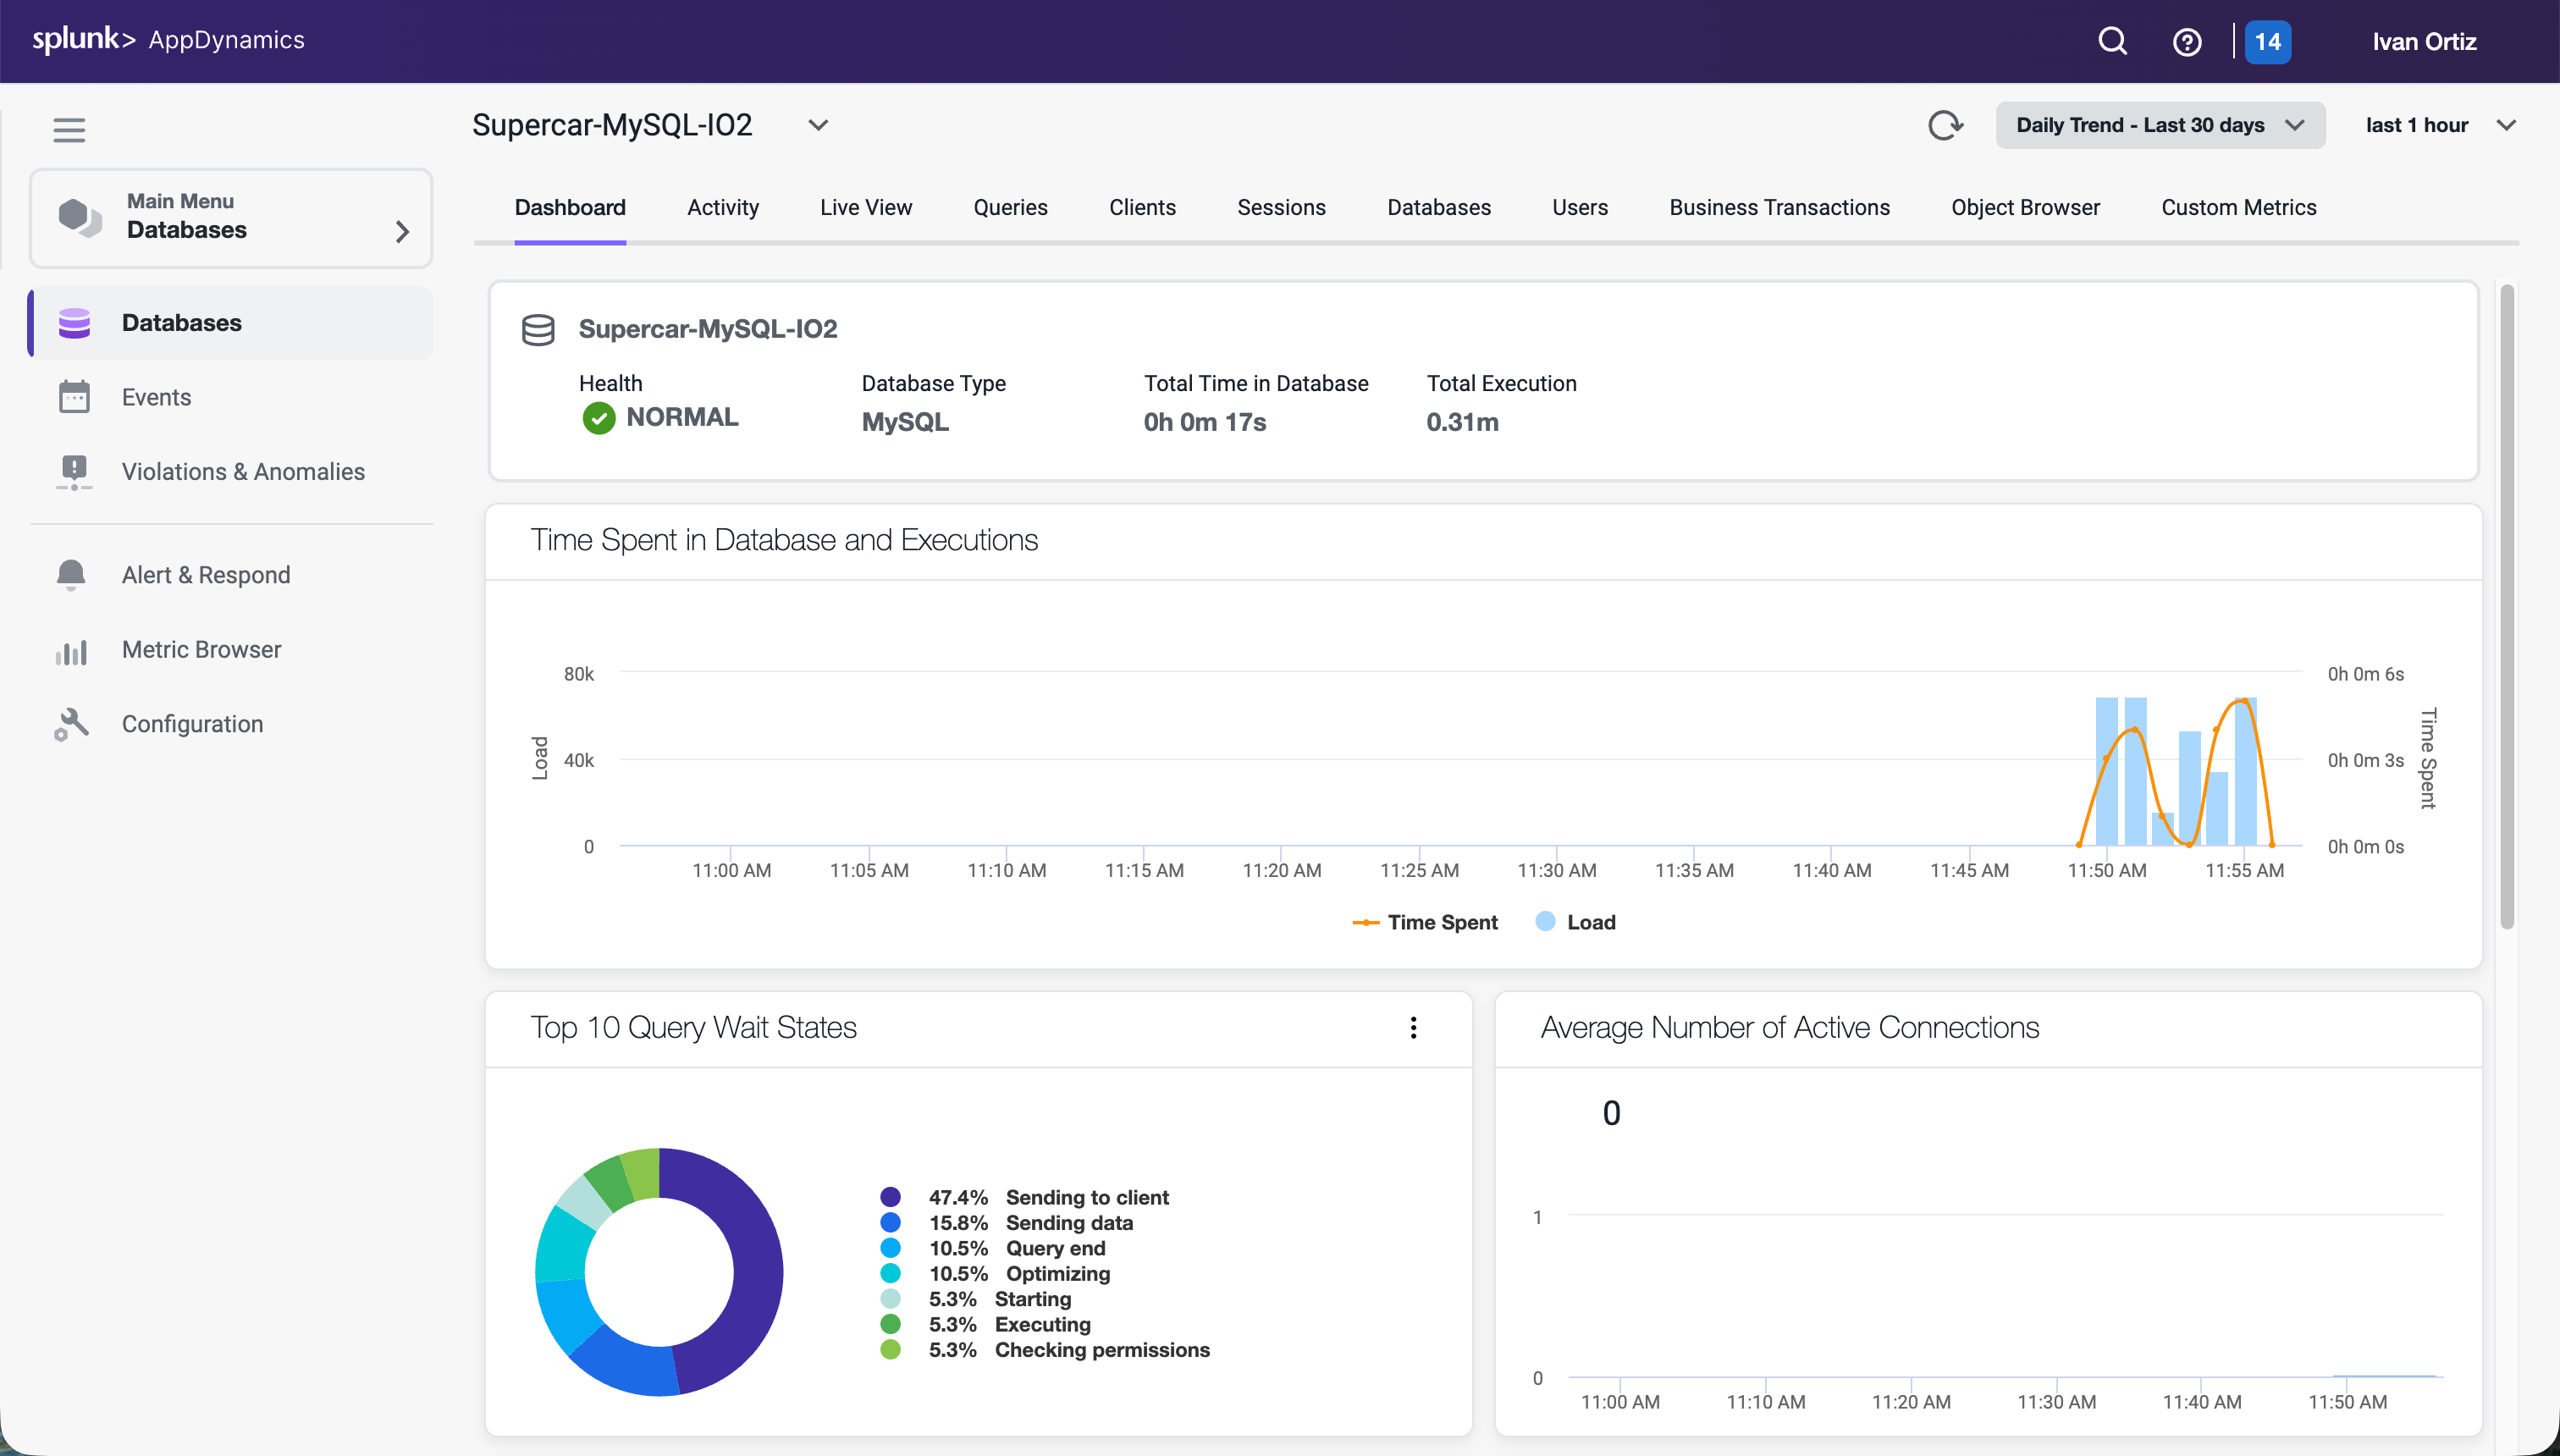
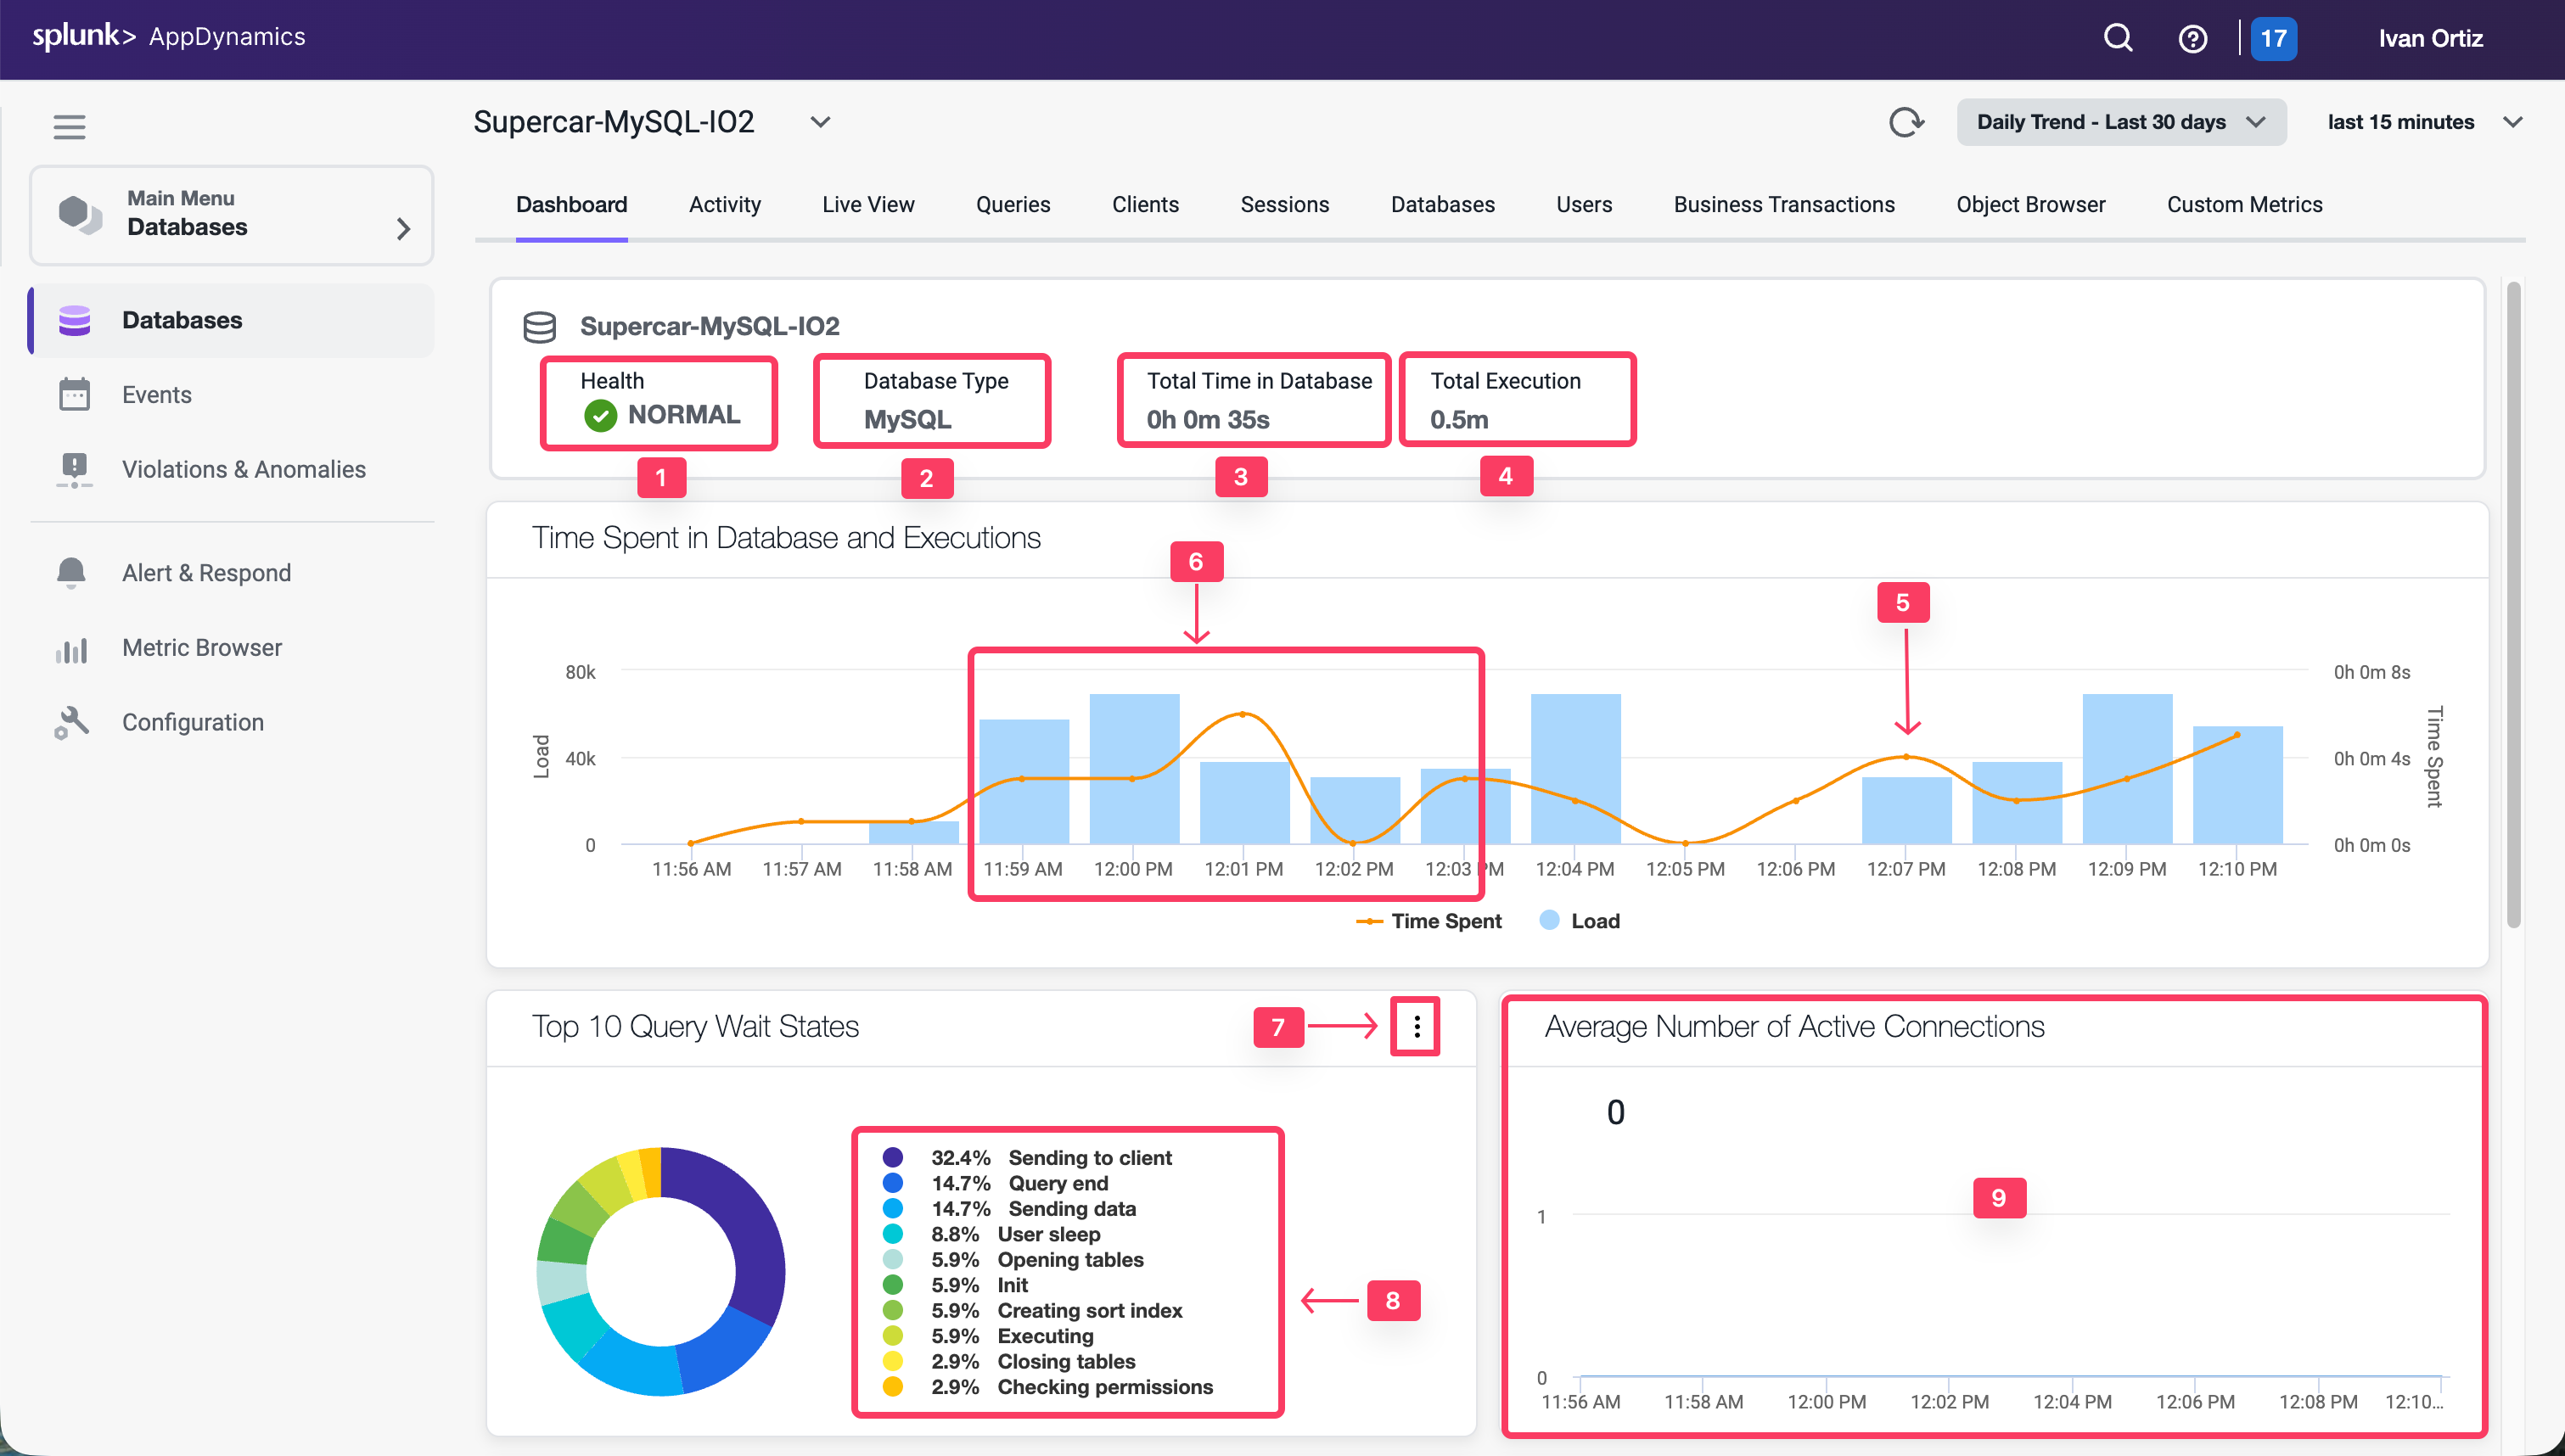
Review the Main Database Dashboard
The main database dashboard shows you key insights for the database including:
The health of the server that is running the database.
The total number of calls during the specified time period.
The number of calls for any point in time.
The total time spent executing SQL statements during the specified time period.
The top ten query wait states.
The average number of connections.
The database type or vendor.
Explore the features of the dashboard.
Click the health status circle to see details of the server health:
Green: server is healthy.
Yellow: server with warning-level violations.
Red: server with critical-level violations.
The database type or vendor will always be seen here.
Observe the total time spent executing SQL statements during the specified time period.
Observe the total number of executions during the specified time period.
Hover over the time series on the chart to see the detail of the recorded metrics.
Click the orange circle at the top of the data point to view the time comparison report, which shows query run times and wait states 15 minutes before and 15 minutes after the selected time.
Left-click and hold down your mouse button while dragging from left to right to highlight a spike seen in the chart.
Click the configuration button to exclude unwanted wait states from the top ten.
Hover over the labels for each wait state to see a more detailed description.
Observe the average number of active connections actively running a query during the selected time period.
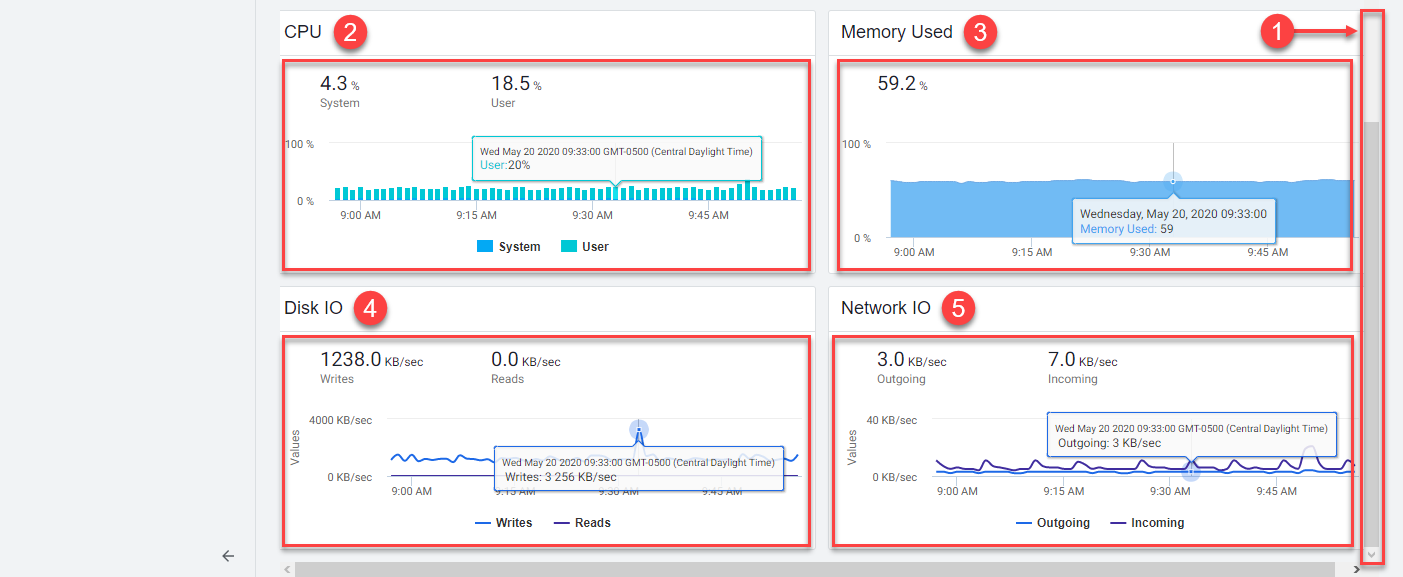
To view the OS metrics of the DB server for the time period that you have selected:
Scroll to the bottom of the dashboard using the scroll bar on the right
CPU
Memory
Disk IO
Network IO
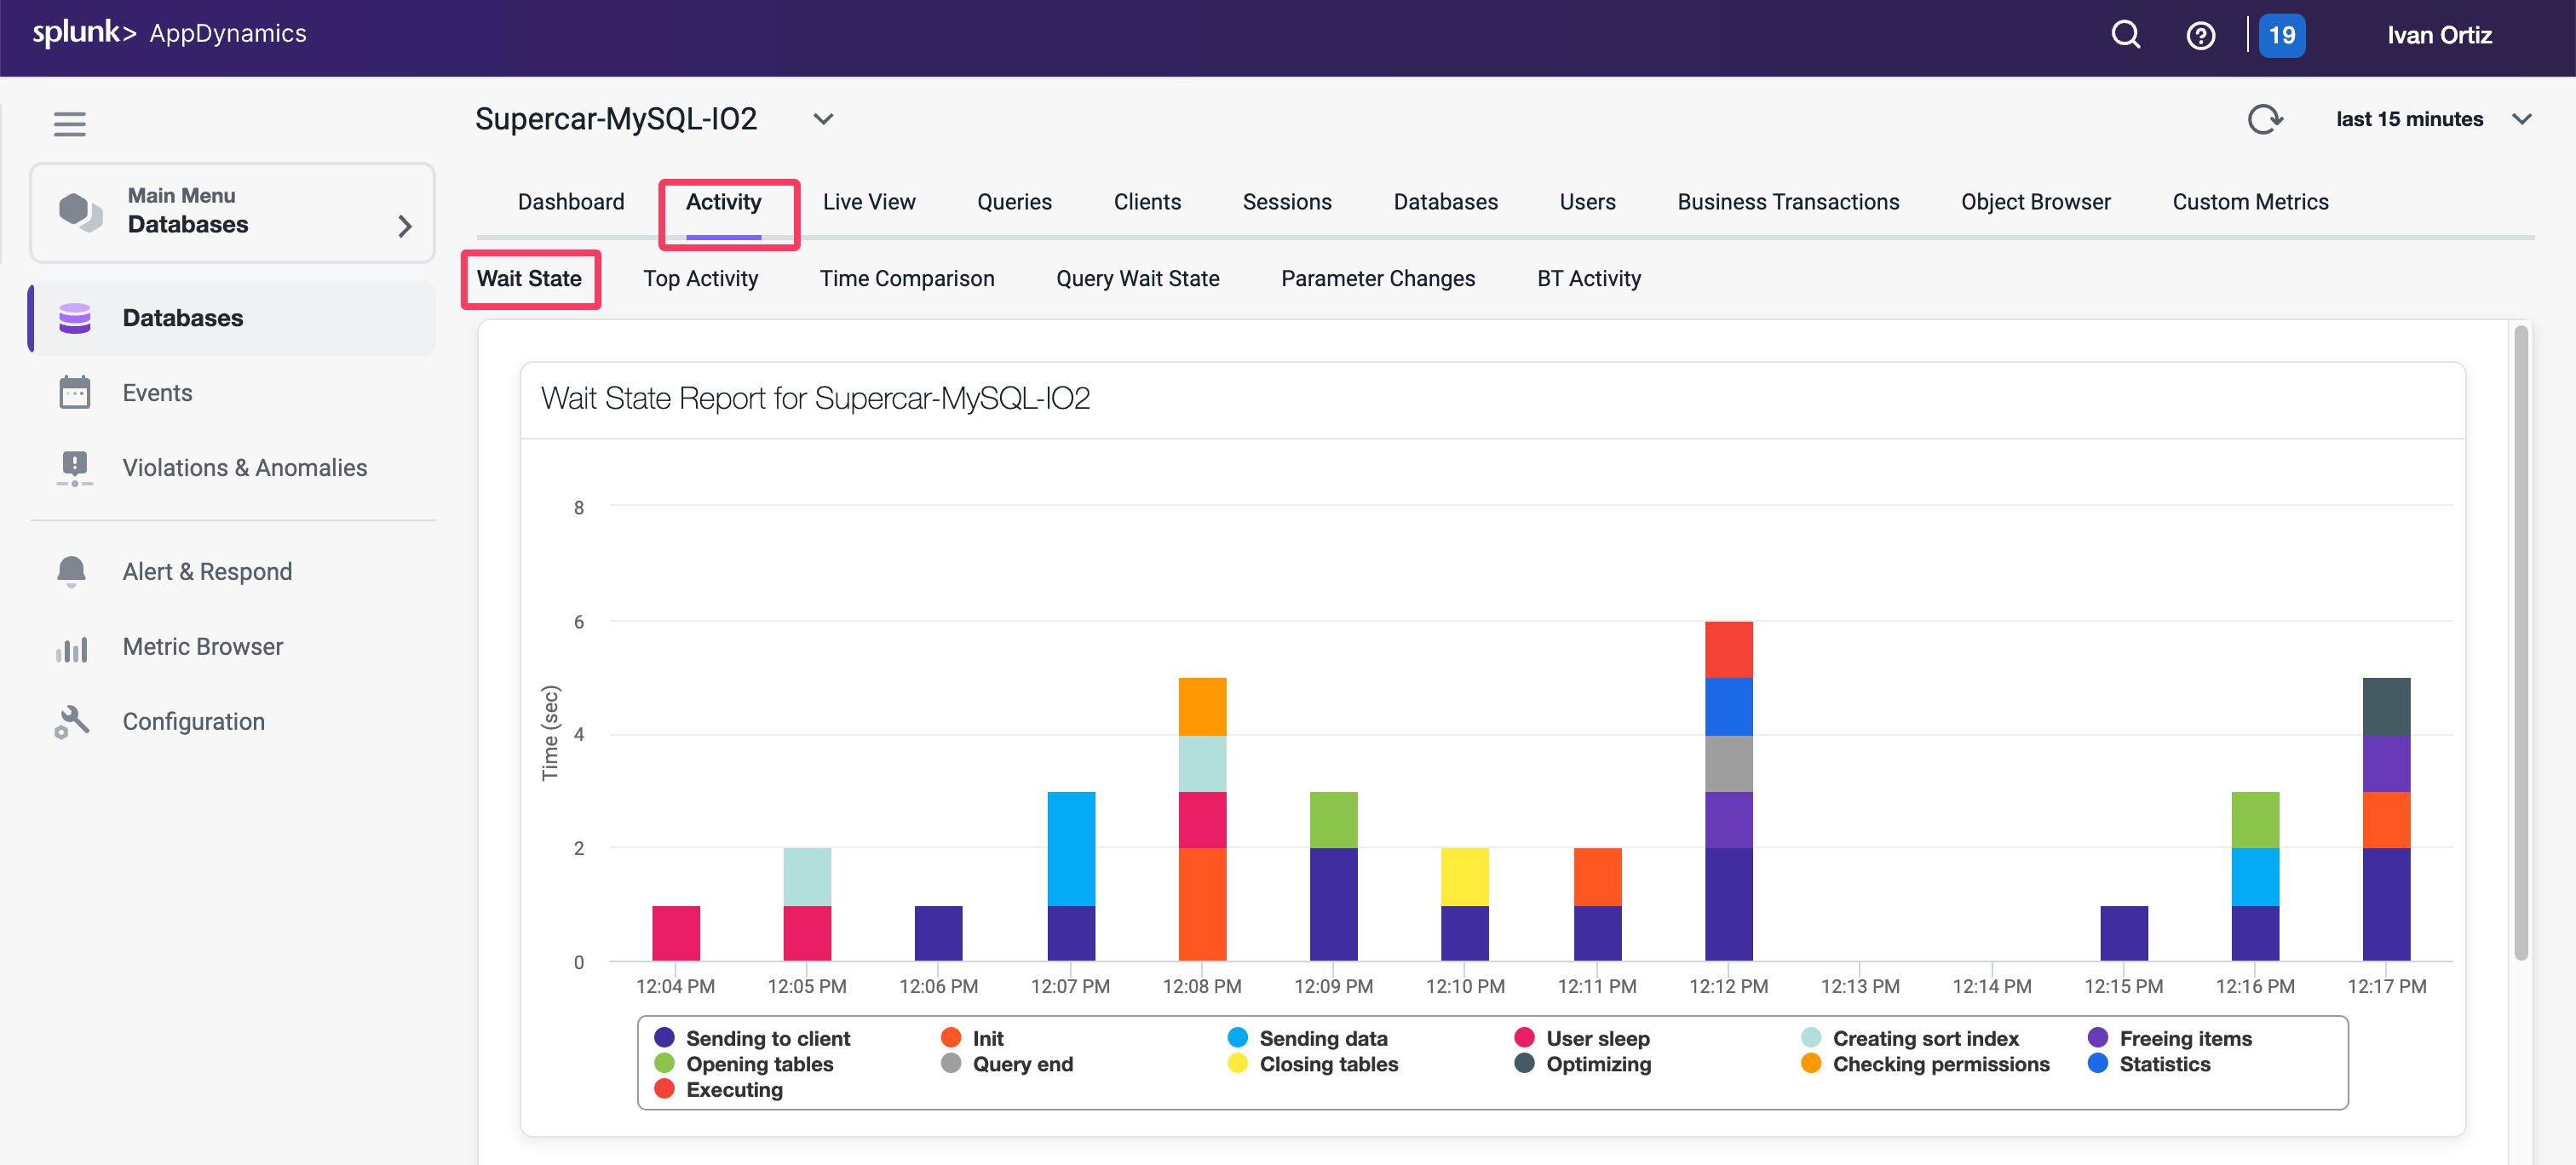
Review the Reports in the Database Activity Window
There are up to nine different reports available in Database Visibility on the Database Activity Window. The reports available depend on the database platform being monitored. In this exercise we will review three of the most common reports.
Wait State Report
Top Activity Report
Query Wait State Report
Wait State Report
This report displays time-series data on Wait Events (states) within the database. Each distinct wait is color-coded, and the Y-axis displays time in seconds. This report also displays data in a table and highlights the time spent in each wait state for each SQL statement.
The wait states consuming the most time may point to performance bottlenecks. For example, db file sequential reads may be caused by segment header contention on indexes or by disk contention.
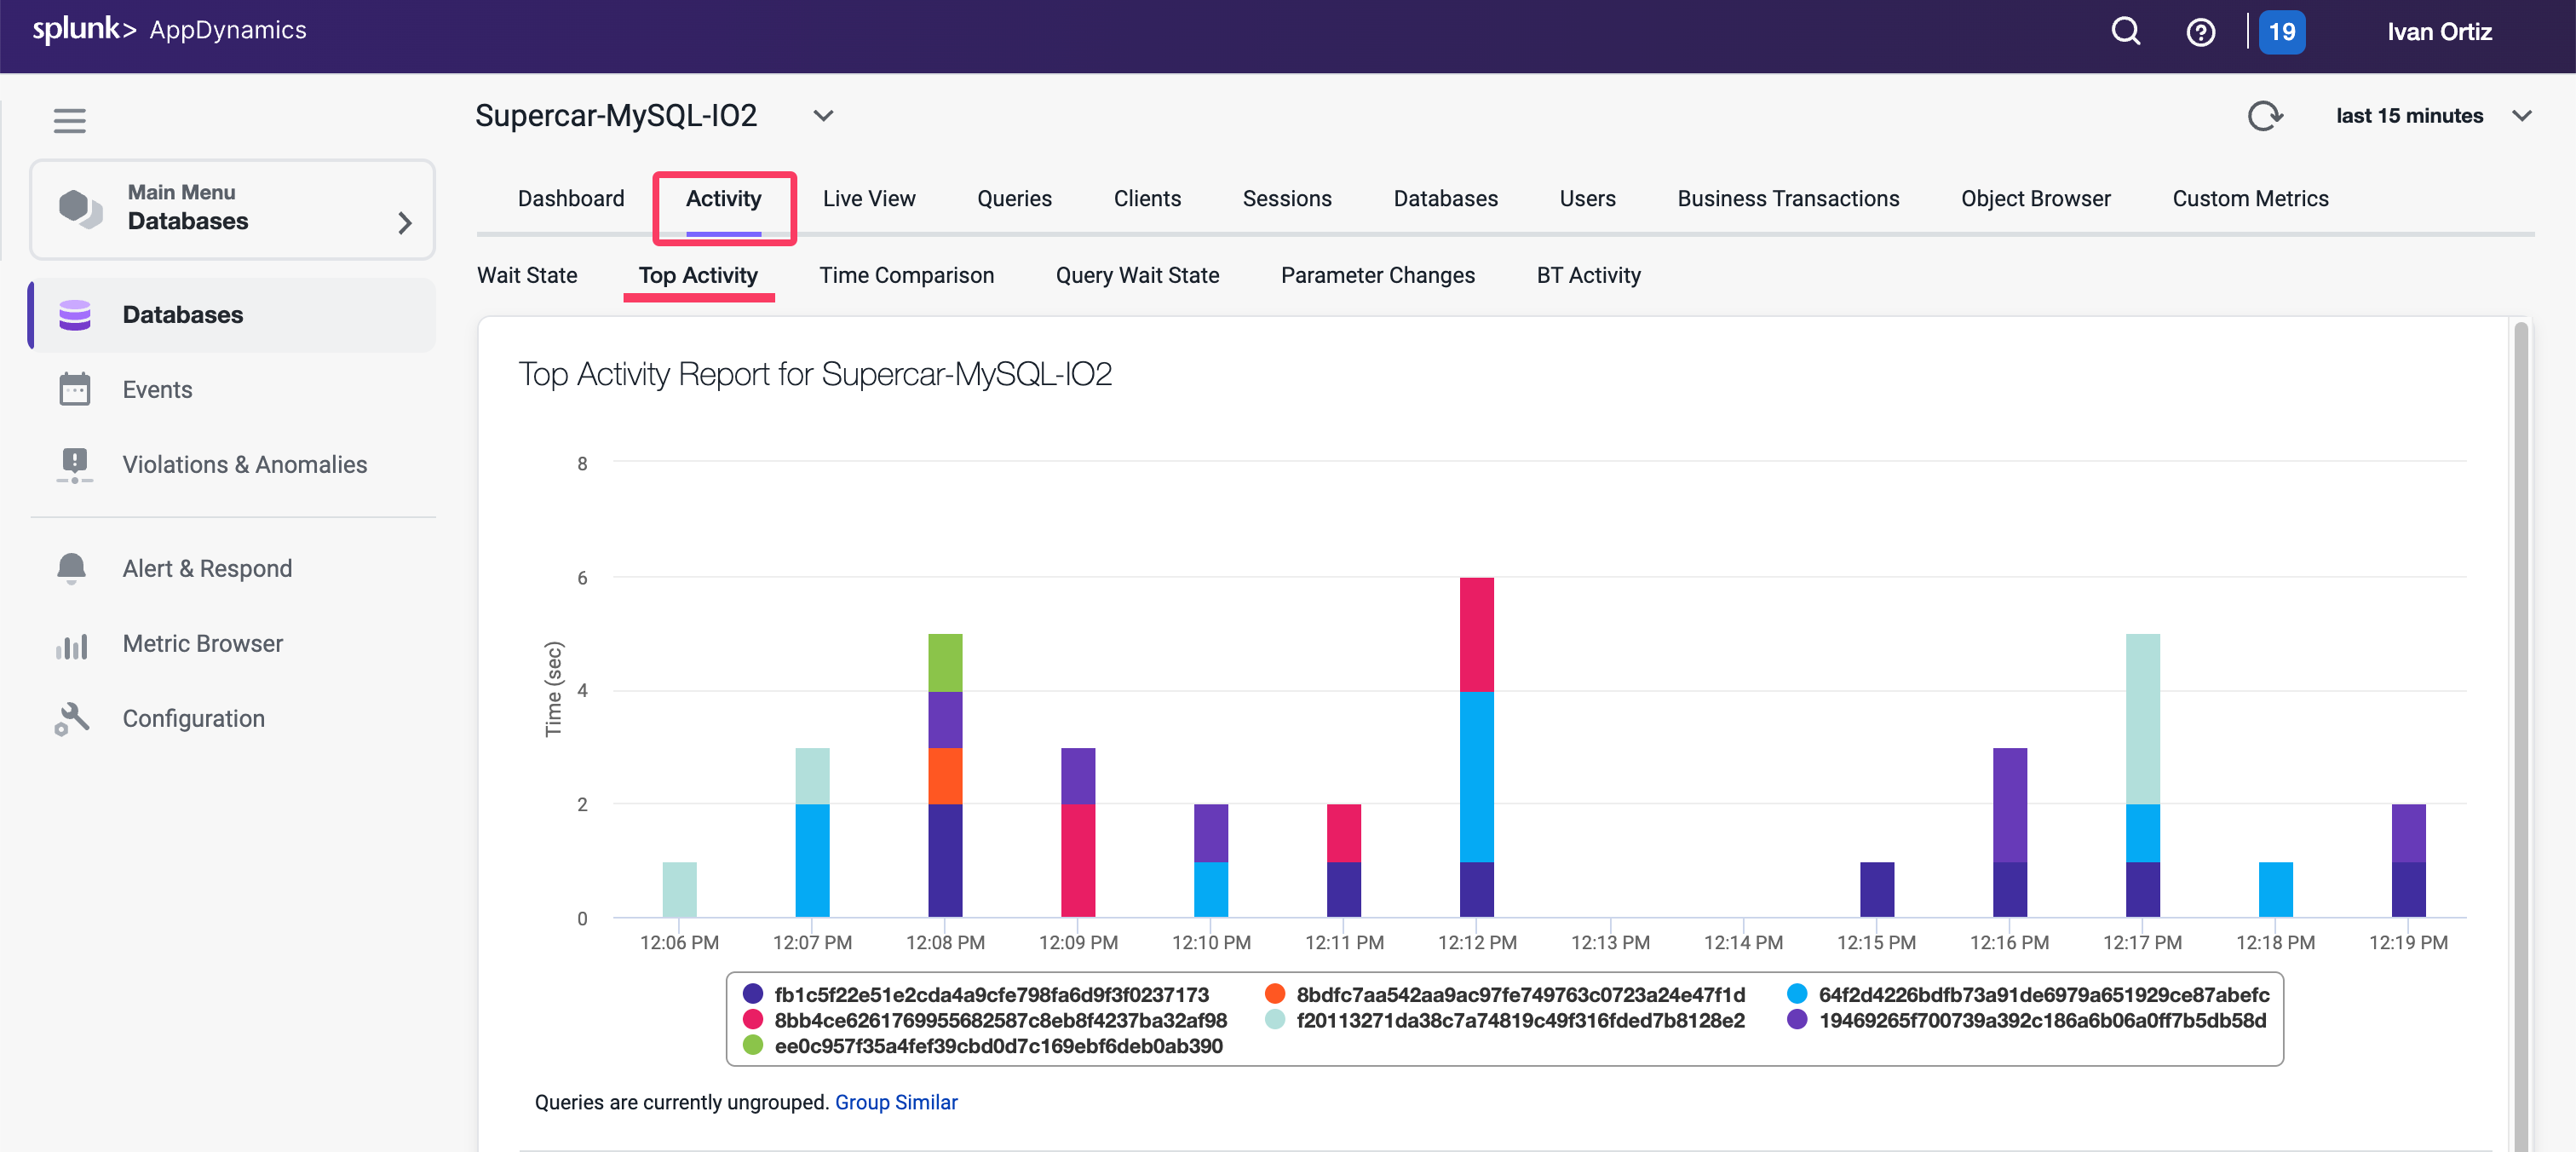
Top Activity Report
This report displays the top time in database SQL statements in a time-series view. This report also displays data in a table and highlights the time spent in the database for each of 10 top SQL statements.
Use this report to see which SQL statements are using the most database time. This helps to determine the impact of specific SQL statements on overall system performance allowing you to focus your tuning efforts on the statements that have the most impact on database performance.
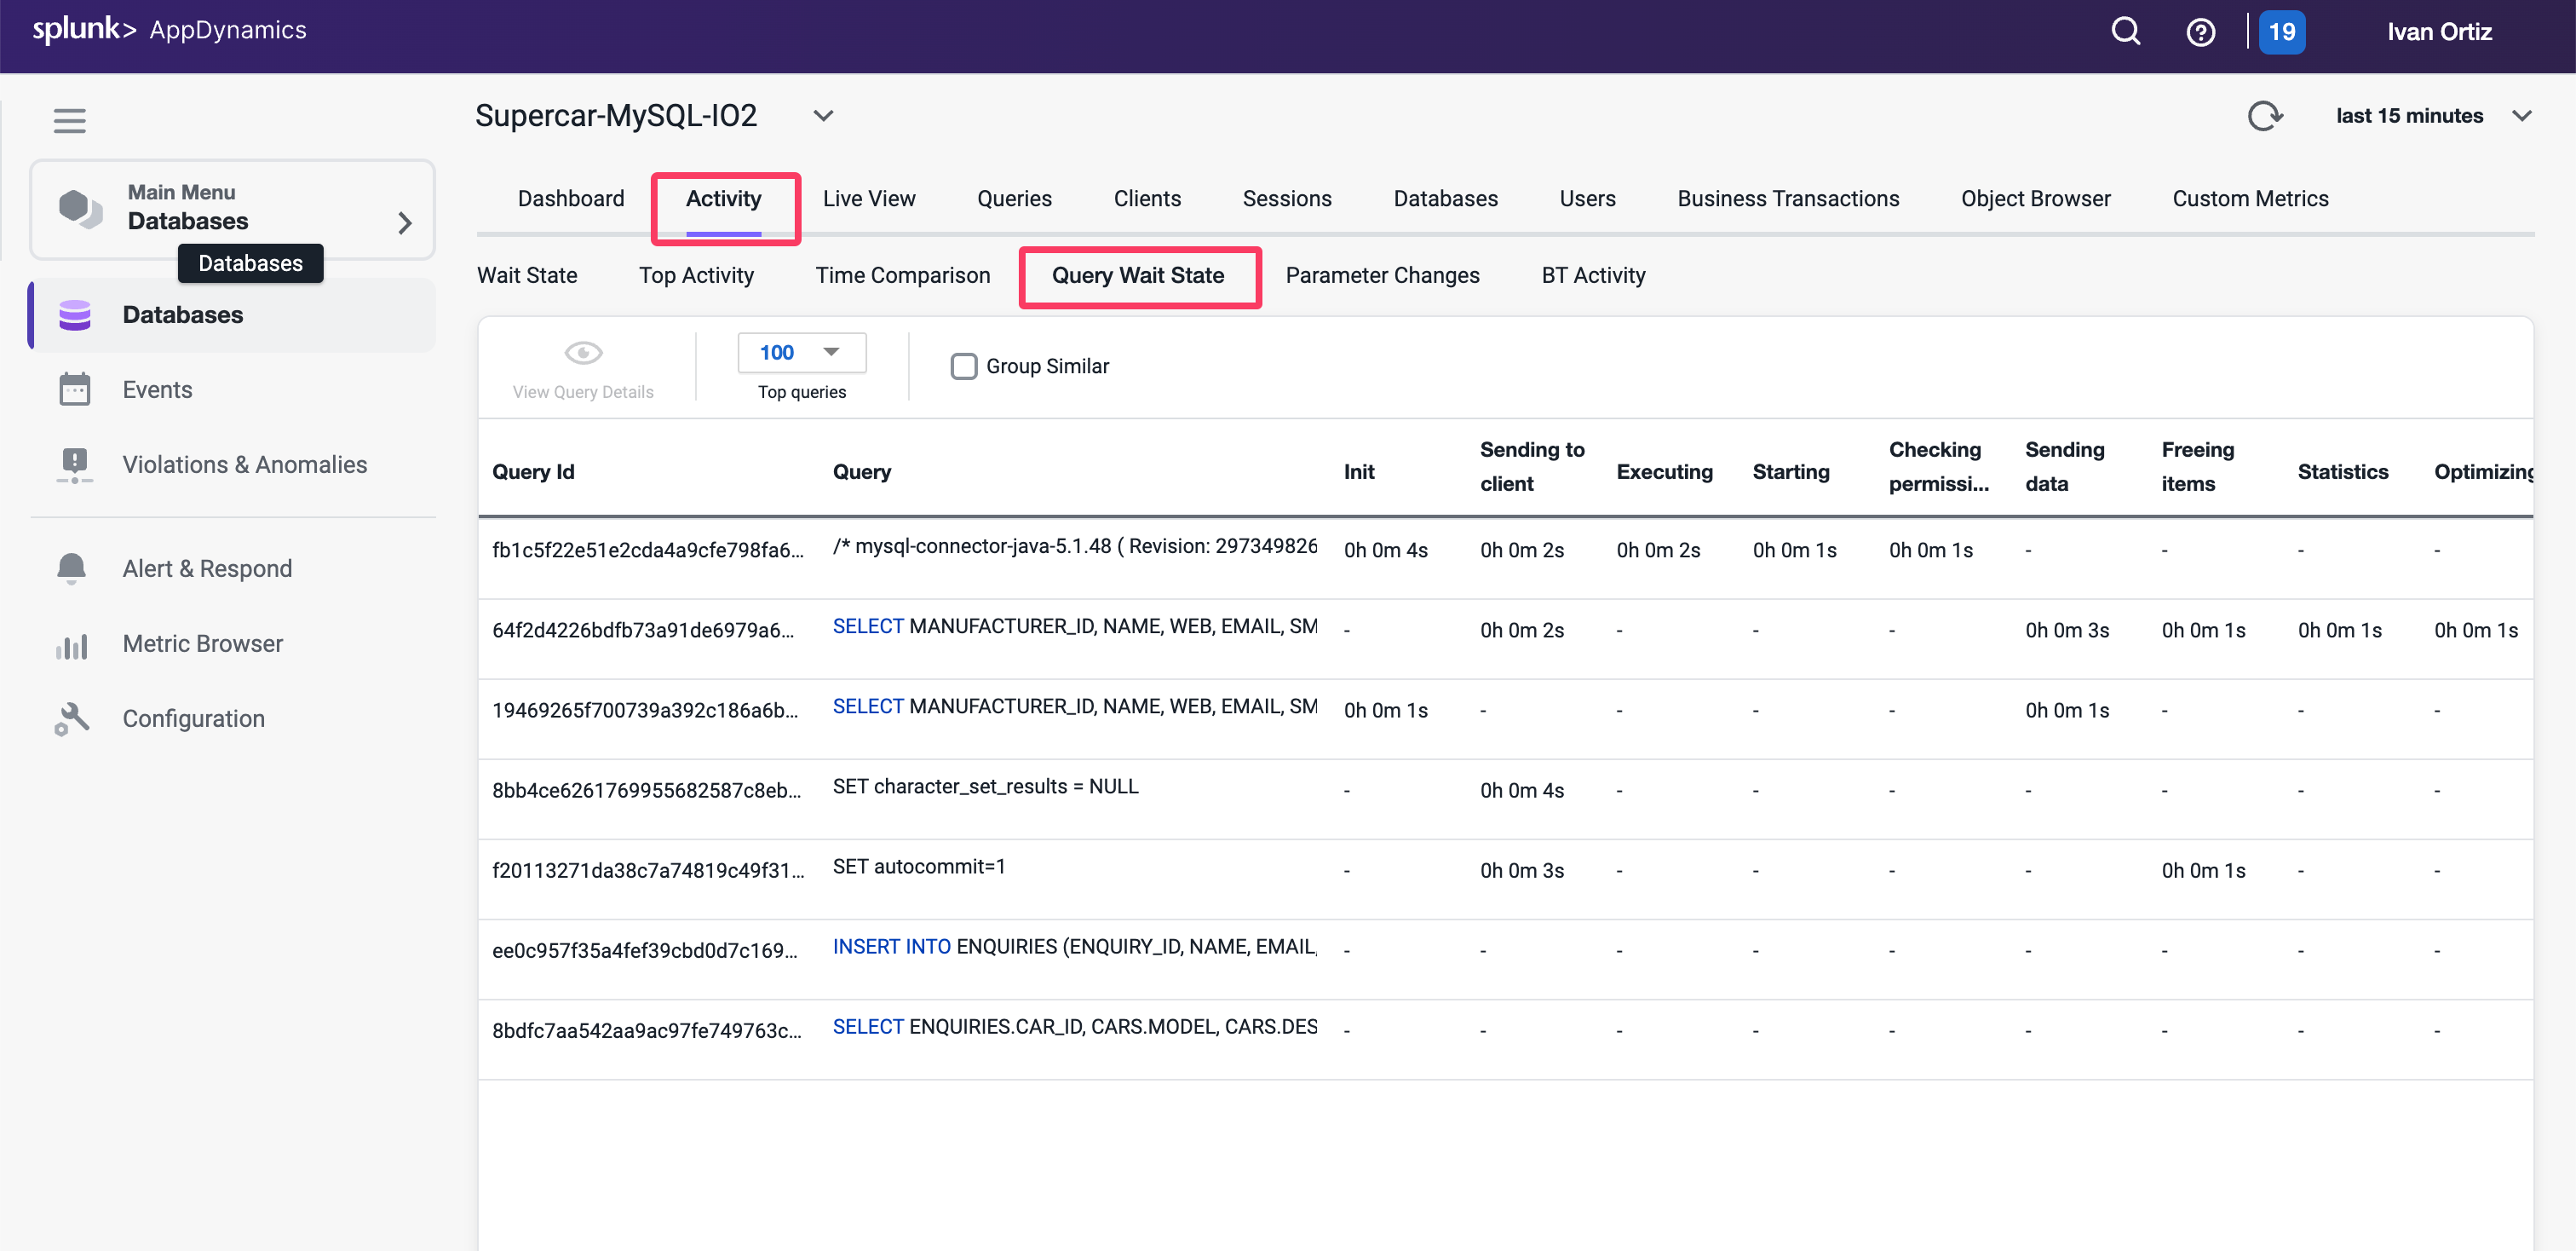
Query Wait State Report
This report displays the wait times for the top (10, 50, 100, 200) queries. This report also displays data in a table and highlights the time each query is spending in different wait states. Use the columns to sort the queries by the different wait states.
You can read more about the Reports in the Database Activity Window here
Monitor and Troubleshoot - Part 2
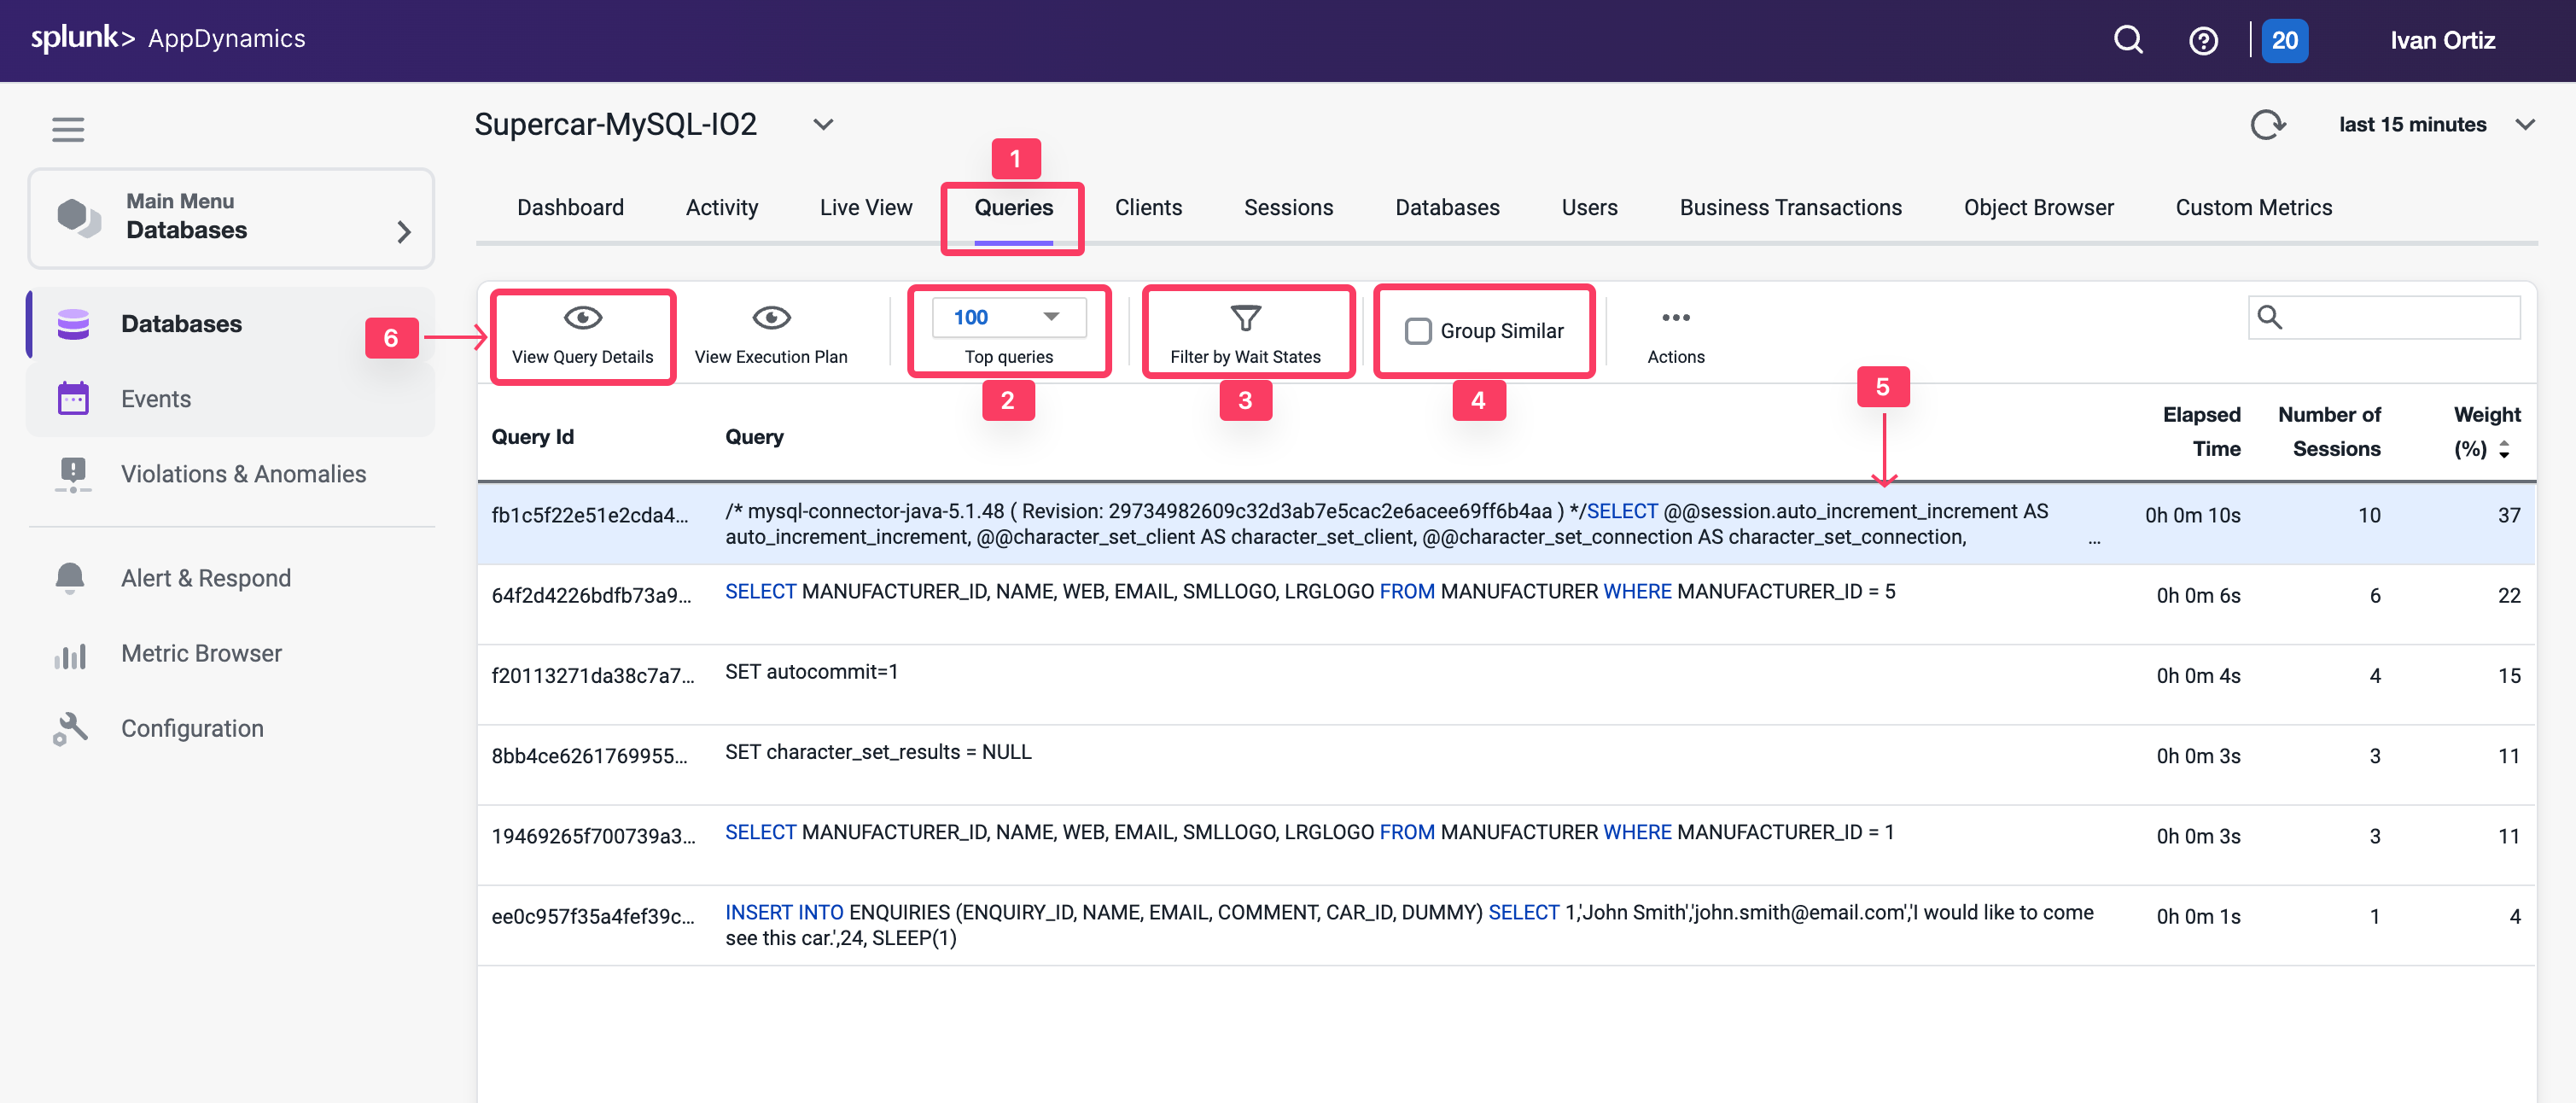
Review the Queries Dashboard
The Queries window displays the SQL statements and stored procedures that consume the most time in the database. You can compare the query weights to other metrics such as SQL wait times to determine SQL that requires tuning.
Queries tab: Displays the queries window.
Top Queries dropdown: Displays the top 5, 10, 100 or 200 queries.
Filter by Wait States: Enables you to choose wait states to filter the Query list.
Group Similar: Groups together queries with the same syntax.
Click on the query that shows the largest Weight (%) used.
View Query Details: Drills into the query details.
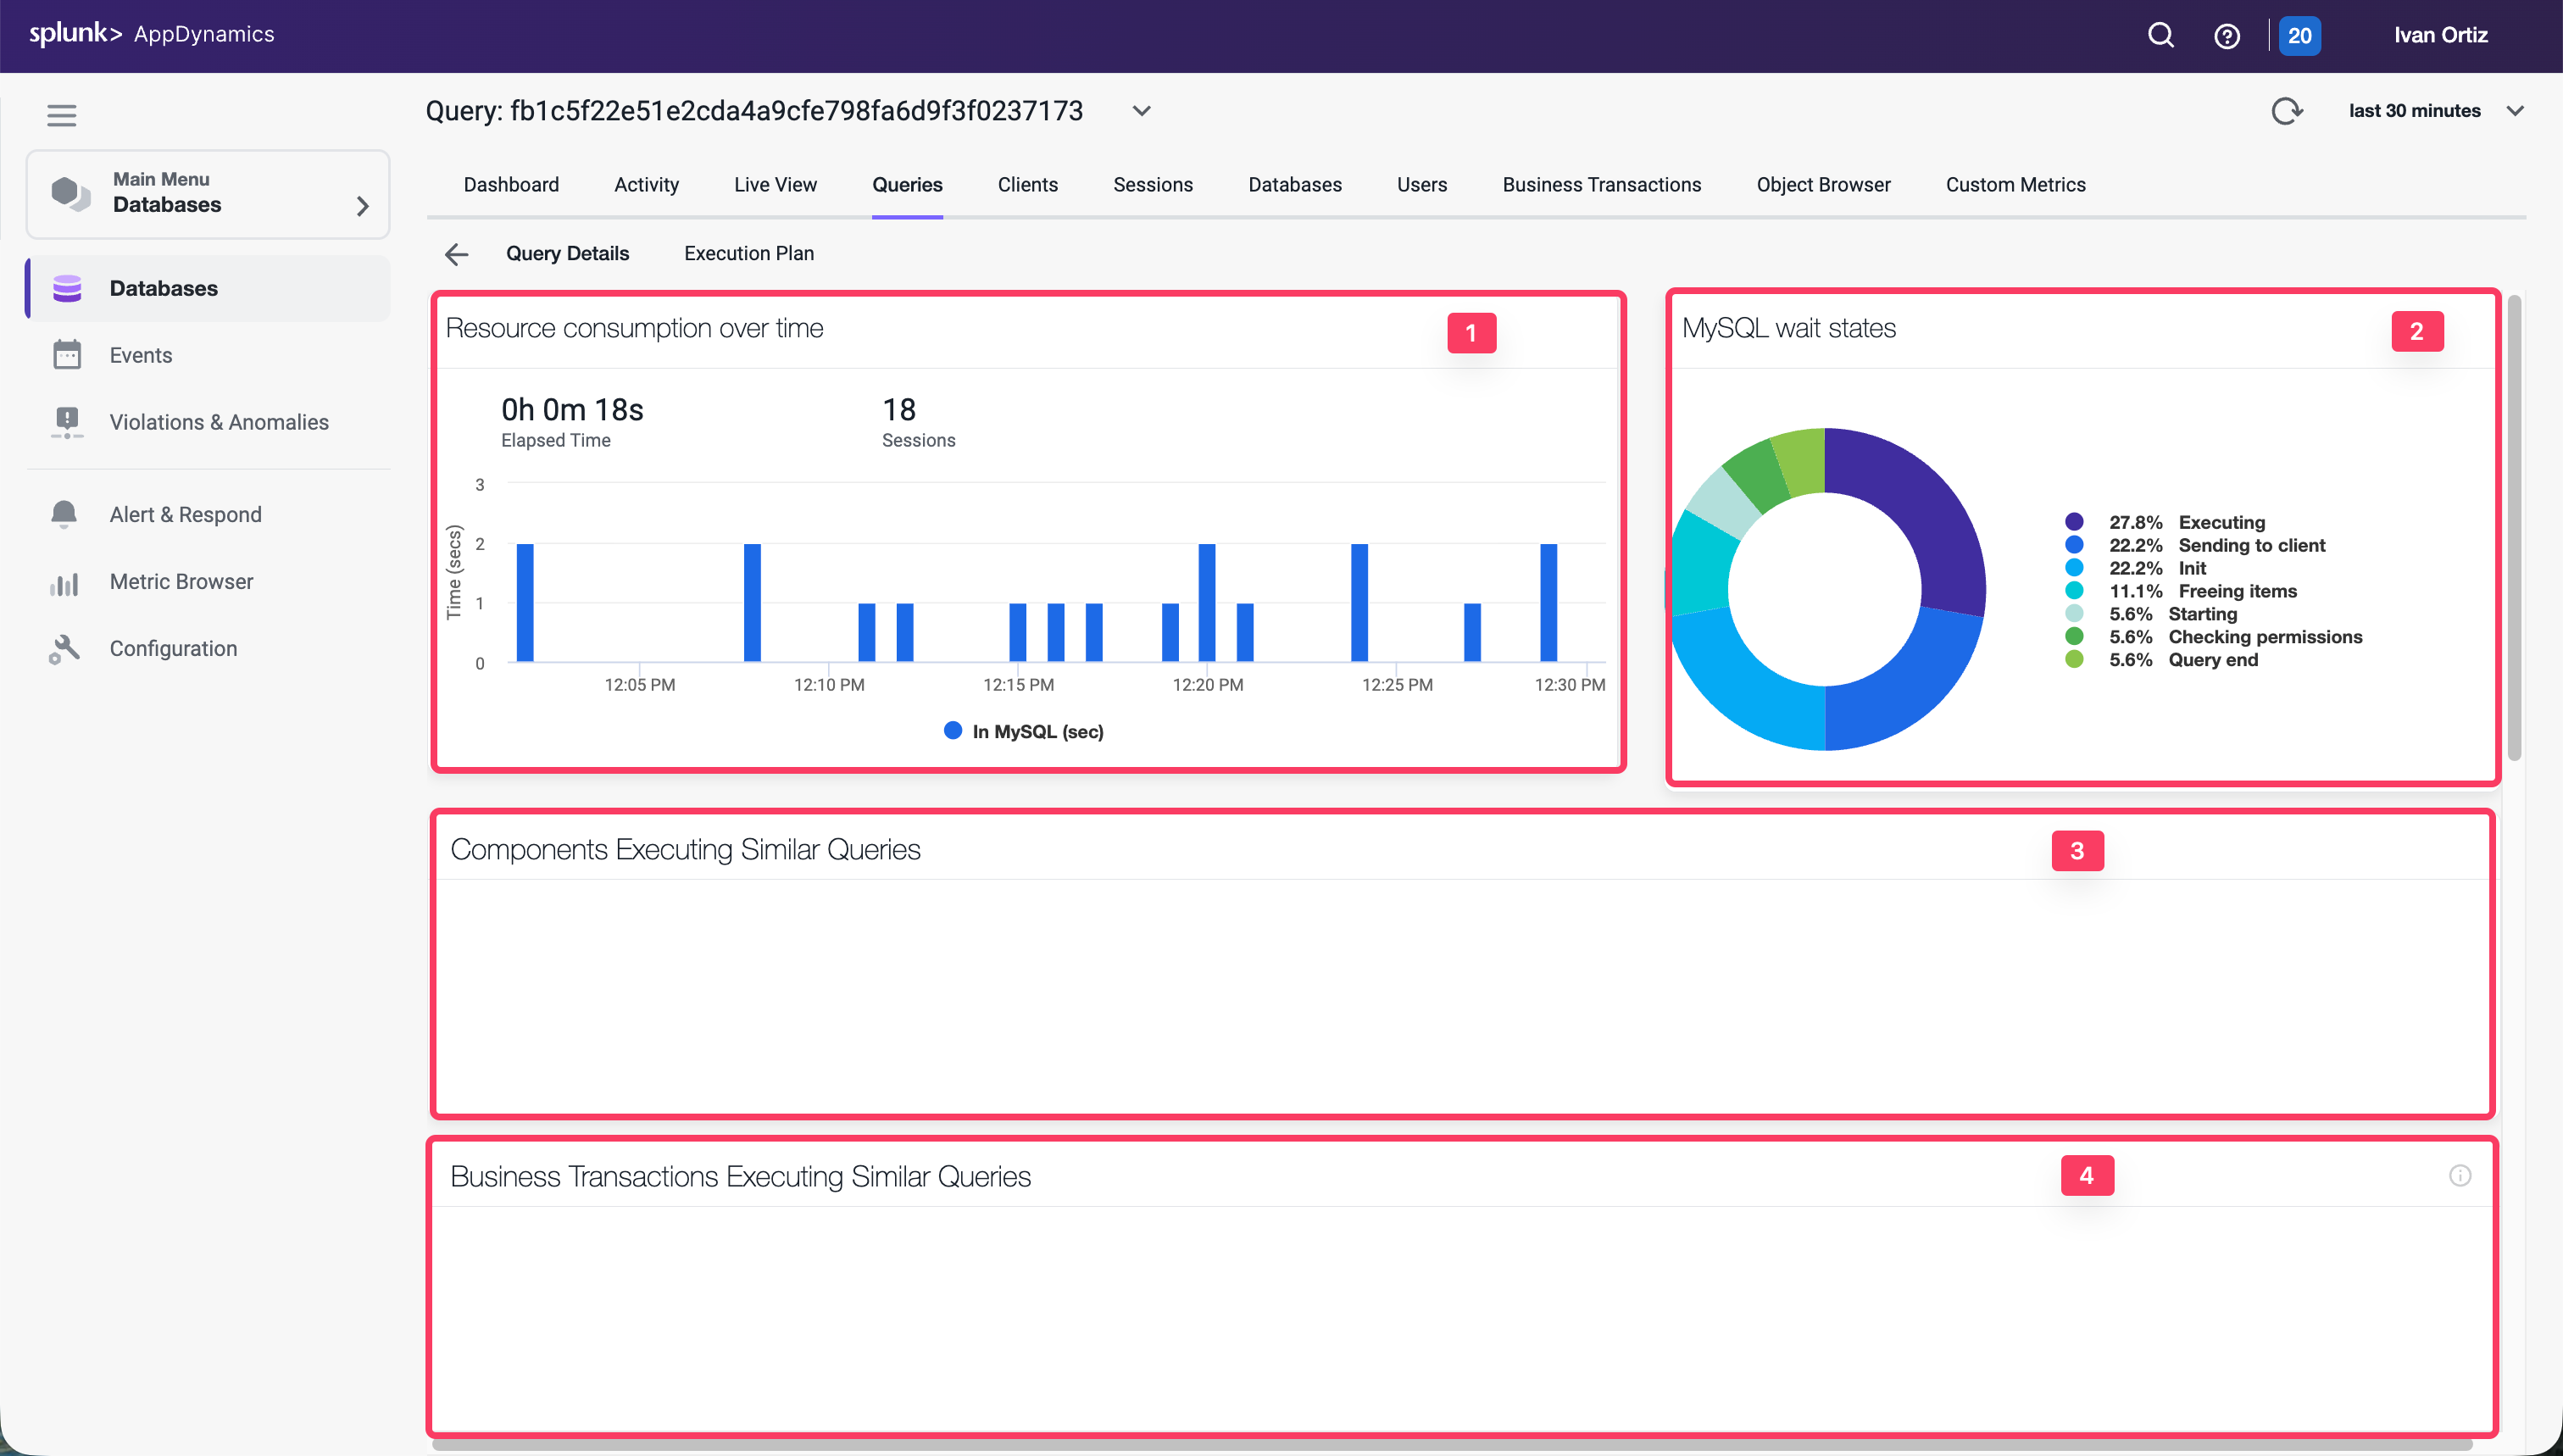
Review the details of an expensive query
Once you have identified the statements on the Database Queries window that are spending the most amount of time in the database, you can dig down deeper for details that can help you tune those SQL statements. The database instance Query Details window displays details about the query selected on the Database Queries window.
Resource consumption over time: Displays the amount of time the query spent in the database using resources, the number of executions, and the amount of CPU time consumed.
Wait states: The activities that contribute to the time it takes the database to service the selected SQL statement. The wait states consuming the most time may point to performance bottlenecks.
Components Executing Similar Queries: Displays the Nodes that execute queries similar to this query.
Business Transactions Executing Similar Queries: Displays the Java business transactions that execute queries similar to this query.
Use the outer scroll bar on the right to scroll down.
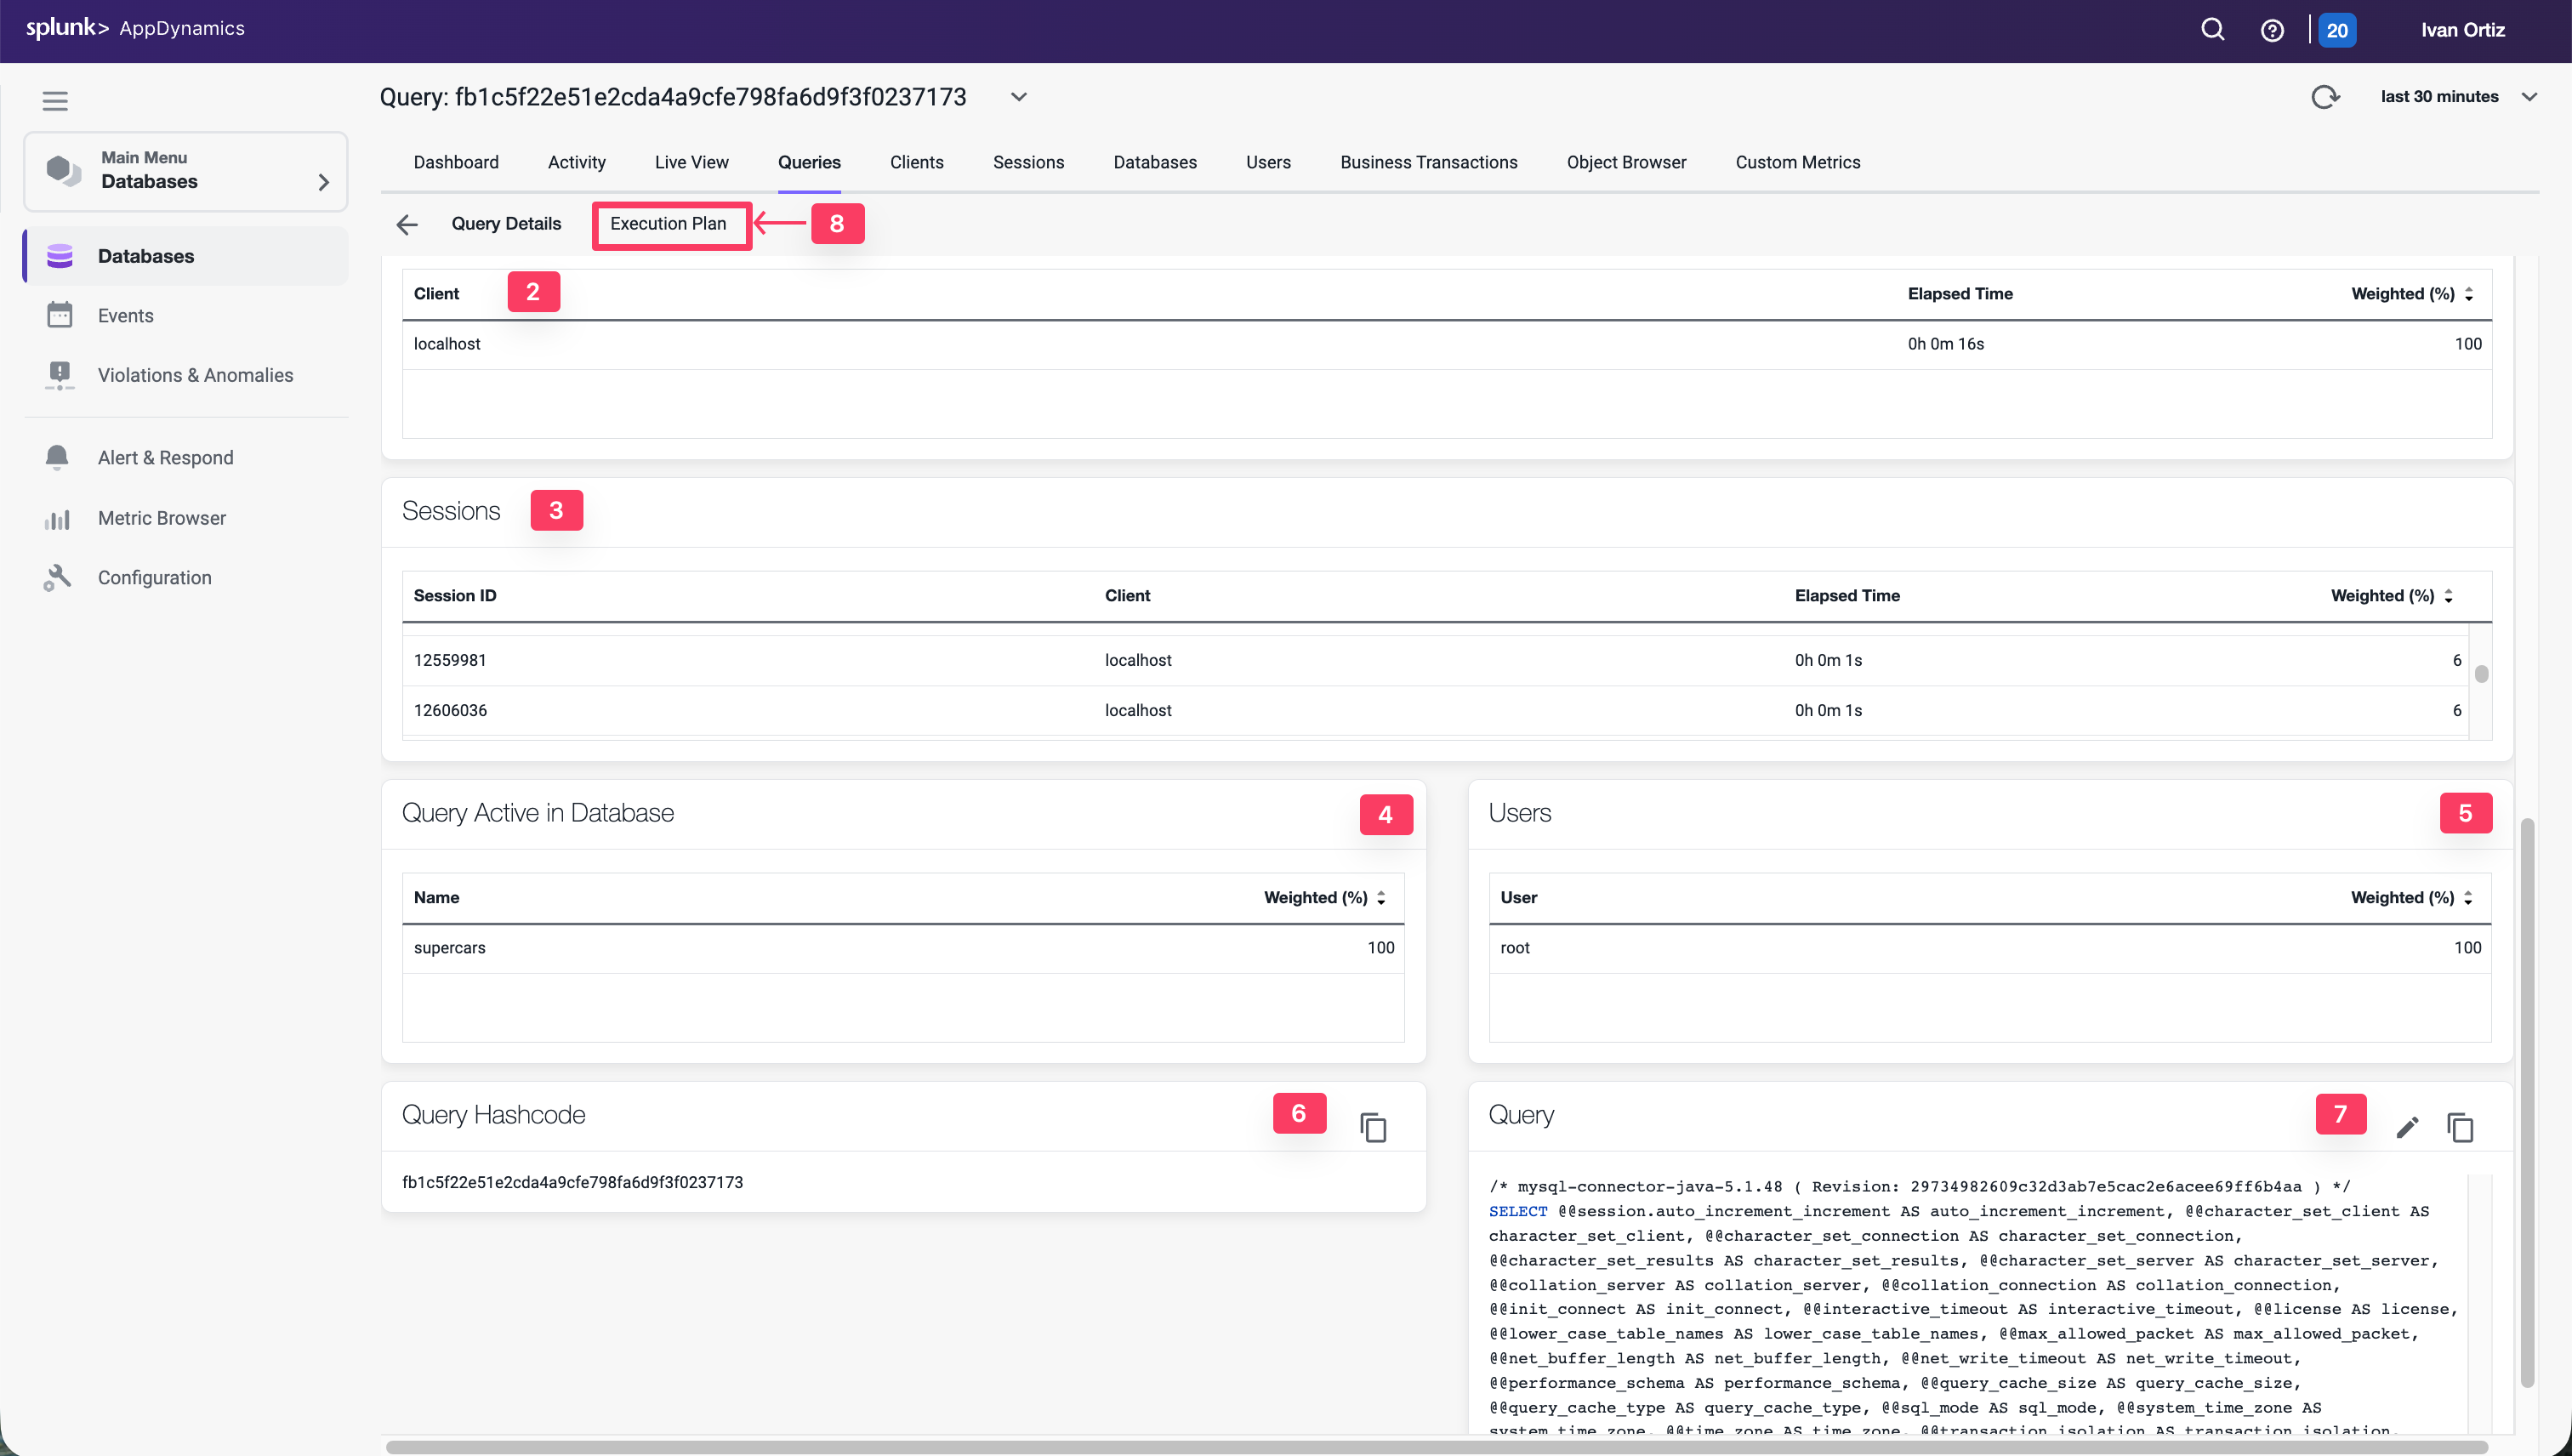
Clients: Displays the machines that executed the selected SQL statement and the percentage of the total time required to execute the statement performed by each machine.
Sessions: Session of each database instance usage
Query Active in Database: Displays the schemas that have been accessed by this SQL.
Users: Displays the users that executed this query.
Query Hashcode: Displays the unique ID for the query that allows the database server to more quickly locate this SQL statement in the cache.
Query: Displays the entire syntax of the selected SQL statement. You can click the pencil icon in the top right corner of the Query card to edit the query name so that it is easy to identify.
Execution Plan: Displays the the query execution plan window.
Troubleshoot an expensive query
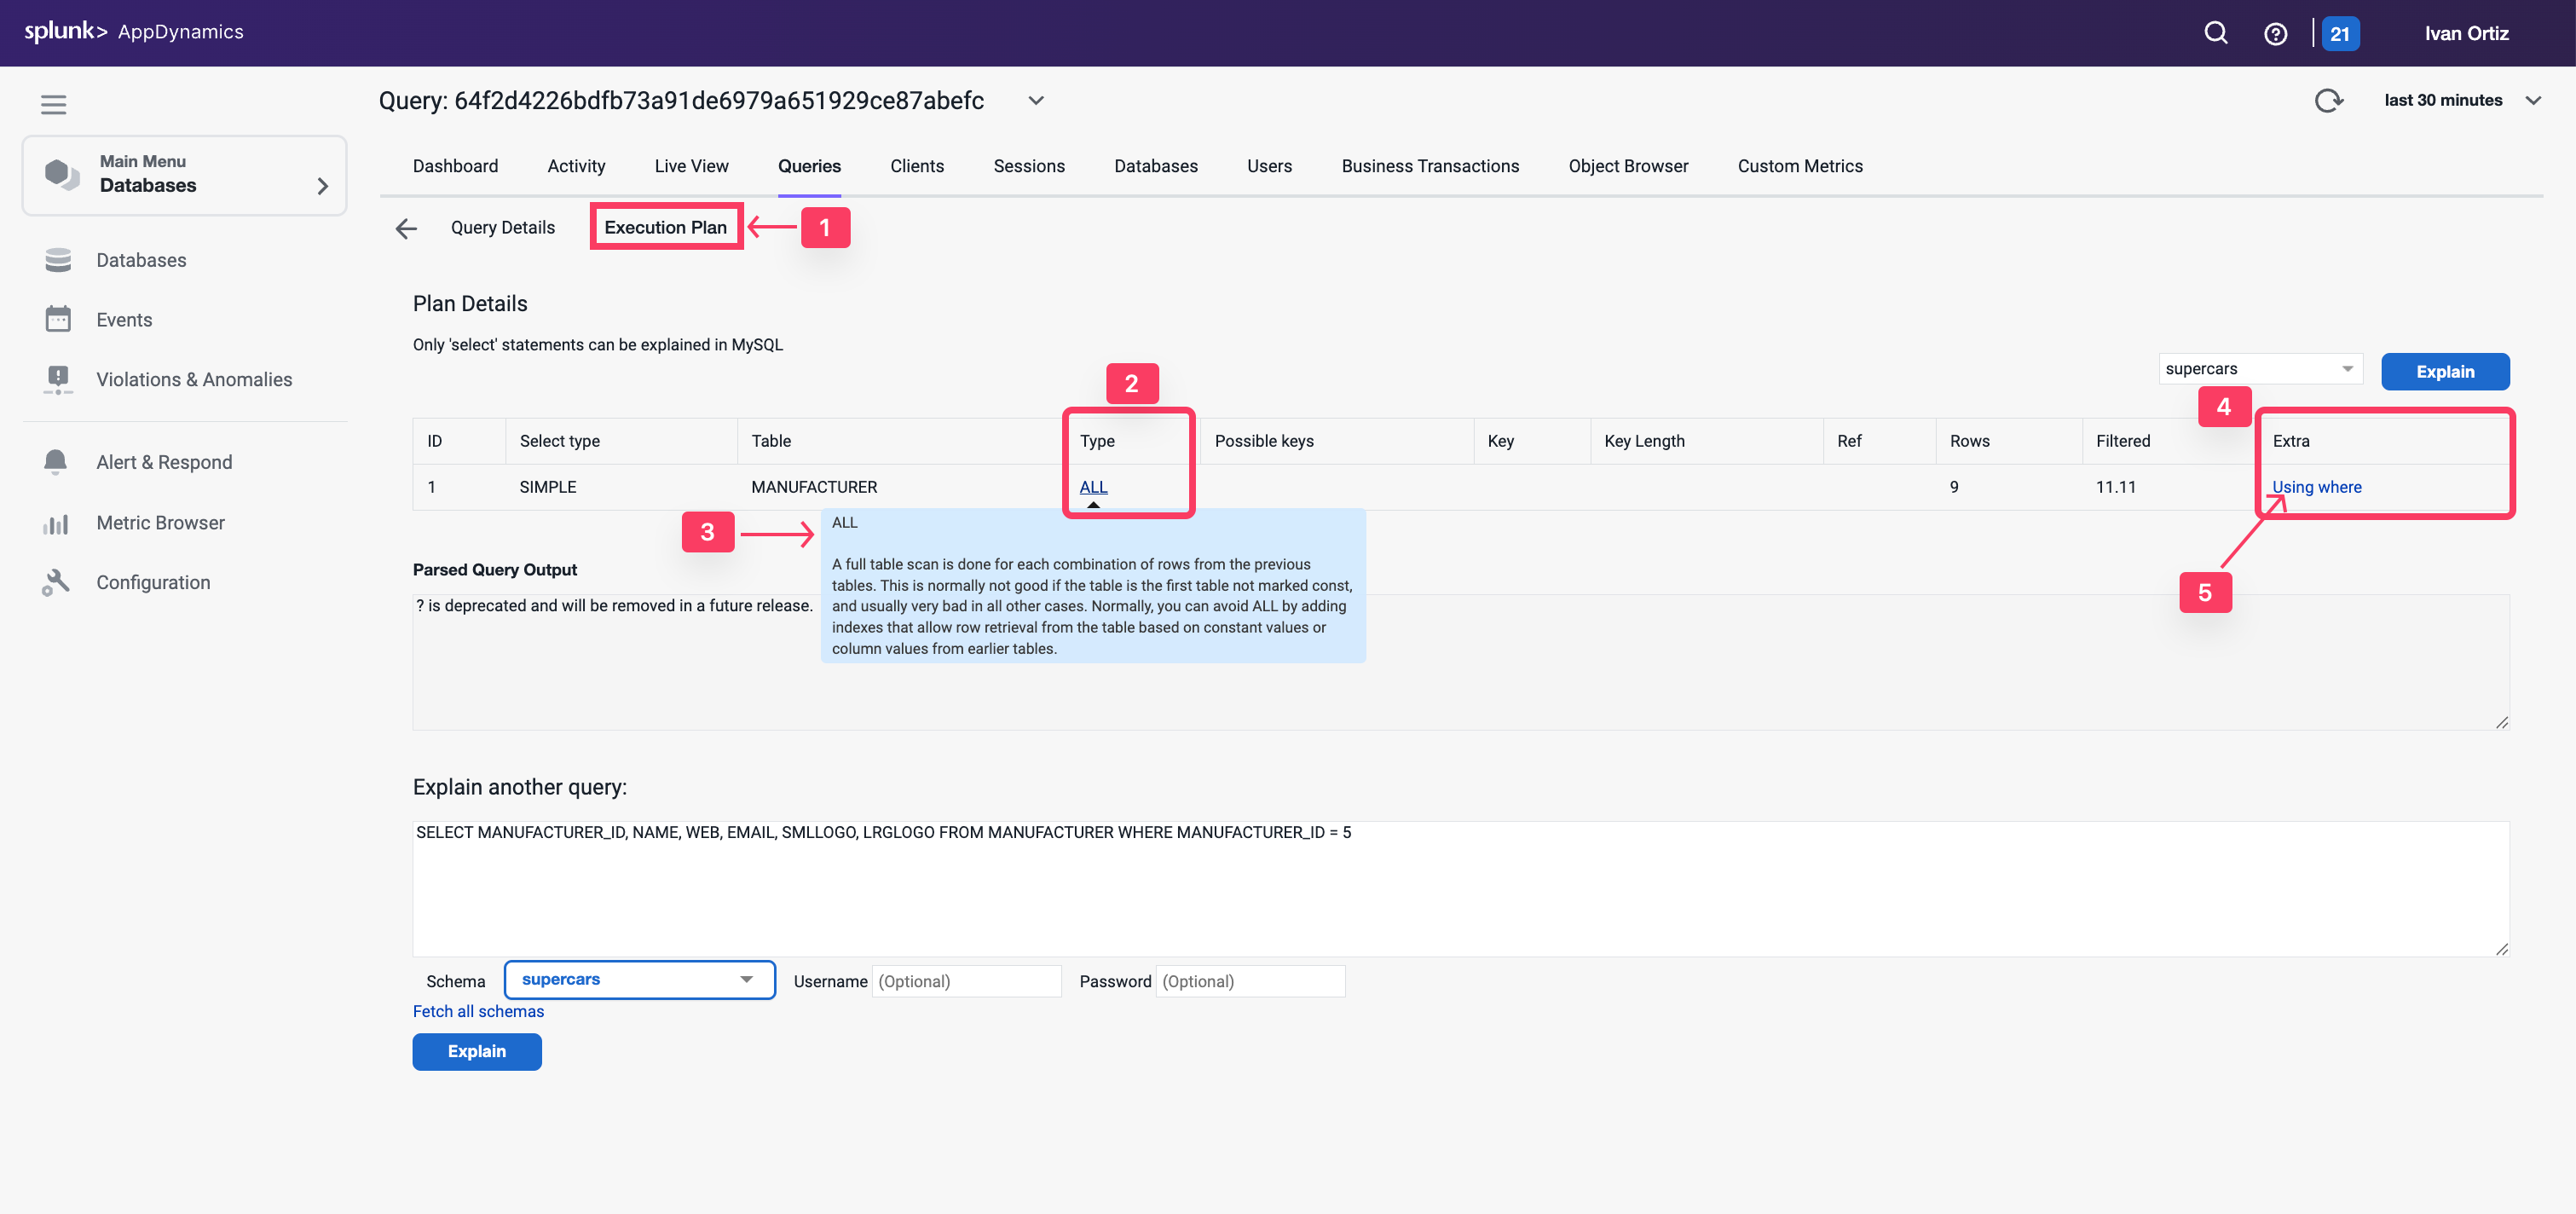
The Database Query Execution Plan window can help you to determine the most efficient execution plan for your queries. Once you’ve discovered a potentially problematic query, you can run the EXPLAIN PLAN statement to check the execution plan that the database created.
A query’s execution plan reveals whether the query is optimizing its use of indexes and executing efficiently. This information is useful for troubleshooting queries that are executing slowly.
Click on the Execution Plan tab
Notice that the join type in the Type column is ALL for each table.
Hover over one of the join types to see the description for the join type.
Examine the entries in the Extras column.
Hover over each of the entries to see the description for the entry.
Let’s investigate the indexes on the table using the Obect Browser next.
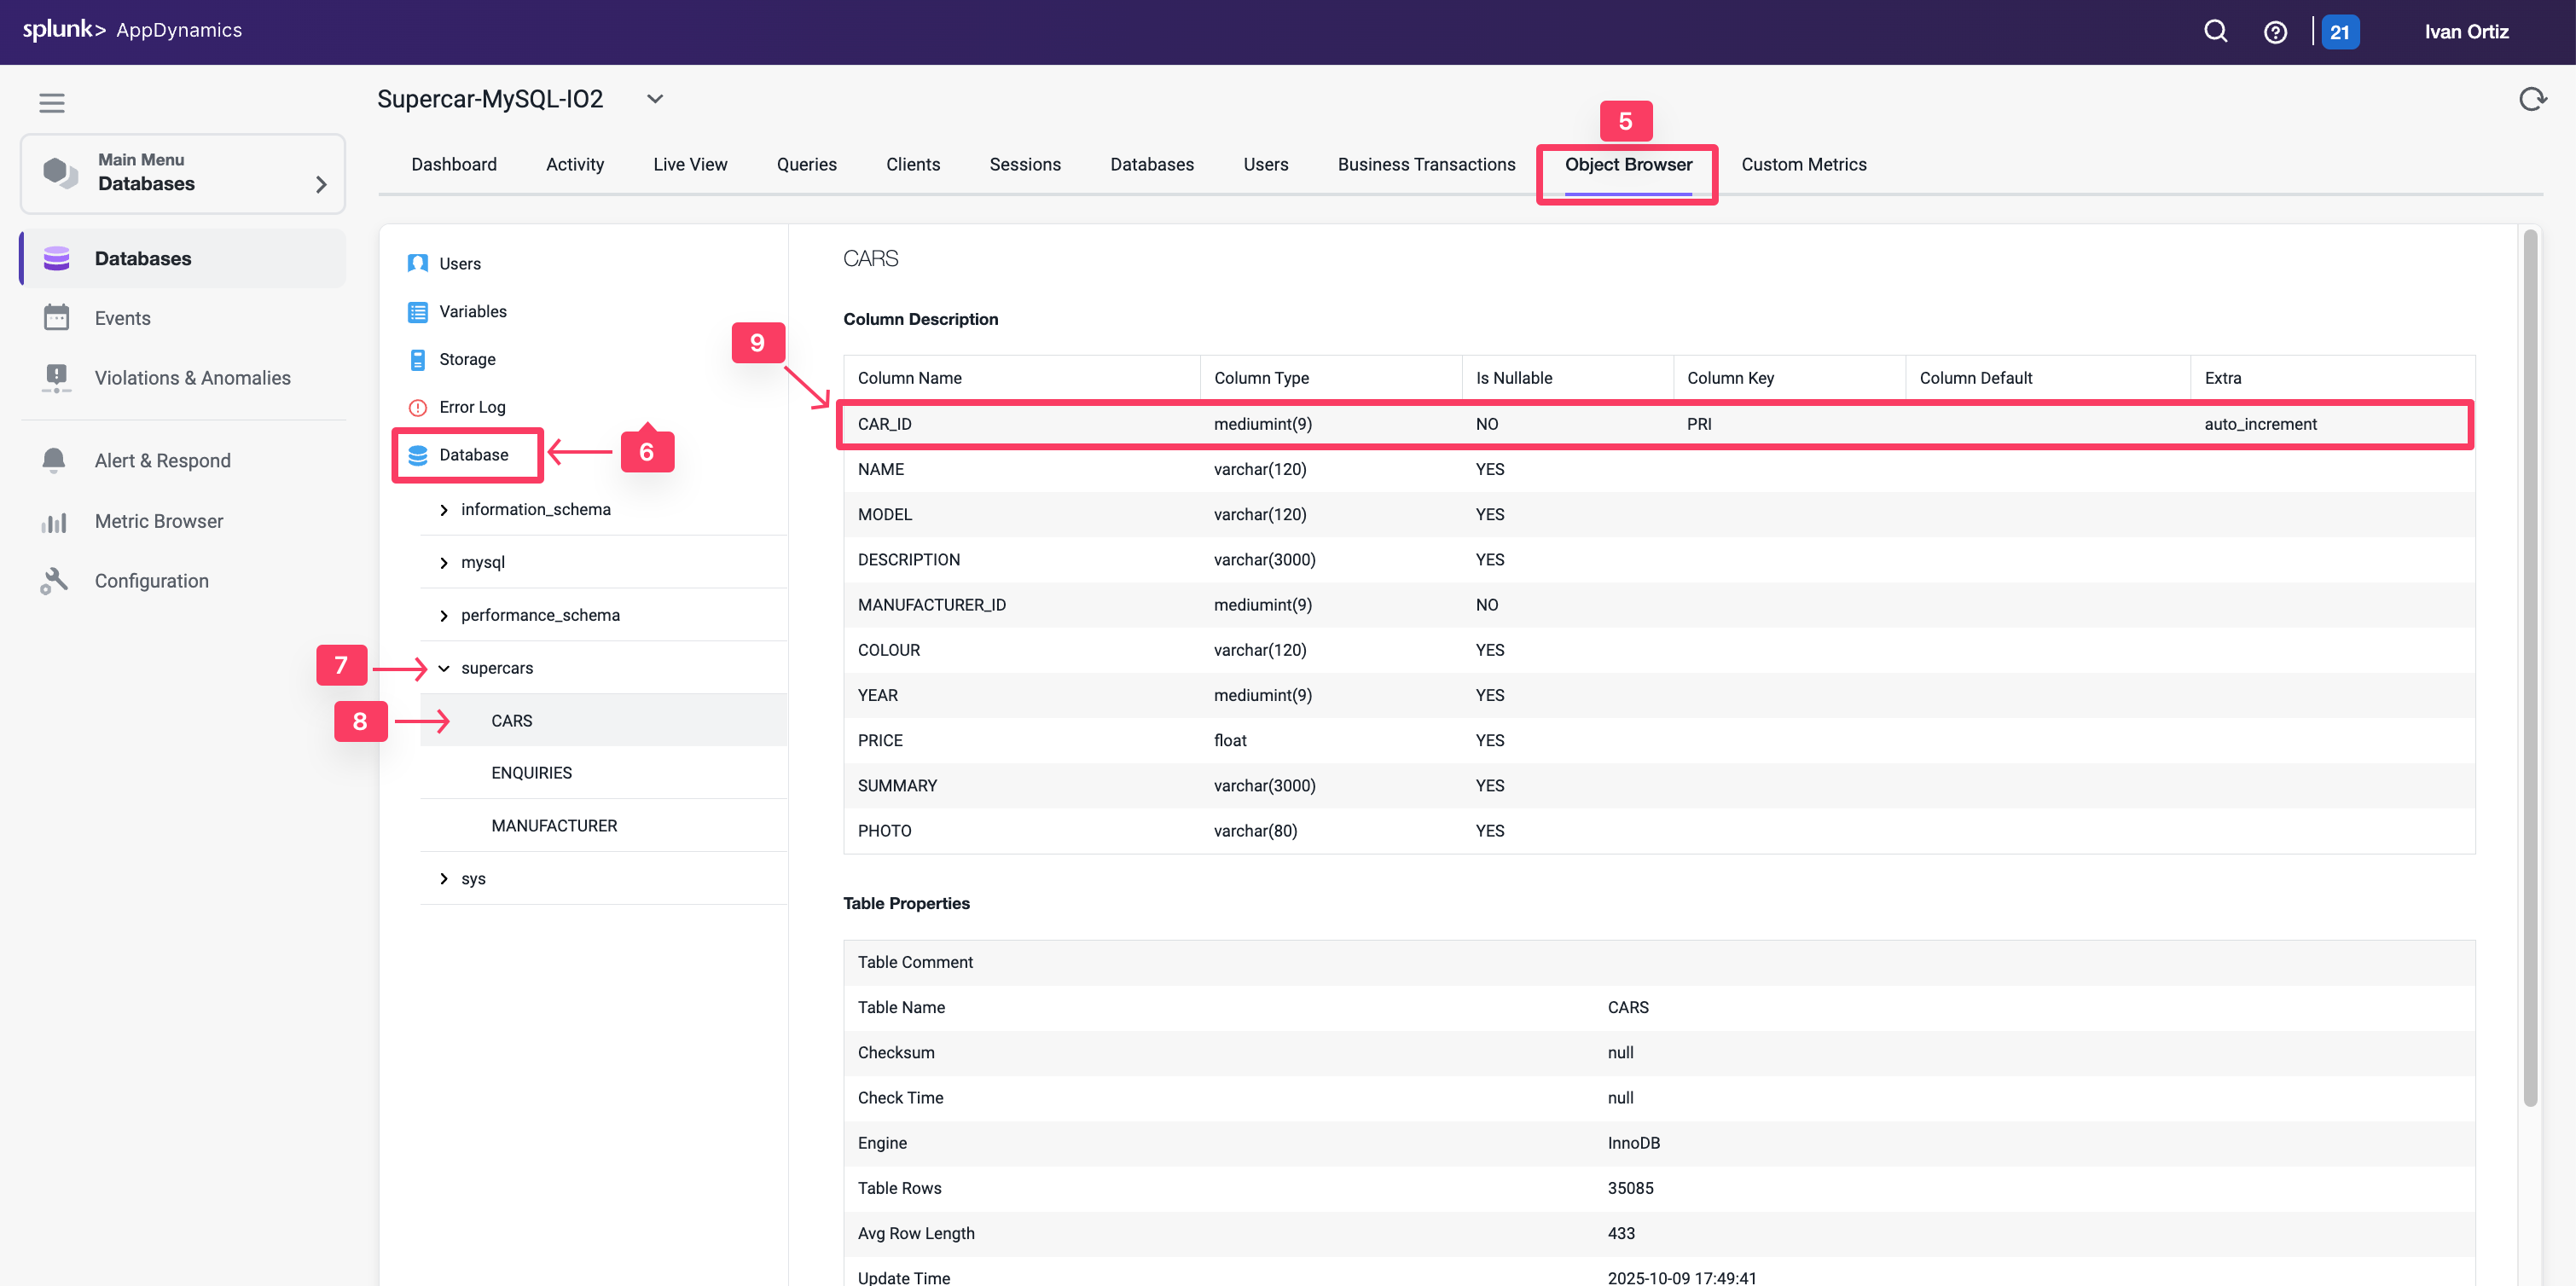
Click on the Object Browser option to view details of the schema for the tables
Click the Database option.
Click on the supercars schema to expand the list of tables.
Click on the CARS table to see the details of the table.
You can see that the CAR_ID column is defined as the primary key
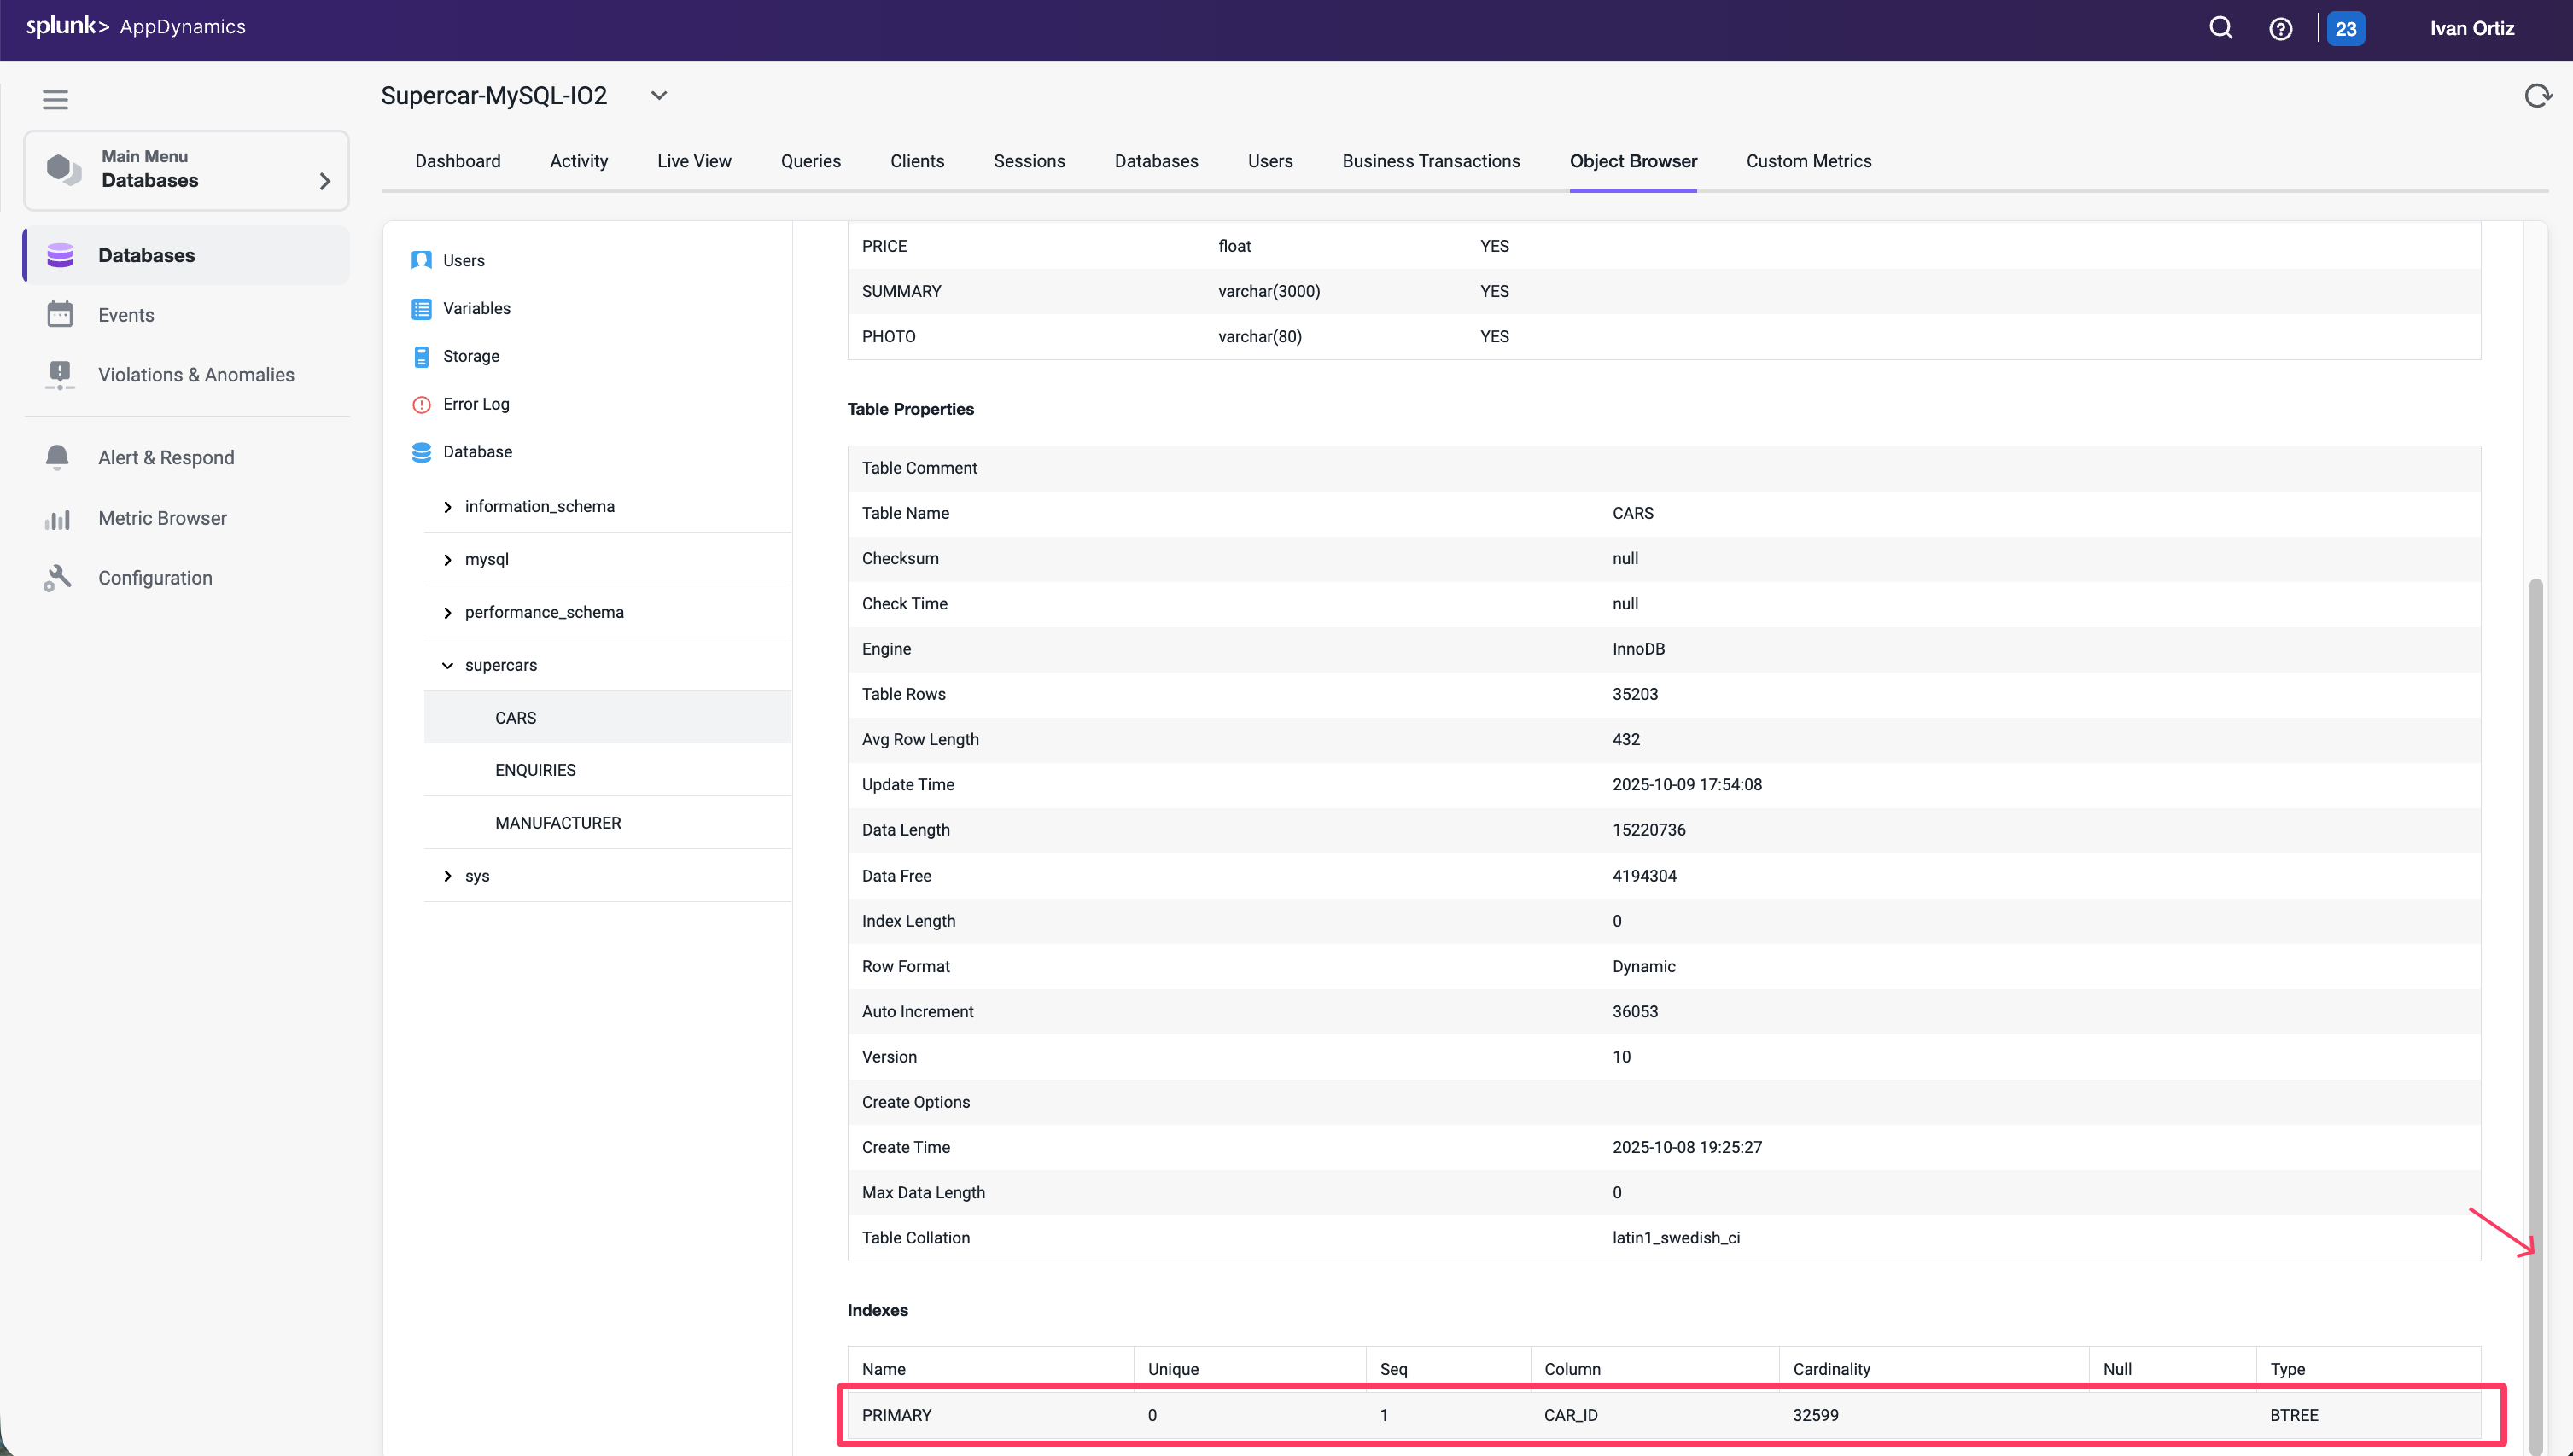
Use the outer scroll bar to scroll down the page.
Notice the primary key index defined in the table.
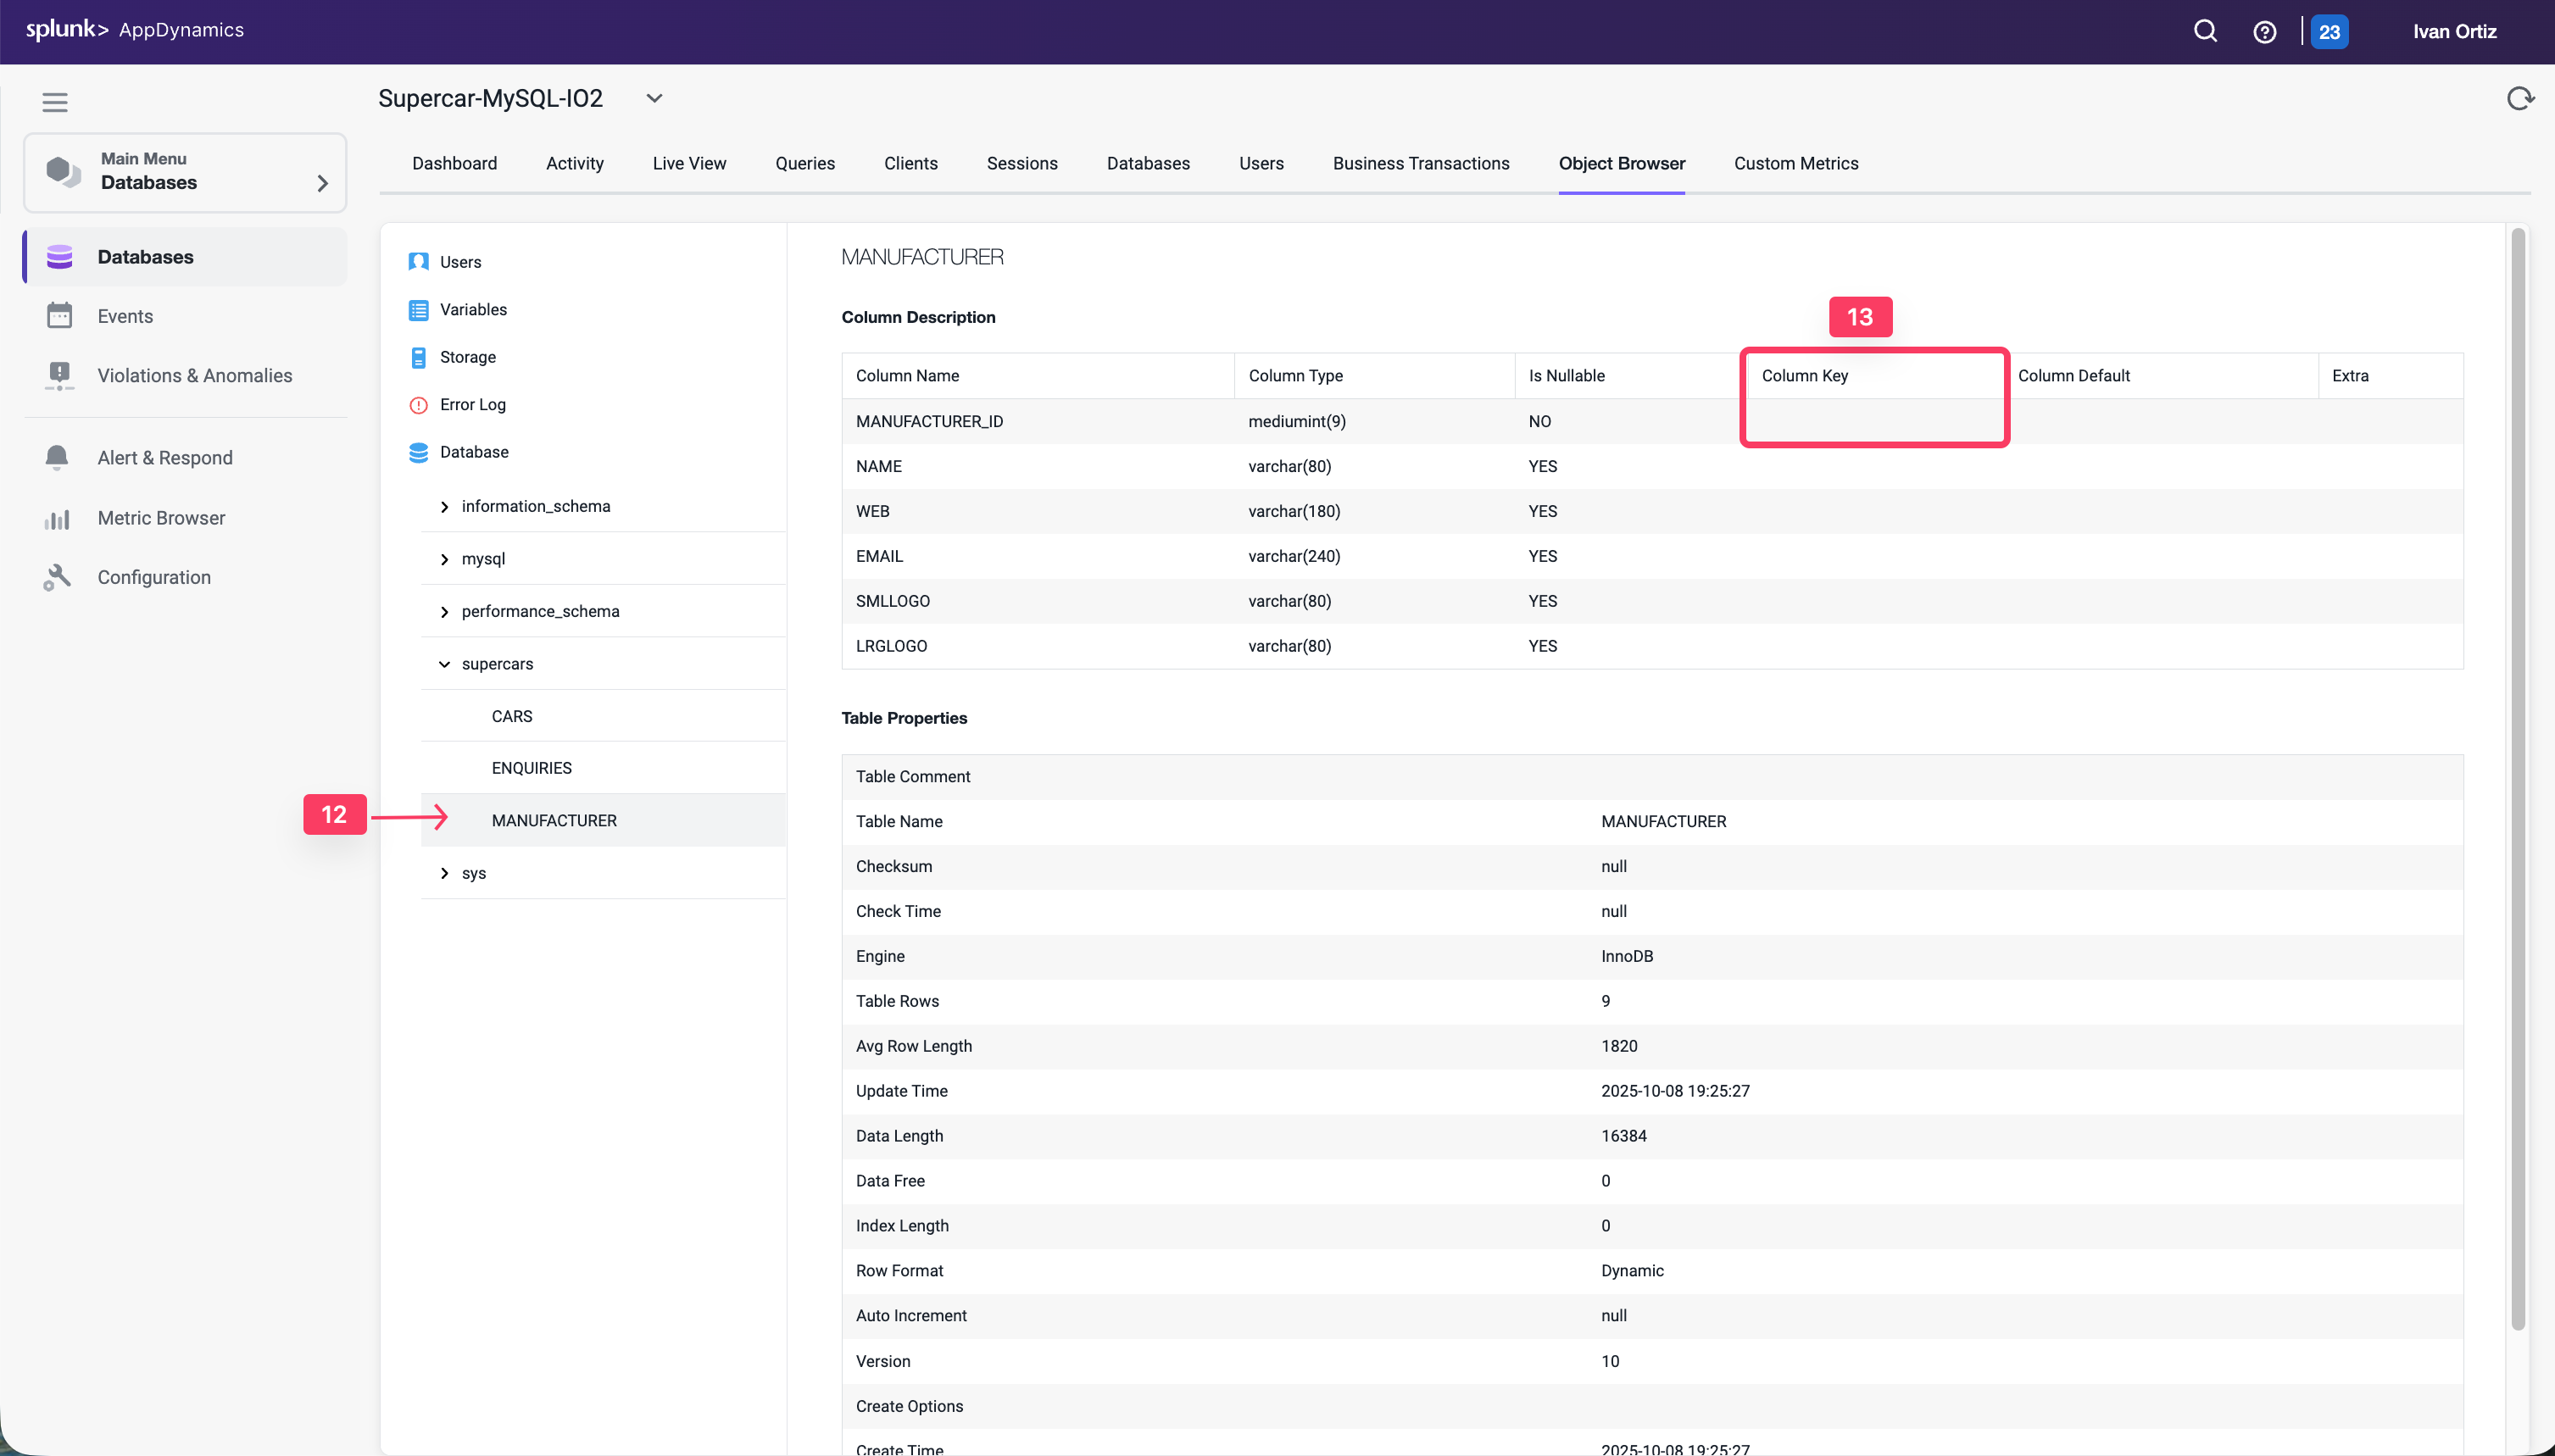
Click on the MANUFACTURER table to view its details.
Notice the MANUFACTURER_ID column is not defined as a primary key.
Scroll down the page to see there are no indexes defined for the table.
The MANUFACTURER_ID column needs an index created for it to improve the performance of any queries on the table. If you analyzed a different query the underlying issue may be different but the most common issues shown in this lab come because the queries are either executing a join with the MANUFACTURER table or querying that table directly.