Splunk AppDynamics is a full-stack performance monitoring solution for your critical business applications that offers the following features:
Consistent end-to-end application monitoring, regardless of environment, traditional, hybrid, or cloud-native.
Accelerated cloud migration and enterprise-grade, end-to-end insights for your applications regardless of where they are deployed.
Unified monitoring that enables you to quickly resolve performance issues before they become business problems, with three clicks to root cause.
You can optimize the total cost of ownership by leveraging existing personnel, processes, and training on AppDynamics platform for traditional, cloud, or hybrid deployments.
Workshop Overview
In this workshop, we’ll cover the fundamentals of Splunk AppDynamics. We’ll demonstrate how Splunk AppDynamics enables you to monitor the health of your application services, Web Applications, Databases and more. When you have completed this workshop, you will be able to :
Download and install the AppDynamics Java APM Agent.
Configure collection settings in the Controller.
Monitor and troubleshoot your application’s performance health.
Monitor alerts in AppDynamic’s monitoring service based off of data captured by AppDynamics.
Monitor server health and troubleshoot issues
Monitor the health of your browser based application with BRUM
Monitor and troubleshoot Database performance
Gain deeper visibility into your users with Splunk AppDynamics Business IQ
Additional Work to be Done
Add a section covering health rules, how to view existing ones, create new health rule
Application Security
Subsections of Splunk4Ninjas AppDynamics
Application Performance Monitoring (APM)
2 minutes
Objectives
In this Lab you learn how to use AppDynamics to monitor the health of your application services. You will need to complete this lab first before you start the other labs in this Workshop.
When you have completed this lab, you will be able to:
Download the AppDynamics Java APM Agent.
Install the AppDynamics Java APM Agent.
Initialize the sample application with load.
Understand the core concepts of AppDynamics APM
Configure collection settings in the Controller.
Monitor your application’s health.
Troubleshoot application performance issues to find root cause.
Monitor alerts in AppDynamic’s monitoring service based off of data captured by AppDynamics.
Workshop Environment
The workshop environment has two hosts:
The first host runs the AppDynamics Controller and will be referred to from this point on as the Controller.
The second host runs the Supercar Trader application used in the labs. It will be the host where you will install the AppDynamics agents and will be referred to from this point on as the Application VM.
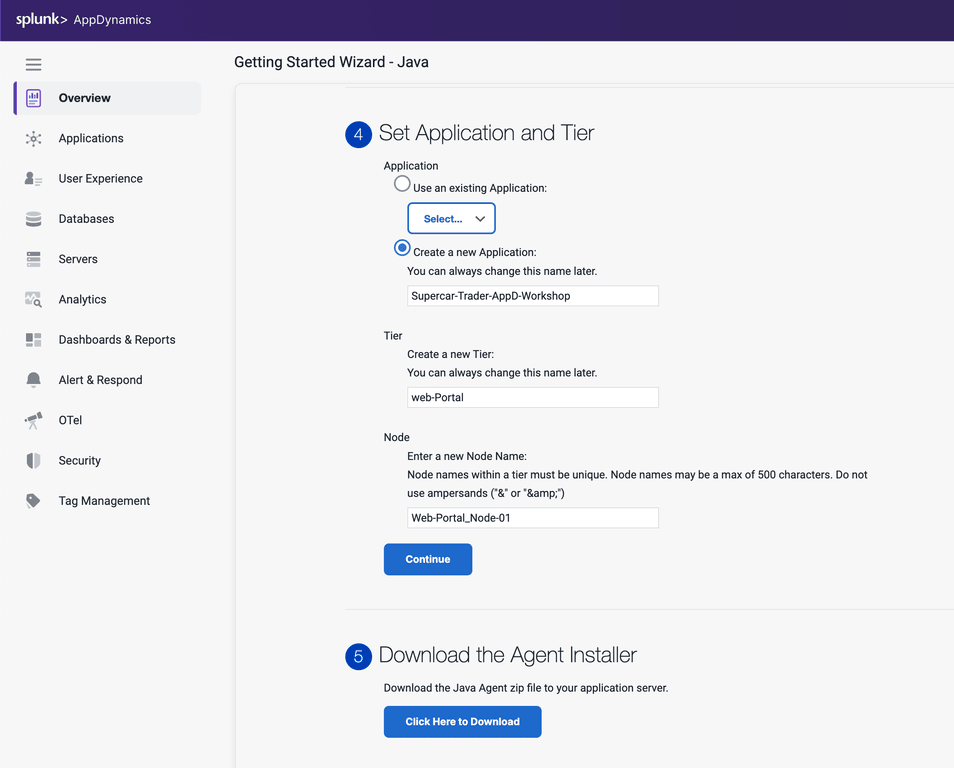
Under Set Application and Tier, select Create a new Application:
Enter Supercar-Trader-YOURINITIALS as the application name.
Enter Web Portal for the new Tier
Enter Web-Portal_Node-01 for the Node Name
Click Continue
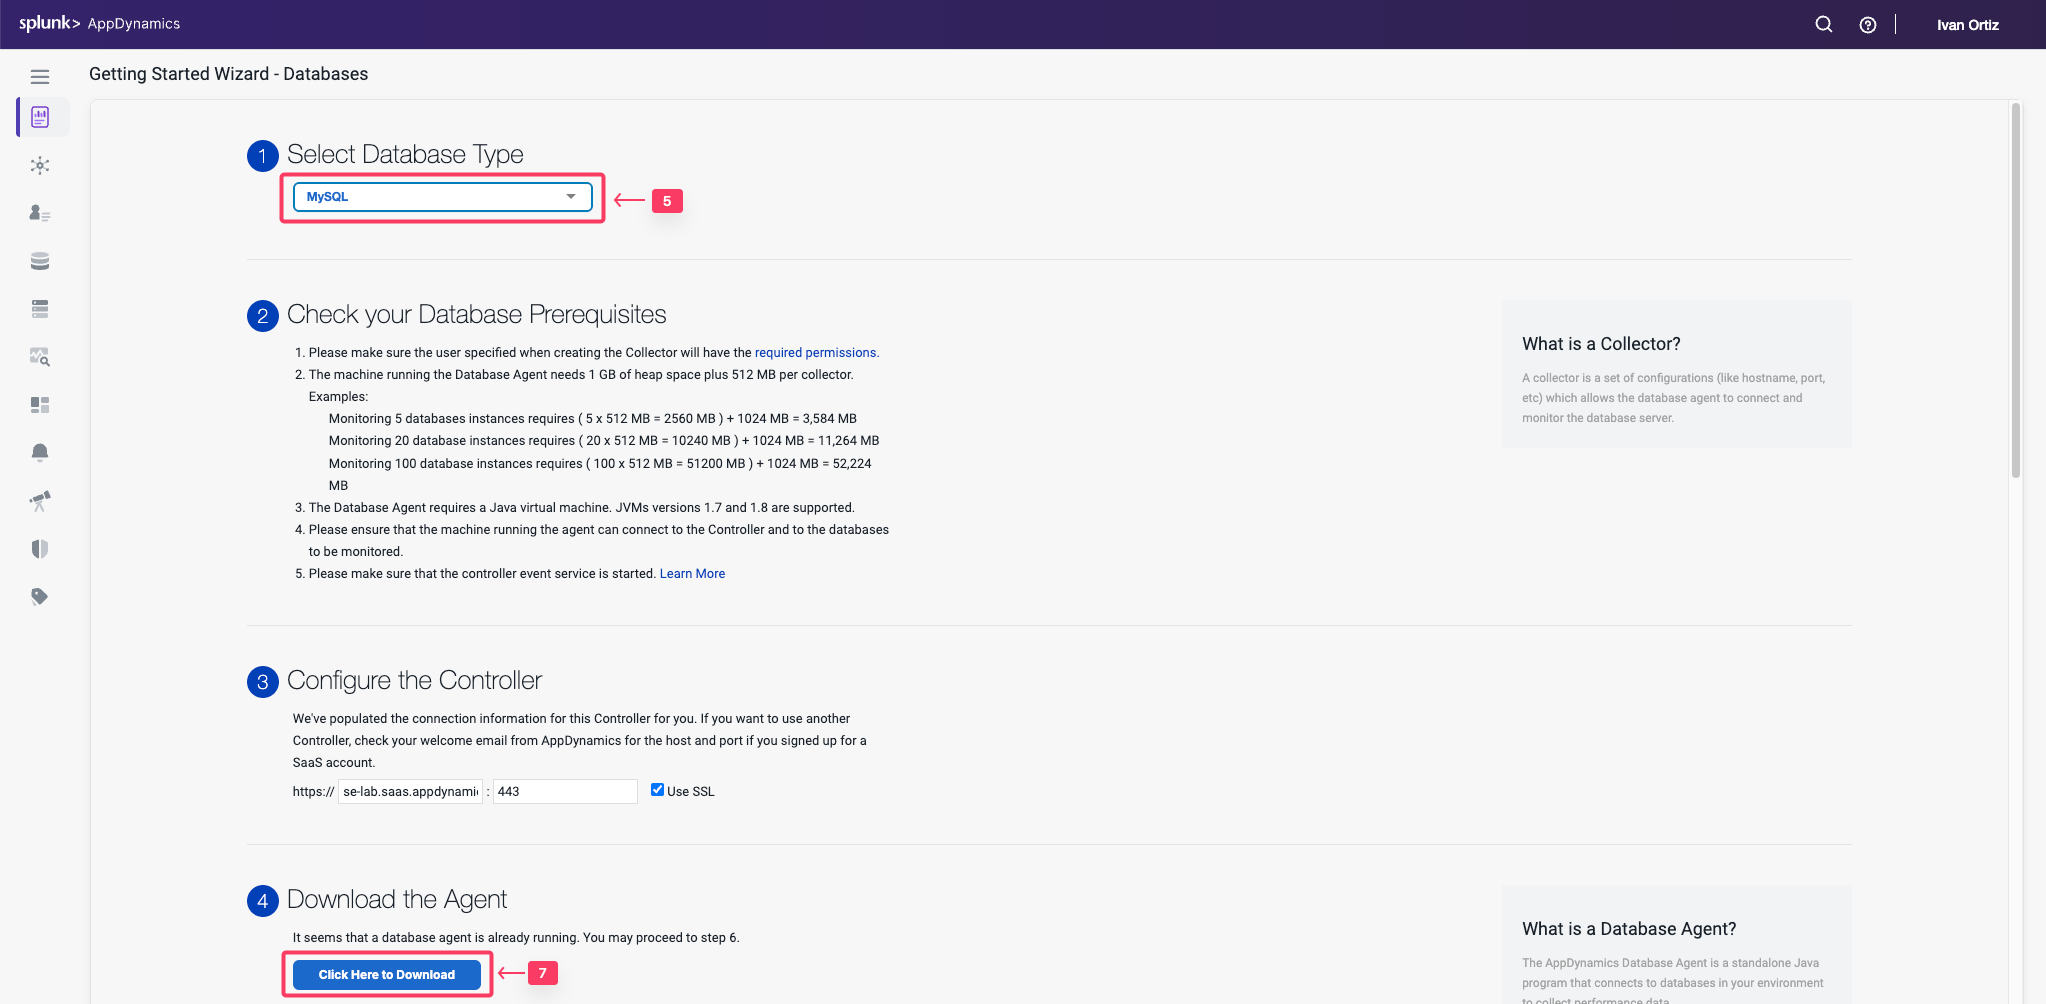
Click Click Here to Download.
Warning
The application name must be unique, make sure to append your initials or add a unique identifier to the application name
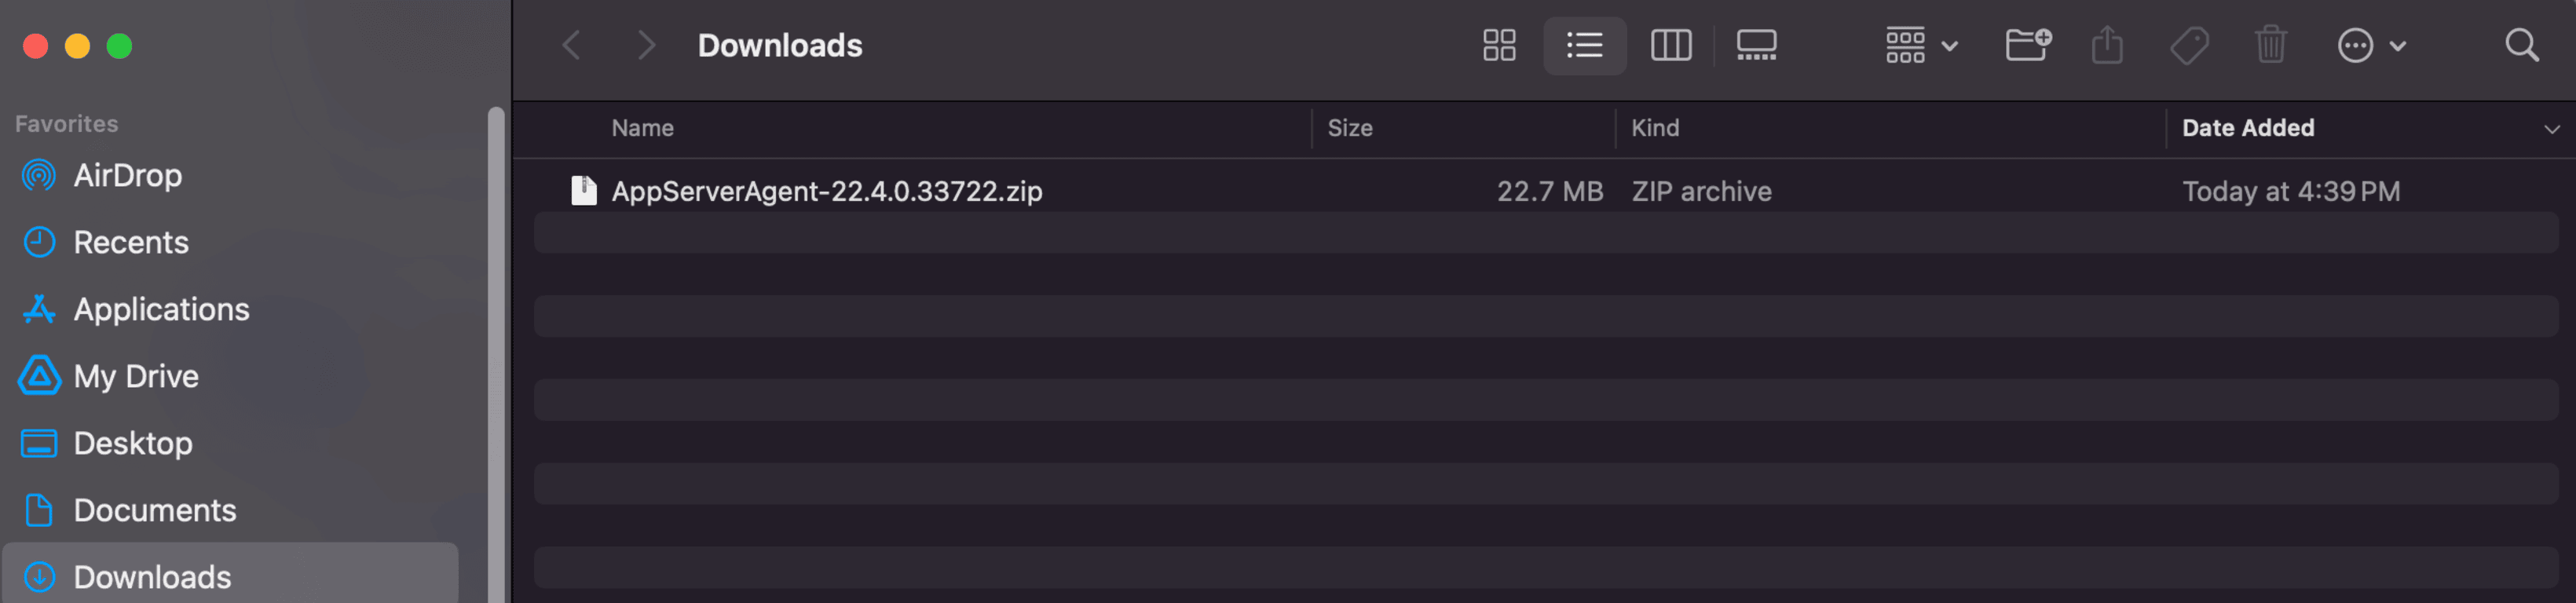
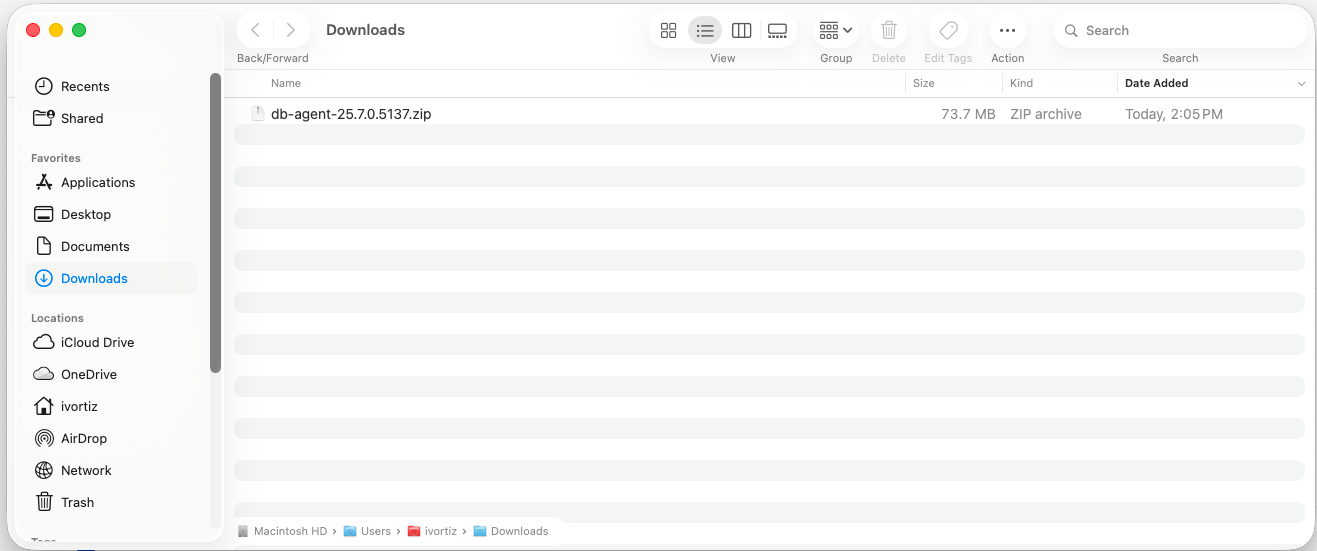
Your browser should prompt you that the agent is being downloaded to your local file system. Make sure to take note of where the file was downloaded to and the full name of it.
2. Install the Java Agent
In this exercise you will perform the following actions:
Upload the Java agent file to your EC2 instance
Unzip the file into a specific directory
Update the Java agents XML configuration file (optional)
Modify the Apache Tomcat startup script to add the Java agent
Upload Java Agent to Application VM
By this point you should have received the information regarding the EC2 instance that you will be using for this workshop. Ensure you have the IP address of your EC2 instance, username and password required to ssh into the instance .
On your local machine, open a terminal window and change into the directory where the java agent file was downloaded to. Upload the file into the EC2 instance using the following command. This may take some time to complete.
Update the IP address or public DNS for your instance.
Update the filename to match your exact version.
cd ~/Downloads
scp -P 2222 AppServerAgent-22.4.0.33722.zip splunk@i-0b6e3c9790292be66.splunk.show:/home/splunk
cd /opt/appdynamics
mkdir javaagent
cp /home/splunk/AppServerAgent-*.zip /opt/appdynamics/javaagent
cd /opt/appdynamics/javaagent
unzip AppServerAgent-*.zip
Tip
We pre-configured the Java agent using the Controller’s Getting Started Wizard. If you download the agent from the AppDynamics Portal, you will need to manually update the Java agent’s XML configuration file.
There are three primary ways to set the configuration properties of the Java agent. These take precedence in the following order:
System environment variables.
JVM properties passed on the command line.
Properties within the controller-info.xml file.
Add the Java Agent to the Tomcat Server
First we want to make sure that the Tomcat server is not running
cd /usr/local/apache/apache-tomcat-9/bin
./shutdown.sh
We will now modify the catalina script to set an environment variable with the java agent.
cd /usr/local/apache/apache-tomcat-9/bin
nano catalina.sh
Add the following line at 125 (after the initial comments) & save the file
In this exercise you will perform the following actions:
Verify the sample app is running.
Start the load generation for the sample application.
Confirm the transaction load in the Controller.
Verify that the Sample Application is Running
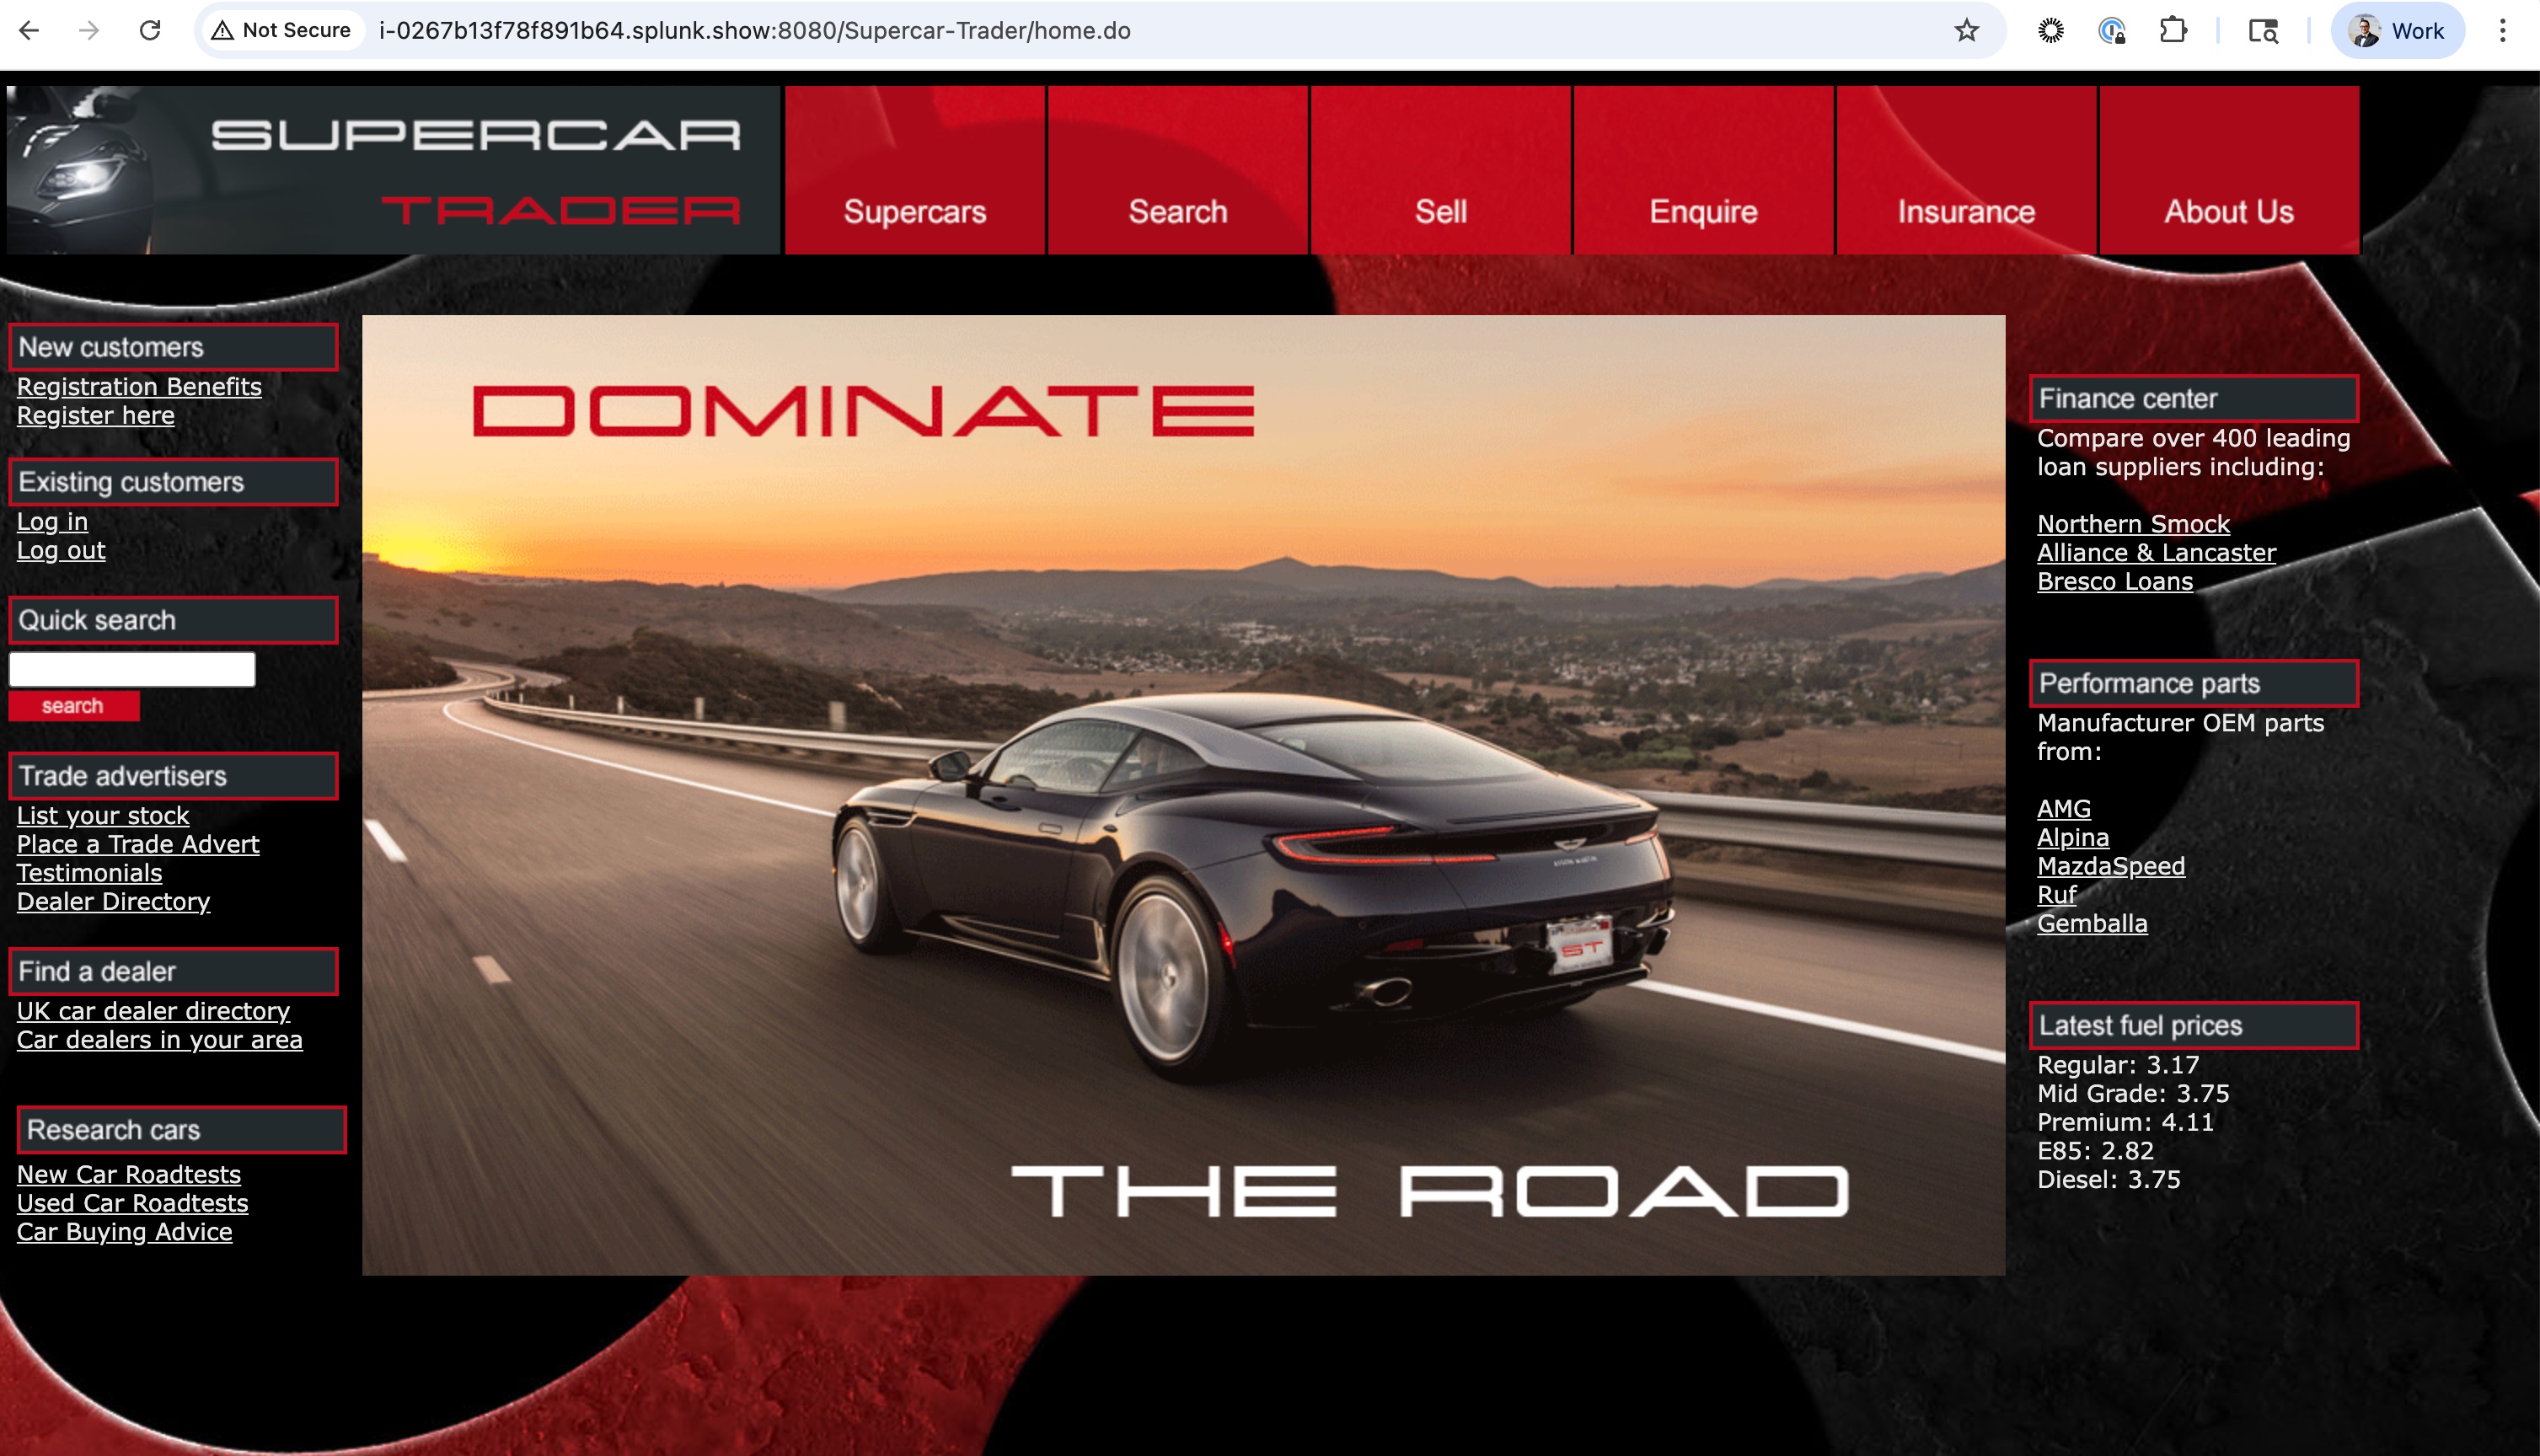
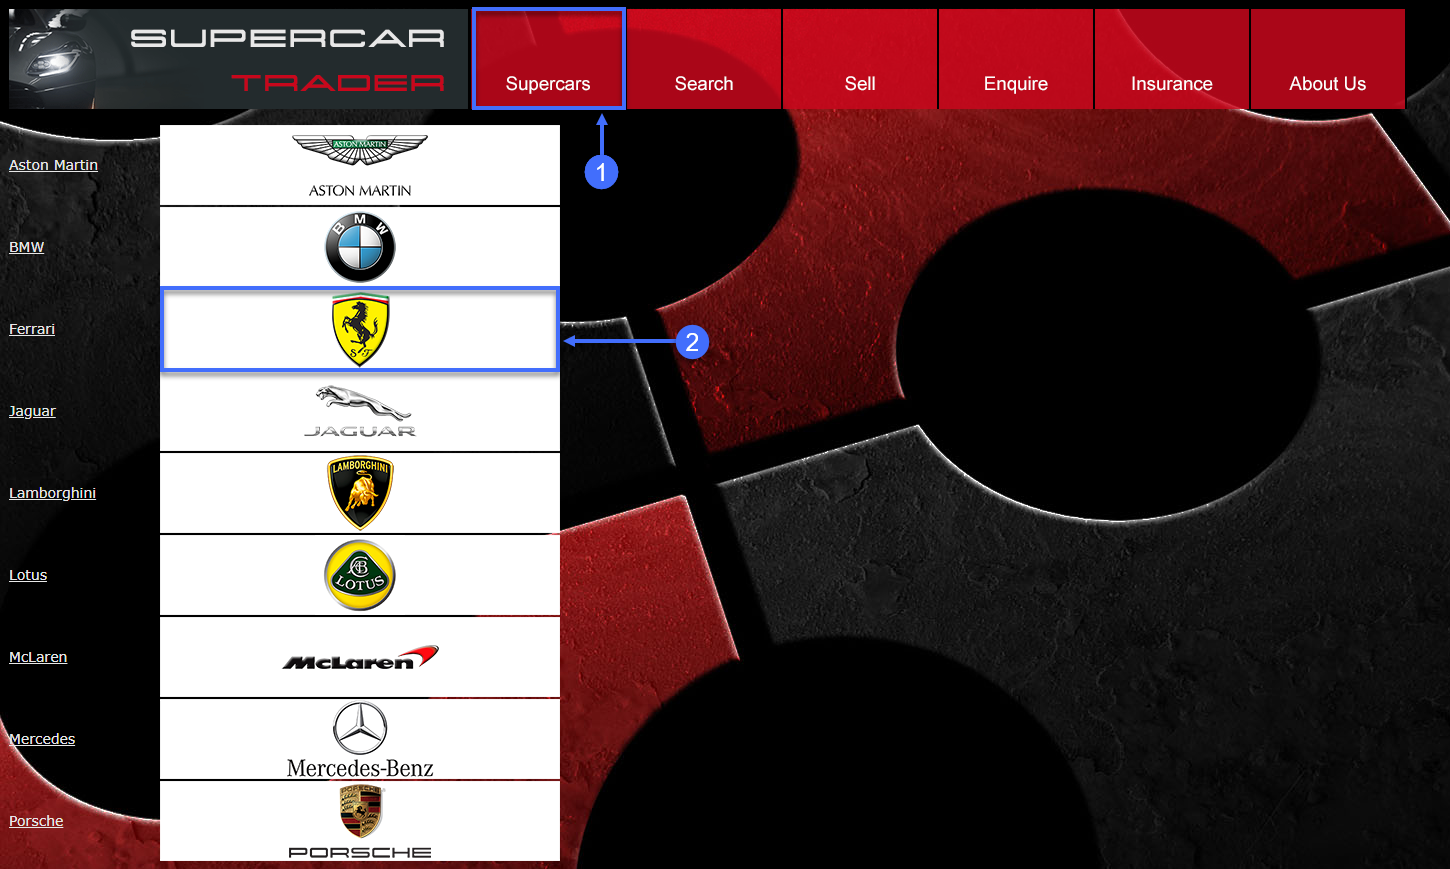
The sample application home page is accessible through your web browser with a URL in the format seen below. Enter that URL in your browser’s navigation bar, substituting the IP Address of your EC2 instance.
You should be able to see the home page of the Supercar Trader application.
Start the Load Generation
SSH into your ec2 instance and start the load generation. It may take a few minutes for all the scripts to run.
cd /opt/appdynamics/lab-artifacts/phantomjs
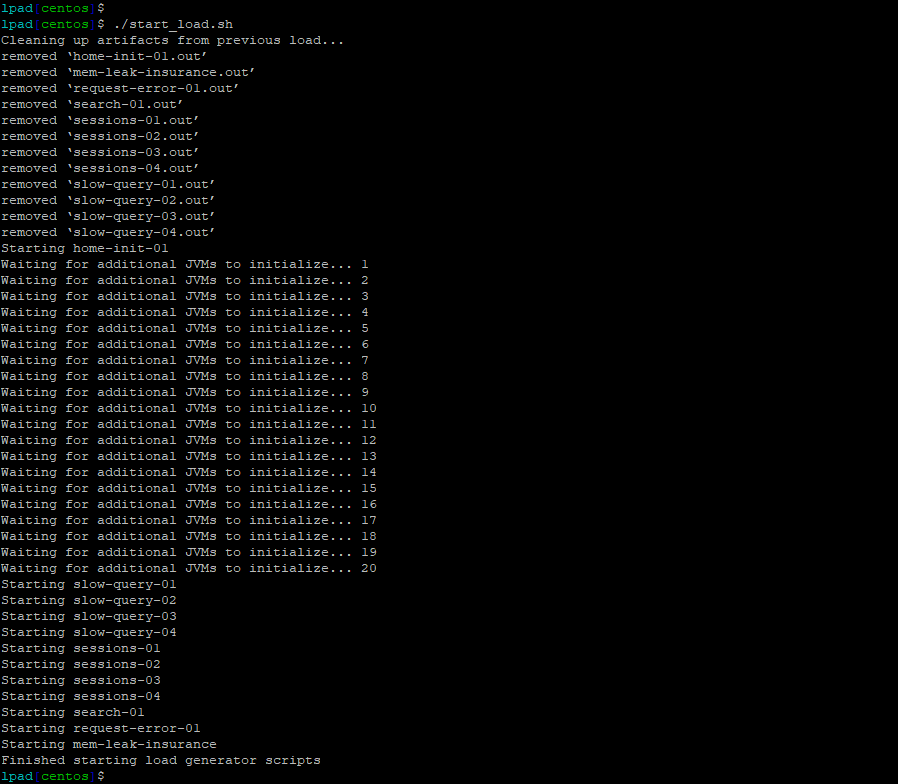
./start_load.sh
Cleaning up artifacts from previous load...
Starting home-init-01
Waiting for additional JVMs to initialize... 1Waiting for additional JVMs to initialize... 2Waiting for additional JVMs to initialize... 3Waiting for additional JVMs to initialize... 4Waiting for additional JVMs to initialize... 5Waiting for additional JVMs to initialize... 6Waiting for additional JVMs to initialize... 7Waiting for additional JVMs to initialize... 8Waiting for additional JVMs to initialize... 9Waiting for additional JVMs to initialize... 10Waiting for additional JVMs to initialize... 11Waiting for additional JVMs to initialize... 12Waiting for additional JVMs to initialize... 13Waiting for additional JVMs to initialize... 14Waiting for additional JVMs to initialize... 15Waiting for additional JVMs to initialize... 16Waiting for additional JVMs to initialize... 17Waiting for additional JVMs to initialize... 18Waiting for additional JVMs to initialize... 19Waiting for additional JVMs to initialize... 20Starting slow-query-01
Starting slow-query-02
Starting slow-query-03
Starting slow-query-04
Starting sessions-01
Starting sessions-02
Starting sell-car-01
Starting sell-car-02
Starting sessions-03
Starting sessions-04
Starting search-01
Starting request-error-01
Starting mem-leak-insurance
Finished starting load generator scripts 100% 22MB 255.5KB/s 01:26
Confirm transaction load in the Controller
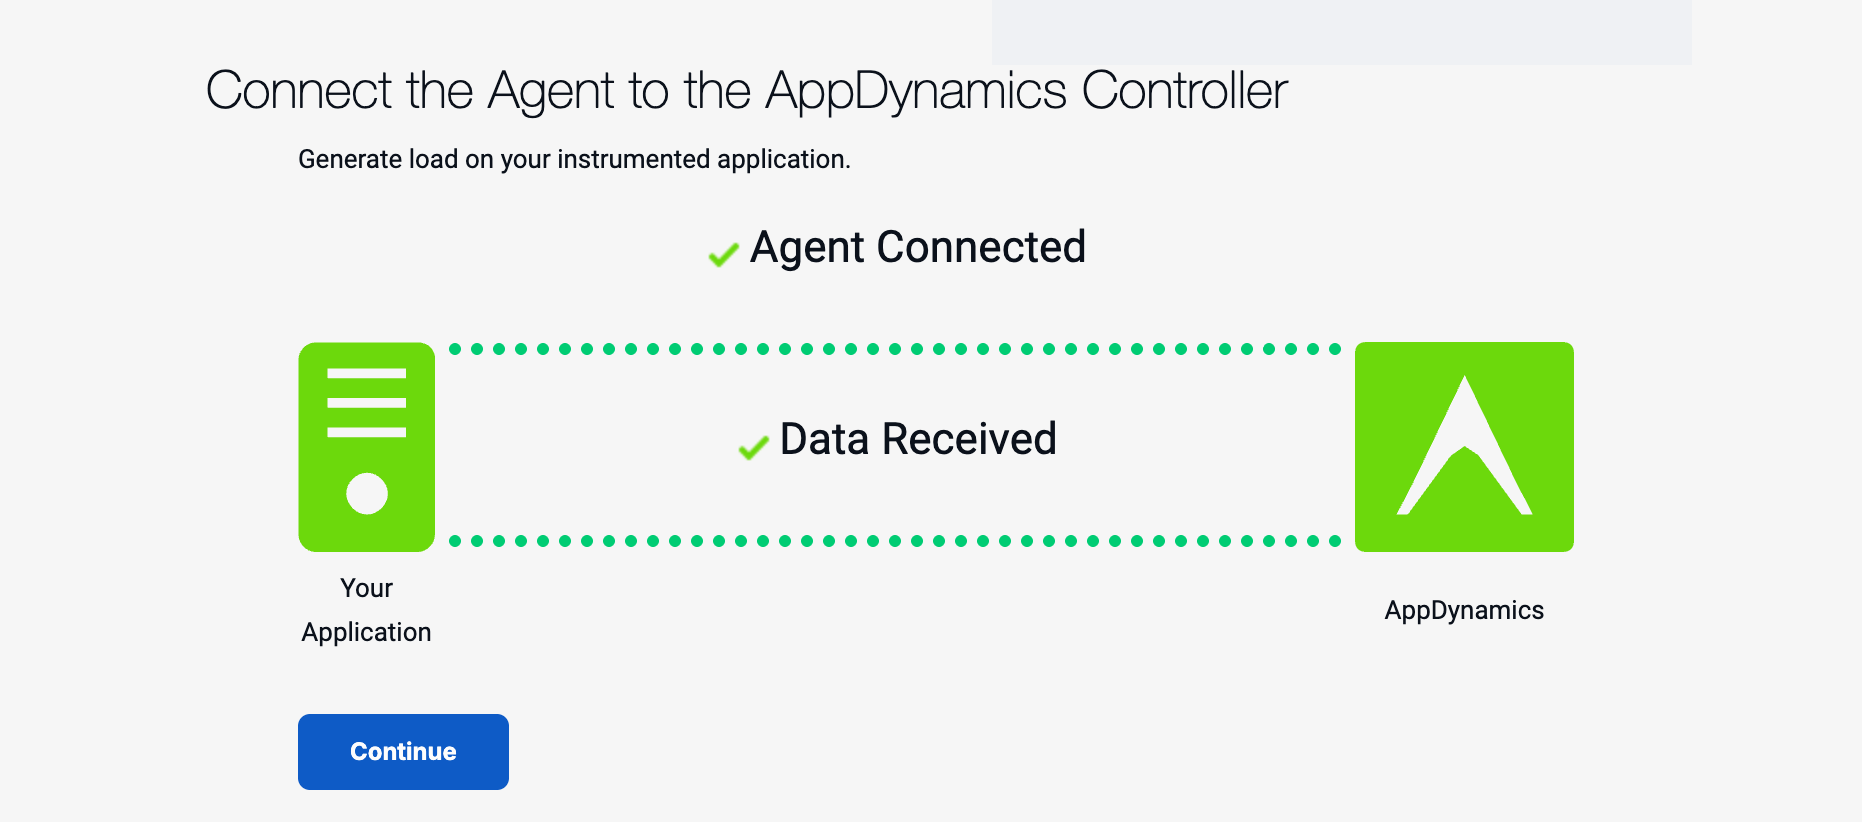
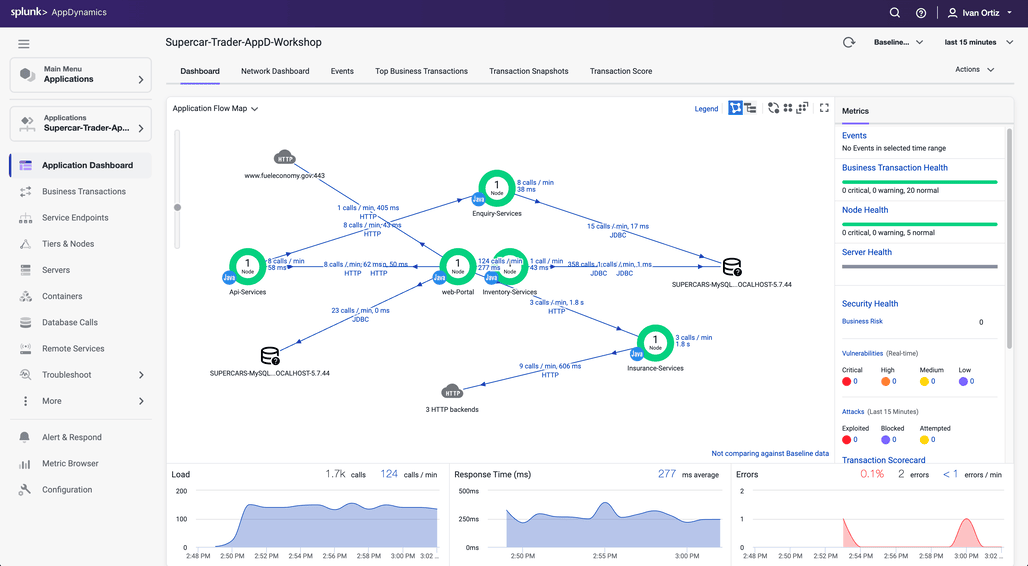
If you still have the Getting Started Wizard open in your web browser, you should see that the agent is now connected and that the Controller is receiving data.
Click Continue and you will be taken to the Application Flow Map (you can jump to the Flow Map image below).
If you previously closed the Controller browser window, log back into the Controller.
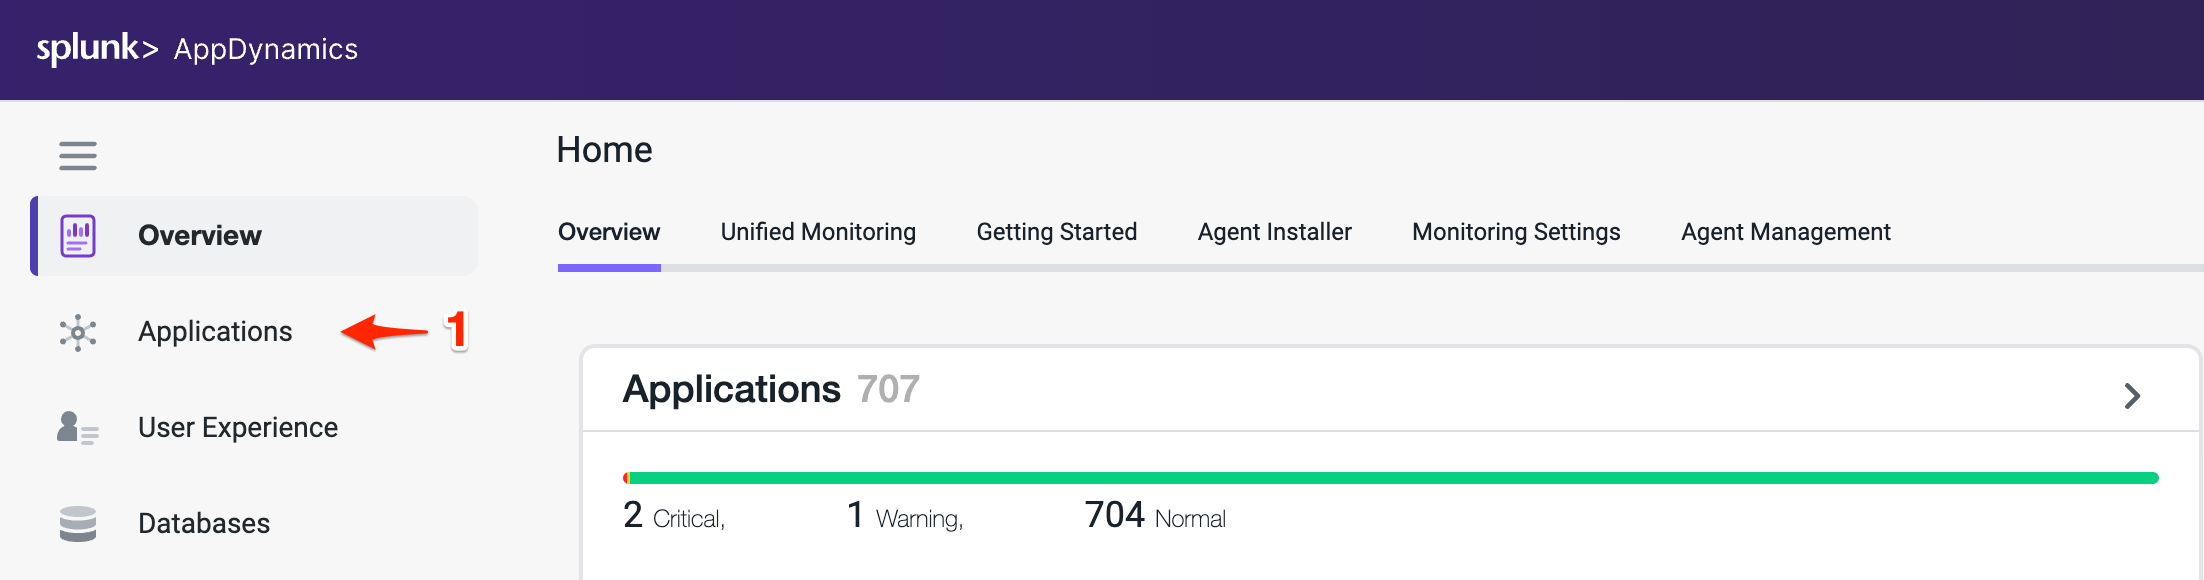
From the Overview page (Landing Page). Click on the Applications tab on the left navigation panel.
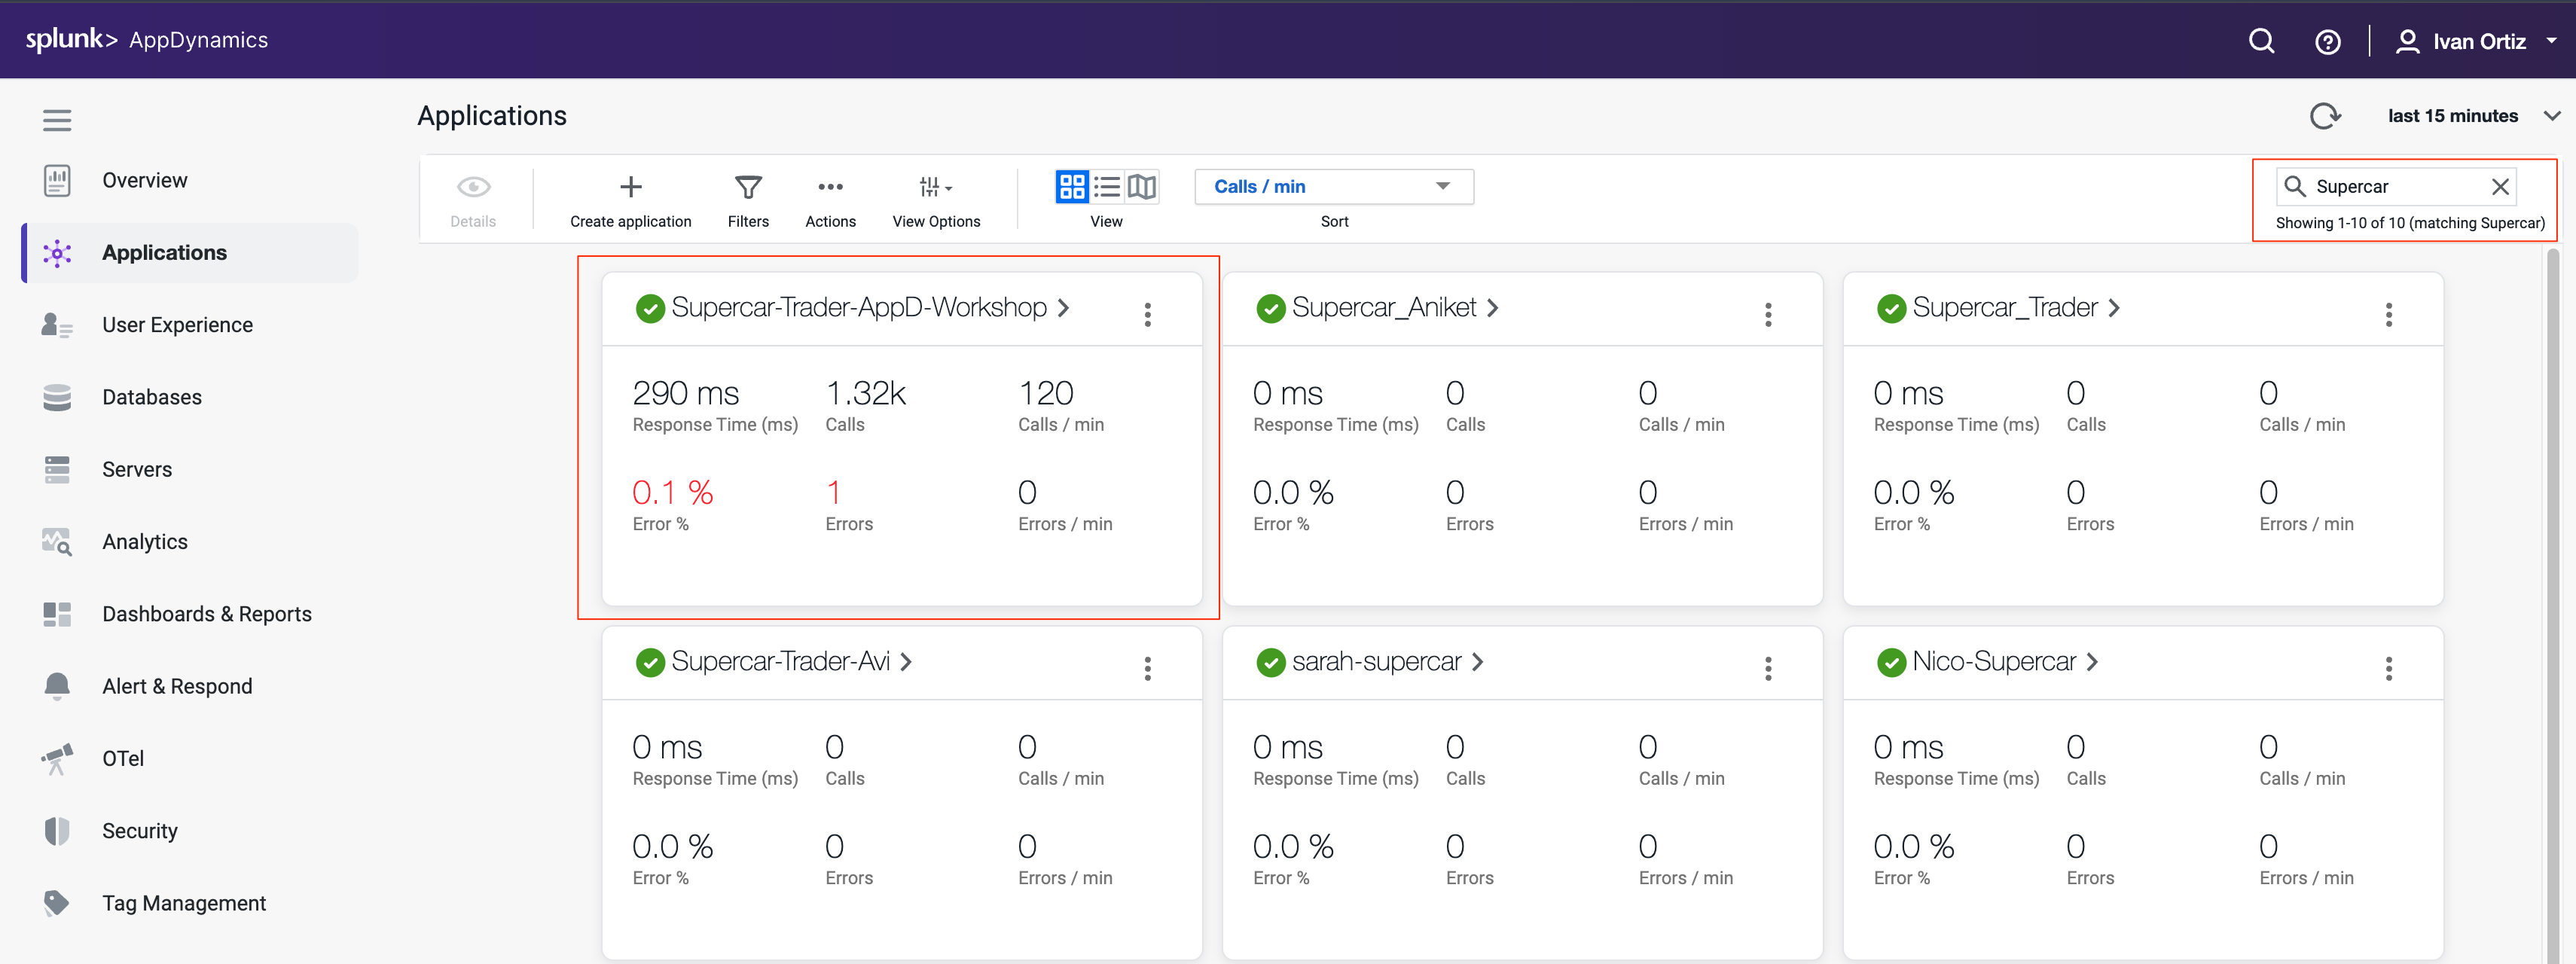
Within the Applications page you can manually search for your application or you can use the search bar in the top right corner to narrow down your search.
Click in your application’s name, this should bring you into the Application Flow Map, you should see all the application components appear after twelve minutes.
If you don’t see all the application components after twelve minutes, try waiting a few more minutes and refresh your browser tab.
During the agent download step we assigned the Tier name and Node name for the Tomcat server.
You might be wondering how the other four services had their Tier and Node name assigned. The sample application dynamically creates four additional JVMs from the initial Tomcat JVM and assigns the Tier and Node names by passing those properties into the JVM startup command as -D properties for each of the four services. Any -D properties included on the JVM startup command line will supersede the properties defined in the Java agents controller-info.xml file.
To see the JVM startup parameters used for each of the four services that were dynamically started, issue the following command in your terminal window of your ec2 instance.
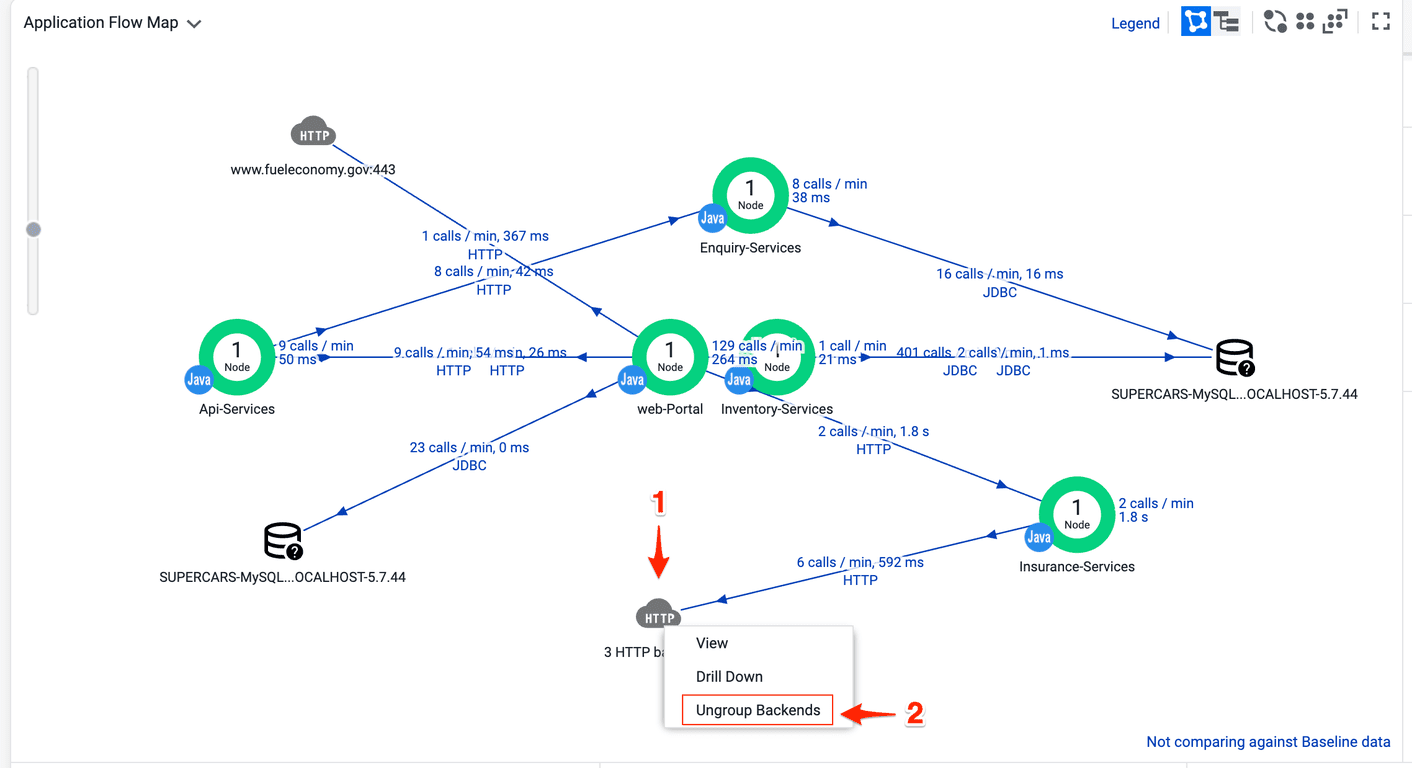
Once all of the components appear on the flow map, you should see an HTTP cloud icon that represents the three HTTP backends called by the Insurance-Services Tier.
Ungroup the the three HTTP backends by following these steps.
Right click the HTTP cloud icon labeled 3 HTTP backends
From the drop down menu, select Ungroup Backends
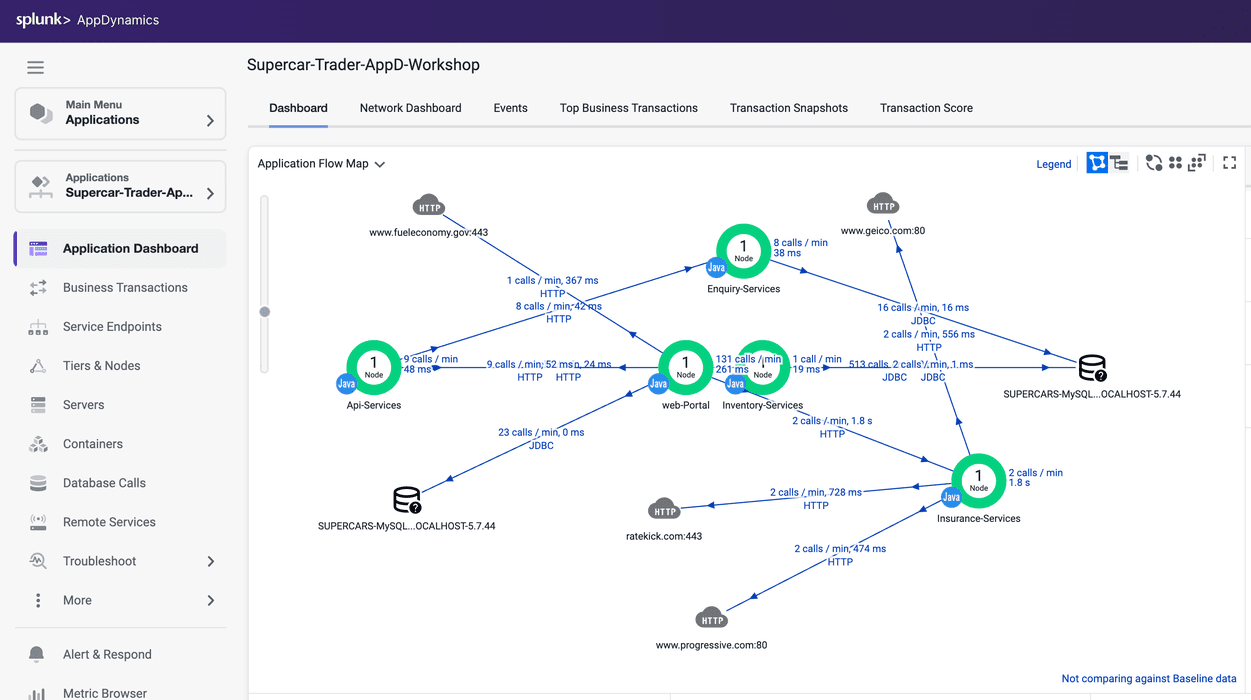
Once the HTTP backends have been ungrouped, you should see all three HTTP backends as shown in the following image.
4. AppDynamics Core Concepts
In this section you will learn about the core concepts of Splunk Appdynamics APM features. By the end of the section you will understand the following concepts:
Application Flow Maps
Business Transactions (BTs)
Snapshots
Call Graphs
Flow Maps
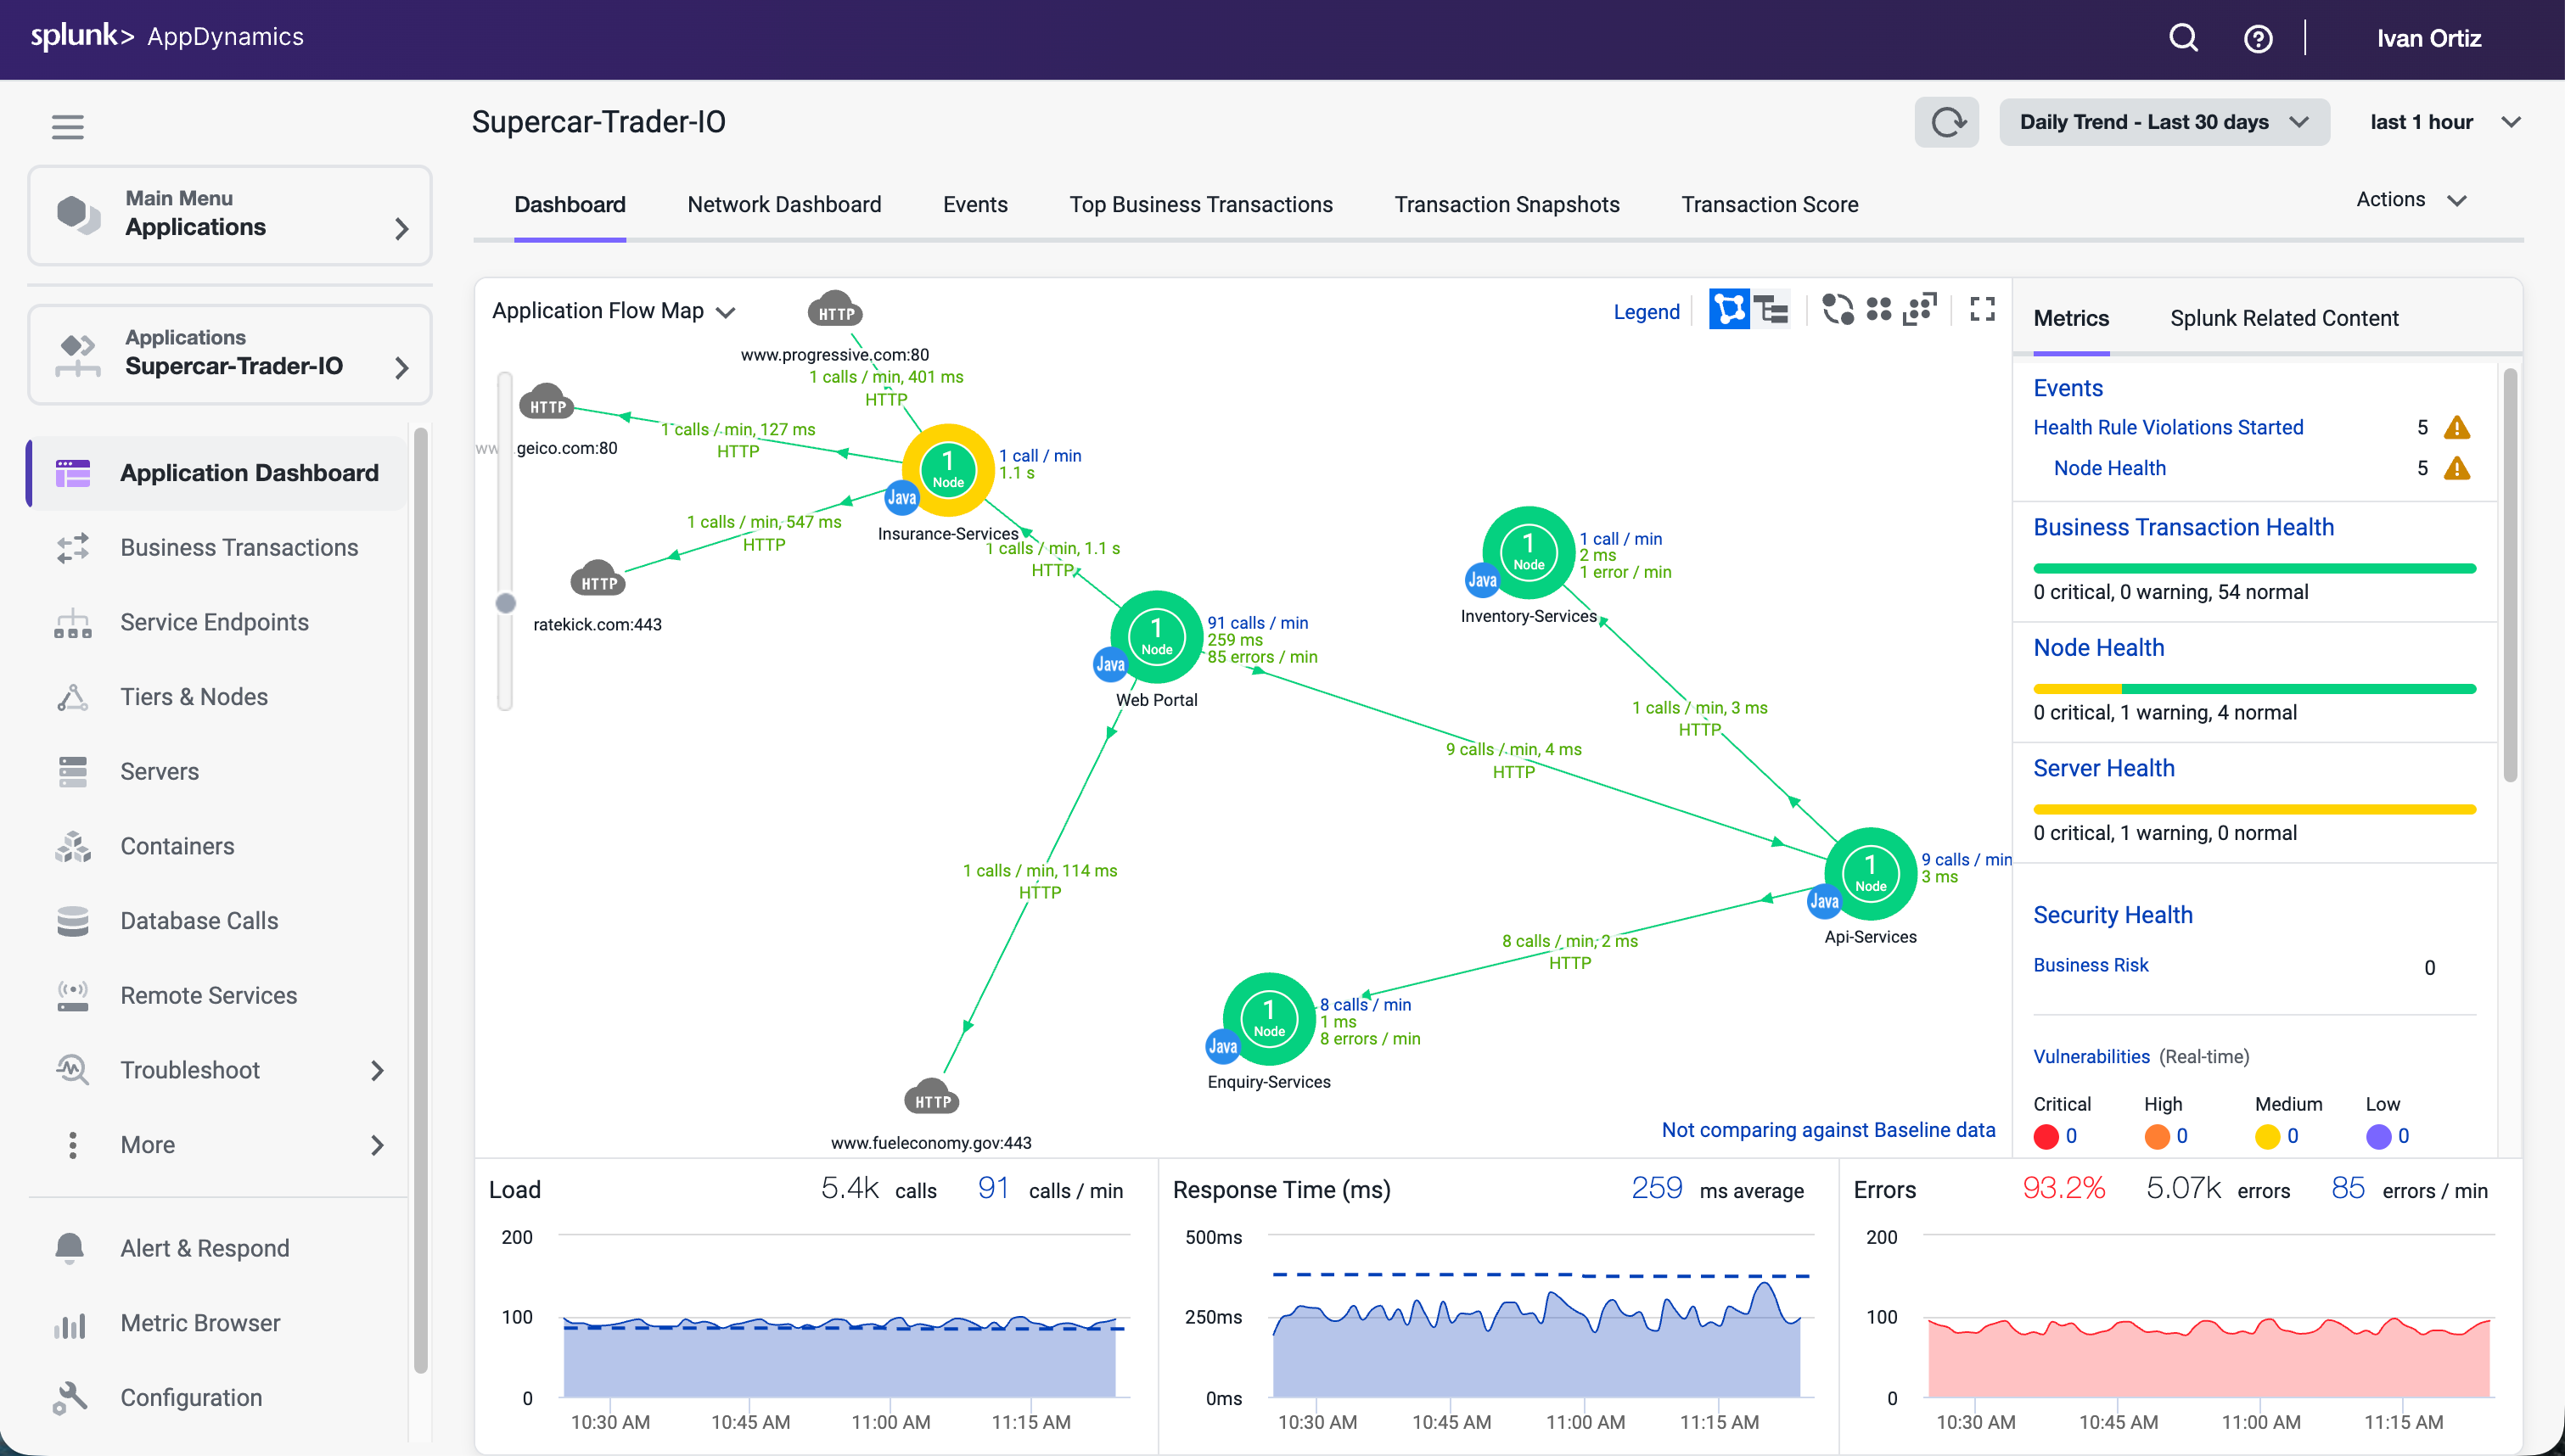
AppDynamics app agents automatically discover the most common application frameworks and services. Using built-in application detection and configuration settings, agents collect application data and metrics to build Flow Maps.
AppDynamics automatically captures and scores every transaction. Flow Maps present a dynamic visual representation of the components and activities of your monitored application environment in direct context of the time frame that you have selected.
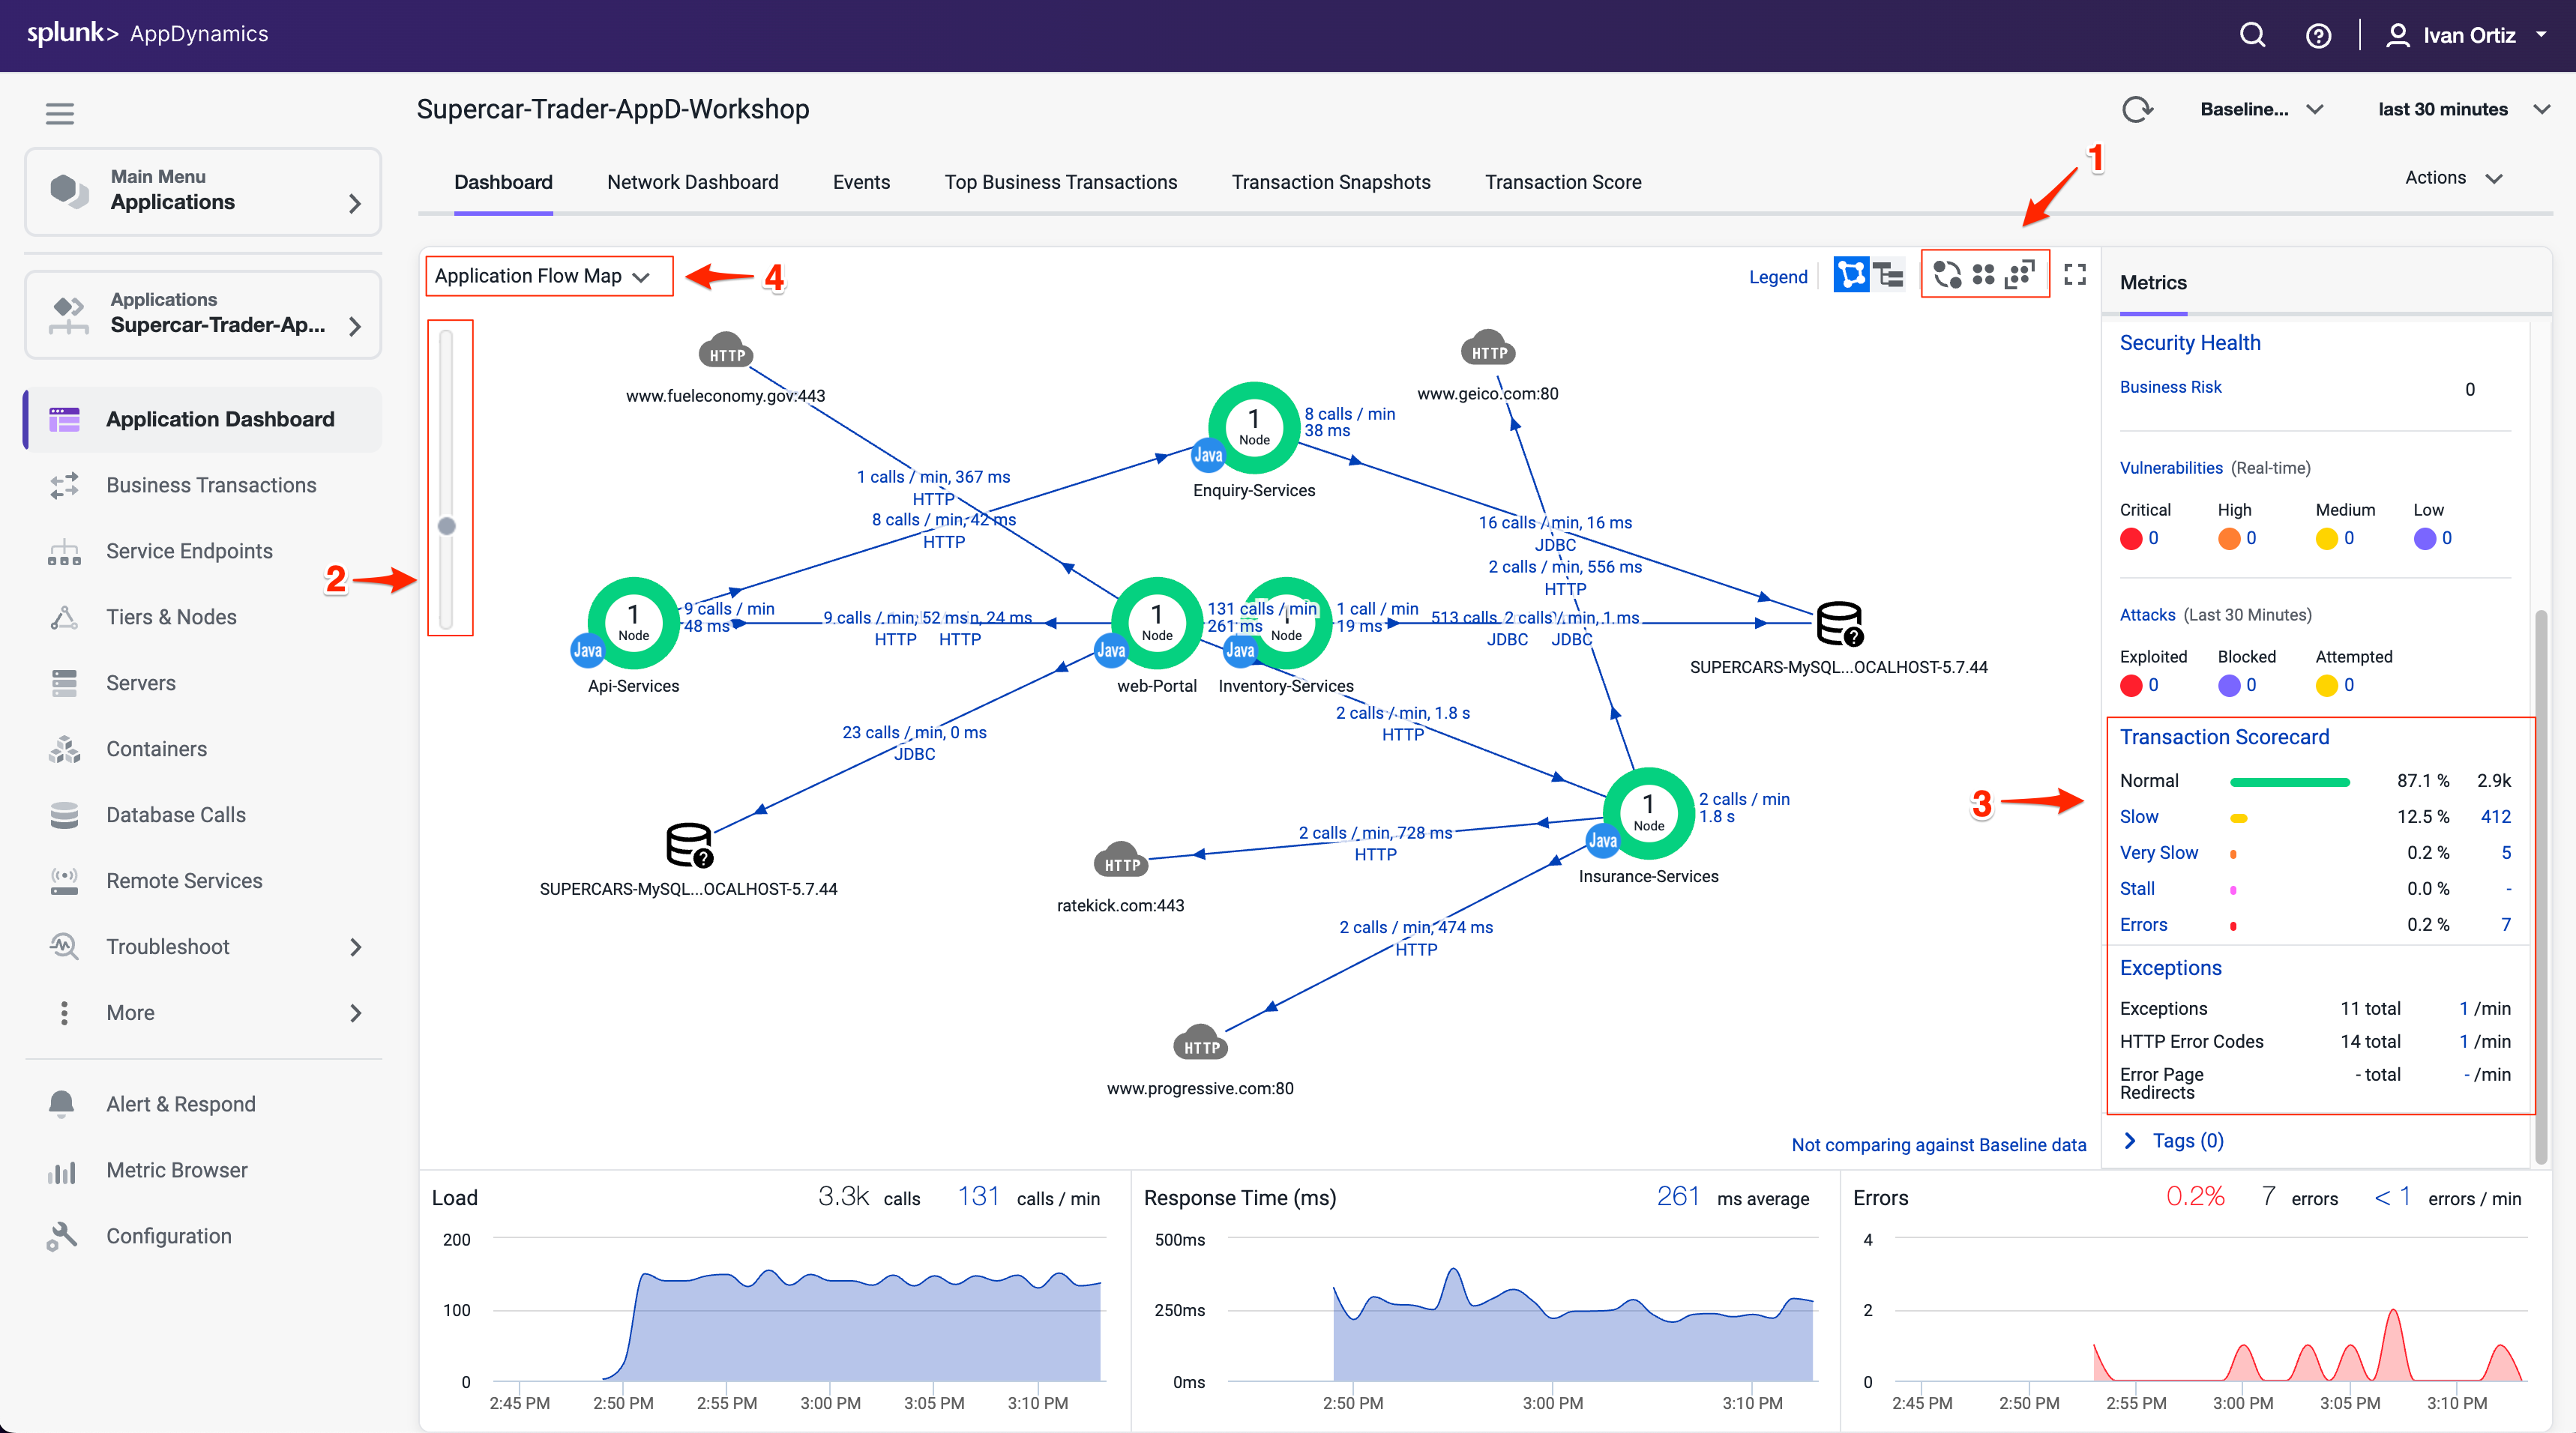
Familiarize yourself with the some of the different features of the Flow Map.
Try using the different layout options (you can also click and drag each icon on the Flow Map to reposition it).
Try using the slider and mouse scrollwheel to adjust the zoom level.
In the AppDynamics model, a Business Transaction represents the data processing flow for a request, most often a user request. In real-world terms, many different components in your application may interact to provide services to fulfill the following types of requests:
In an e-commerce application, a user logging in, searching for items or adding items to the cart.
In a content portal, a user requests content such as sports, business or entertainment news.
In a stock trading application, operations such as receiving a stock quote, buying or selling stocks. Because AppDynamics orients performance monitoring around Business Transactions, you can focus on the performance of your application components from the user perspective. You can quickly identify whether a component is readily available or if it is having performance issues. For instance, you can check whether users are able to log in, check out or view their data. You can see response times for users, and the causes of problems when they occur.
You can read more about Business Transactions here and here
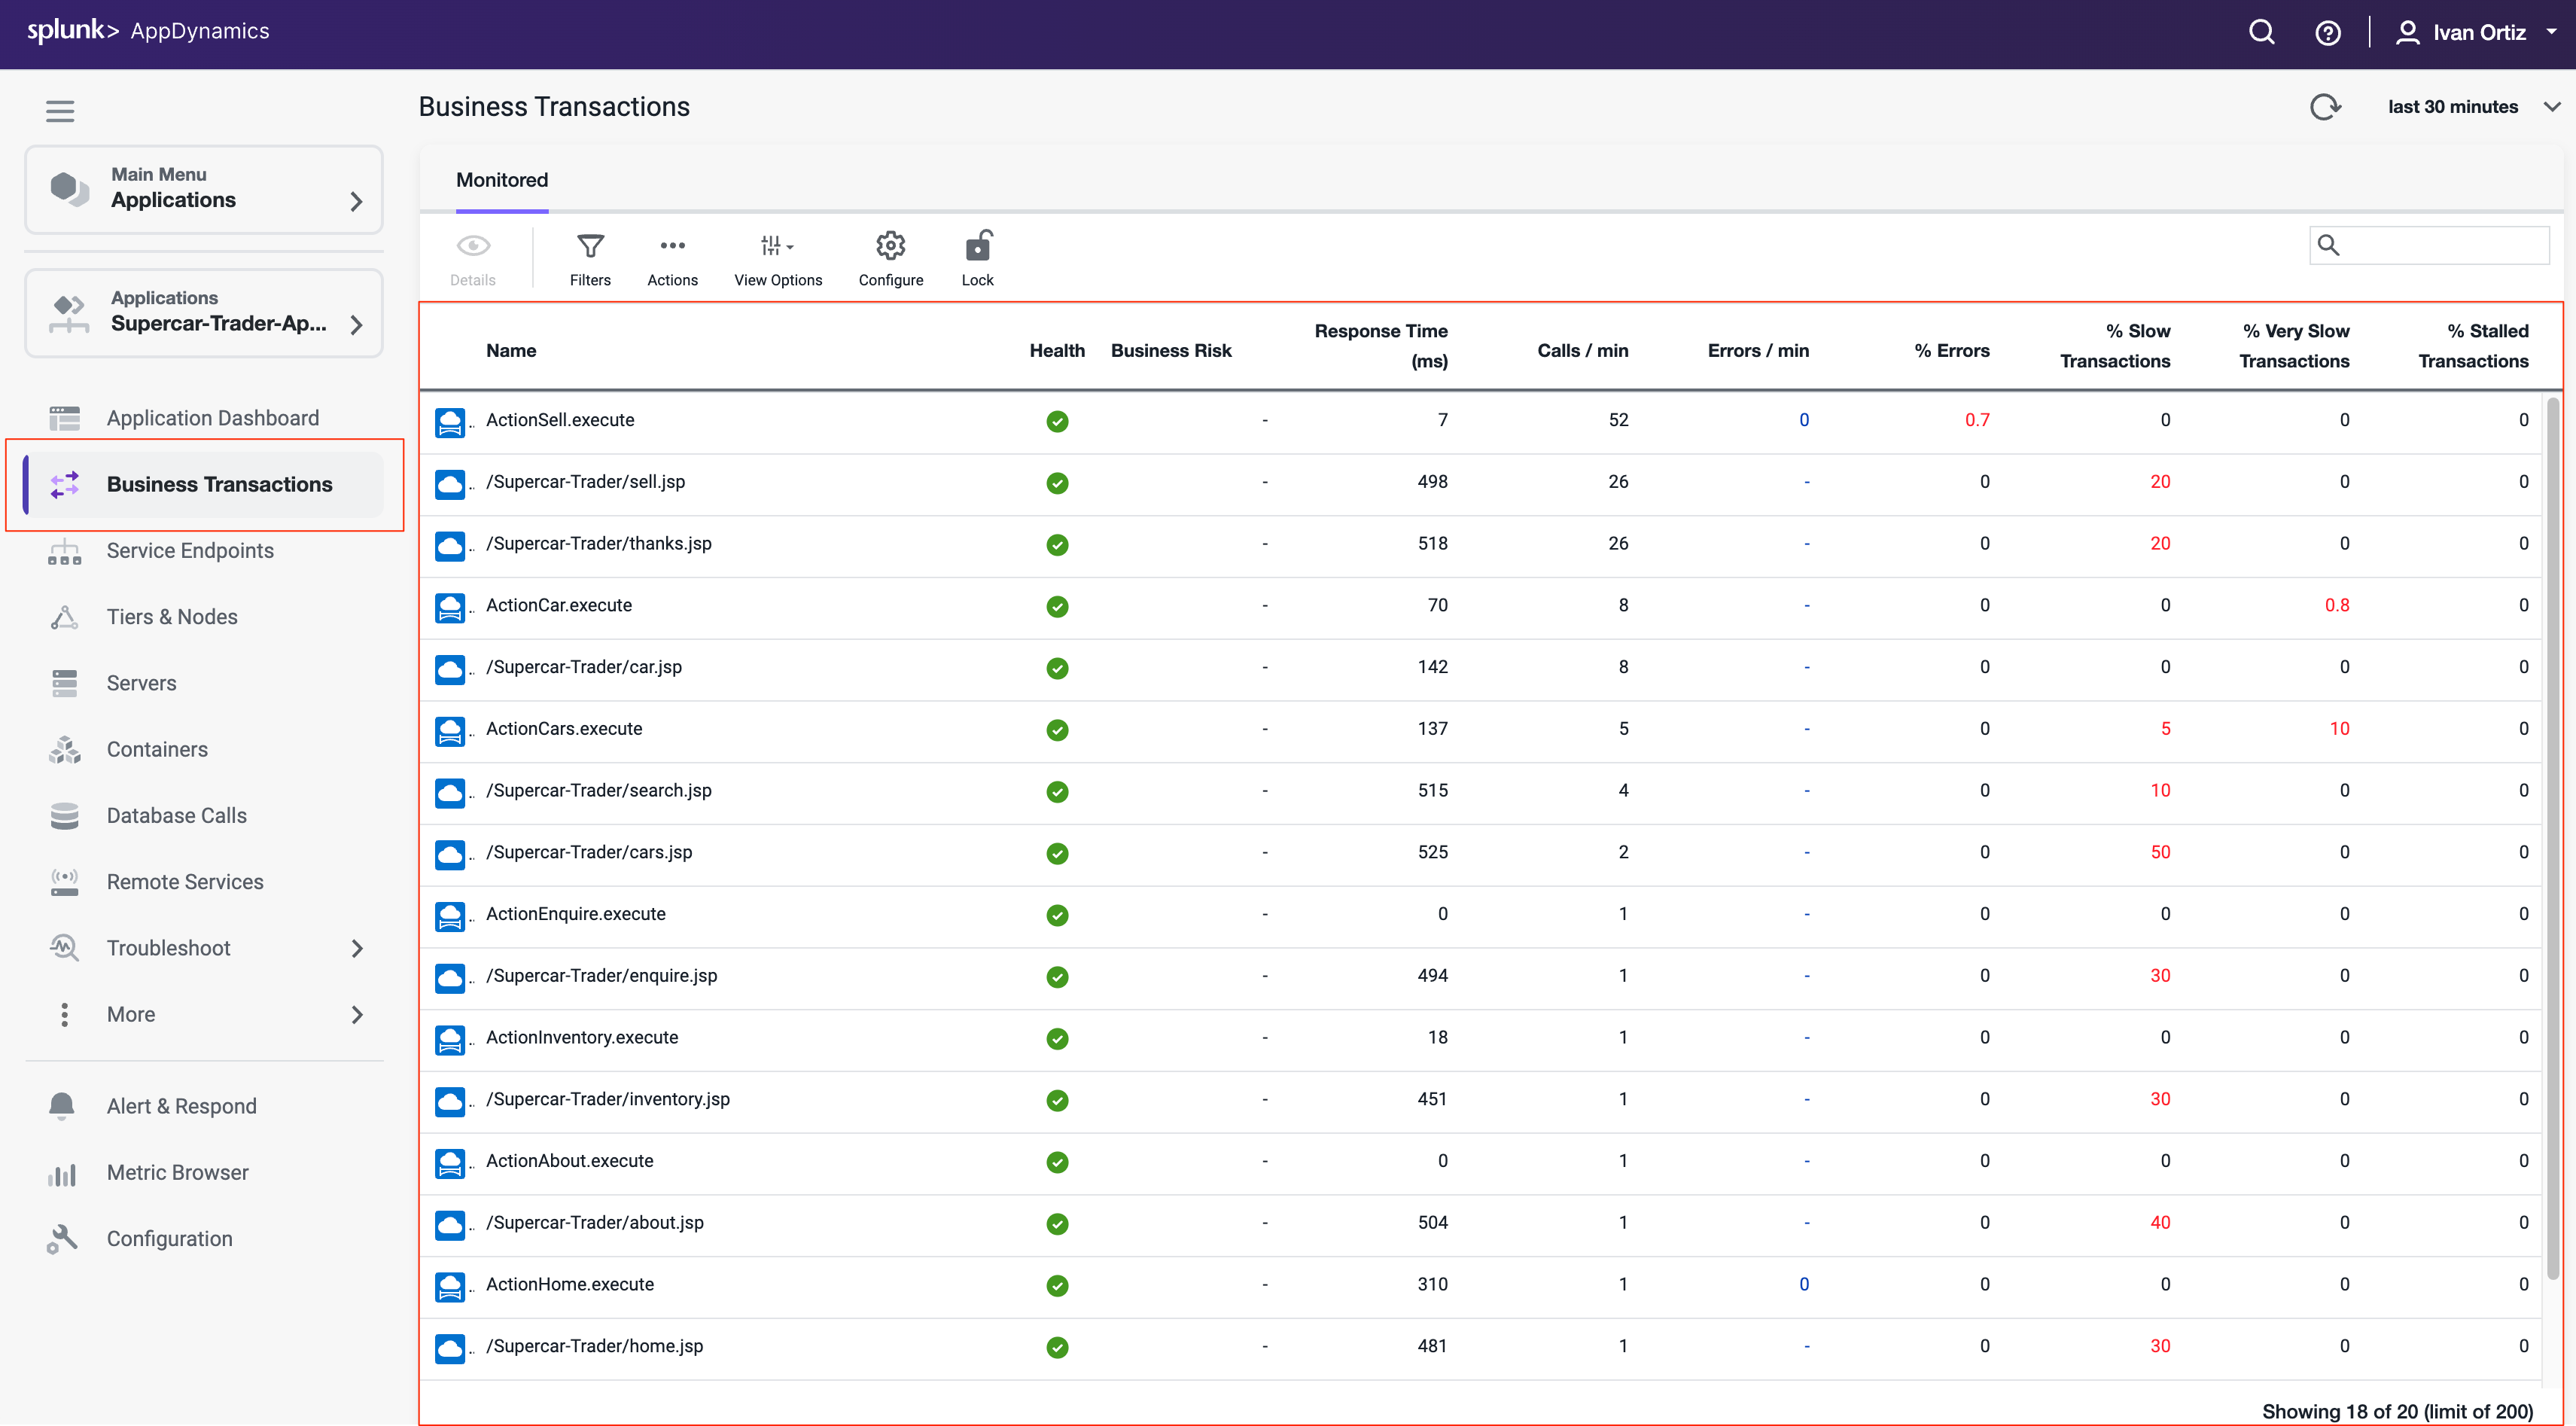
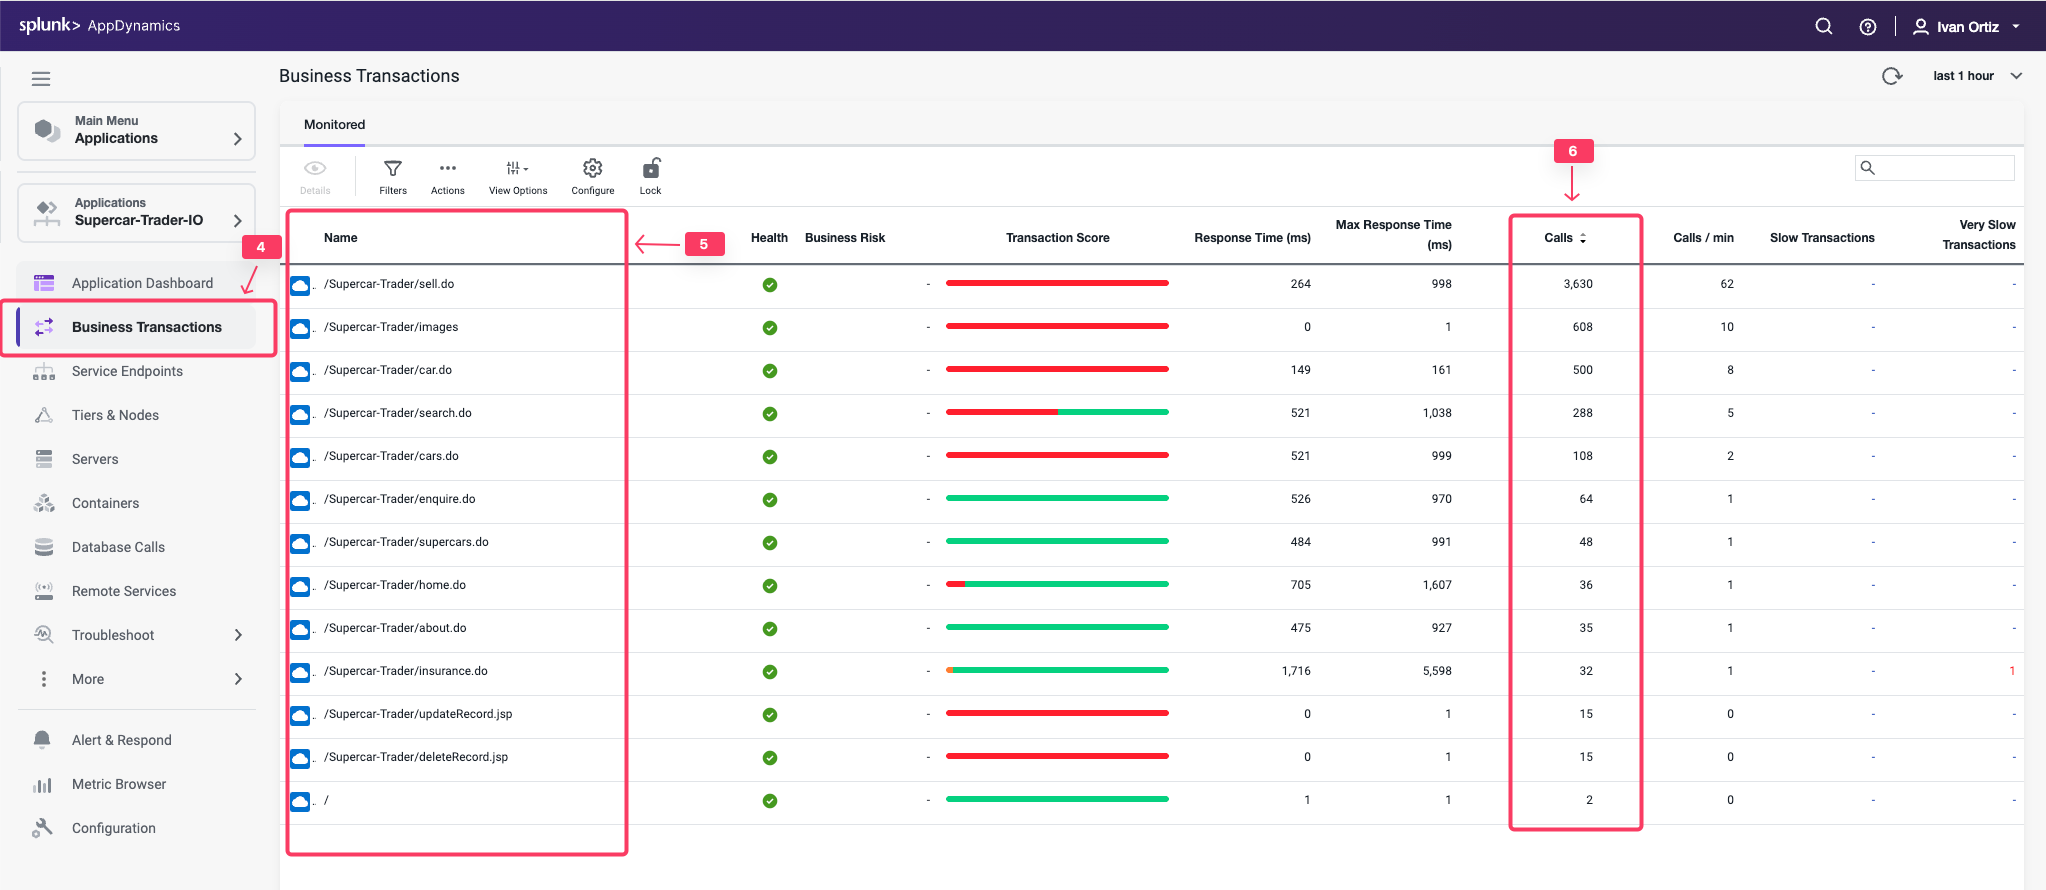
Verifying Business Transactions
Verify that Business Transactions are being automatically detected by following these steps.
Click the Business Transactions option on the left menu.
Look at the list of Business Transactions and their performance.
Snapshots
AppDynamics monitors every execution of a Business Transaction in the instrumented environment, and the metrics reflect all such executions. However, for troubleshooting purposes, AppDynamics takes snapshots (containing deep diagnostic information) of specific instances of transactions that are having problems.
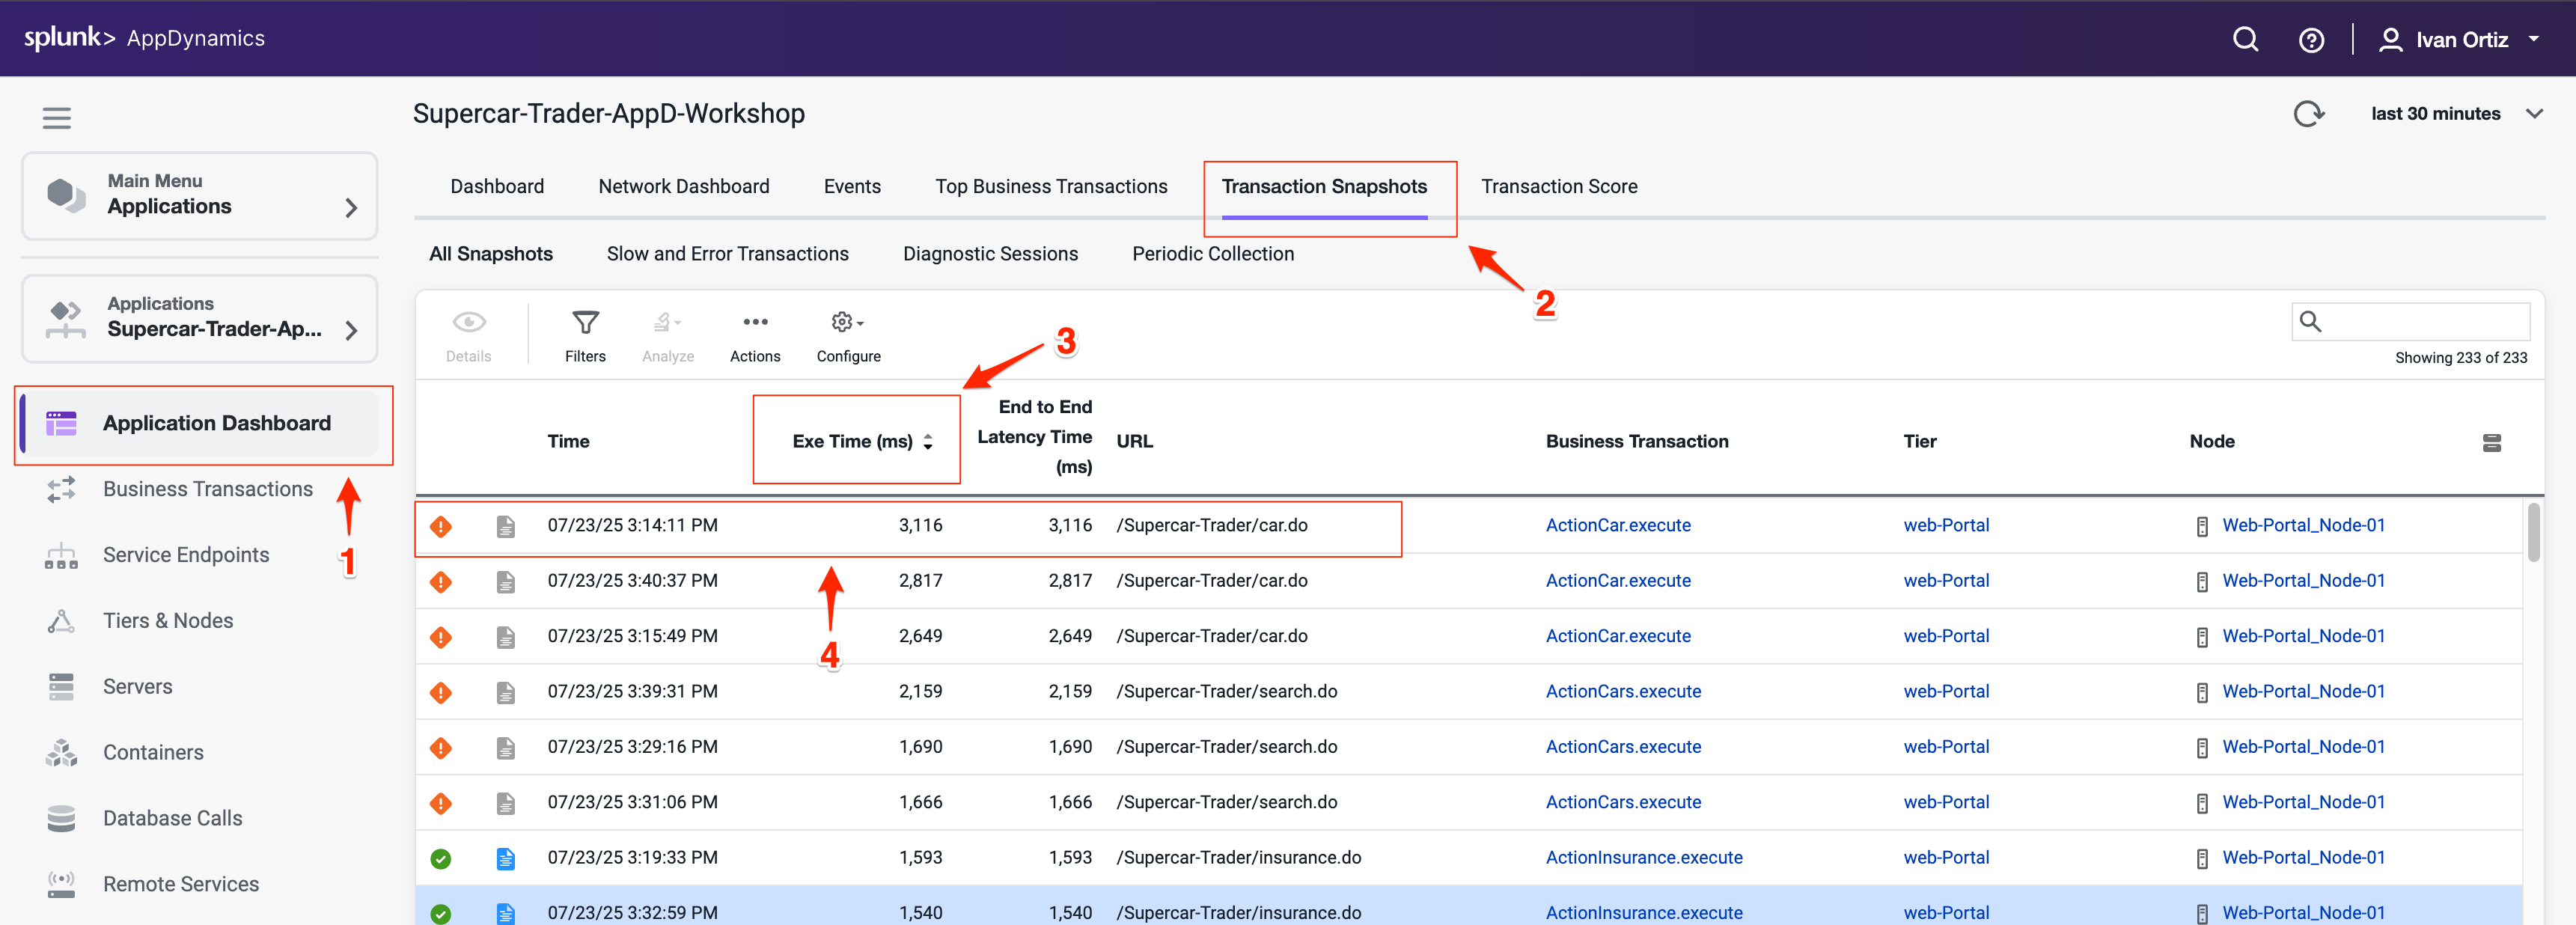
Verify that transaction snapshots are being automatically collected by following these steps.
Click the Application Dashboard option on the left menu.
Click the Transaction Snapshots tab.
Click the Exe Time (ms) column to sort the snapshots with the greatest execution time.
Double-click a Business Transaction snapshot to display the snapshot viewer
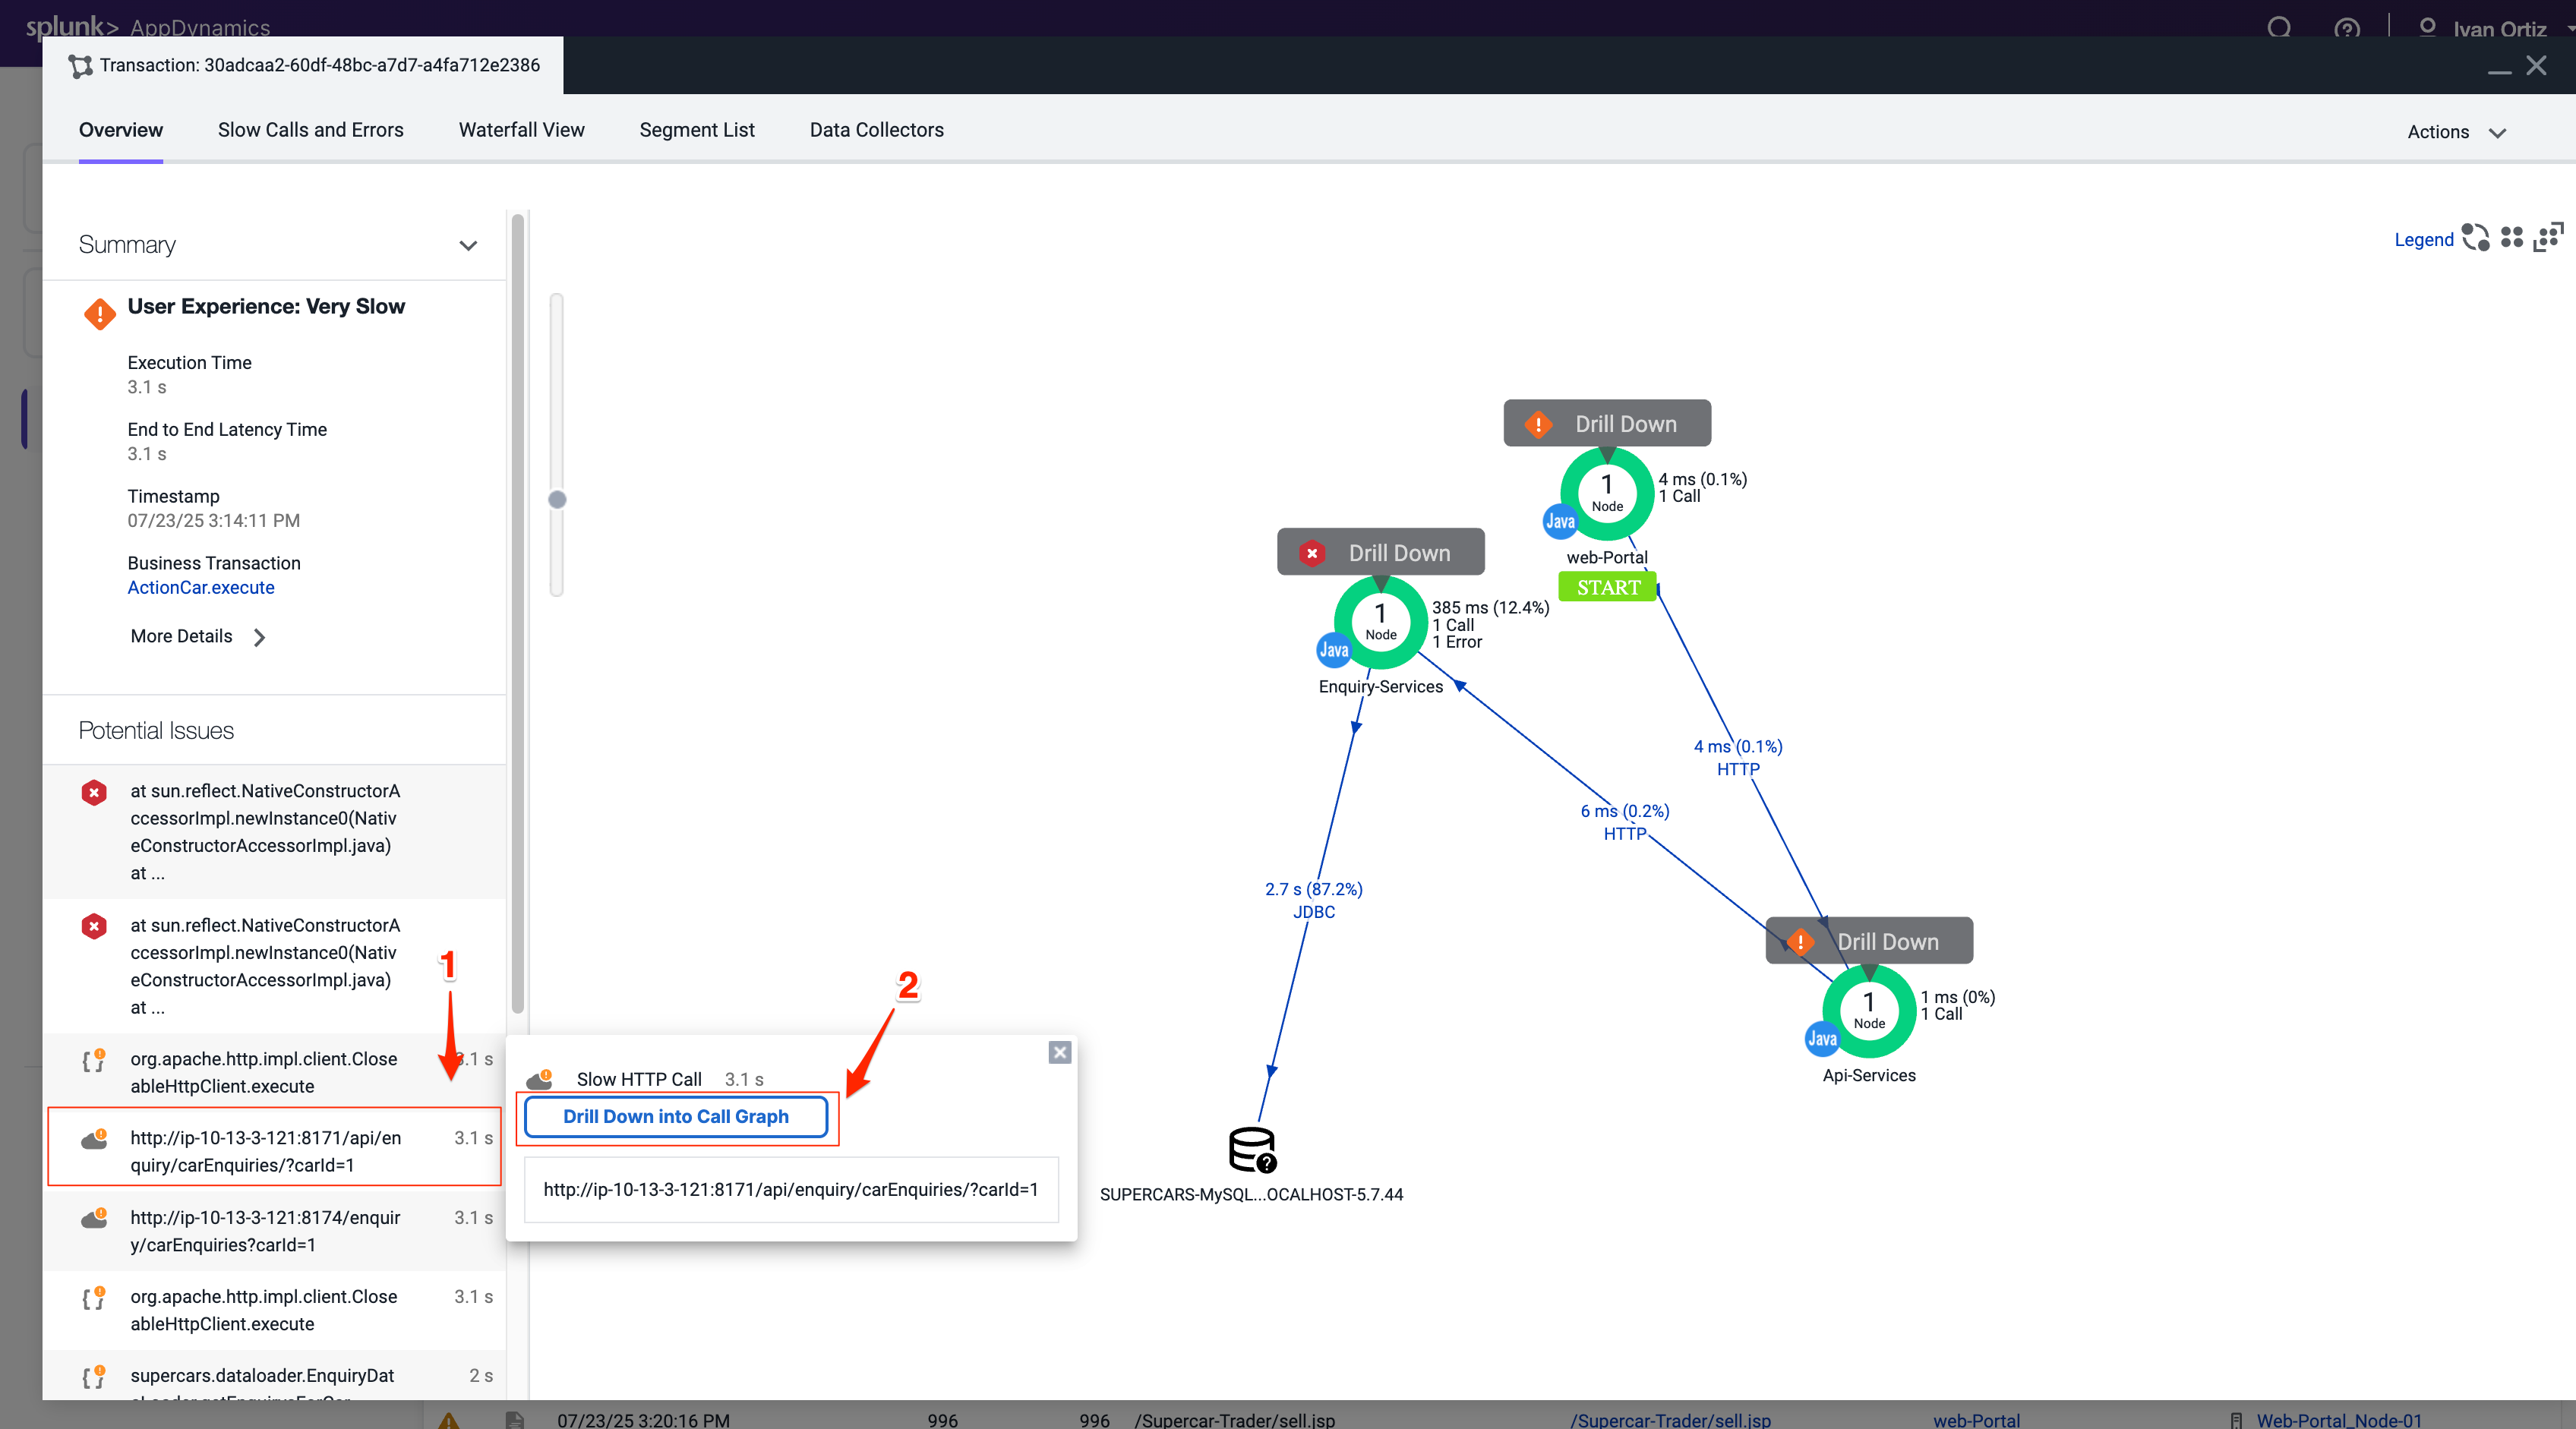
A transaction snapshot gives you a cross-tier view of the processing flow for a single invocation of a transaction.
The Potential Issues panel highlights slow methods and slow remote service calls and help you investigate the root cause for performance issues.
Drill Downs & Call Graphs
Call graphs and drill downs provide key information, including slowest methods, errors, and remote service calls for the transaction execution on a tier. A drill down may include a partial or complete call graph. Call graphs reflect the code-level view of the processing of the Business Transaction on a particular tier.
In the Flow Map for a Business Transaction snapshot, a tier with a Drill Down link indicates AppDynamics has taken a call graph for that tier.
Drill down into a call graph of the transaction snapshot by following these steps.
Click on a slow call in the Potential Issues list on the left.
Click Drill Down into Call Graph.
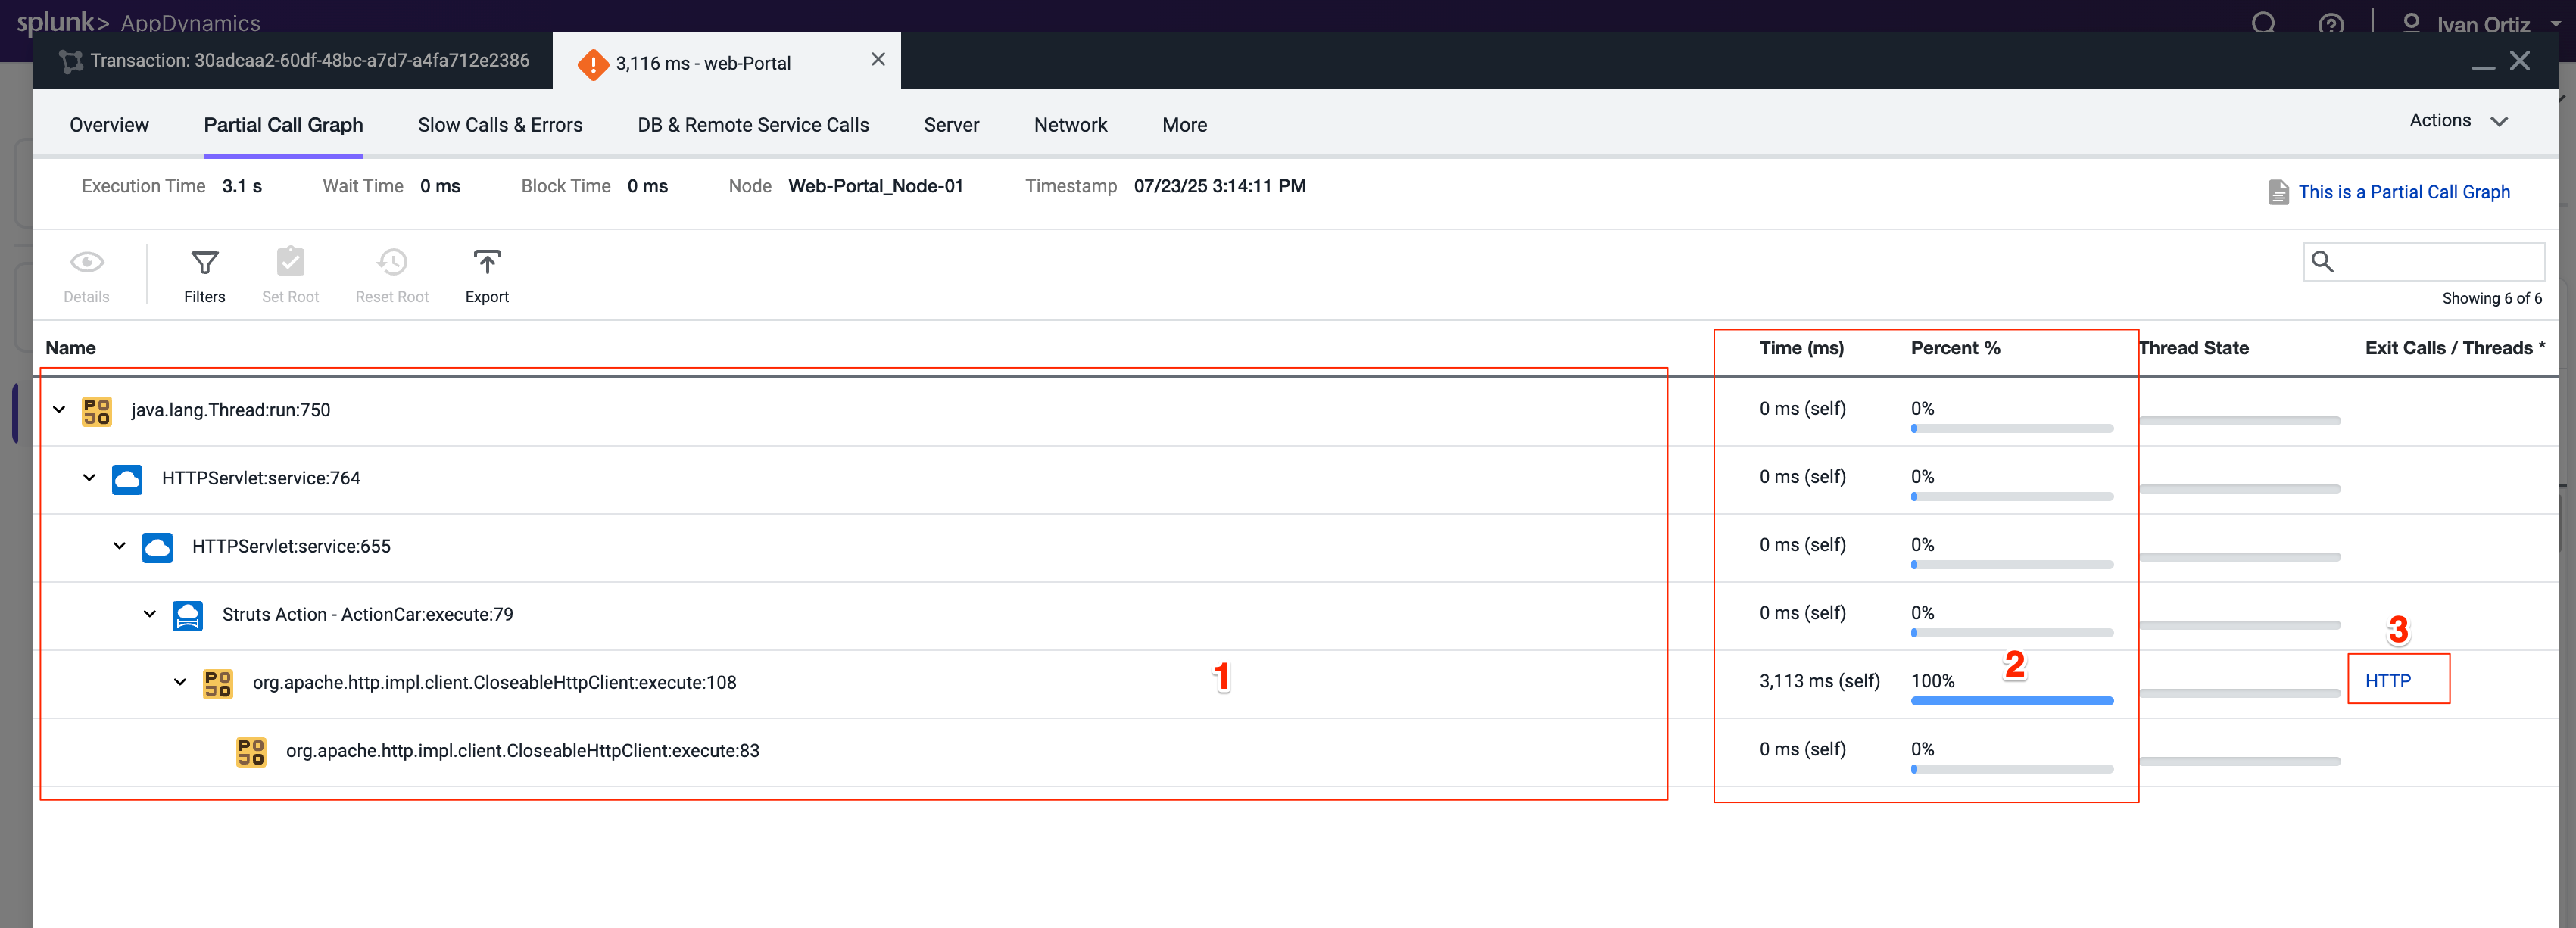
The call graph view shows you the following details.
The method execution sequence shows the names of the classes and methods that participated in processing the Business Transaction on this node, in the order in which the flow of control proceeded.
For each method, you can see the time and percentage spent processing and the line number in the source code, enabling you to pinpoint the location in the code that could be affecting the performance of the transaction.
The call graph displays exit call links for methods that make outbound calls to other components such as database queries and web service calls.
You can read more about Transaction Snapshots here
In this exercise you will complete the following tasks:
Adjust Business Transaction settings.
Adjust Call Graph settings.
Observe Business Transaction changes.
Adjust Business Transaction Settings
In the last exercise, you validated that Business Transactions were being auto-detected. There are times when you want to adjust the Business Transaction auto-detection rules to get them to an optimal state. This is the case with our sample application, which is built on an older Apache Struts framework.
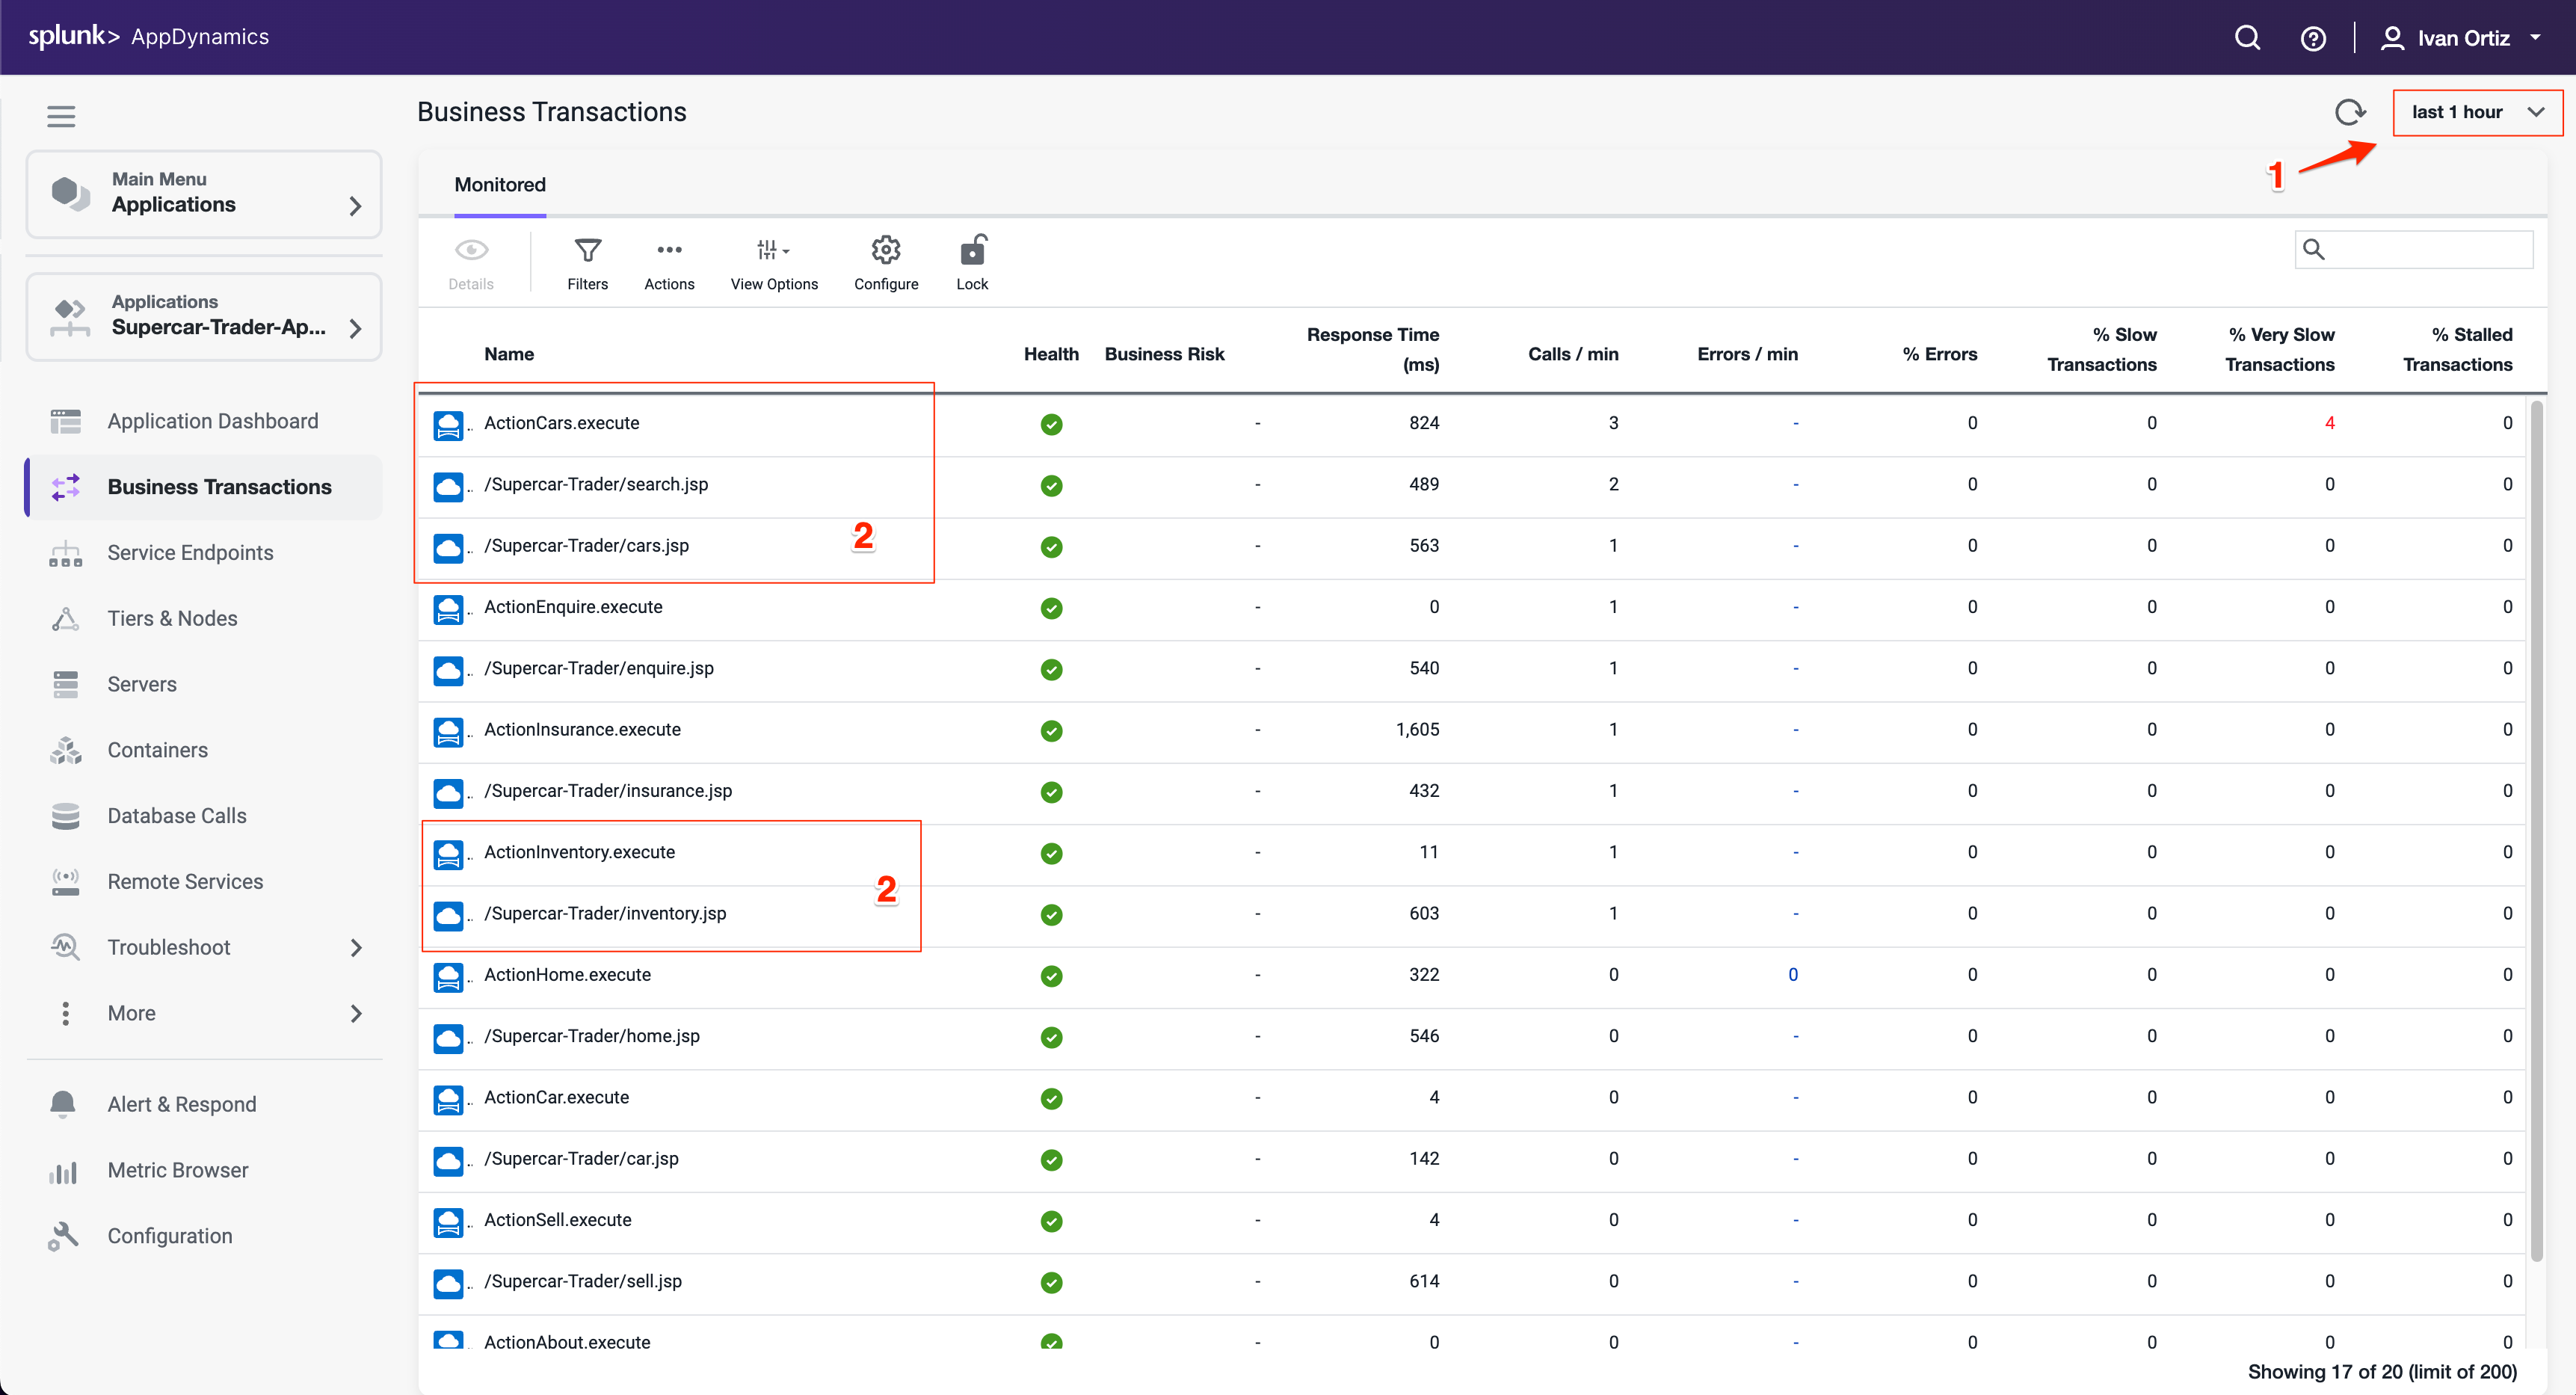
The business transactions highlighted in the following image show that each pair has a Struts Action (.execute) and a Servlet type (.jsp). You will be adjusting the settings of the transaction detection rules so that these two types of transactions will be combined into one.
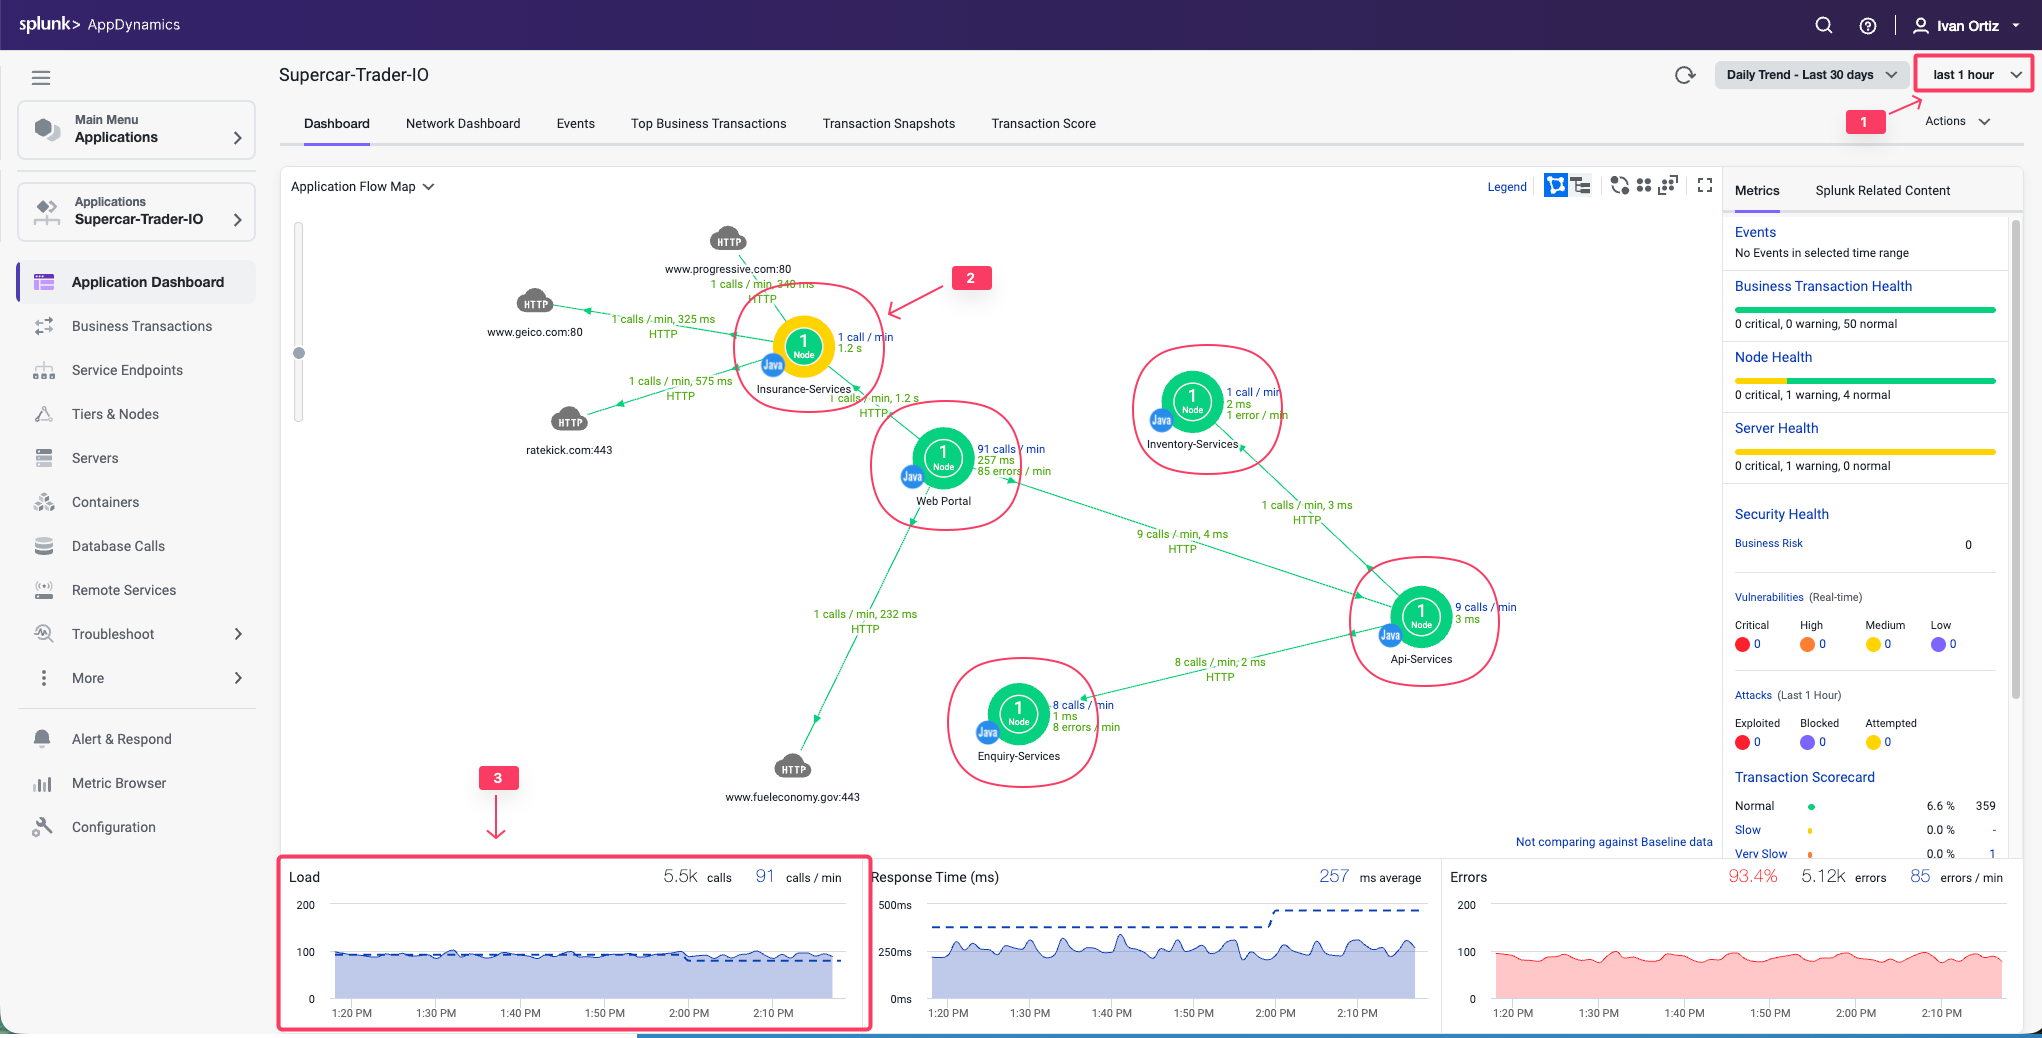
Anytime you see the time frame selector visible in the AppDynamics UI, the view you see will represents the context of the time frame selected. You can choose one of the pre-defined time frames or create your own custom time frame with the specific date and time range you want to view.
Select the last 1 hour time frame.
Use your mouse to hover over the blue icons to see the Entry Point Type of the transaction.
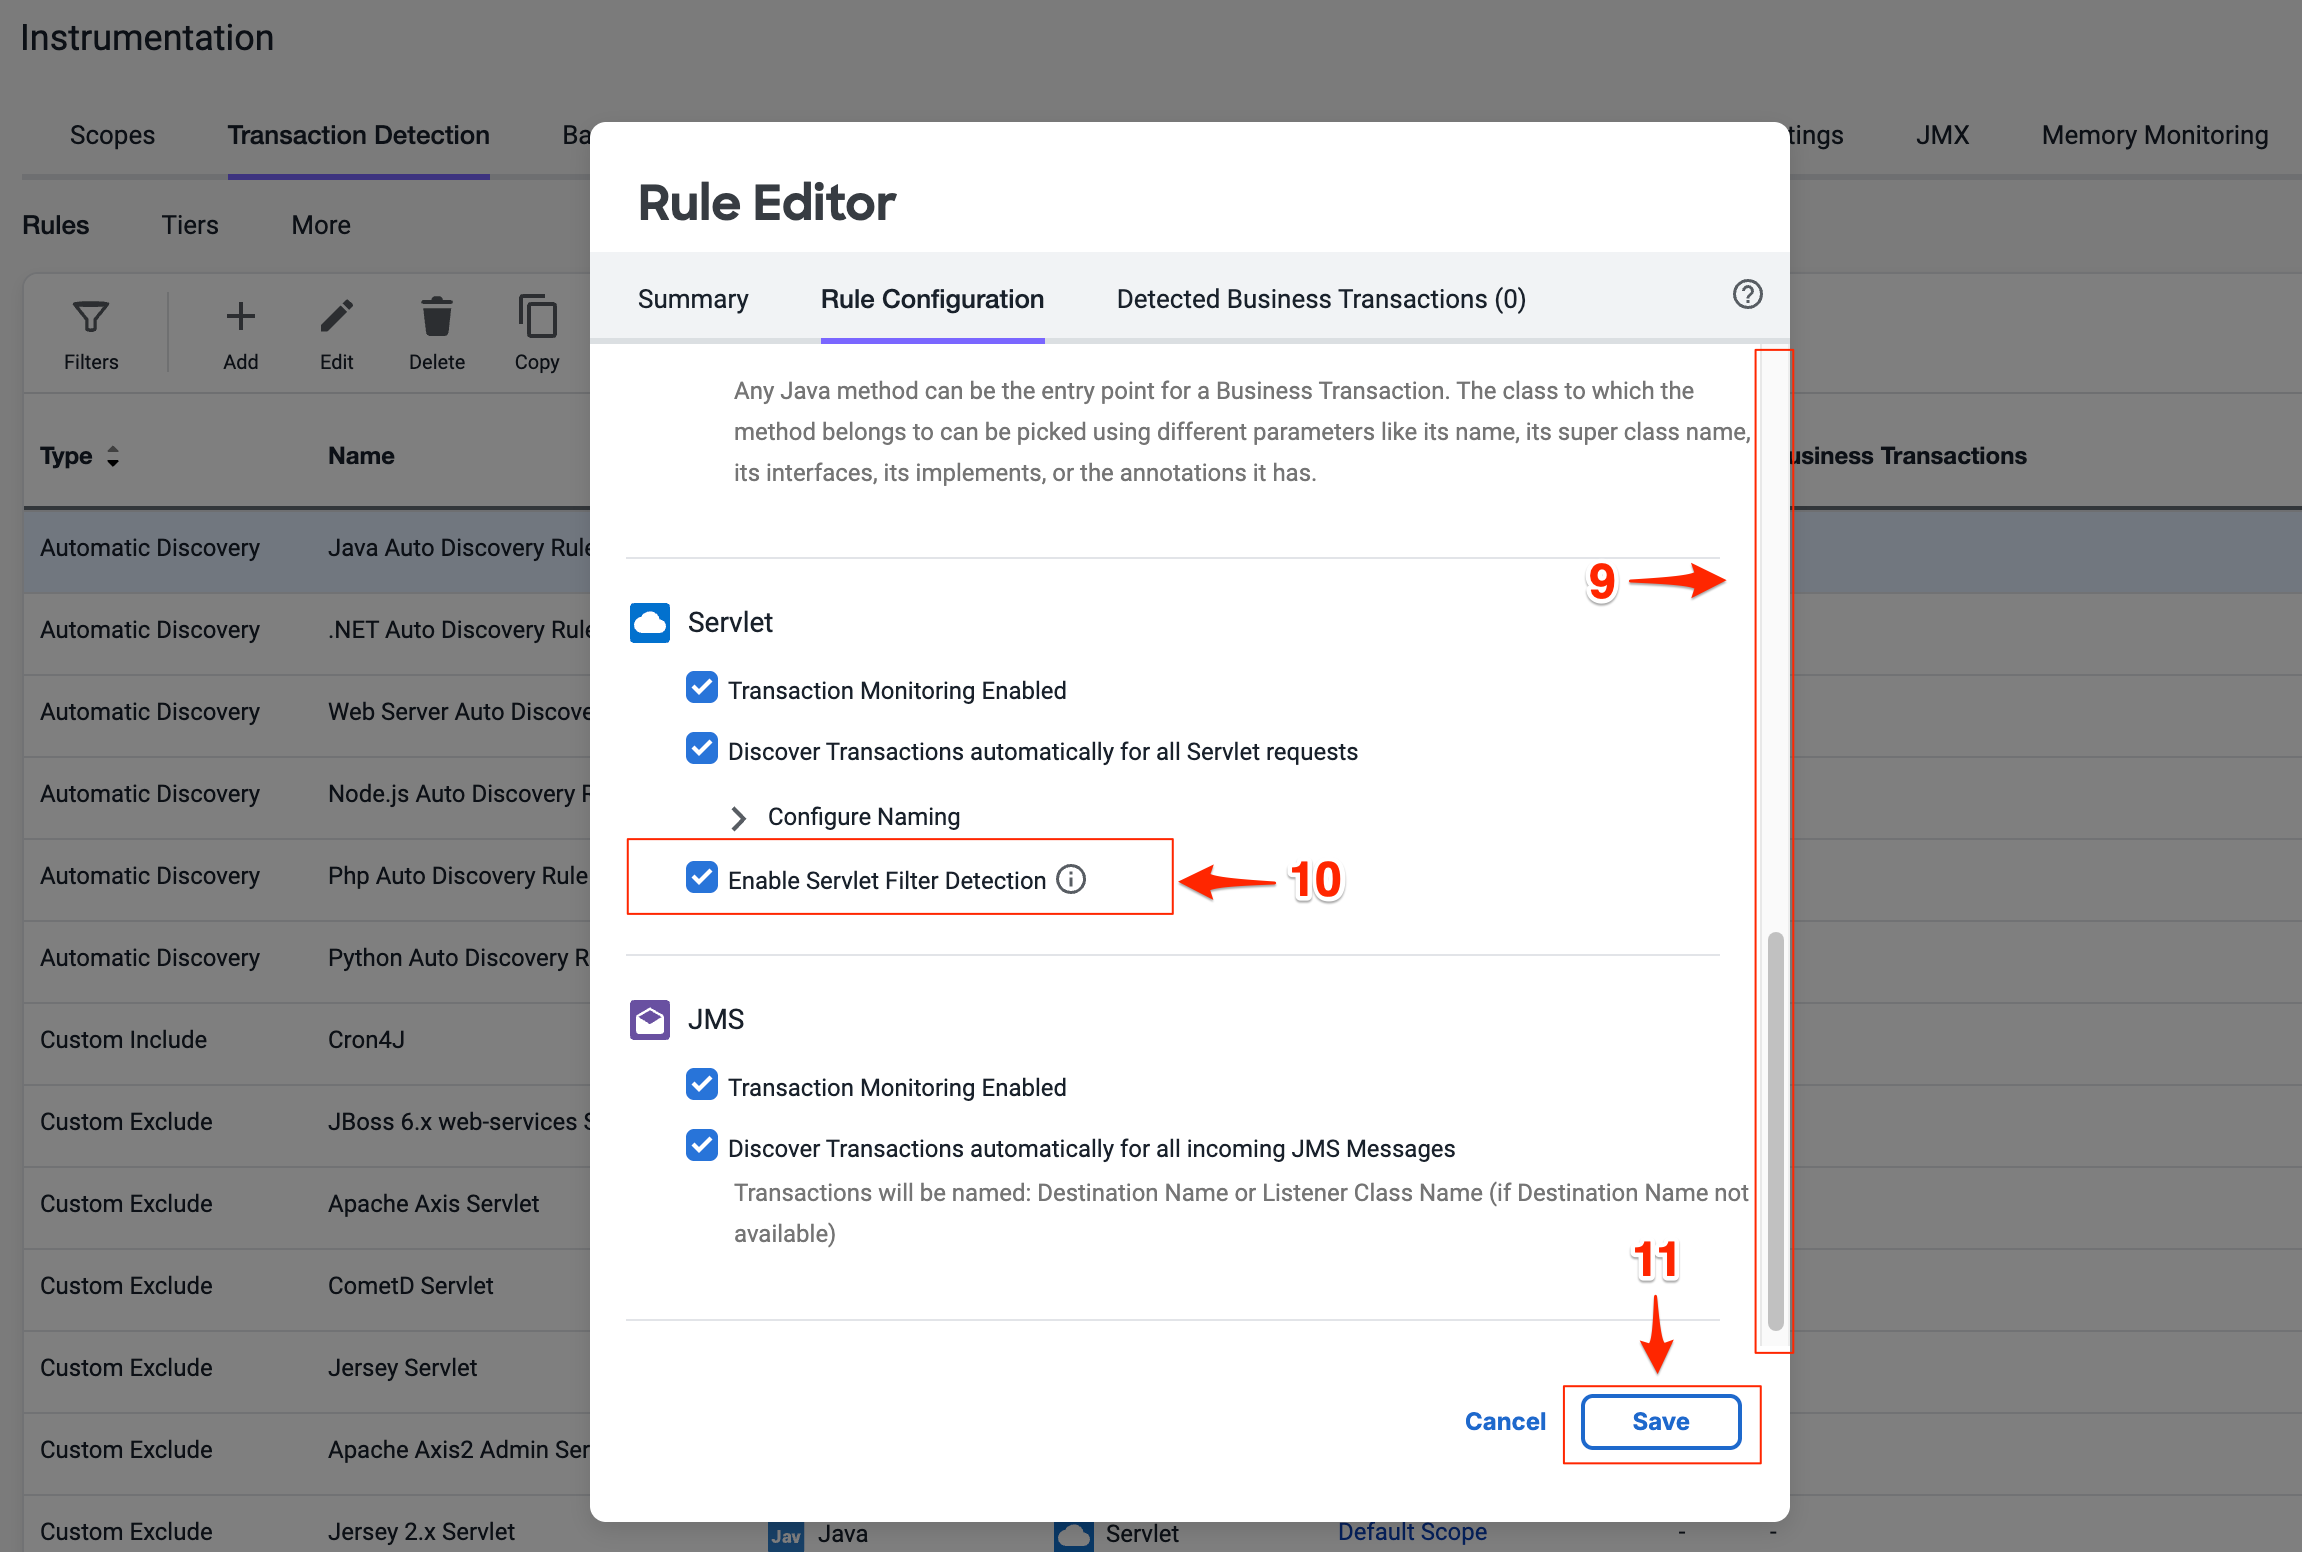
Optimize the transaction detection by following these steps:
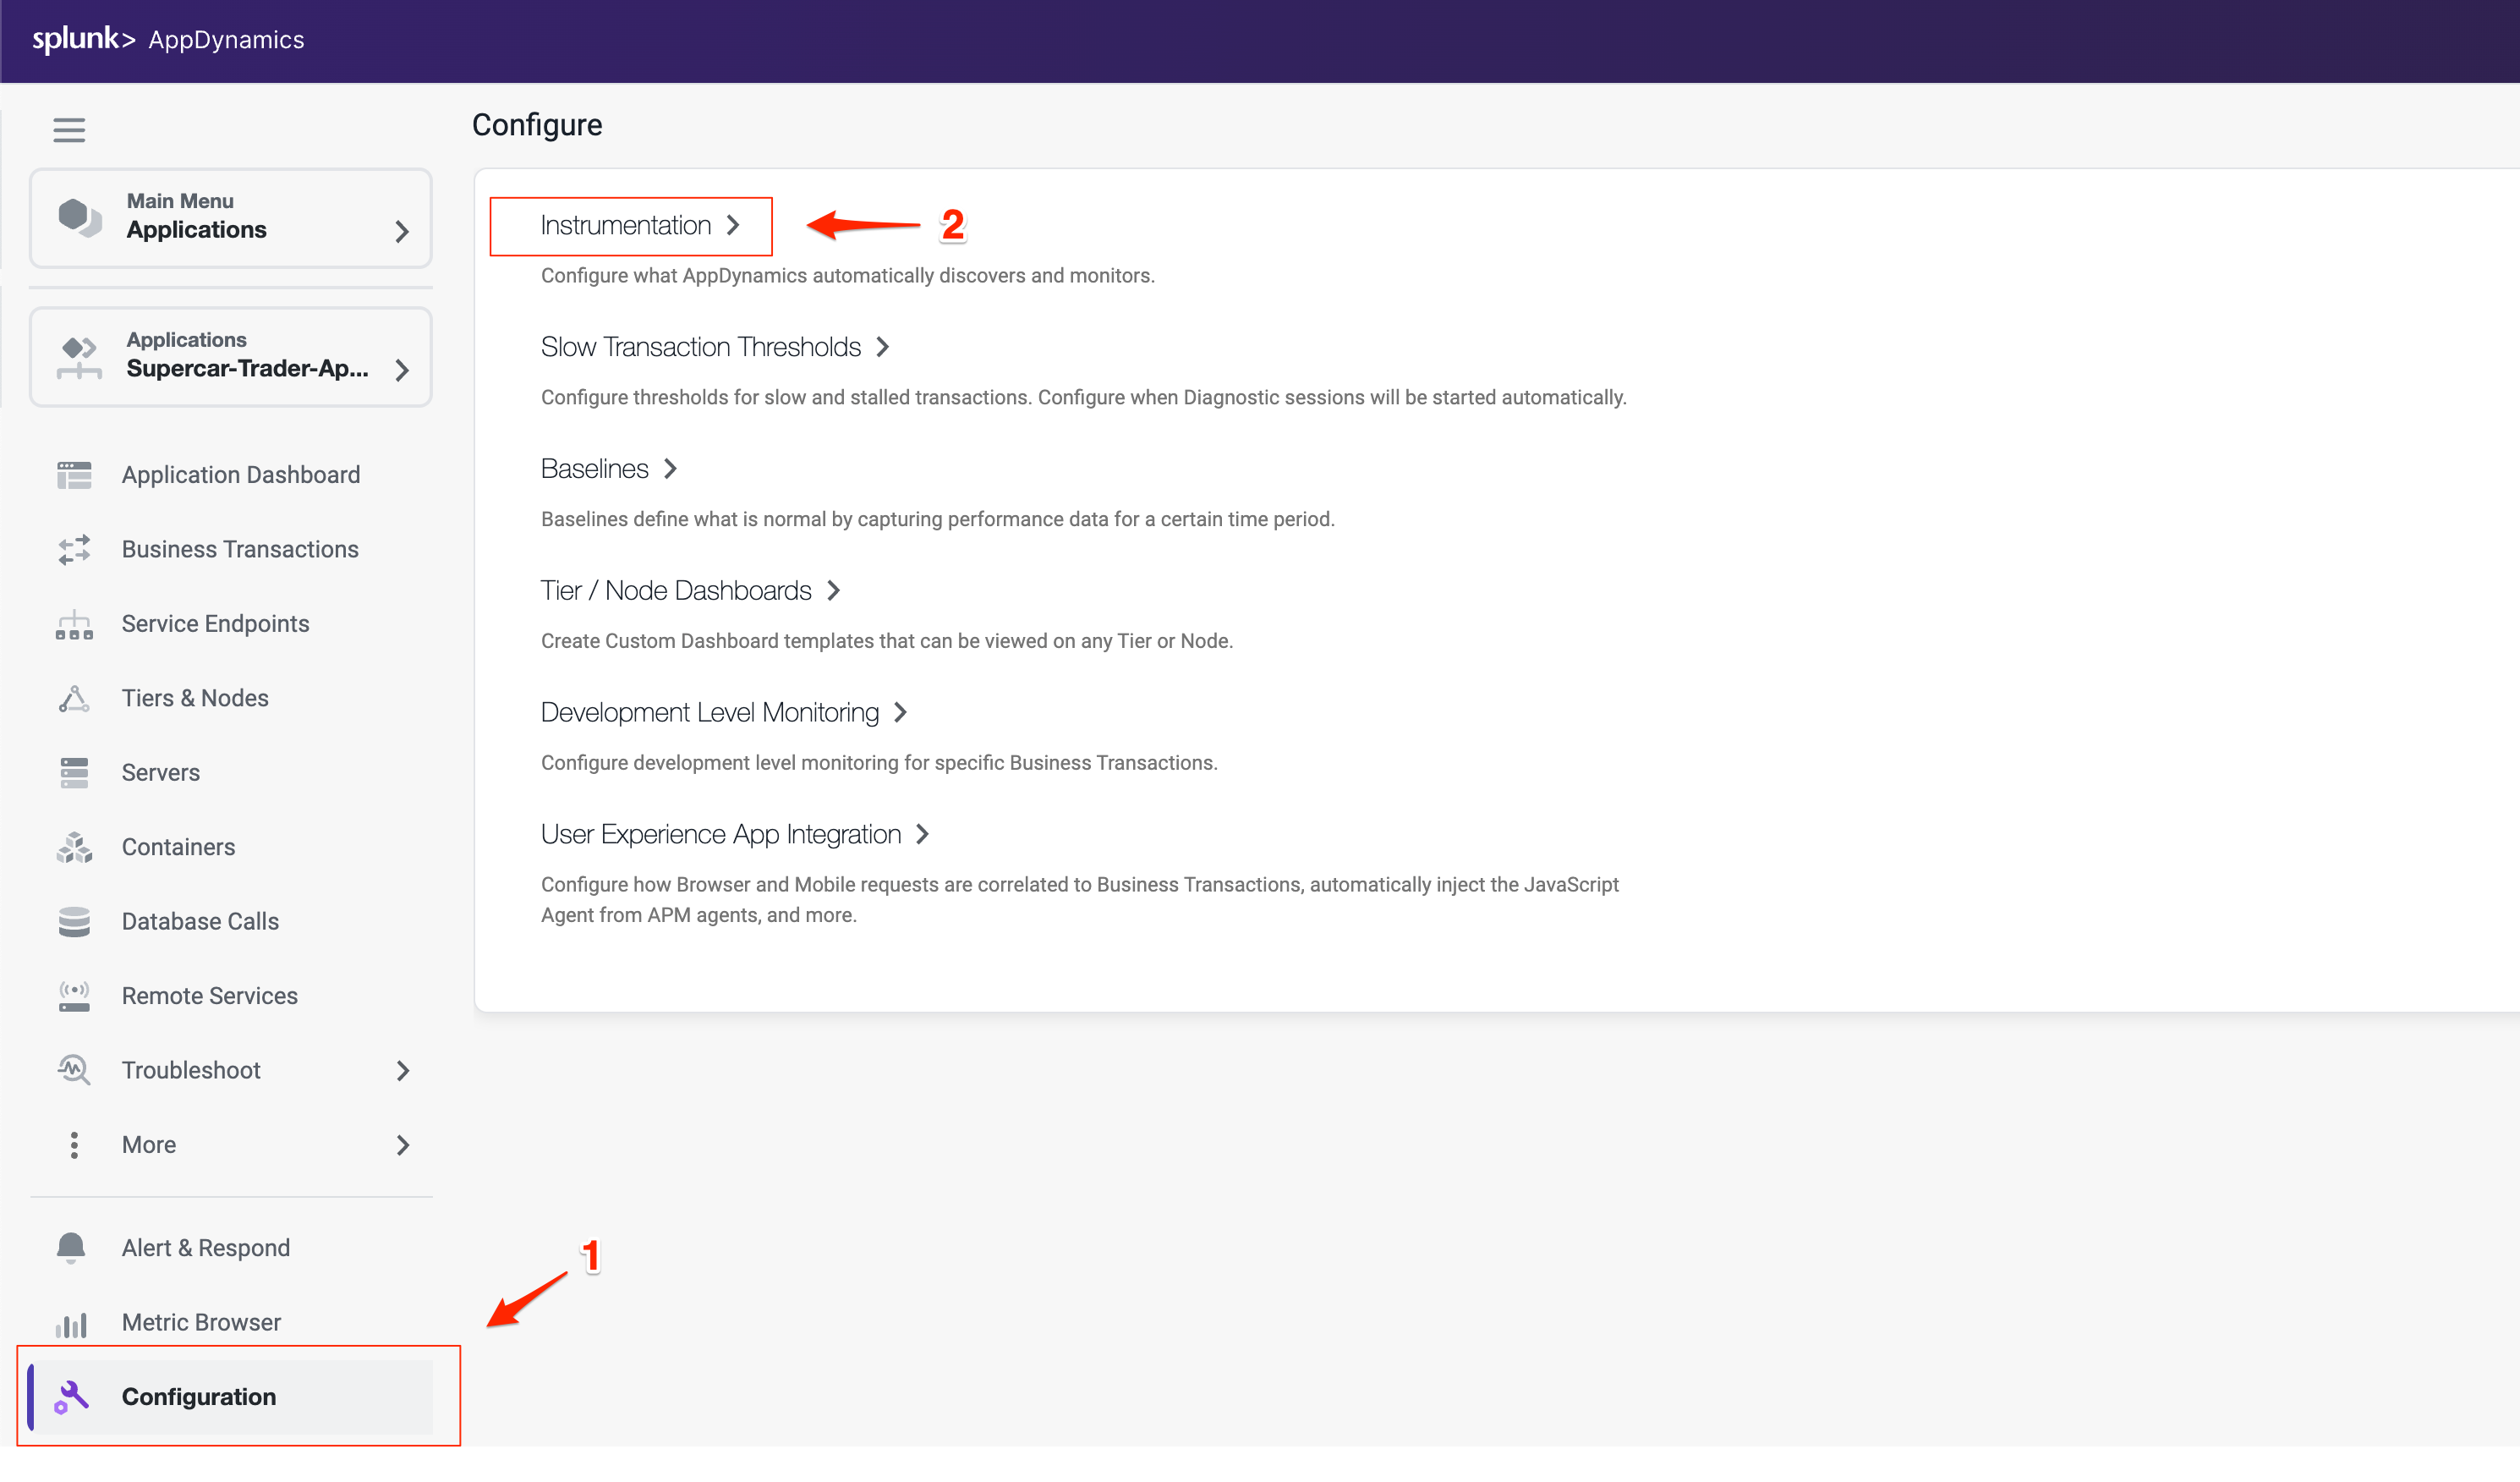
Click the Configuration option toward the bottom left menu.
Click the Instrumentation link.
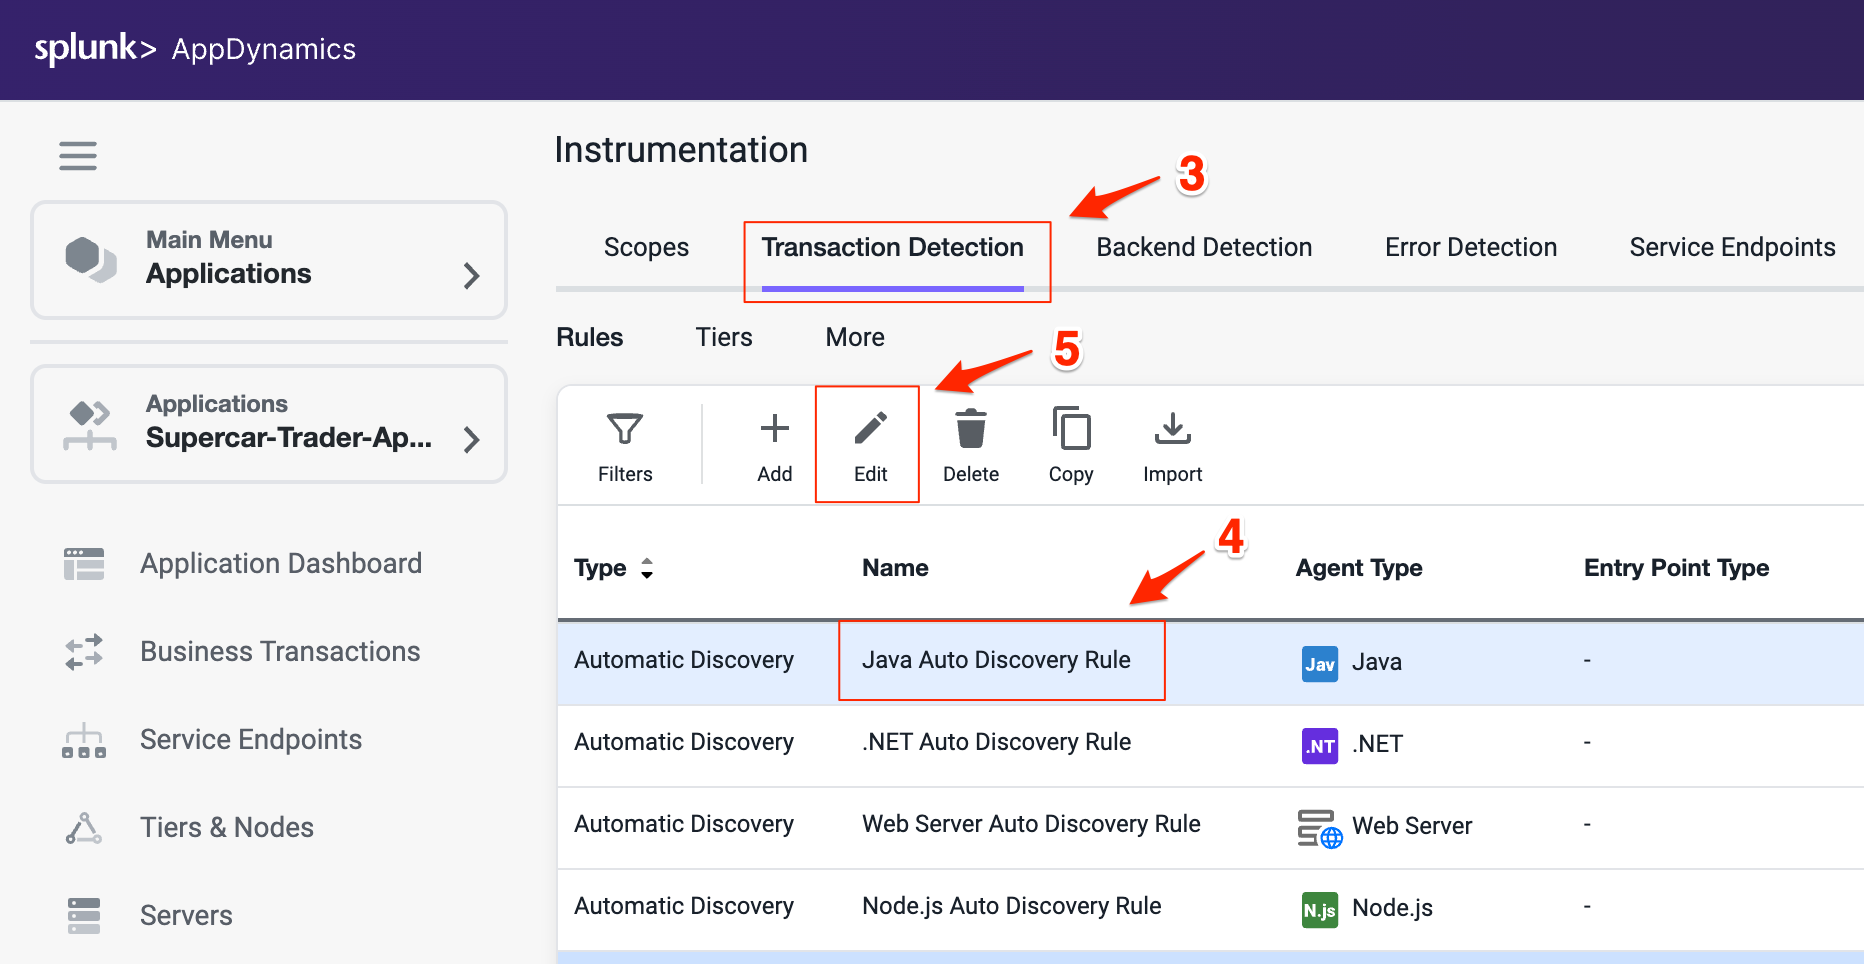
Select Transaction Detection from the Instrumentation menu.
Select the Java Auto Discovery Rule.
Click Edit.
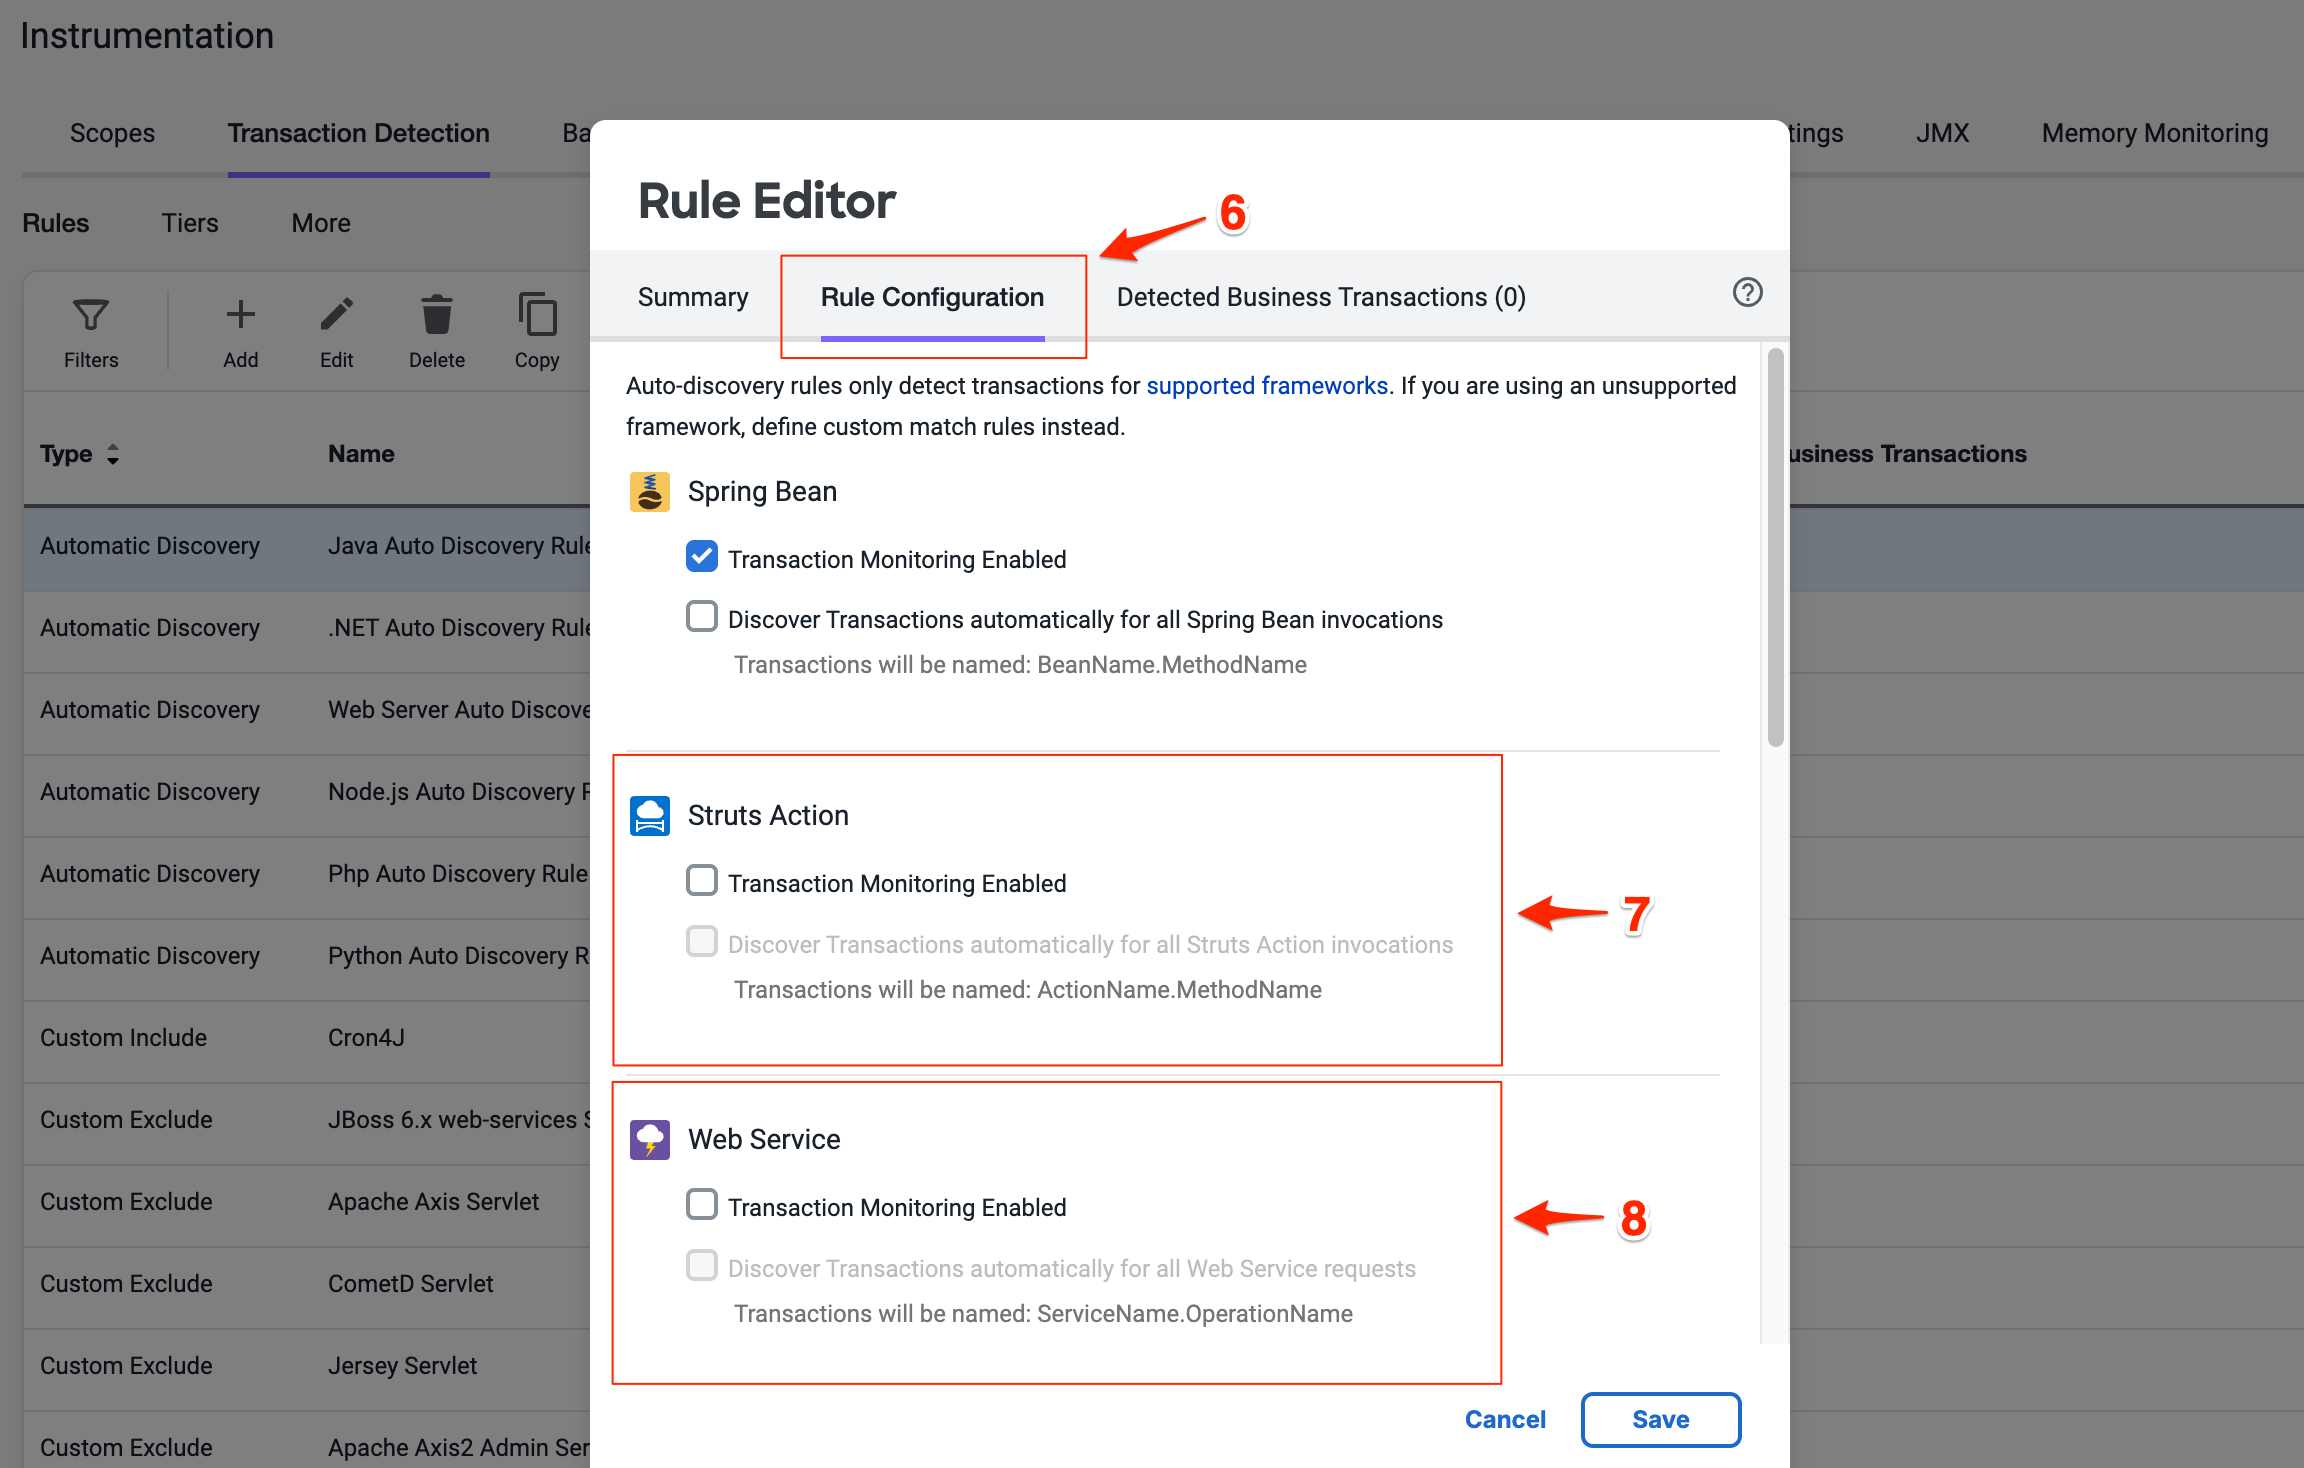
Select the Rule Configuration tab on the Rule Editor.
Uncheck all the boxes on Struts Action section.
Uncheck all the boxes on Web Service section.
Scroll down to find the Servlet settings.
Check the box Enable Servlet Filter Detection (all three boxes should be checked on Servlet settings).
Click Save to save your changes.
You can read more about Transaction Detection Rules here.
Adjust Call Graph settings
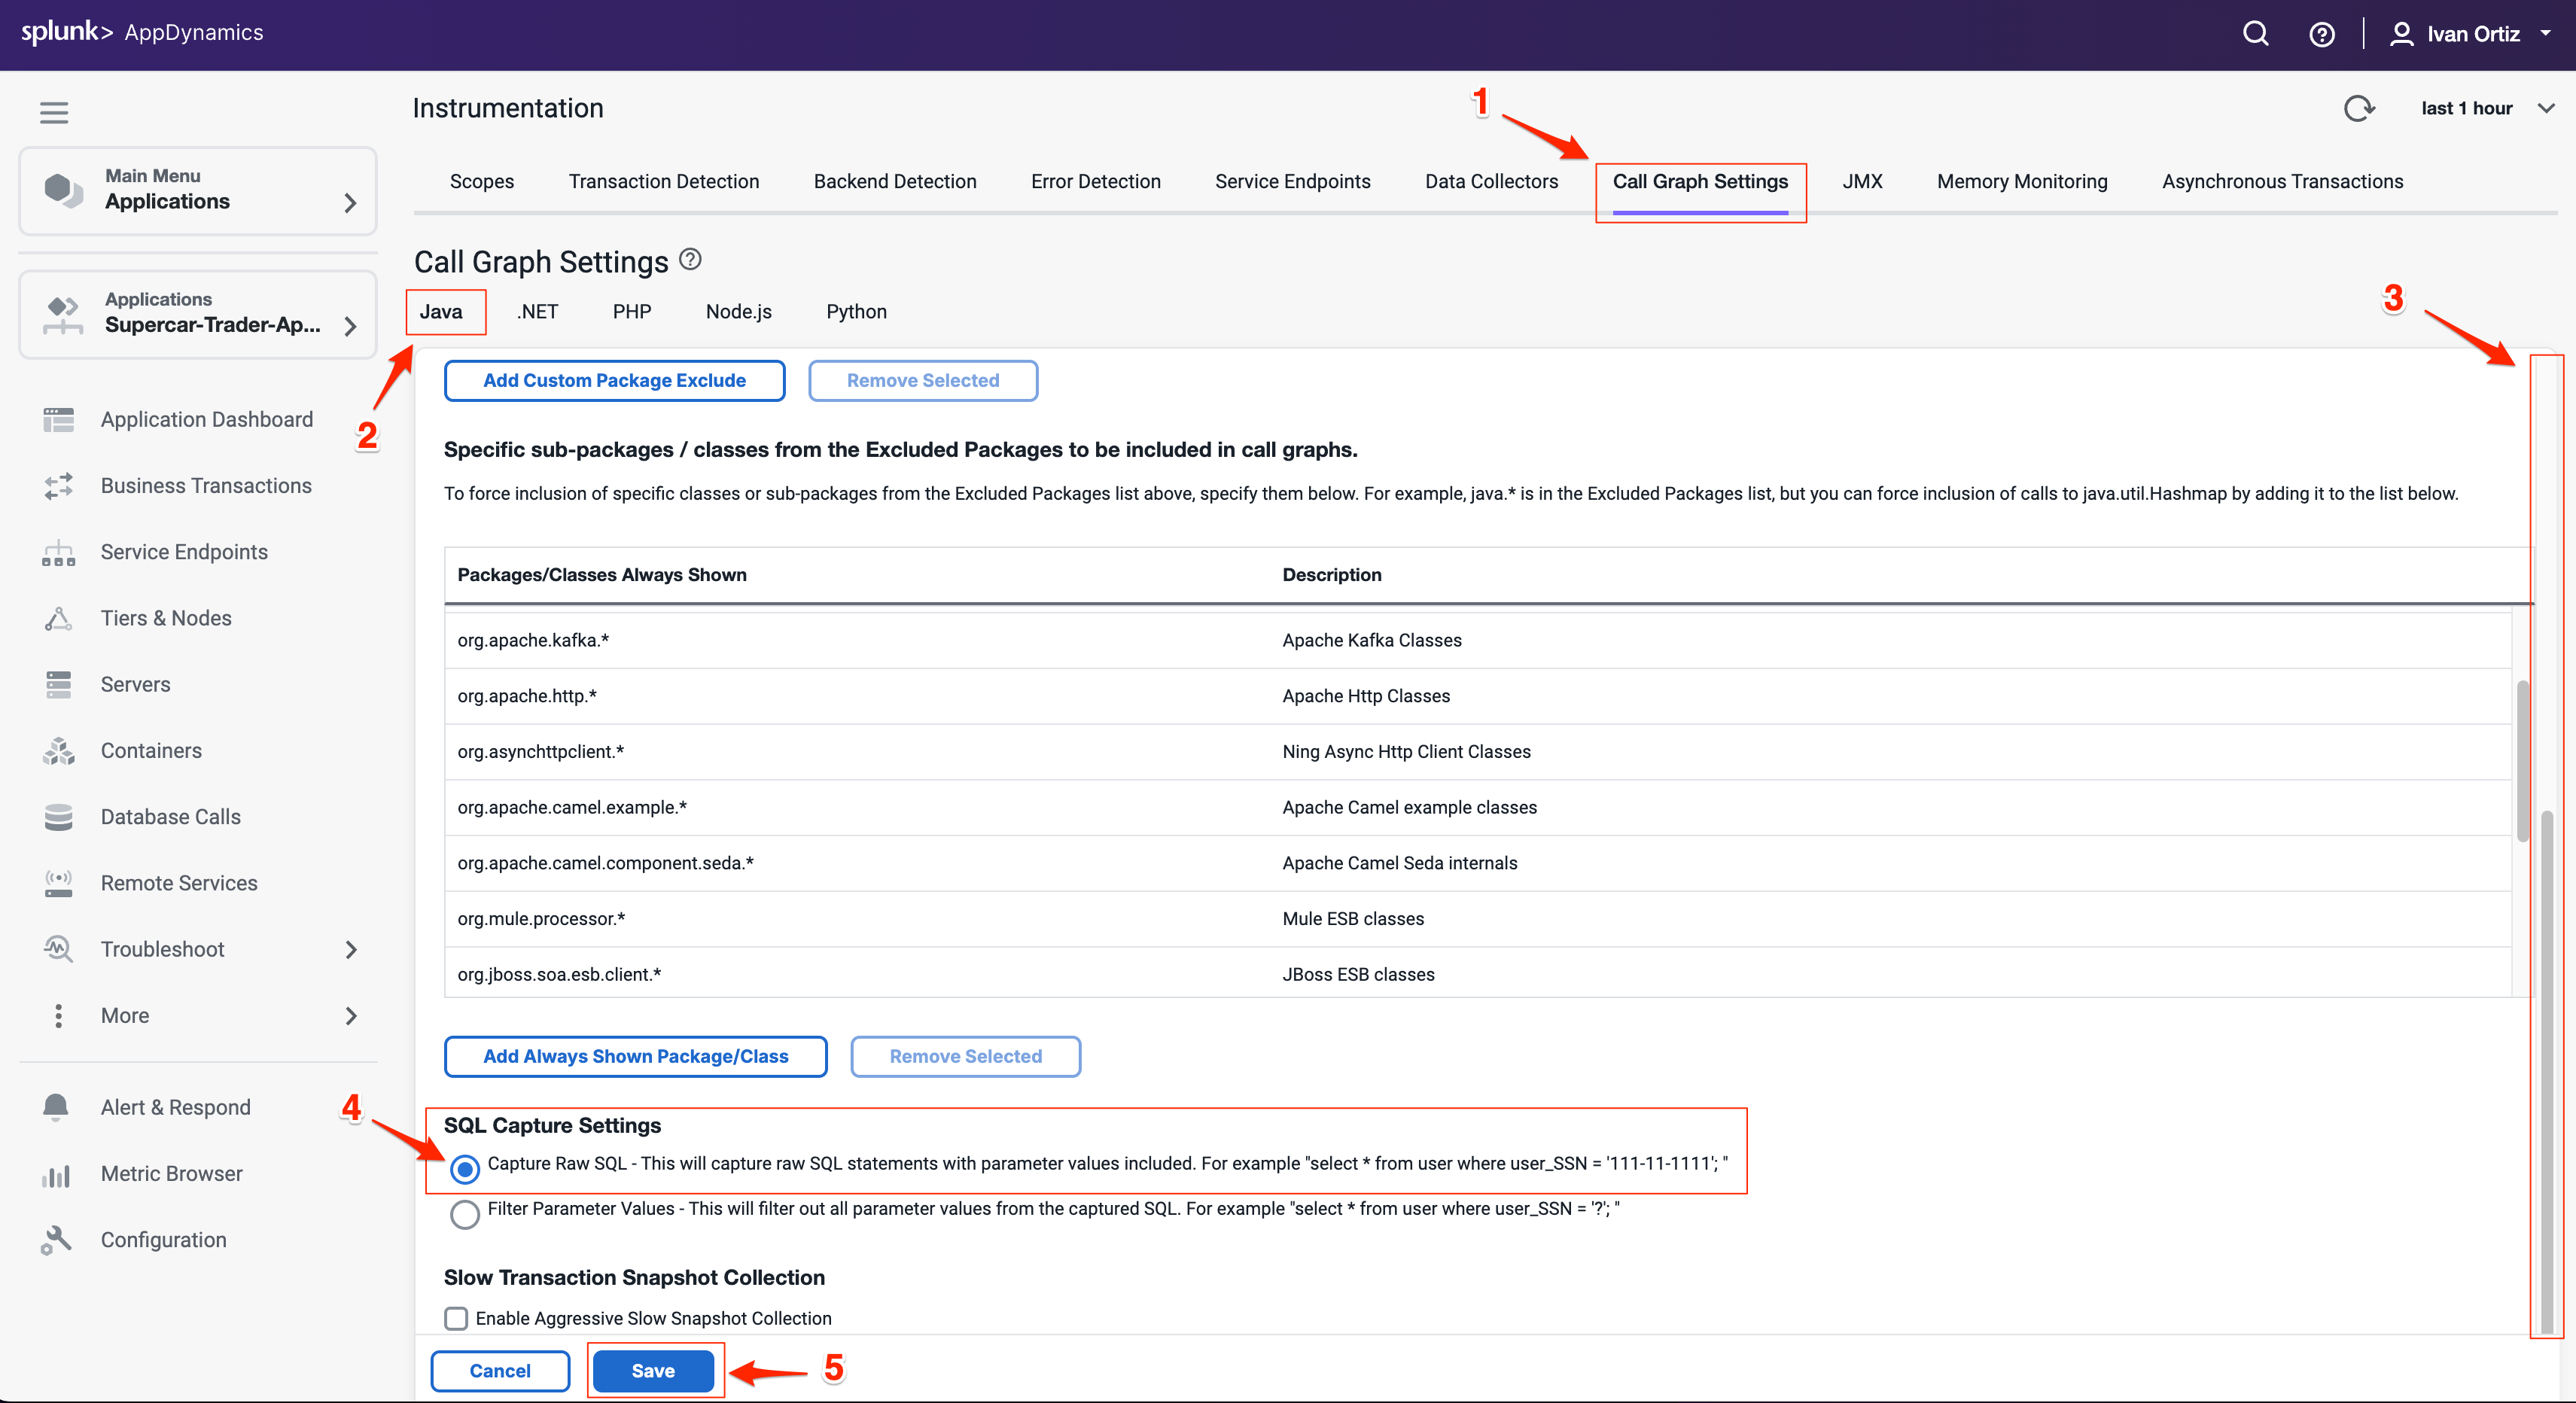
You can control the data captured in call graphs within transaction snapshots with the Call Graph Settings window seen below. In this step you will change the SQL Capture settings so the parameters of each SQL query are captured along with the full query. You can change the SQL Capture settings by following these steps.
Select the Call Graph Settings tab from the Instrumentation window. This is within the Instrumentation settings which we navigated to from the previous exercise.
Ensure you have the Java tab selected within the settings.
Scroll down until you see the SQL Capture Settings.
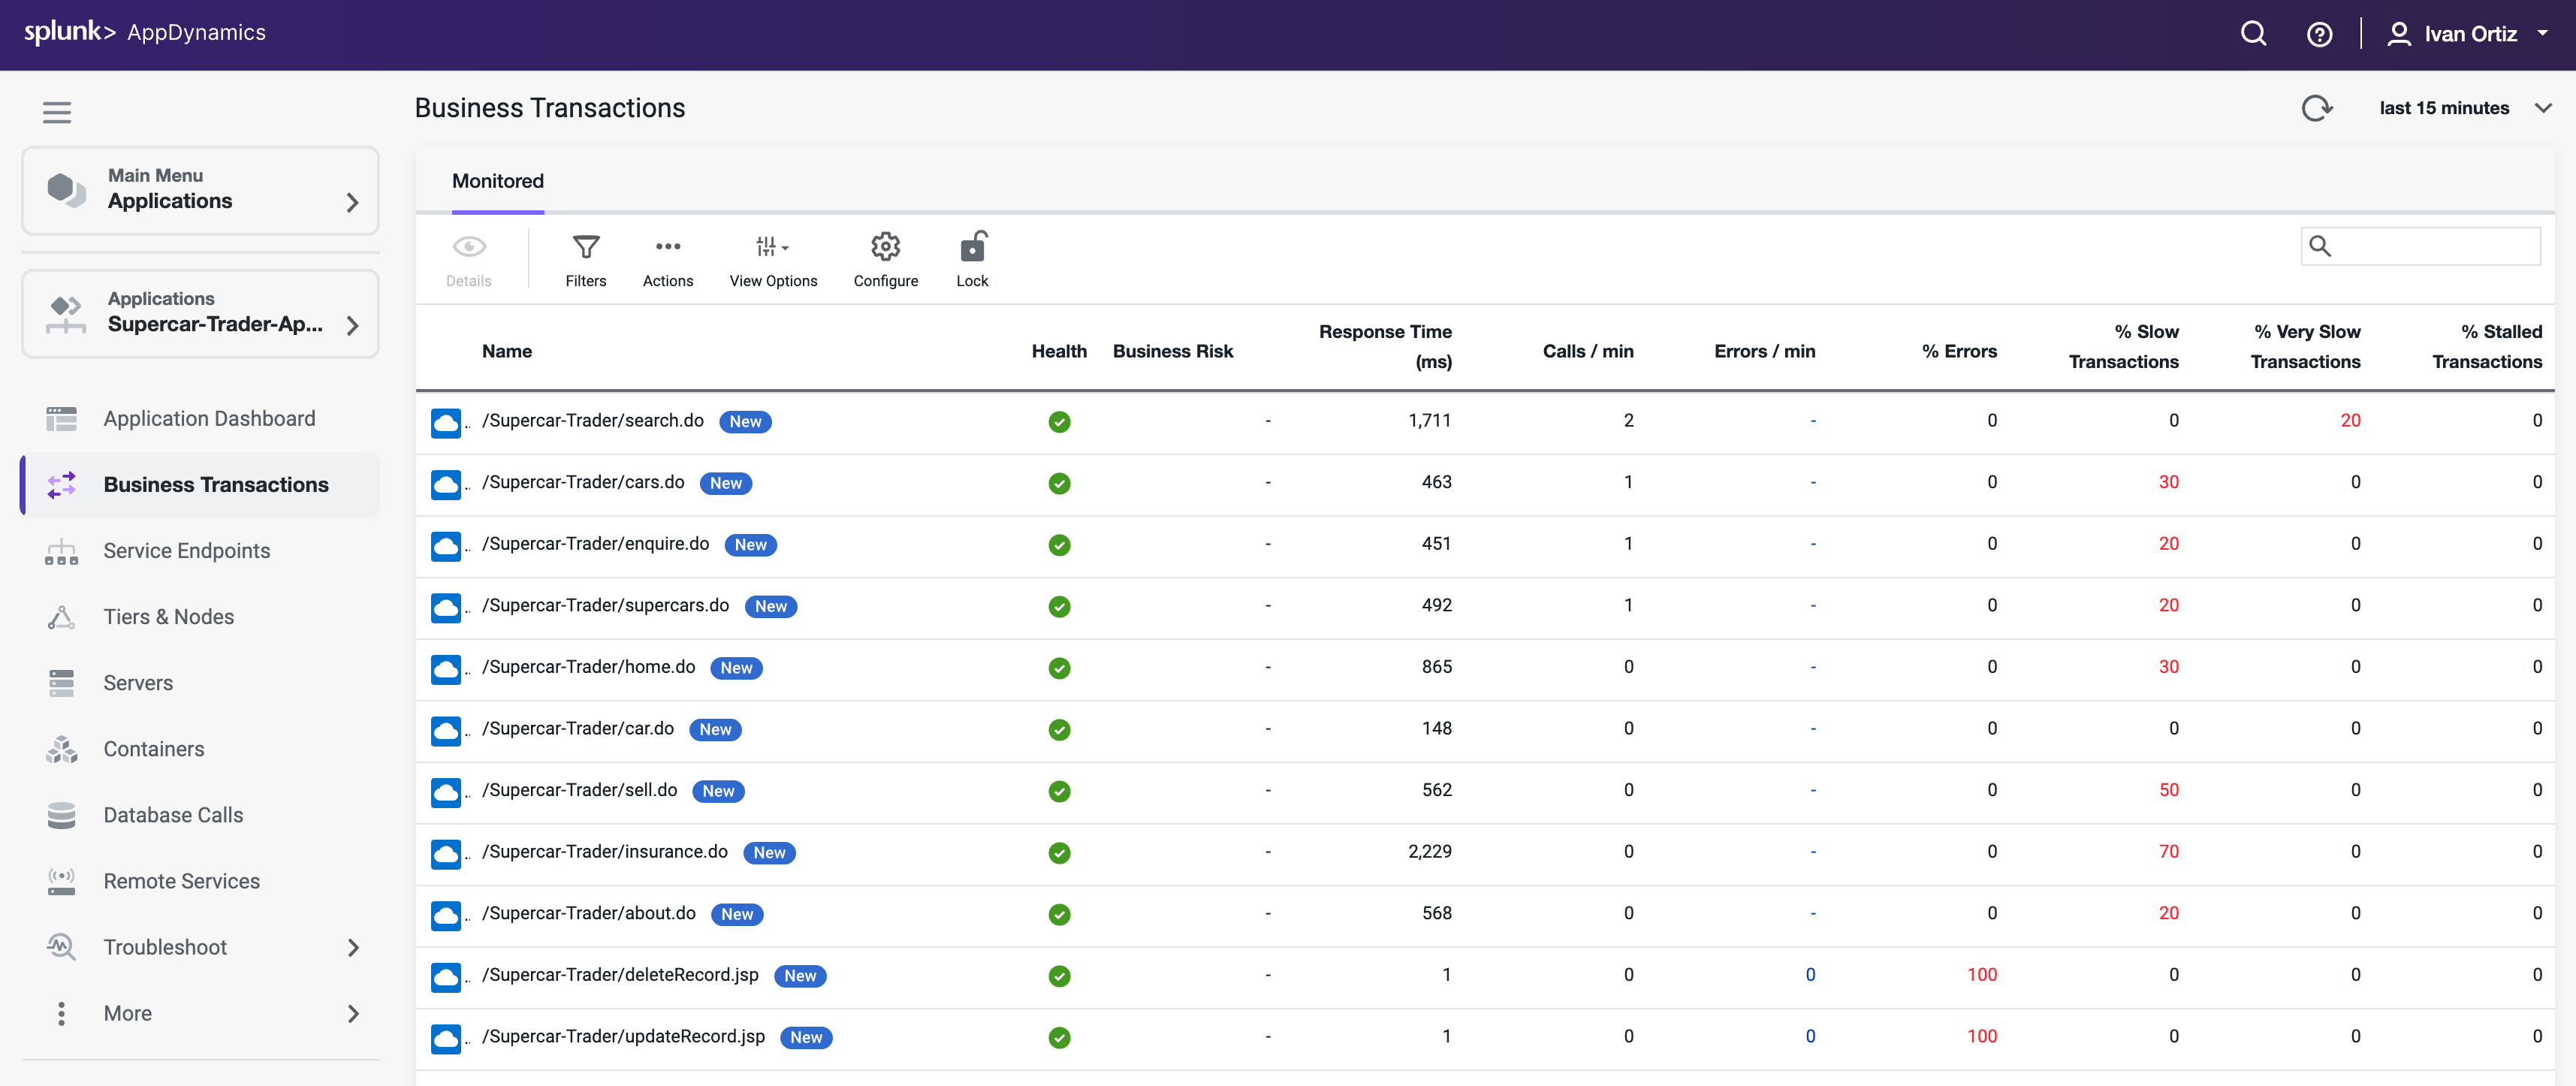
It may take up to 30 minutes for the new business transactions to replace the prior transactions. The list of business transactions should look like the following example after the new transactions are detected.
Click on Business Transactions on the left menu.
Adjust your time range picker to look at the last 15 minutes
6. Troubleshooting Slow Transactions
In this exercise you will complete the following tasks:
Monitor the application dashboard and flow map.
Troubleshoot a slow transaction snapshot.
Monitor the application dashboard and flow map
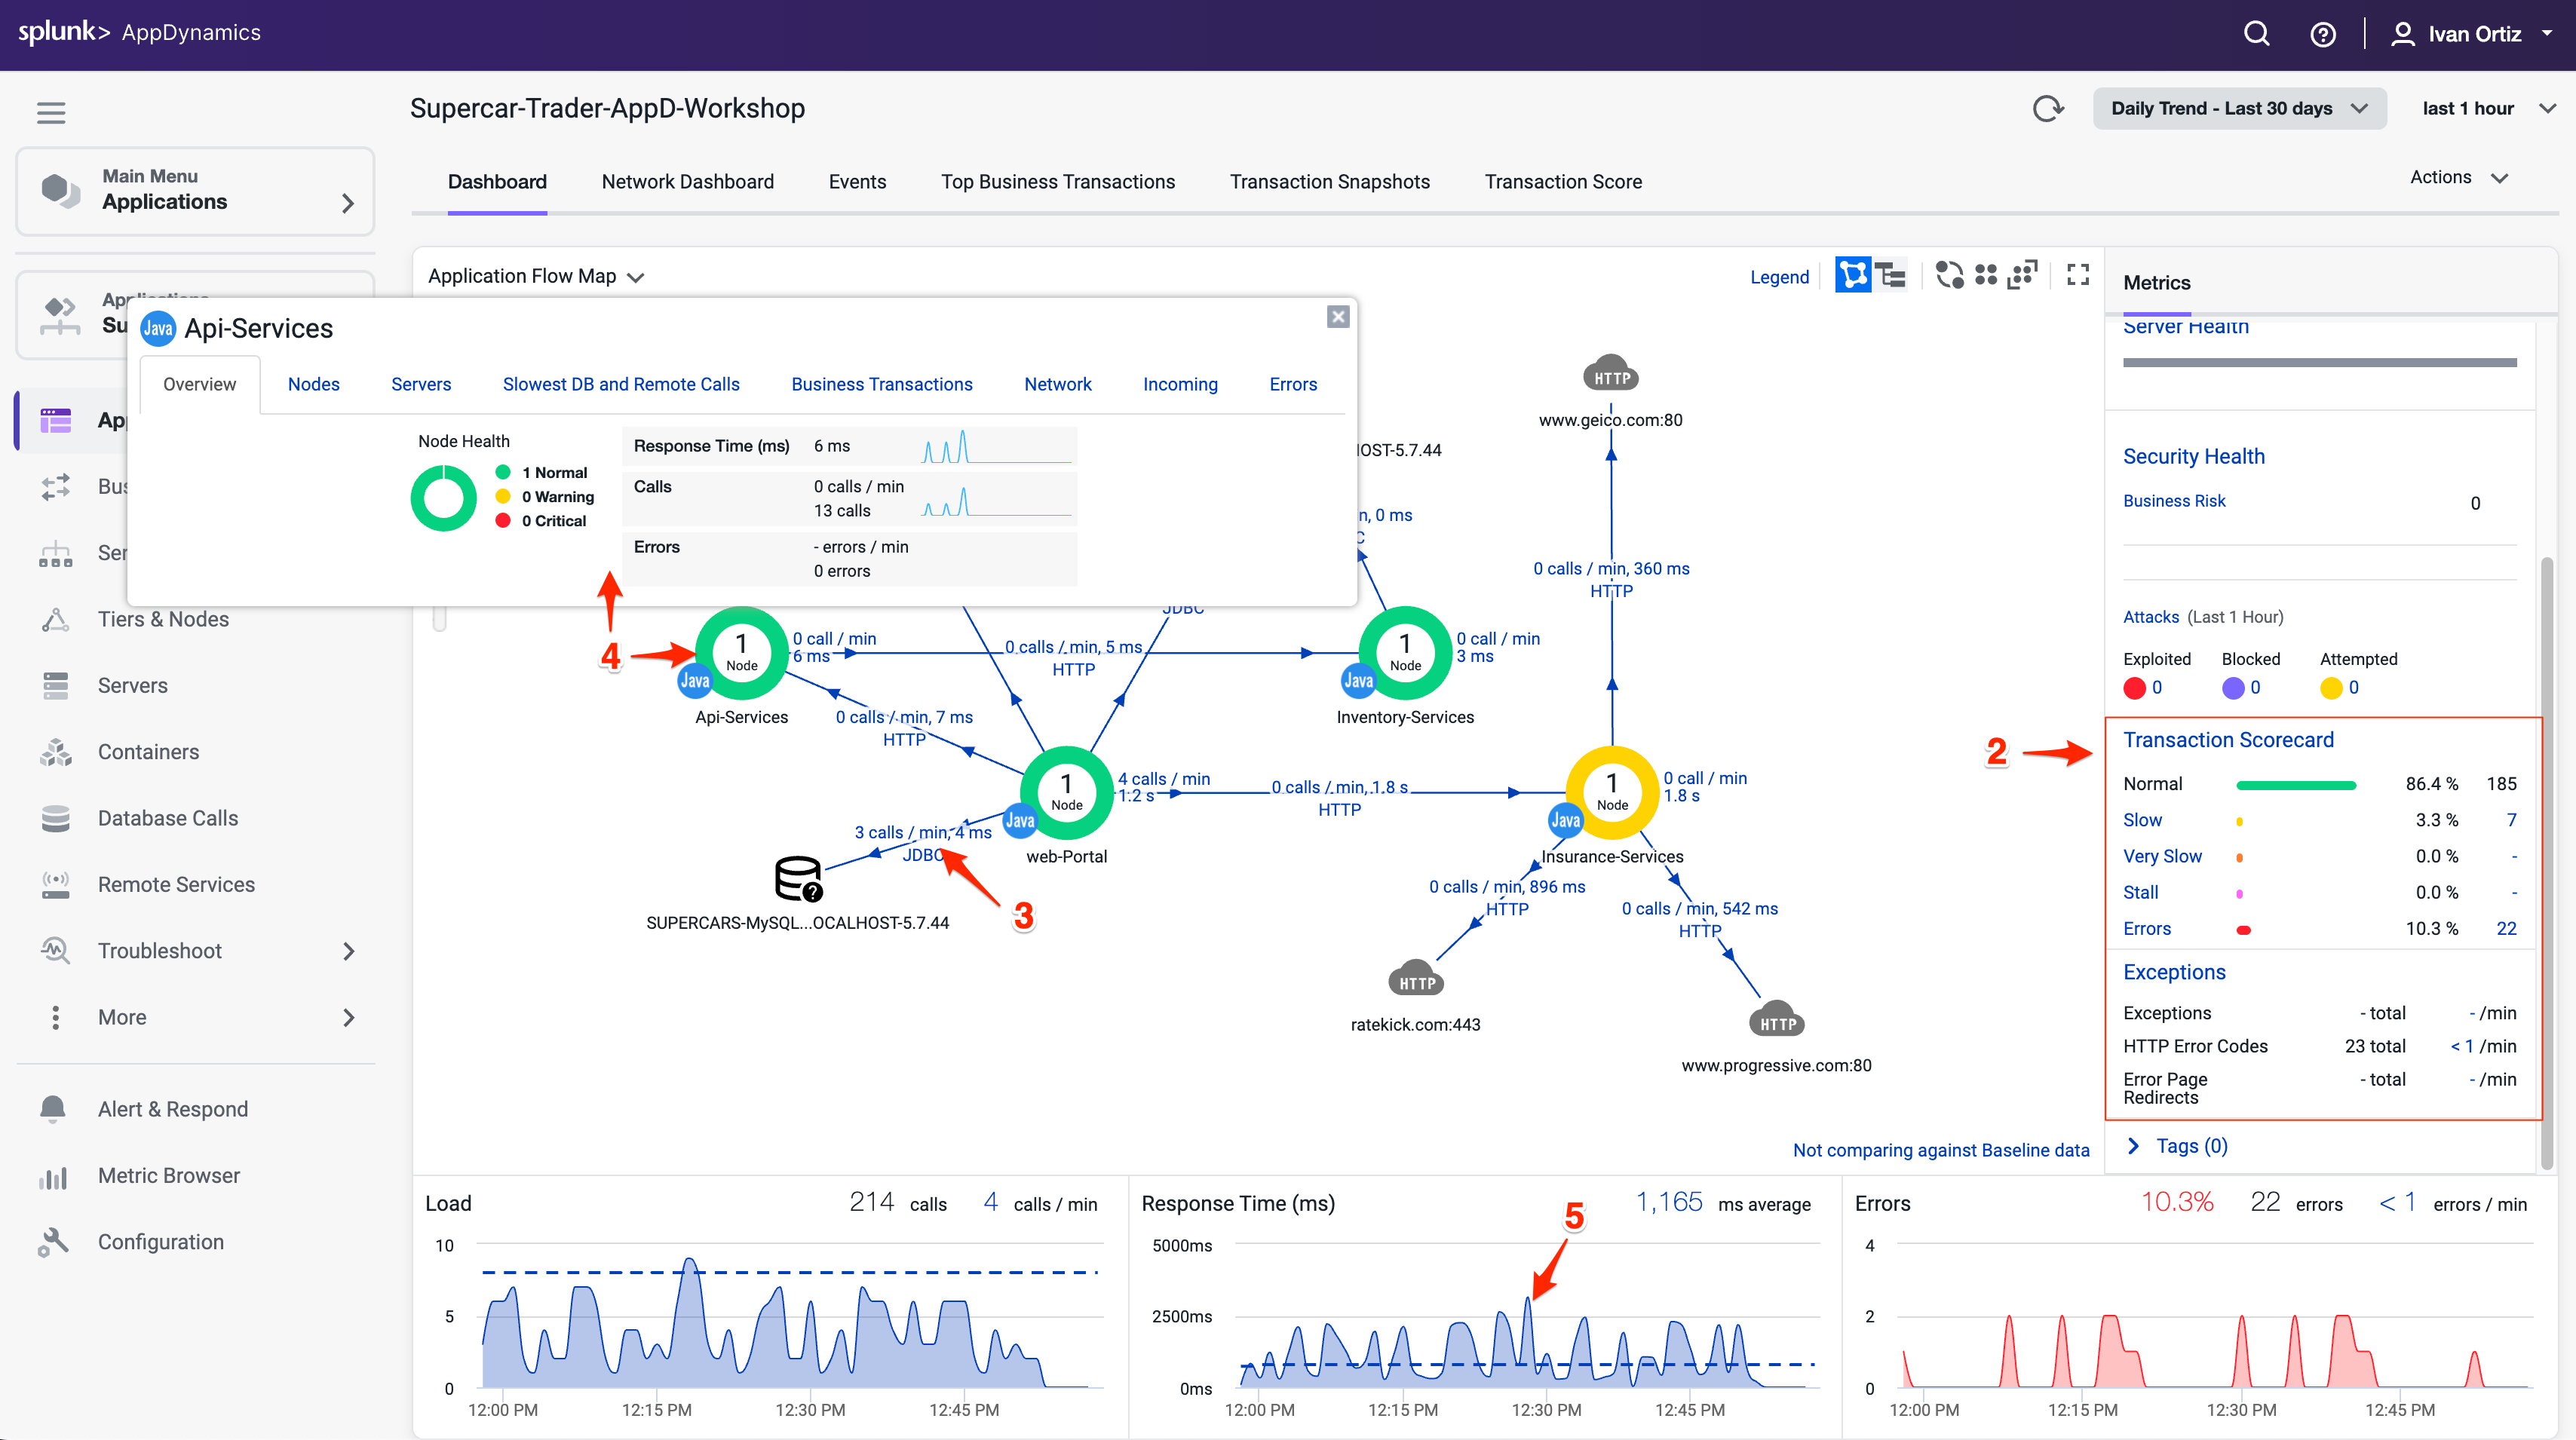
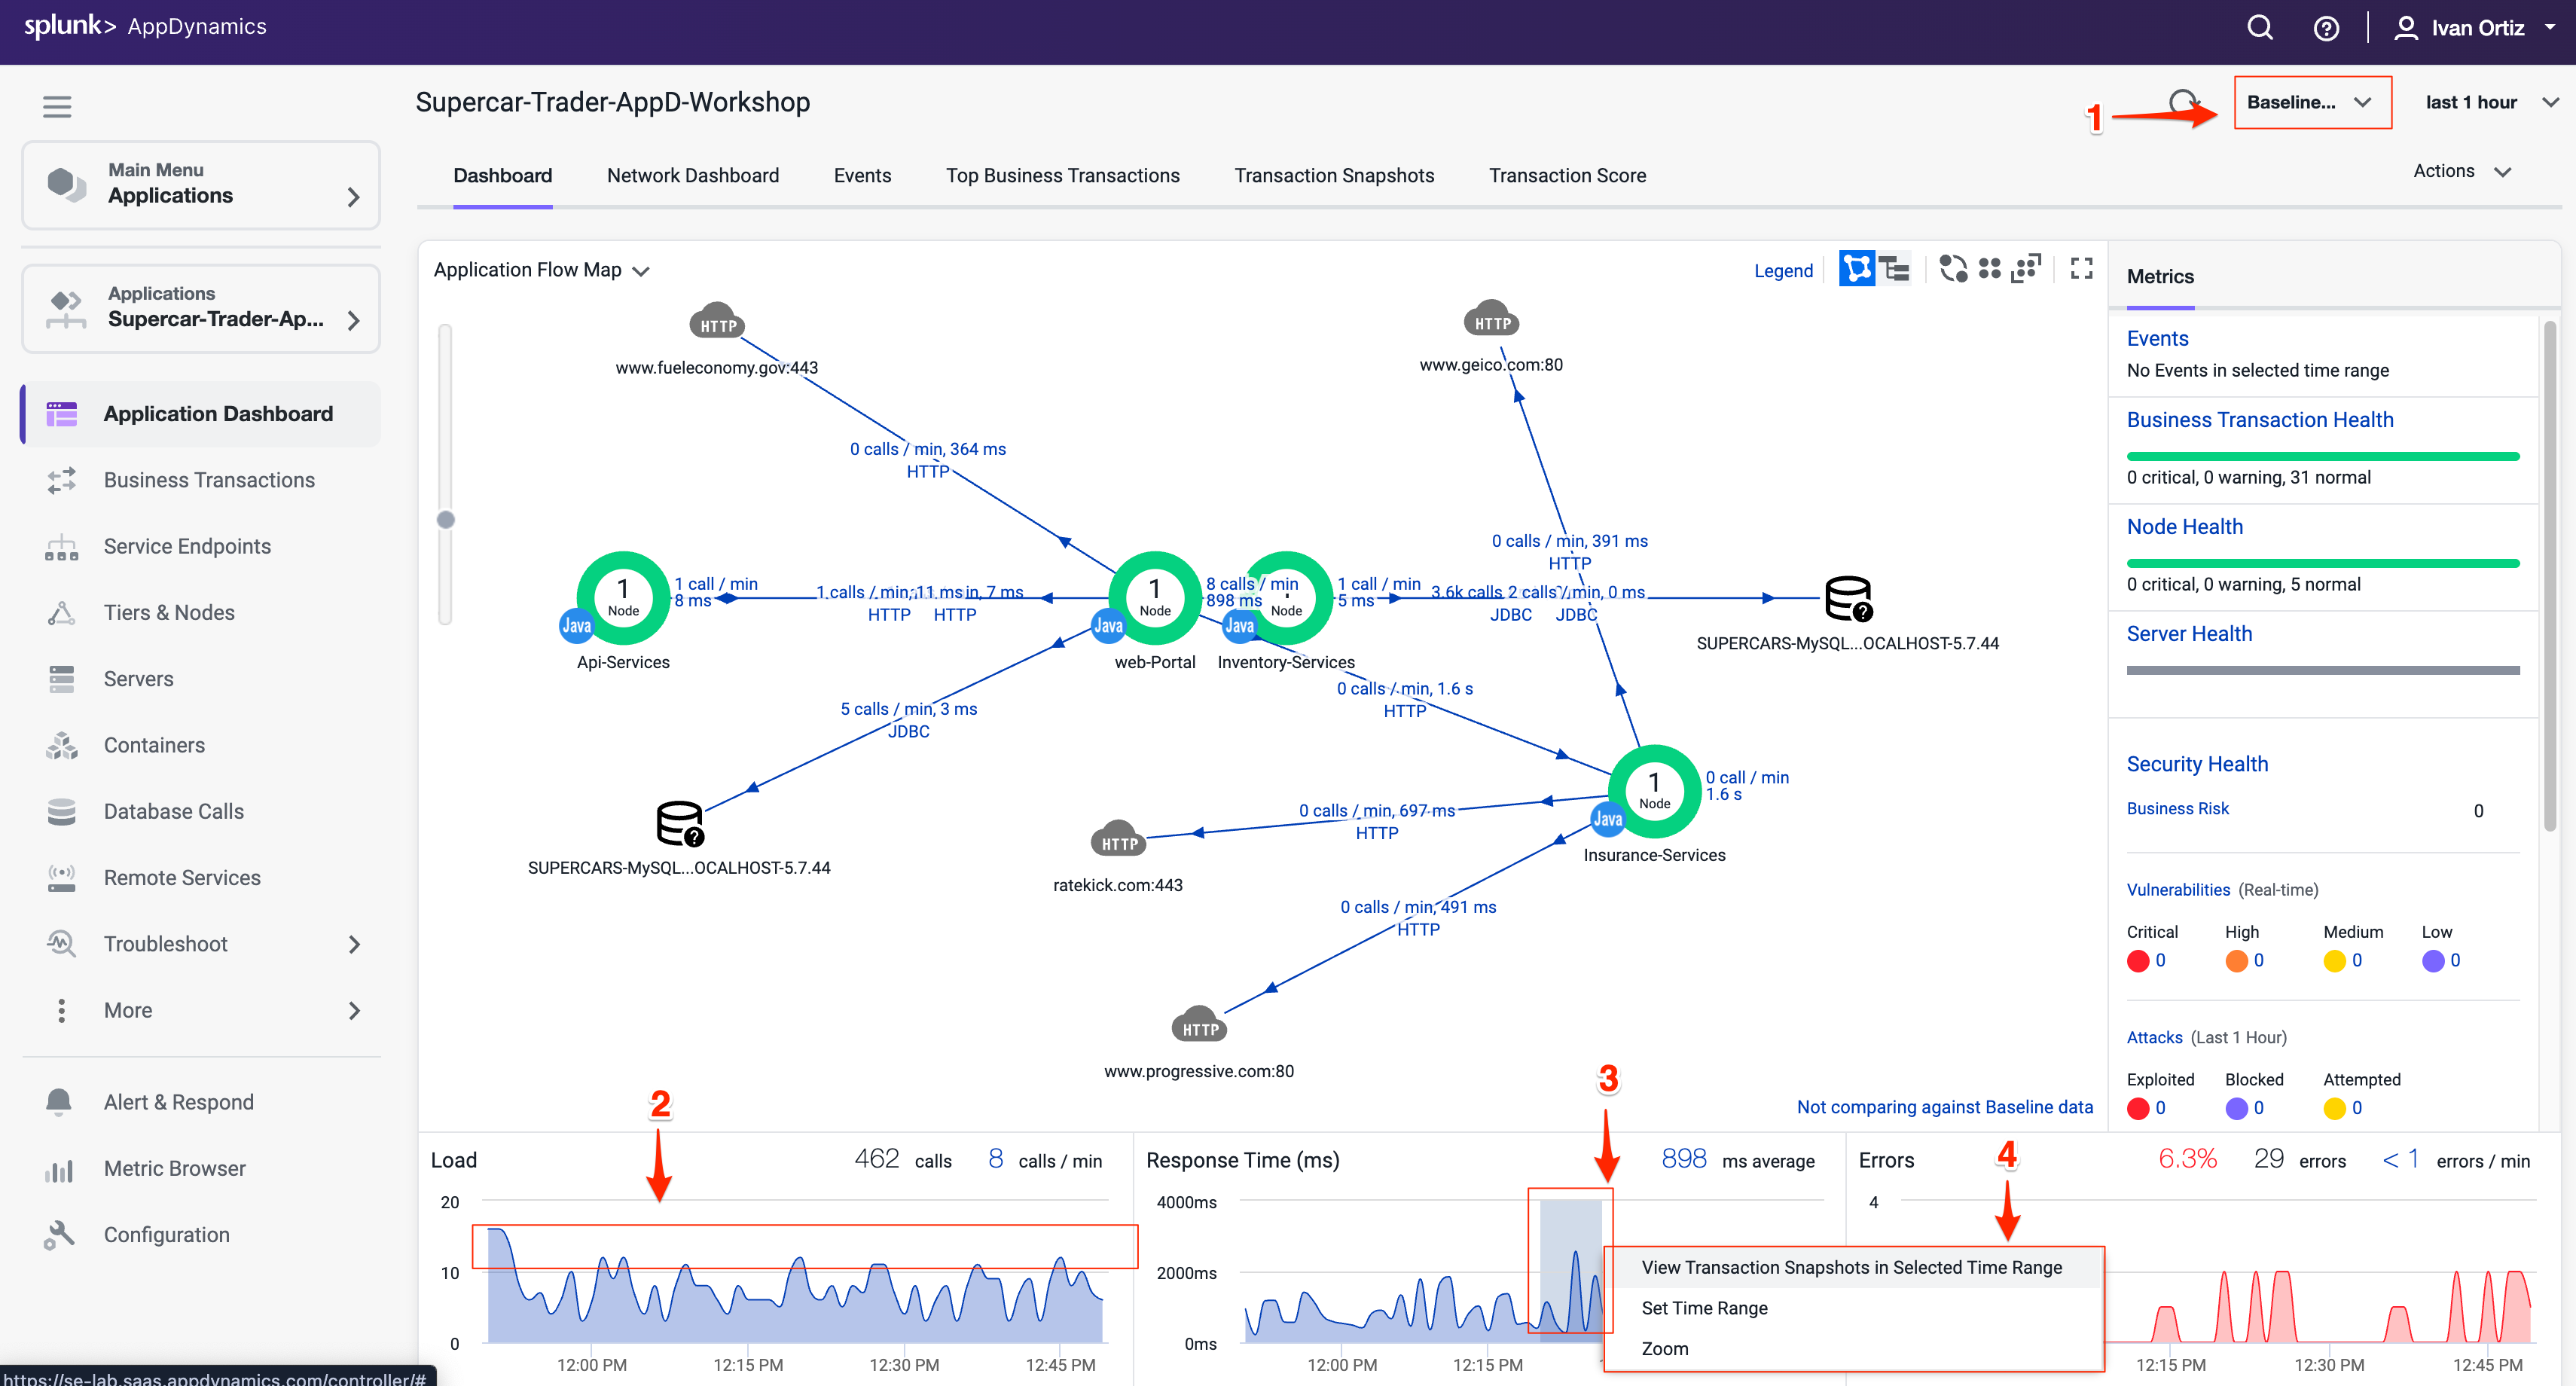
In the previous exercises we looked at some of the basic features of the Application Flow Map. Let’s take a deeper look at how we can use the Application Dashboard and Flow Map to immediately identify issues within the application.
Health Rule Violations, Node Health issues, and the health of the Business Transactions will always show up in this area for the time frame you have selected. You can click the links available here to drill down to the details.
The Transaction Scorecard shows you the number and percentage of transactions that are normal, slow, very slow, stalled, and have errors. The scorecard also gives you the high level categories of exception types. You can click the links available here to drill down to the details.
Left-click (single-click) on any of the blue lines connecting the different application components to bring up an overview of the interactions between the two components.
Left-click (single-click) within the colored ring of a Tier to bring up detailed information about that Tier while remaining on the Flow Map.
Hover over the time series on one of the three charts at the bottom of the dashboard (Load, Response Time, Errors) to see the detail of the recorded metrics.
Now let’s take look at Dynamics Baselines and options for the charts at the bottom of the dashboard.
Compare the metrics on the charts to the Dynamic Baseline that has been automatically calculated for each of the metrics.
The Dynamic Baseline is shown in the load and response time charts as the blue dotted line seen in the following image.
Left-click and hold down your mouse button while dragging from left to right to highlight a spike seen in any of the three charts at the bottom of the dashboard.
Release your mouse button and select one of the three options in the pop-up menu.
The precision of AppDynamics unique Dynamic Baselining increases over time to provide you with an accurate picture of the state of your applications, their components, and their business transactions, so you can be proactively alerted before things get to a critical state and take action before your end users are impacted.
You can read more about AppDynamics Dynamic Baselines here.
Troubleshoot a slow transaction snapshot
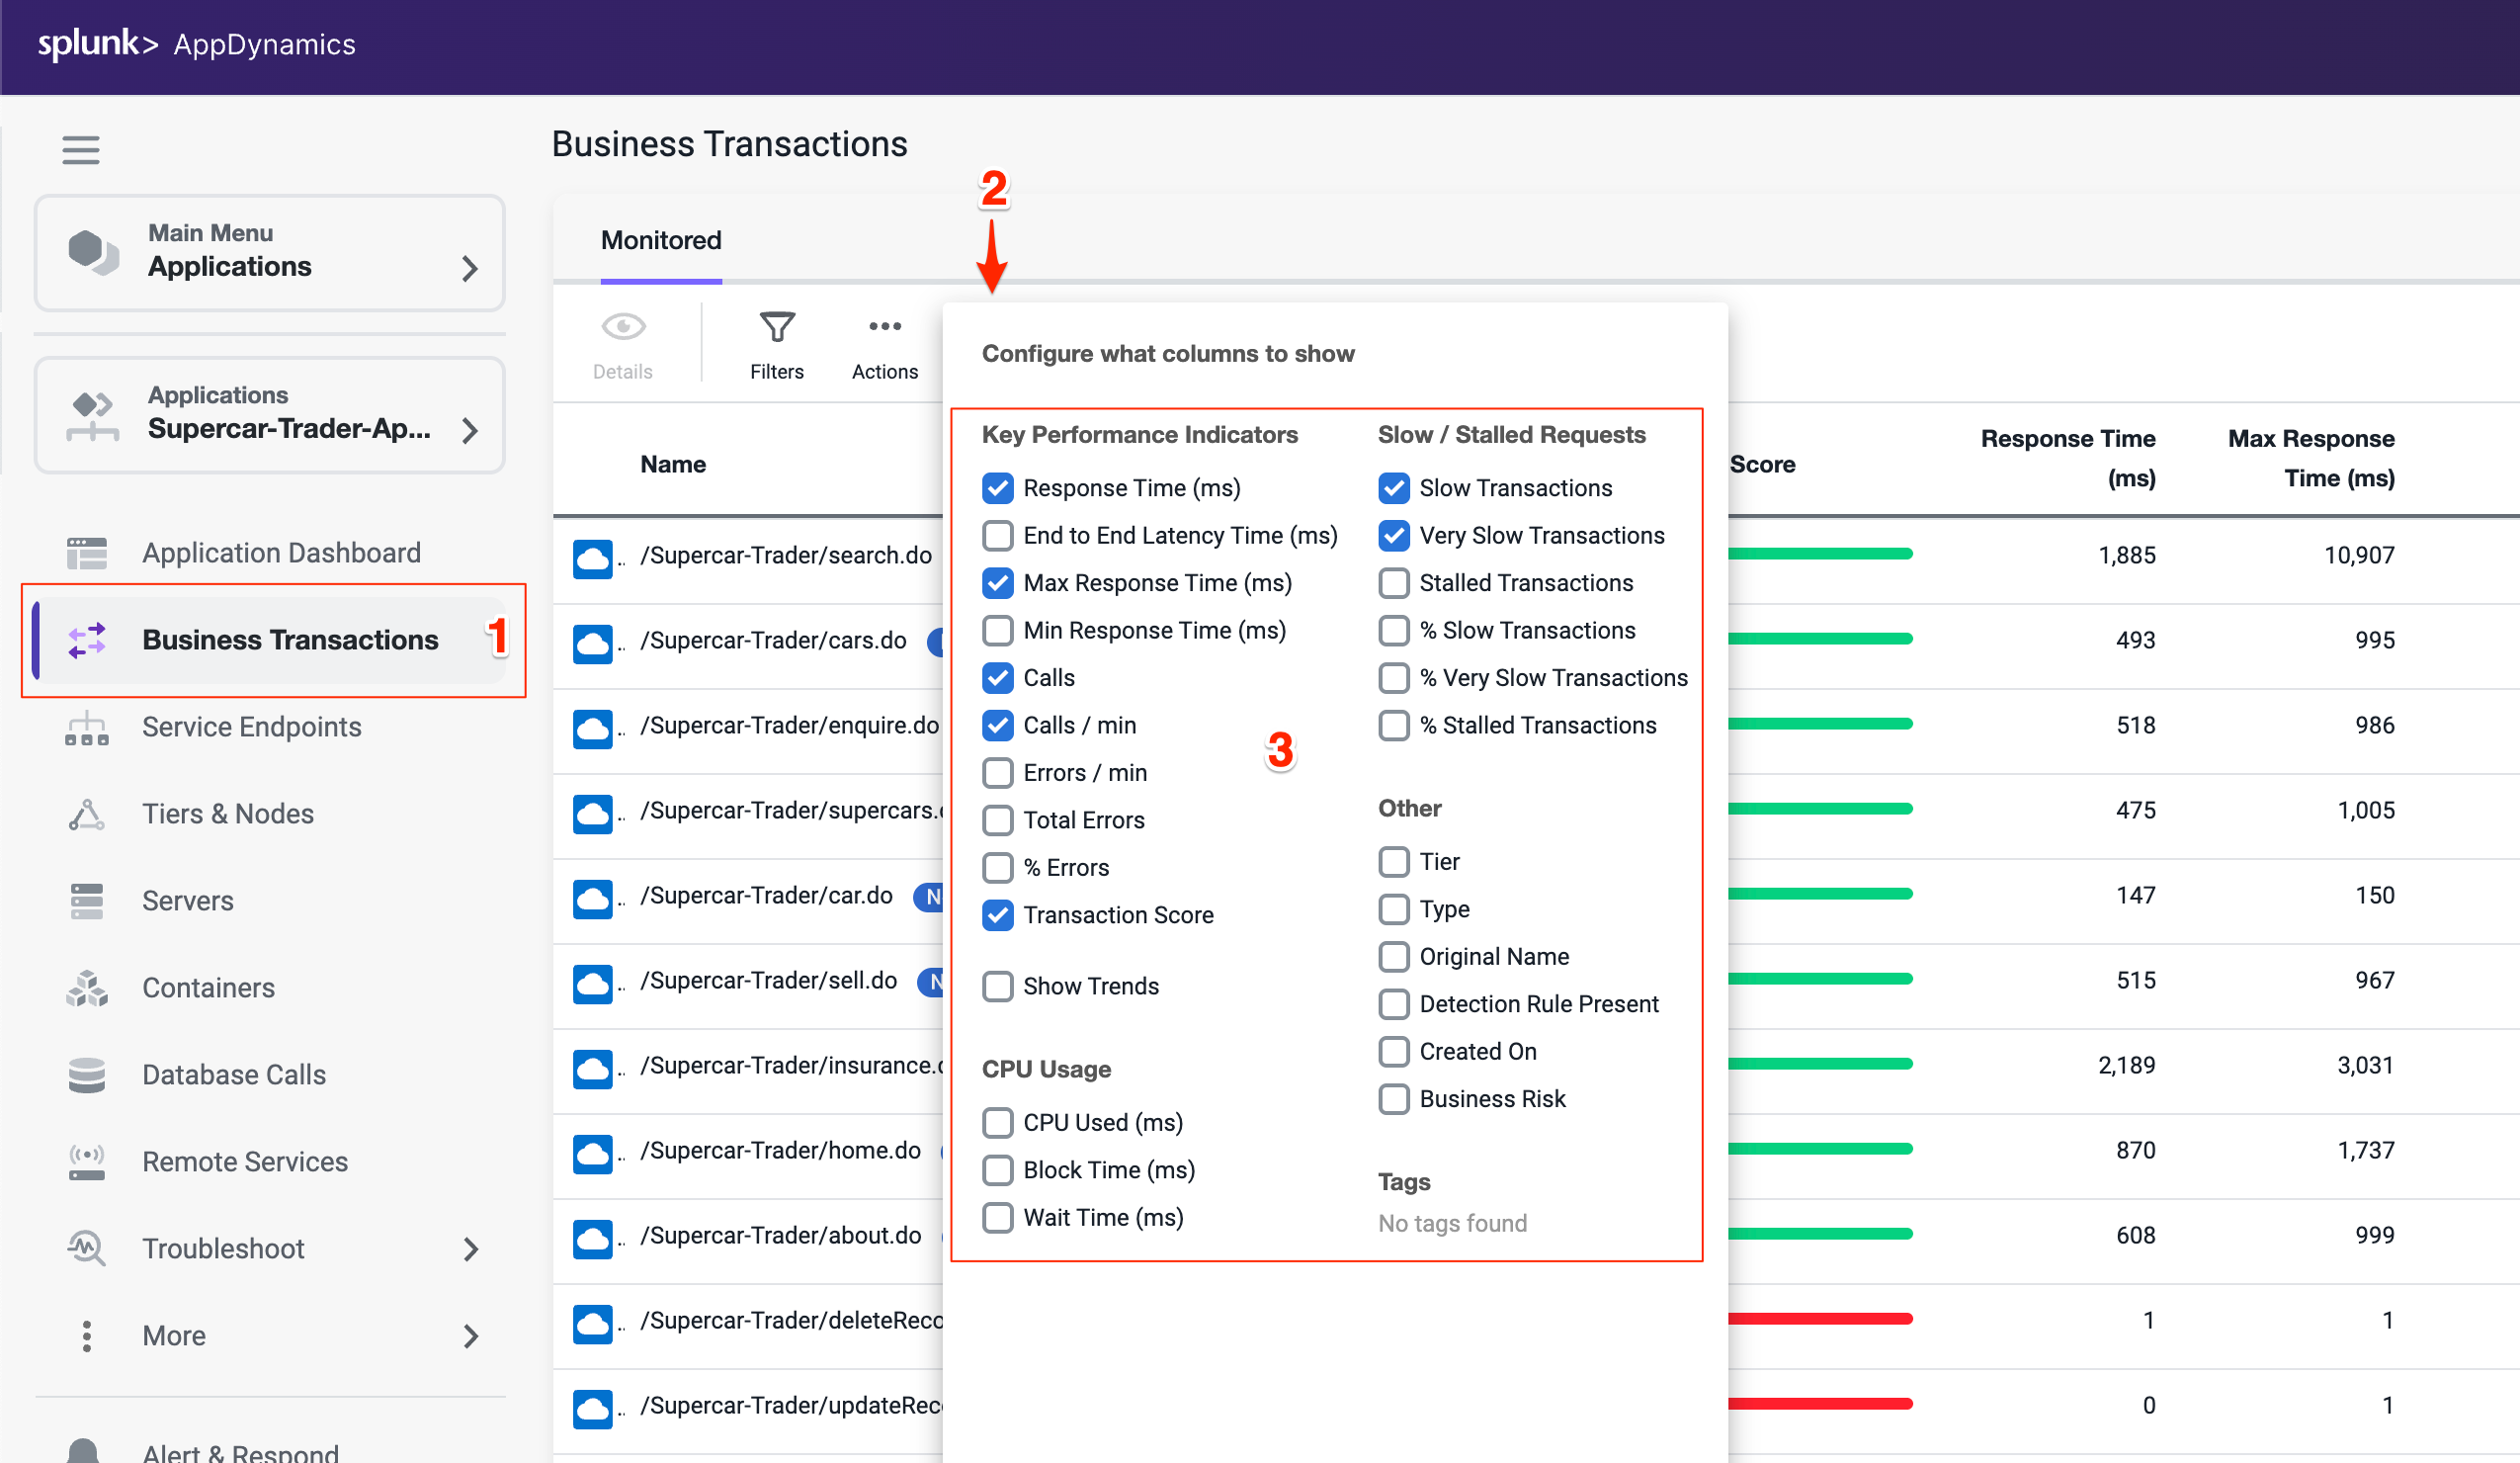
Let’s look at our business transactions and find the one that has the highest number of very slow transactions by following these steps.
Click the Business Transactions option on the left menu.
Click the View Options button.
Check and uncheck the boxes on the options to match what you see in the following image:
Find the Business Transaction named /Supercar-Trader/car.do and drill into the very slow transaction snapshots by clicking on the number of Very Slow Transactions for the business transaction.
Tip
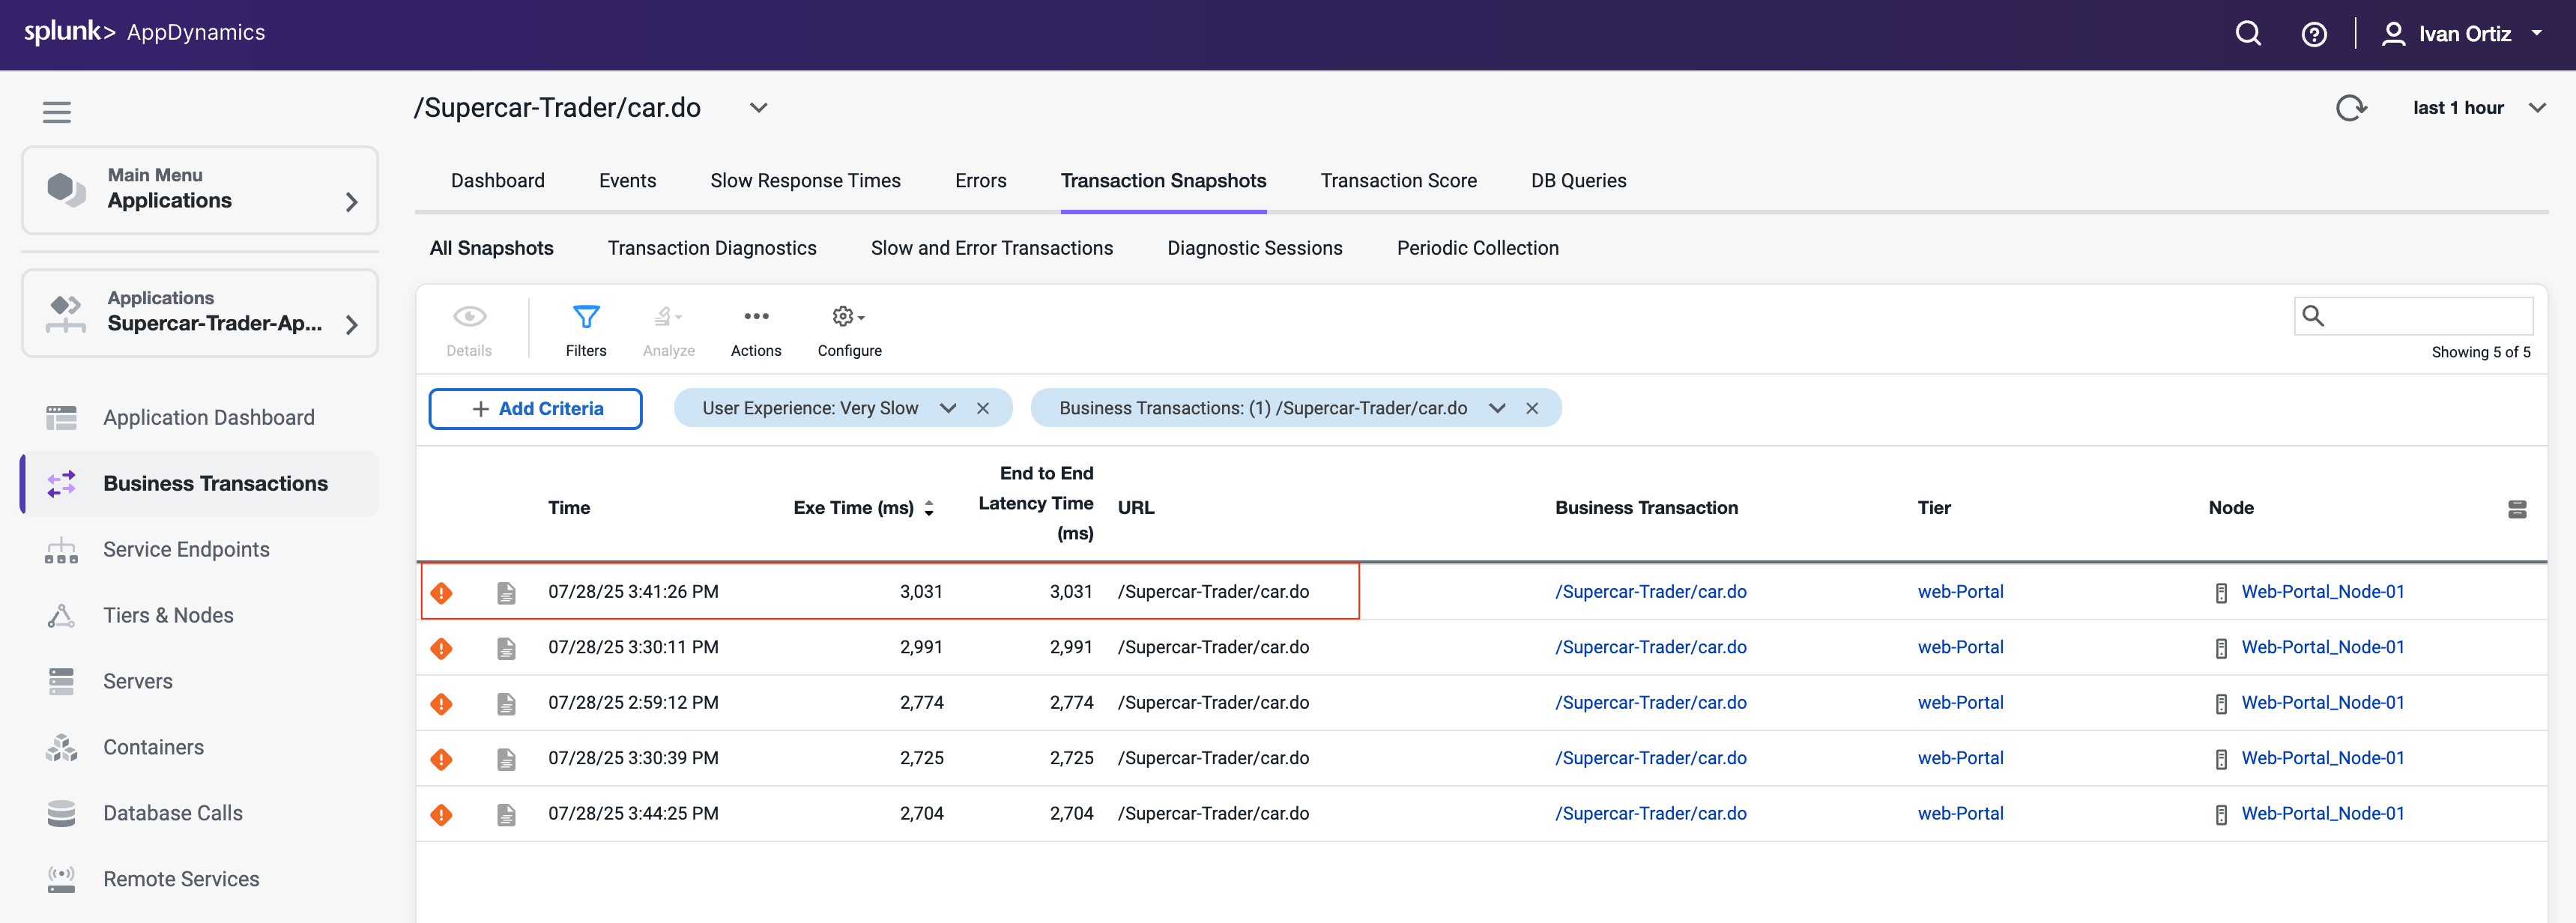
If the /Supercar-Trader/car.do BT does not have any Very Slow Transactions, find a Business Transaction which has some and click in the number under that column. The screenshots may look slightly different moving forward but the concepts remain the same.
You should see the list of very slow transaction snapshots. Double-click on the snapshot that has the highest response time as seen below.
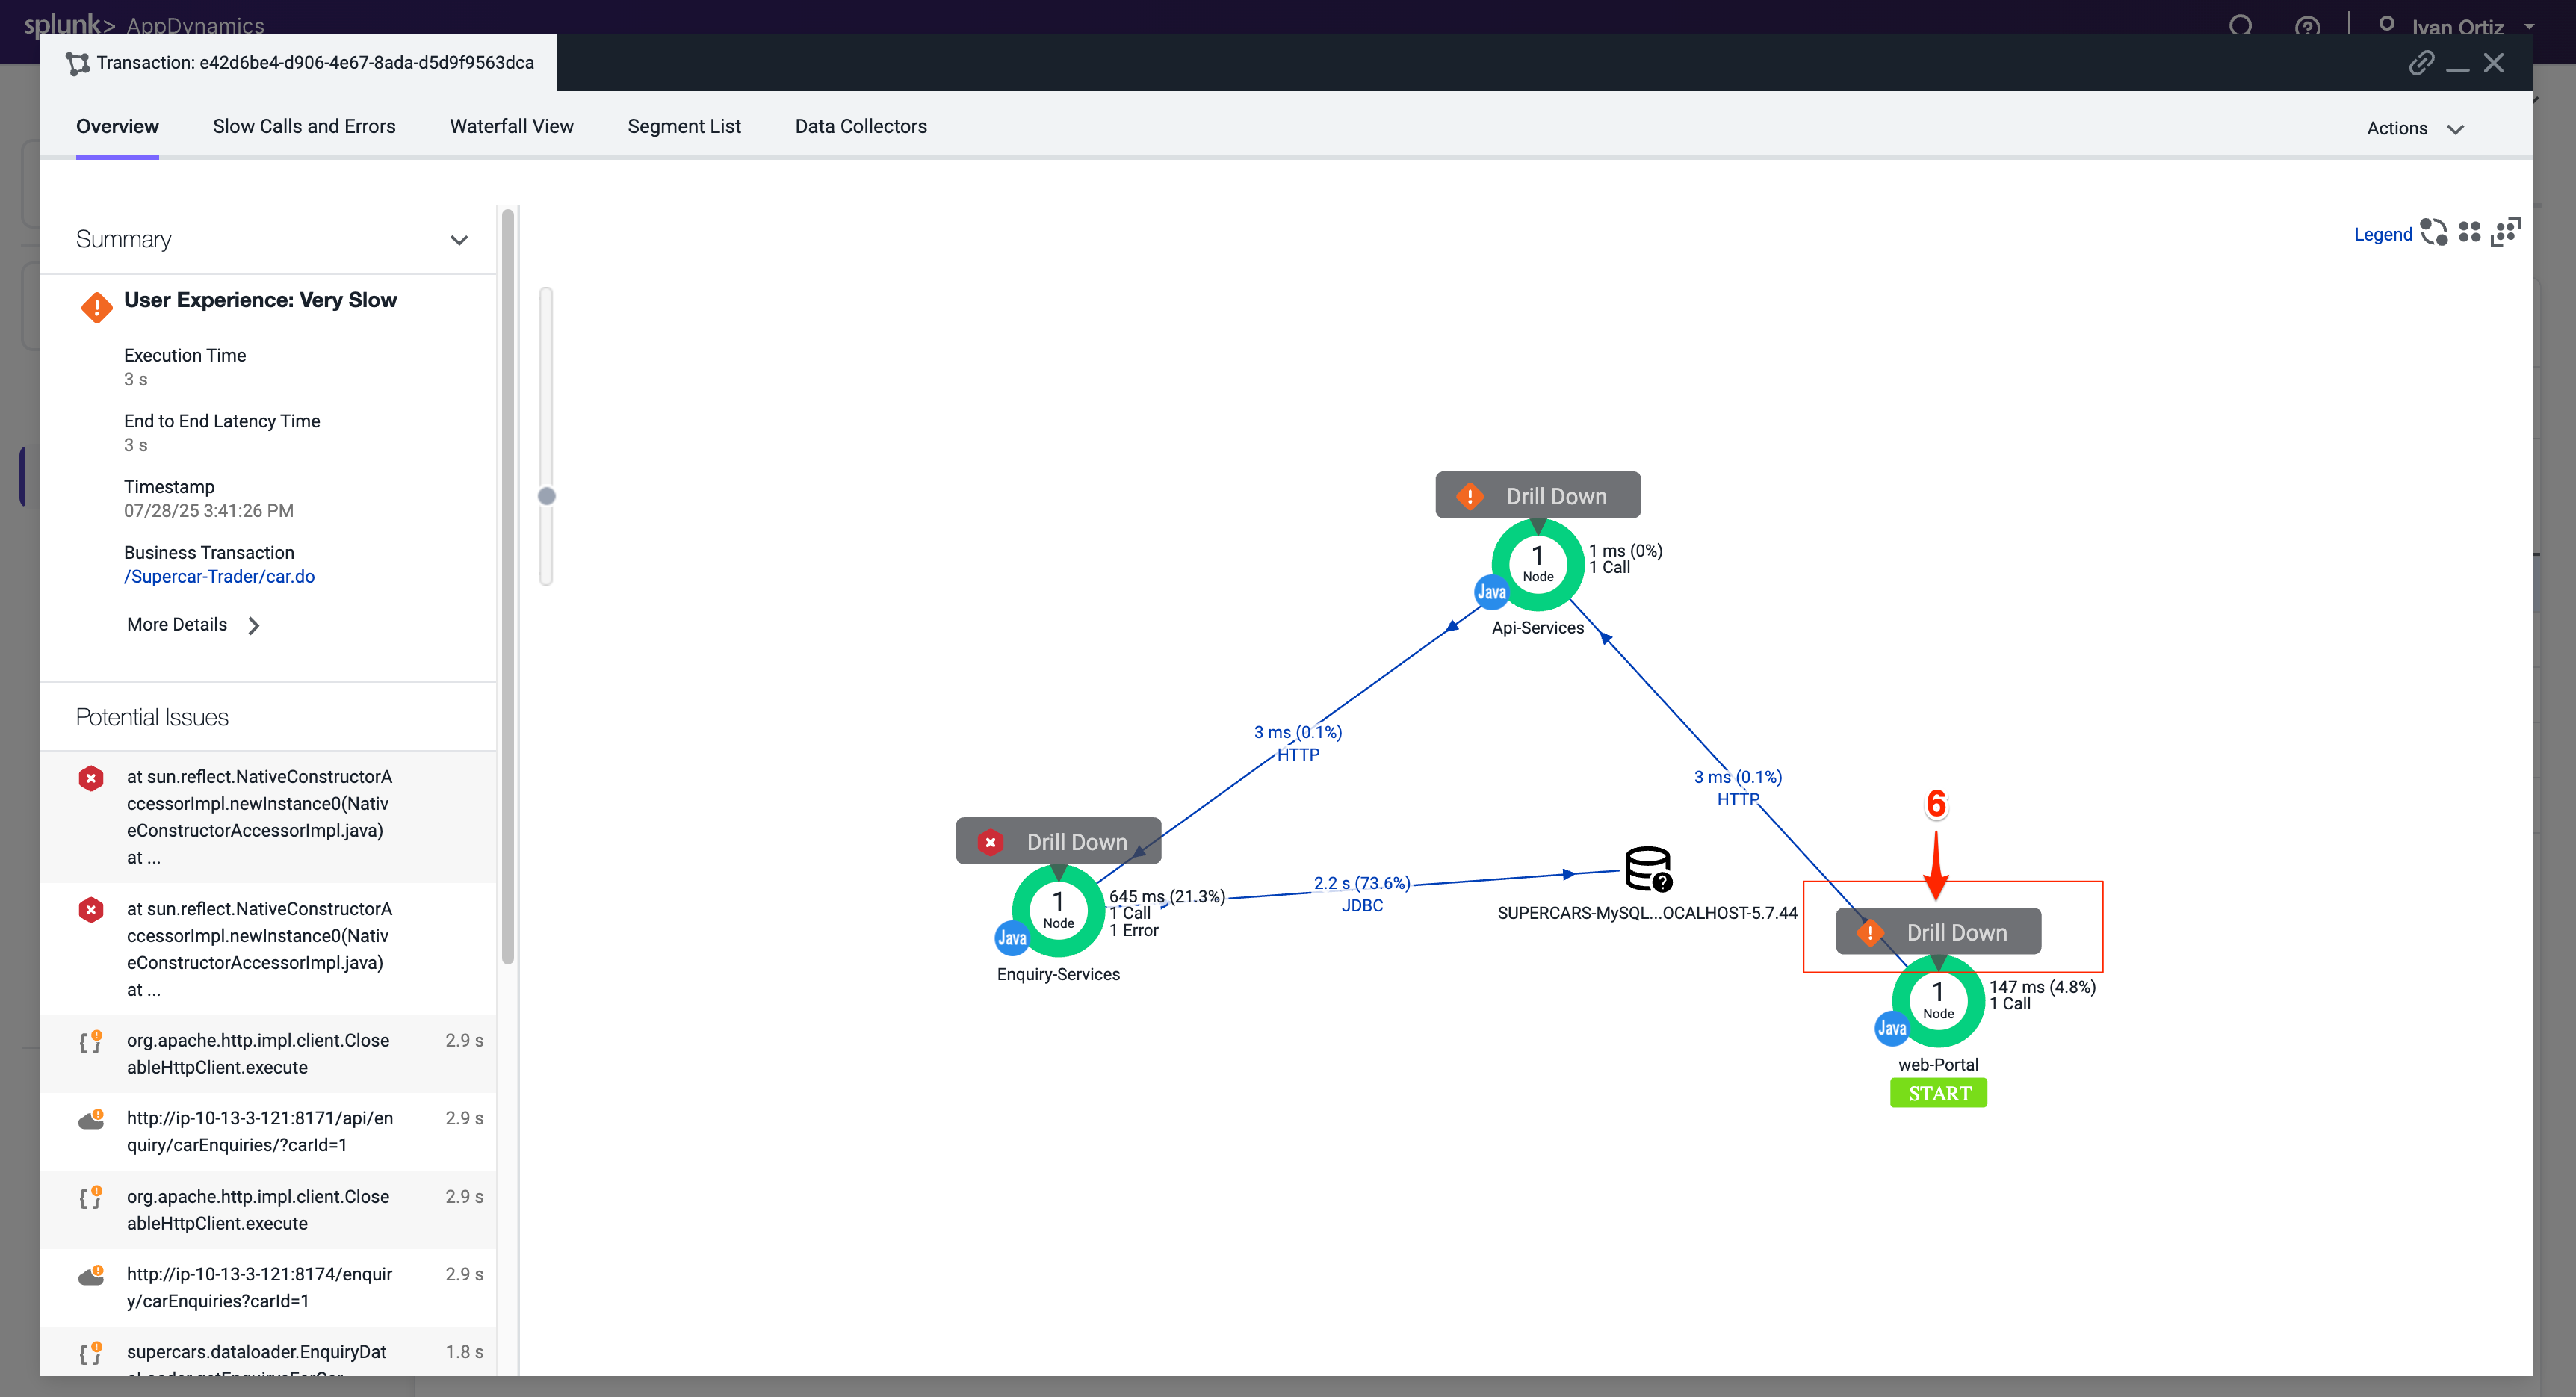
When the transaction snapshot viewer opens, we see the flow map view of all the components that were part of this specific transaction. This snapshot shows the transaction traversed through the components below in order.
The Web-Portal Tier.
The Api-Services Tier.
The Enquiry-Services Tier.
The MySQL Database.
The Potential Issues panel on the left highlights slow methods and slow remote services. While we can use the Potential Issues panel to drill straight into the call graph, we will use the Flow Map within the snapshot to follow the complete transaction in this example.
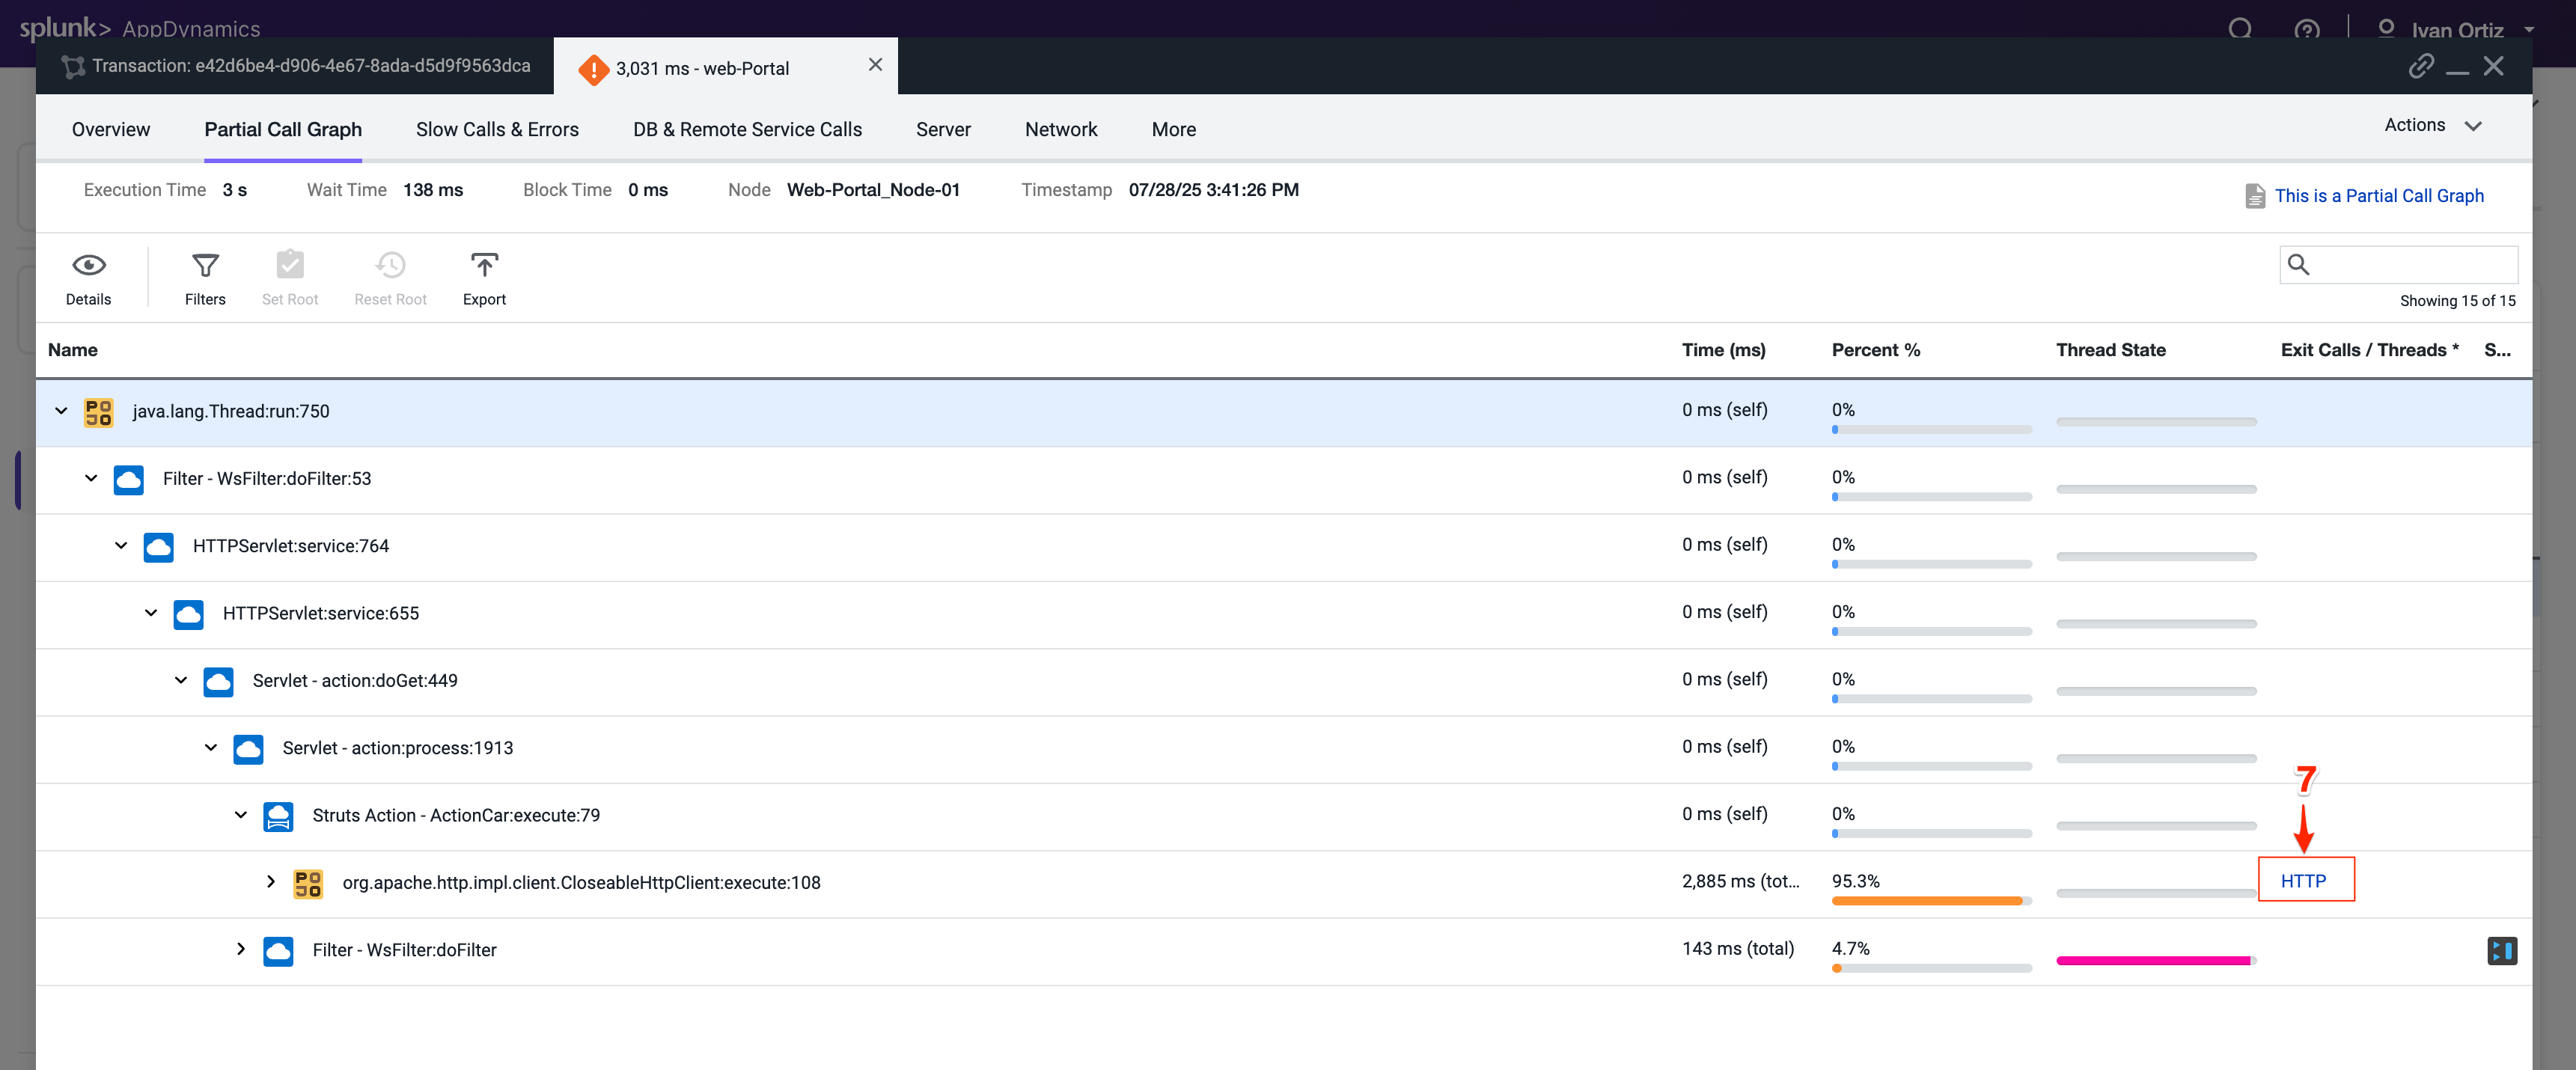
Click on Drill Down on the Web-Portal Tier shown on the Flow Map of the snapshot.
The tab that opens shows the call graph of the Web-Portal Tier. We can see that most of the time was from an outbound HTTP call.
Click on the block to drill down to the segment where the issue happening. Click the HTTP link to the details of the downstream call.
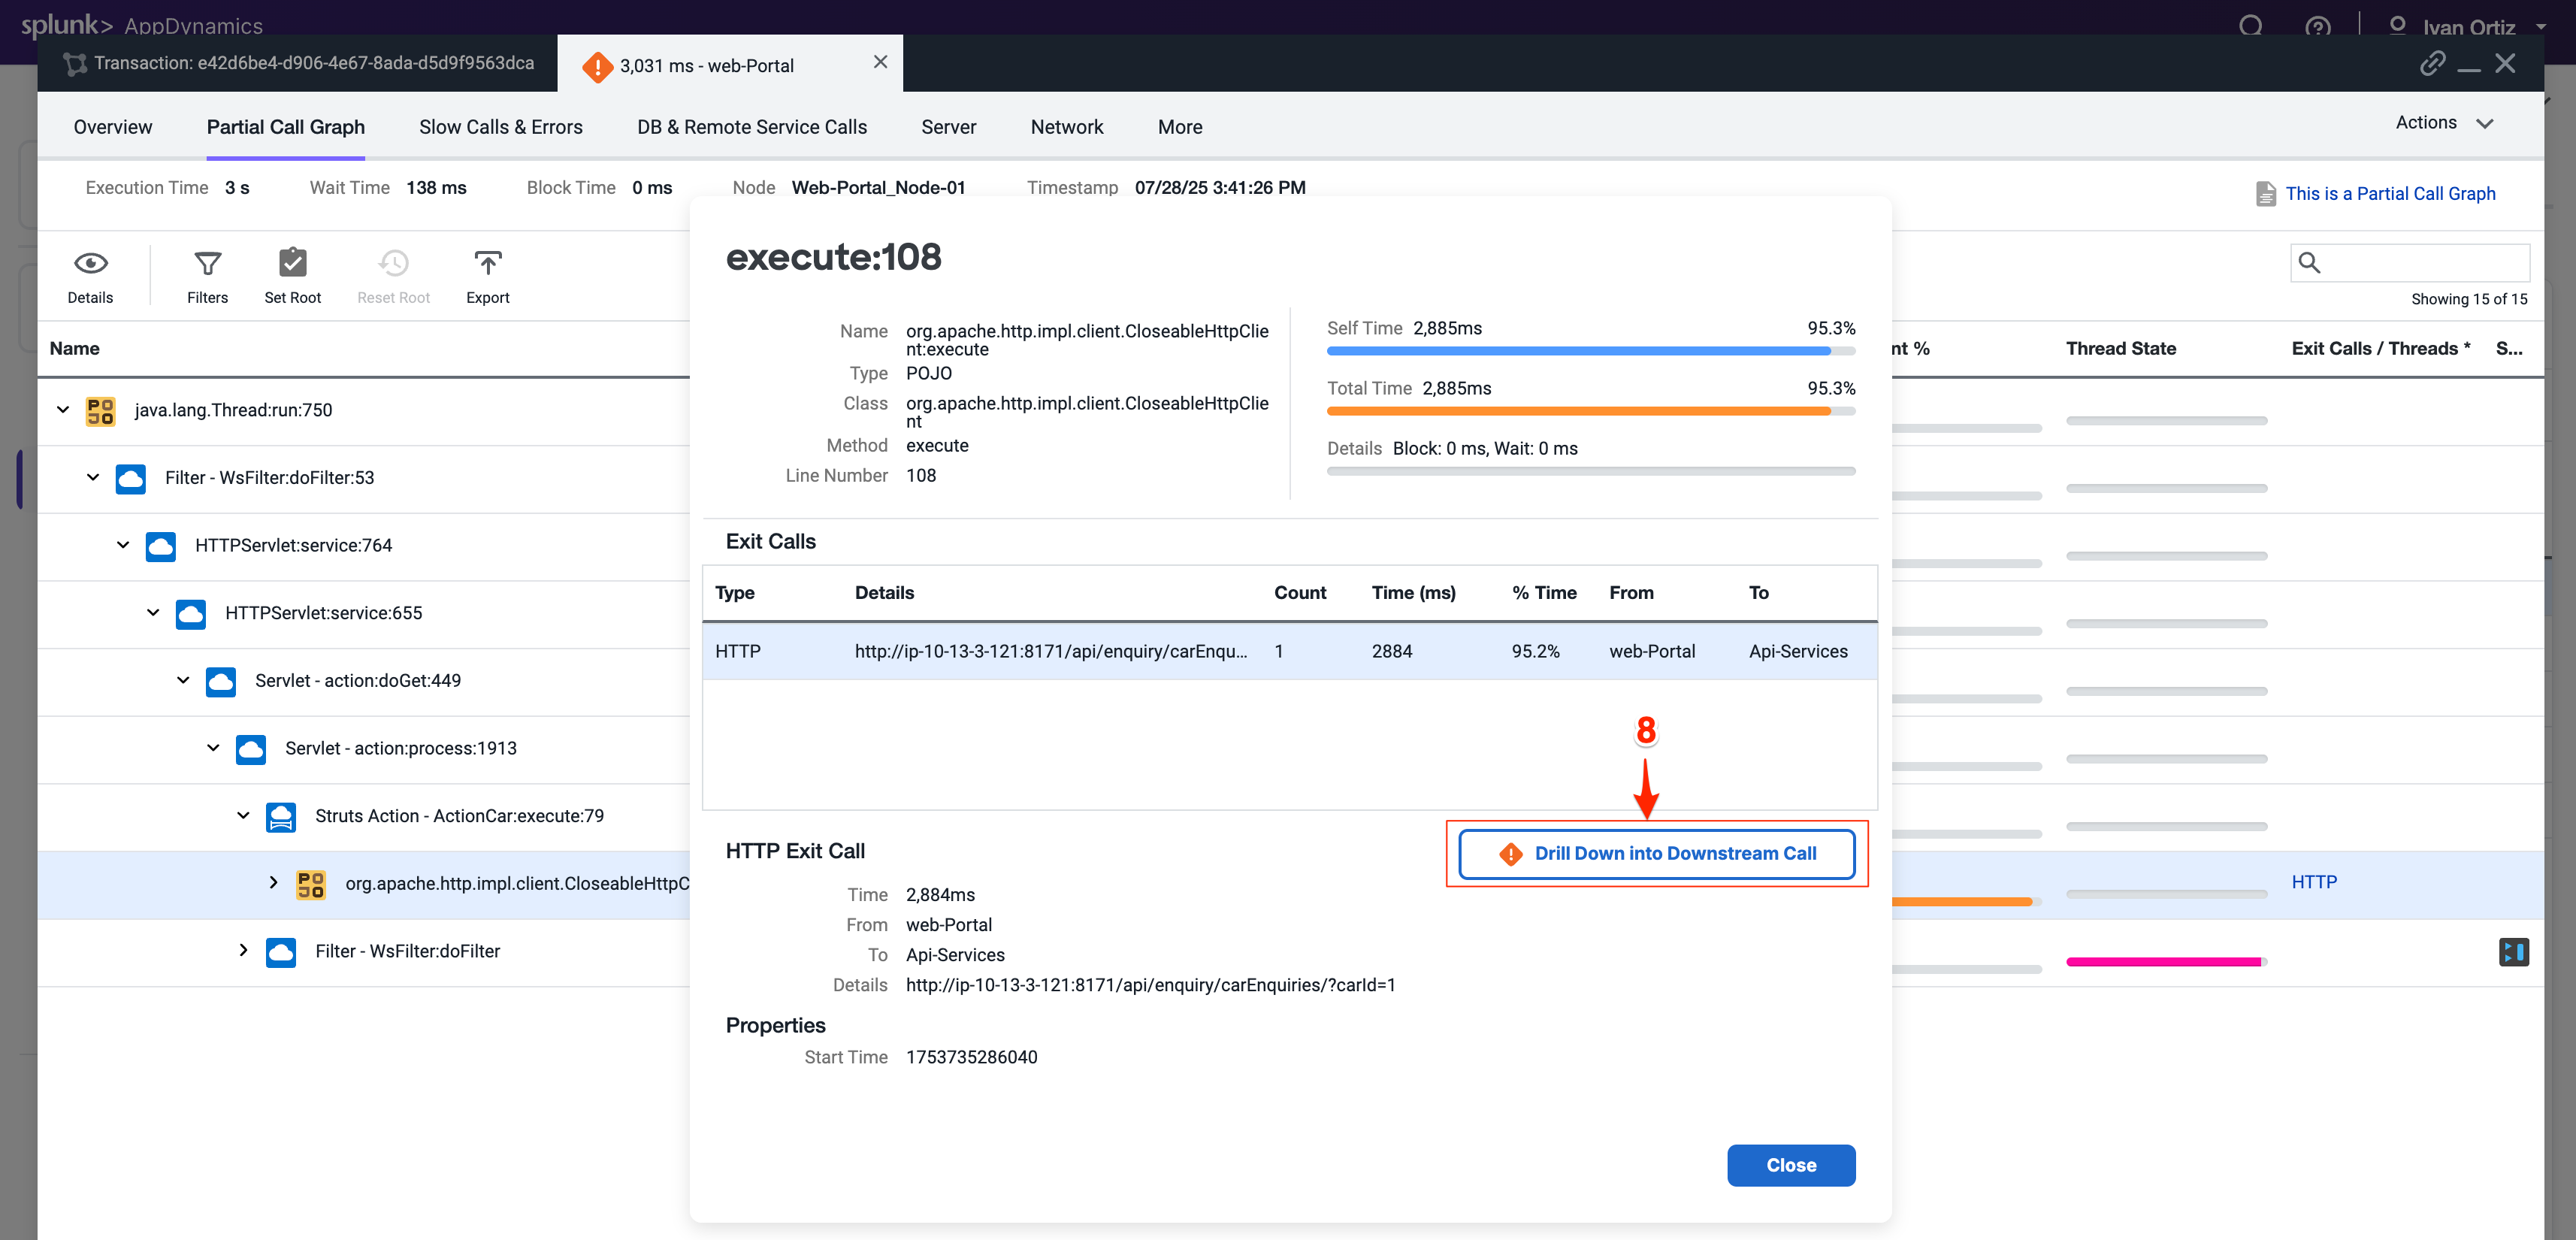
The detail panel for the downstream call shows that the Web-Portal Tier made an outbound HTTP call to the Api-Services Tier. Follow the HTTP call into the Api-Services Tier.
Click Drill Down into Downstream Call.
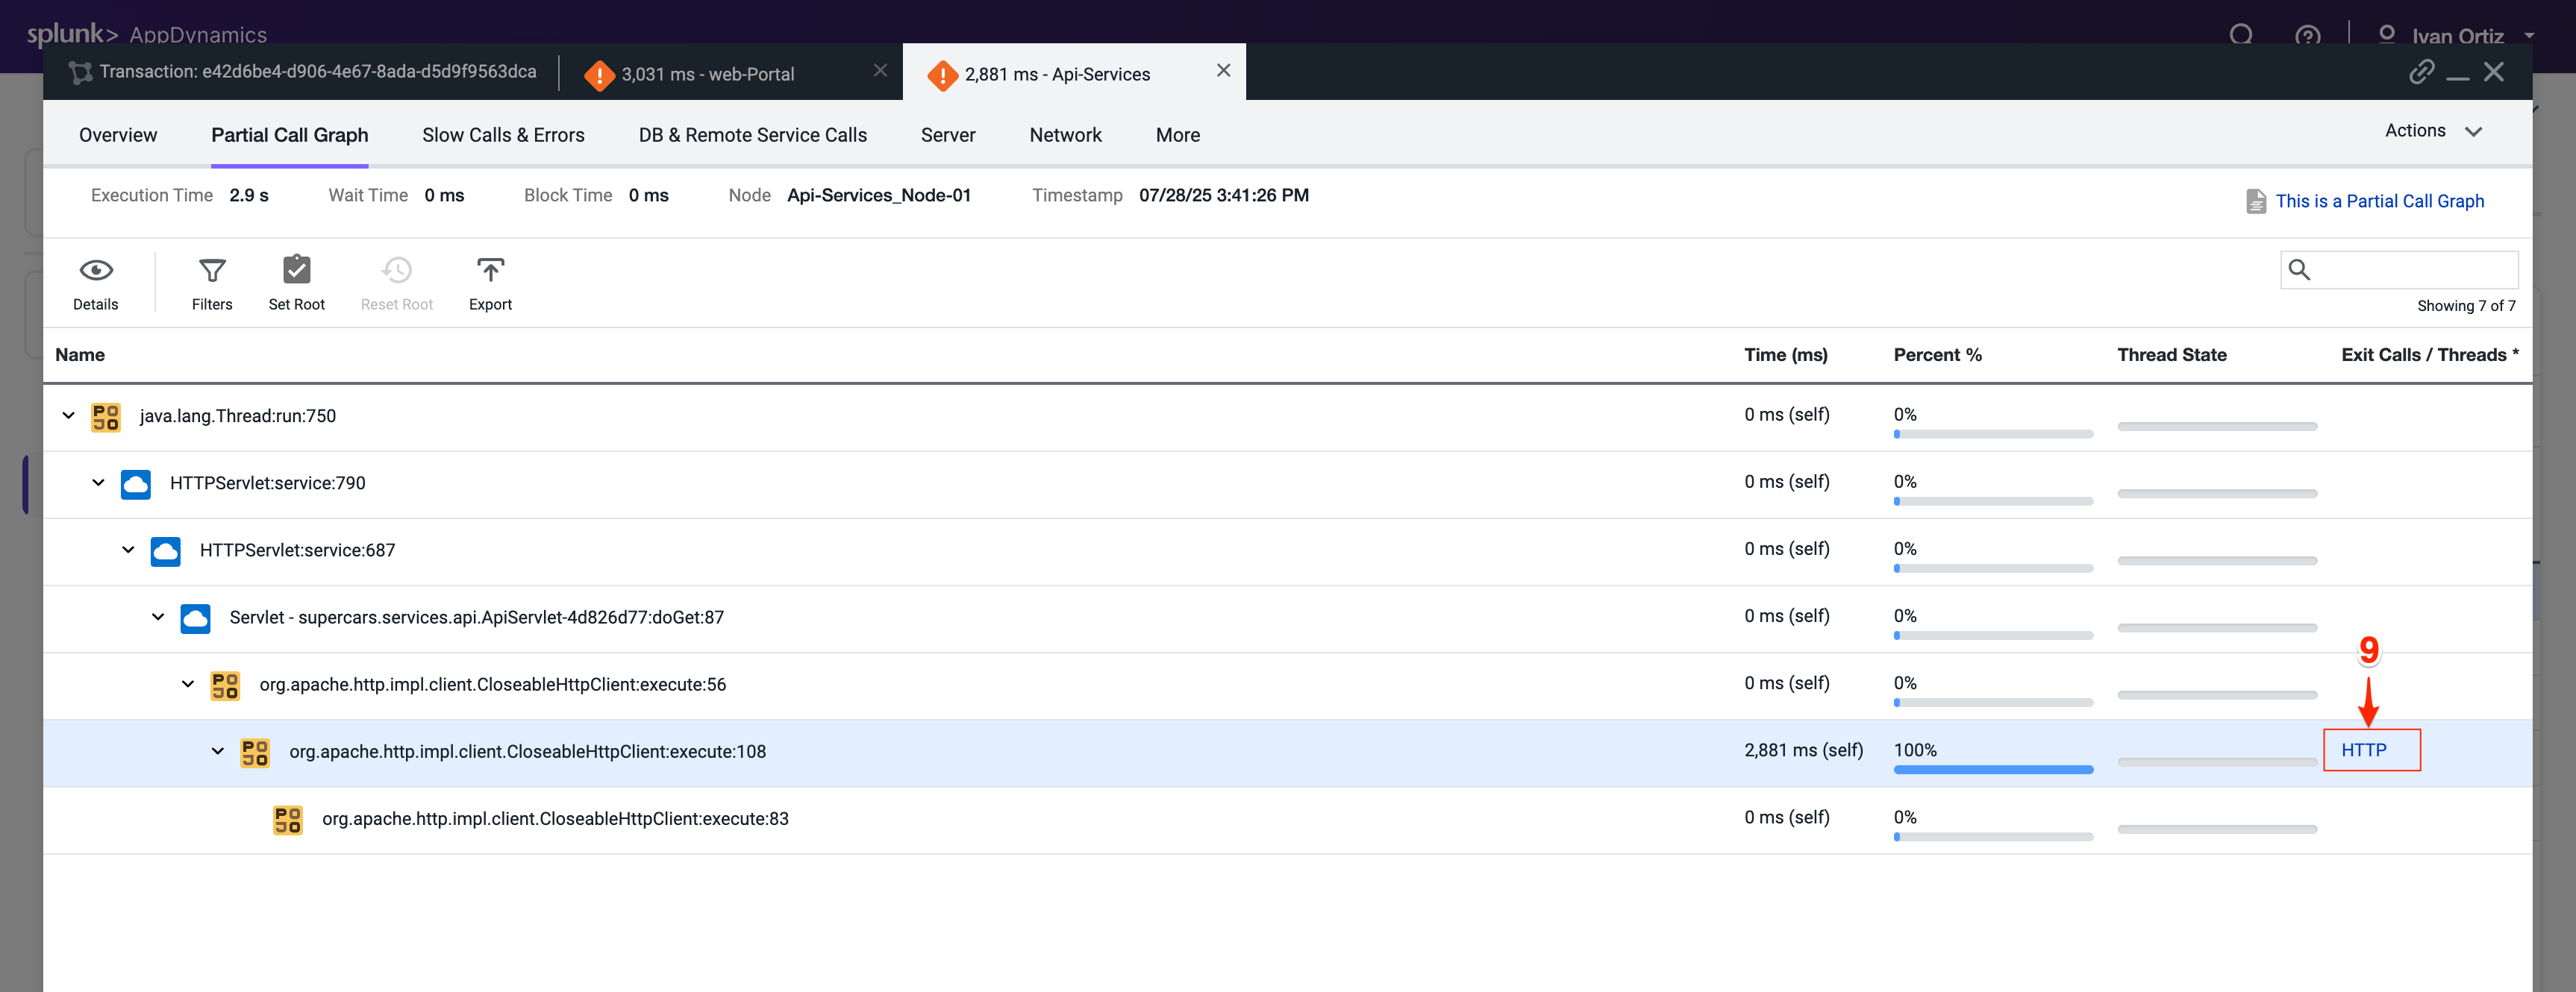
The next tab that opens shows the call graph of the Api-Services Tier. We can see that 100% of the time was due to an outbound HTTP call.
Click the HTTP link to open the detail panel for the downstream call.
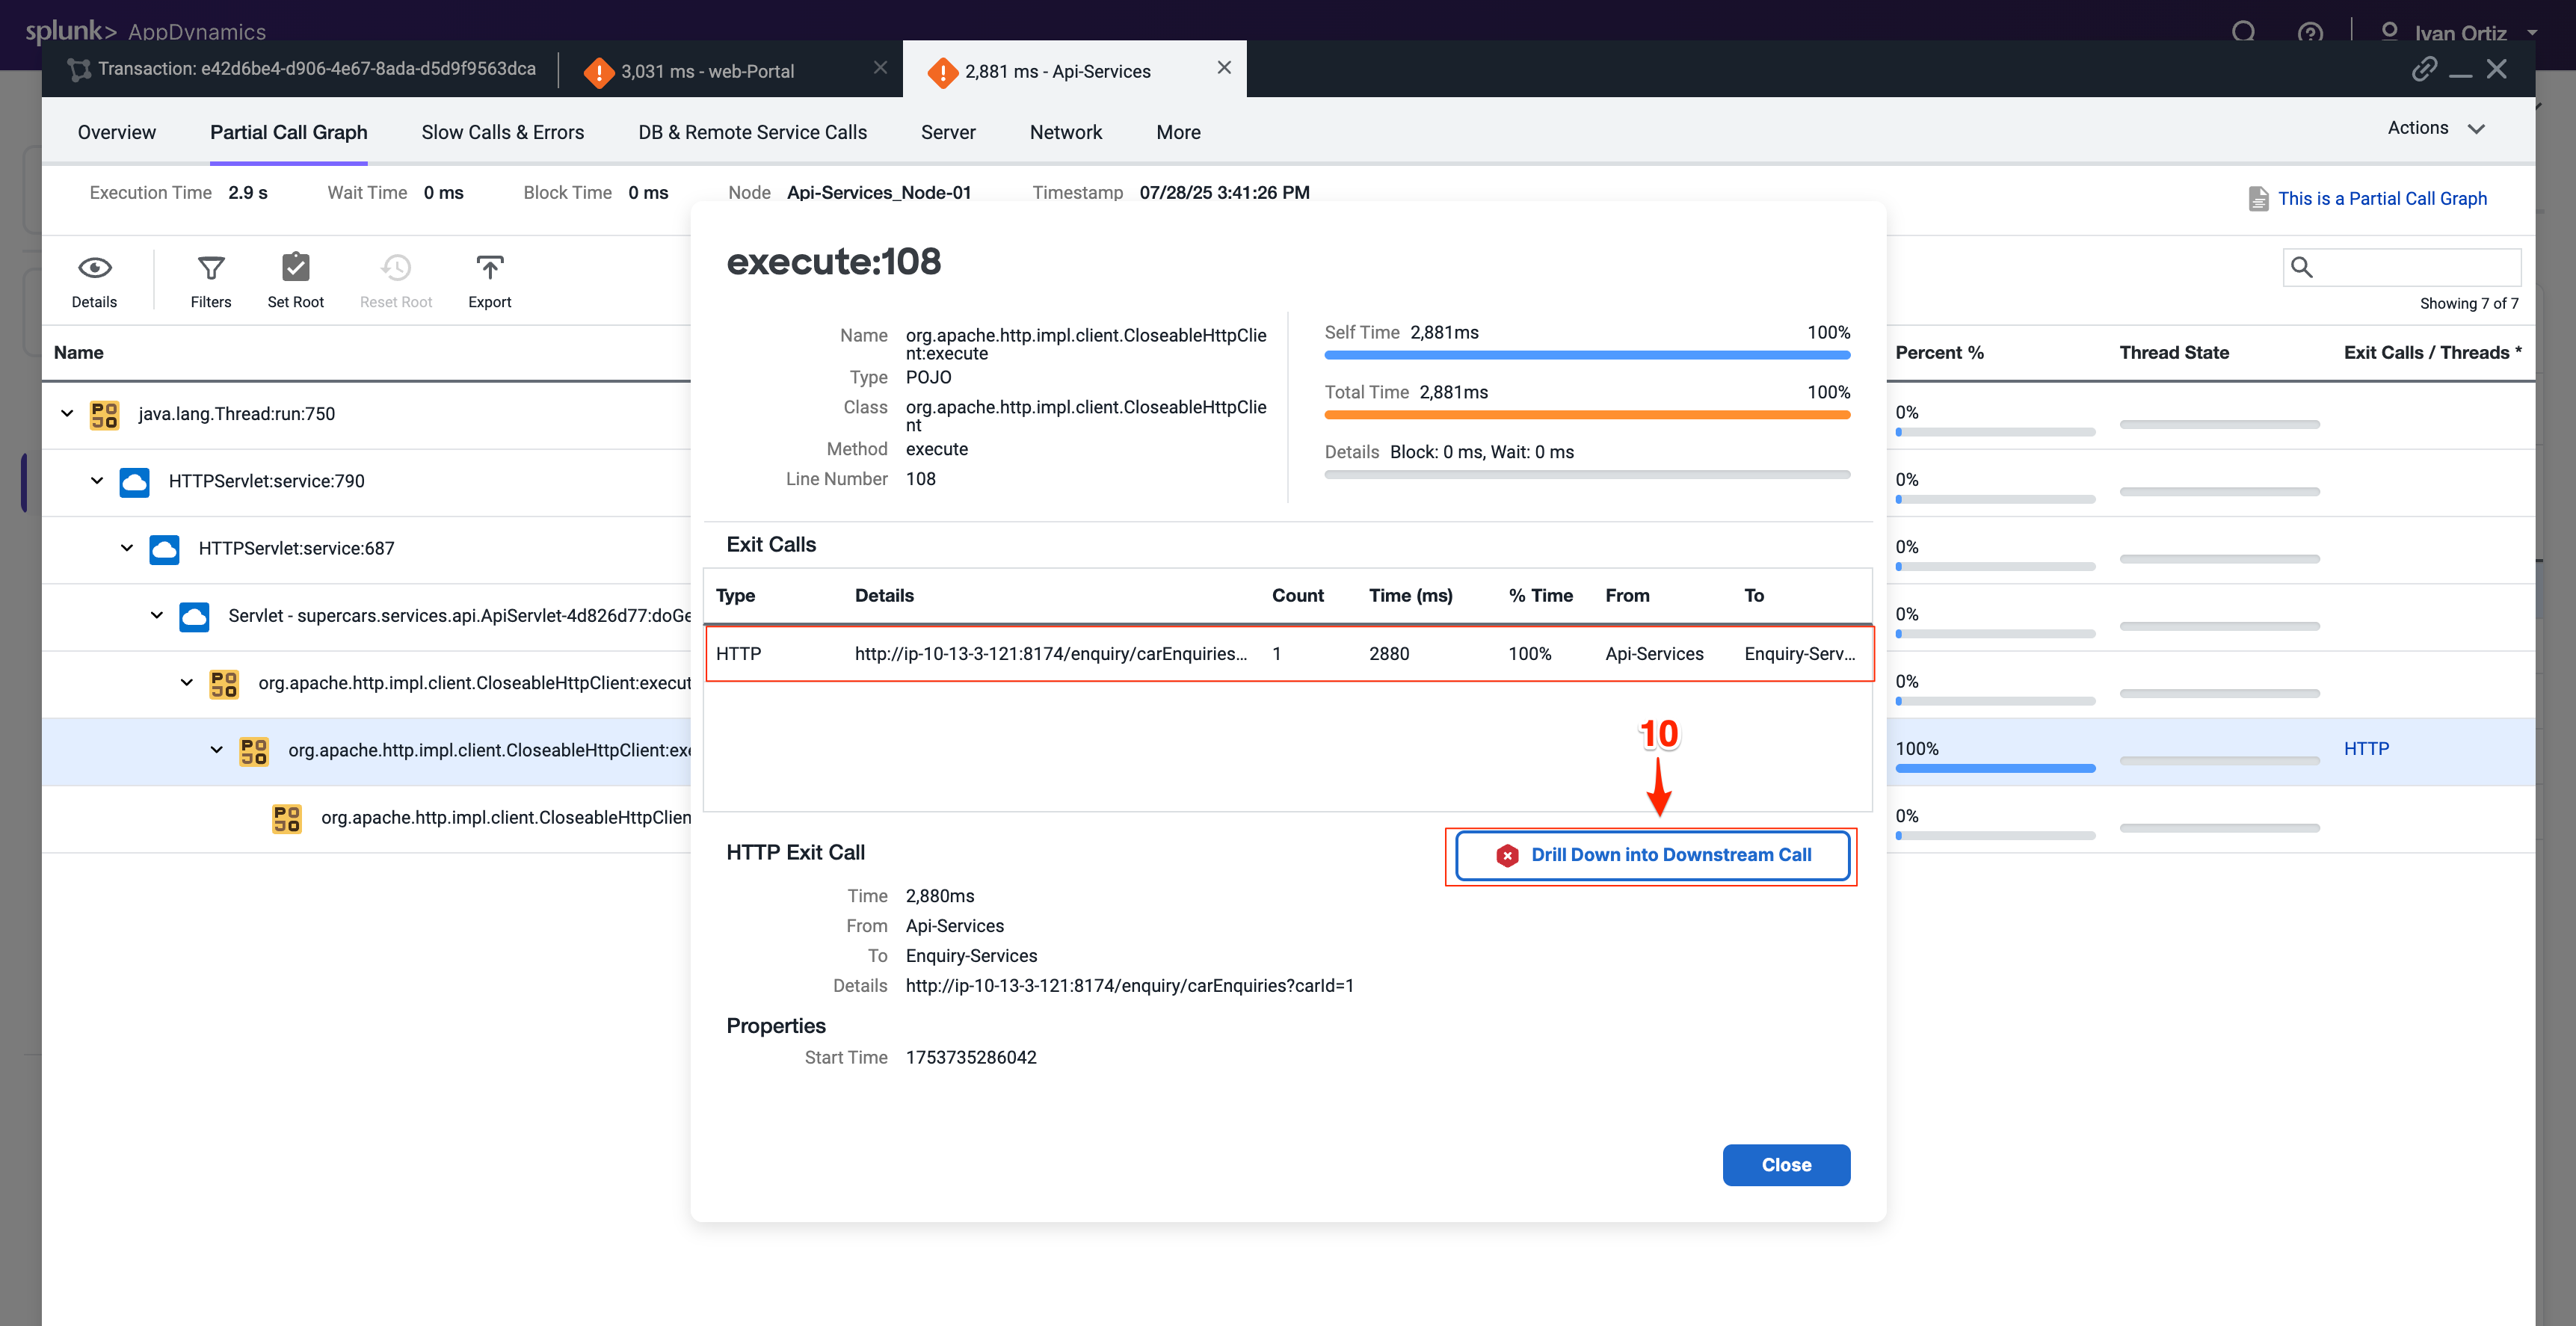
The detail panel for the downstream call shows that the Api-Services Tier made an outbound HTTP call to the Enquiry-Services Tier. Follow the HTTP call into the Enquiry-Services Tier.
Click Drill Down into Downstream Call.
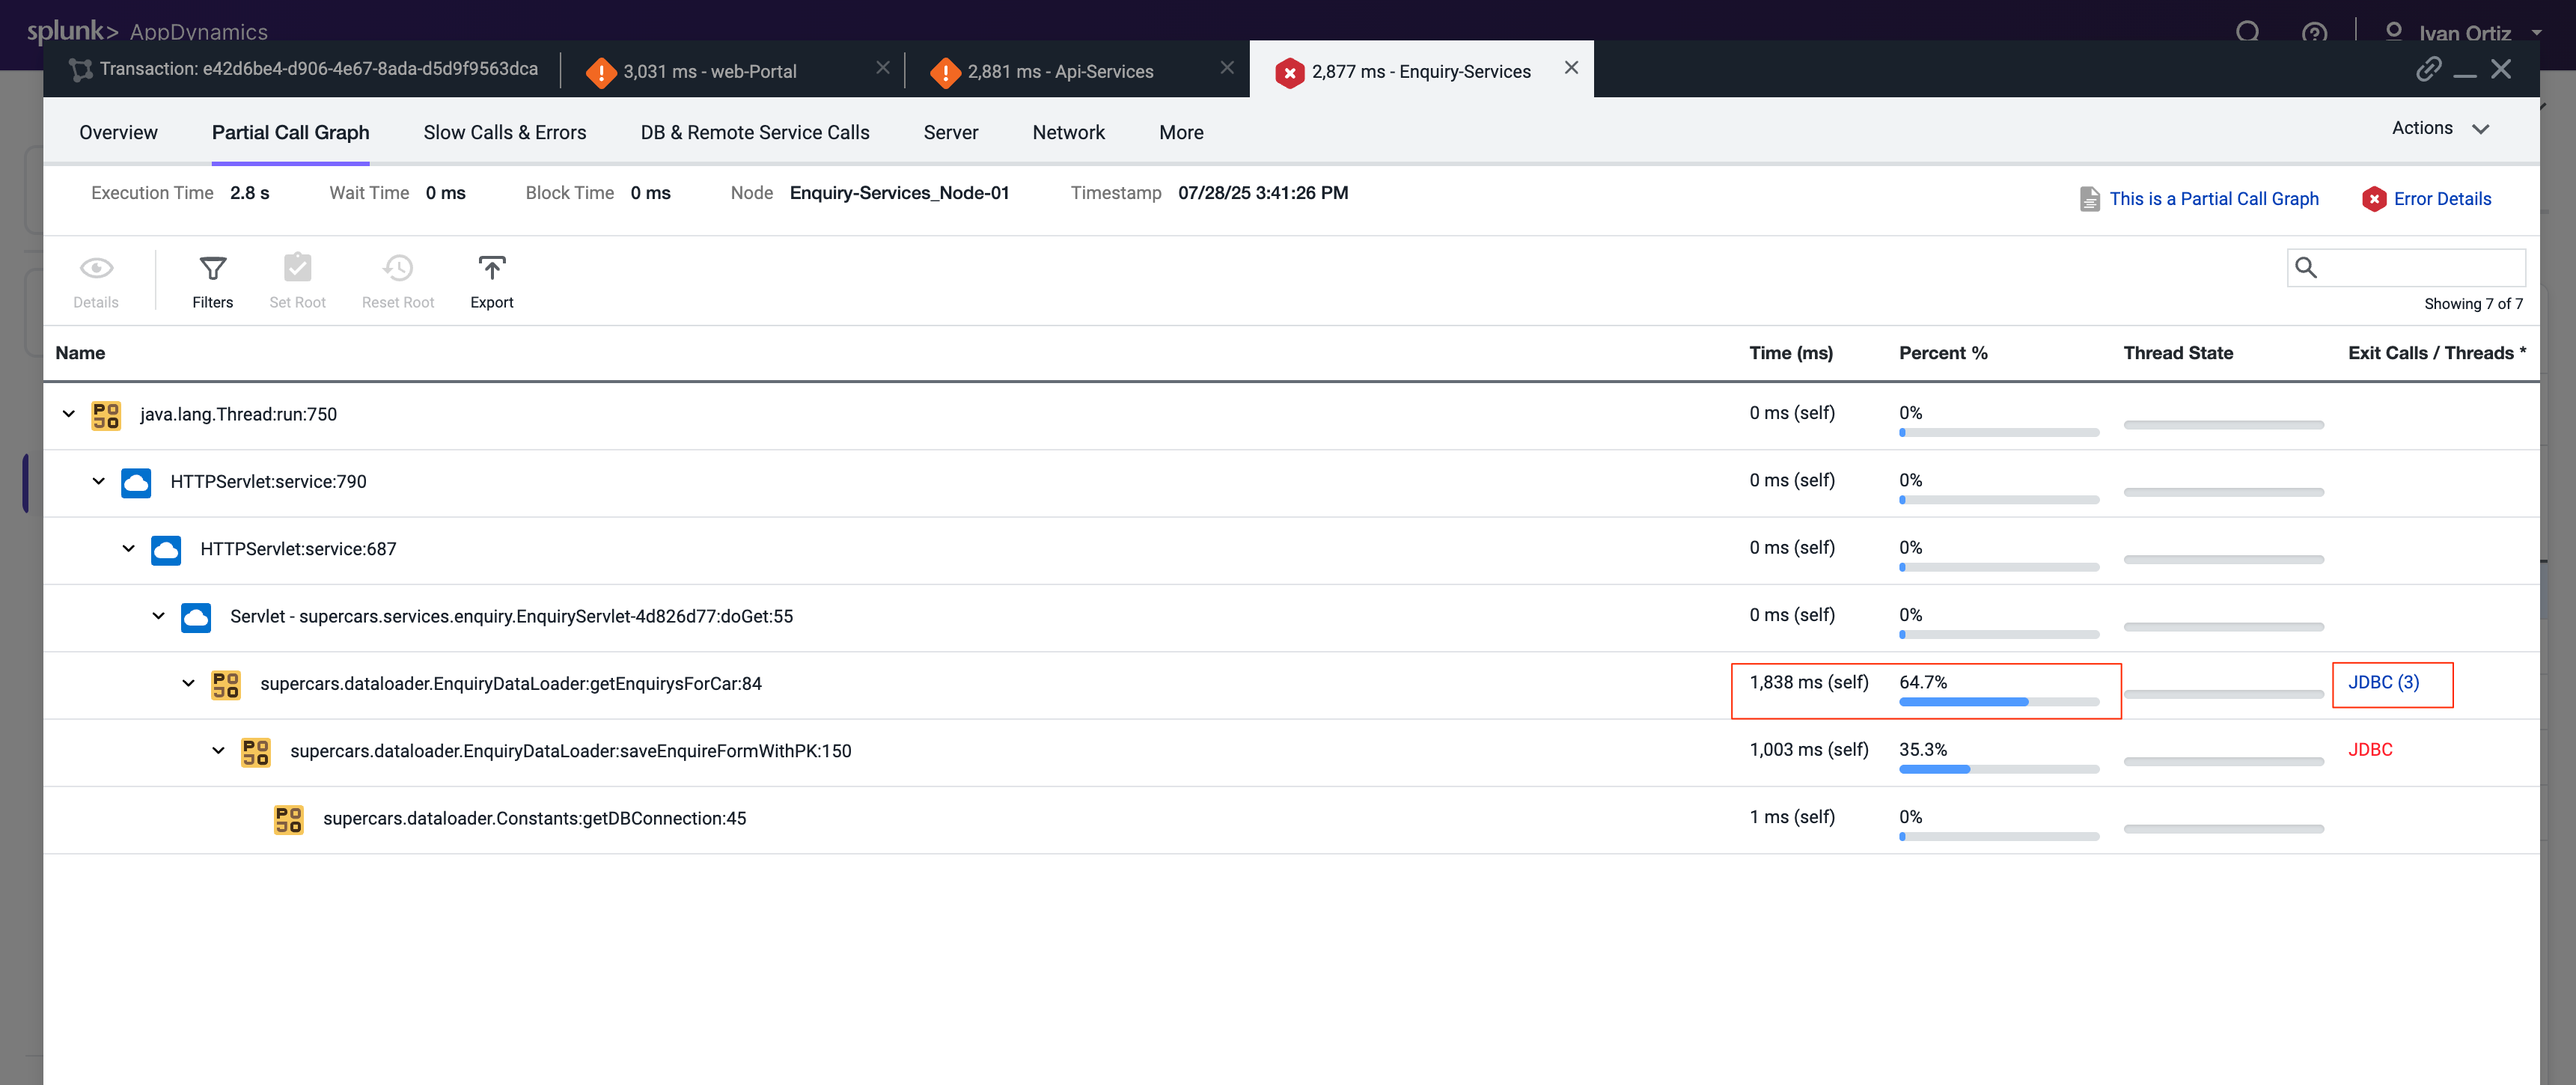
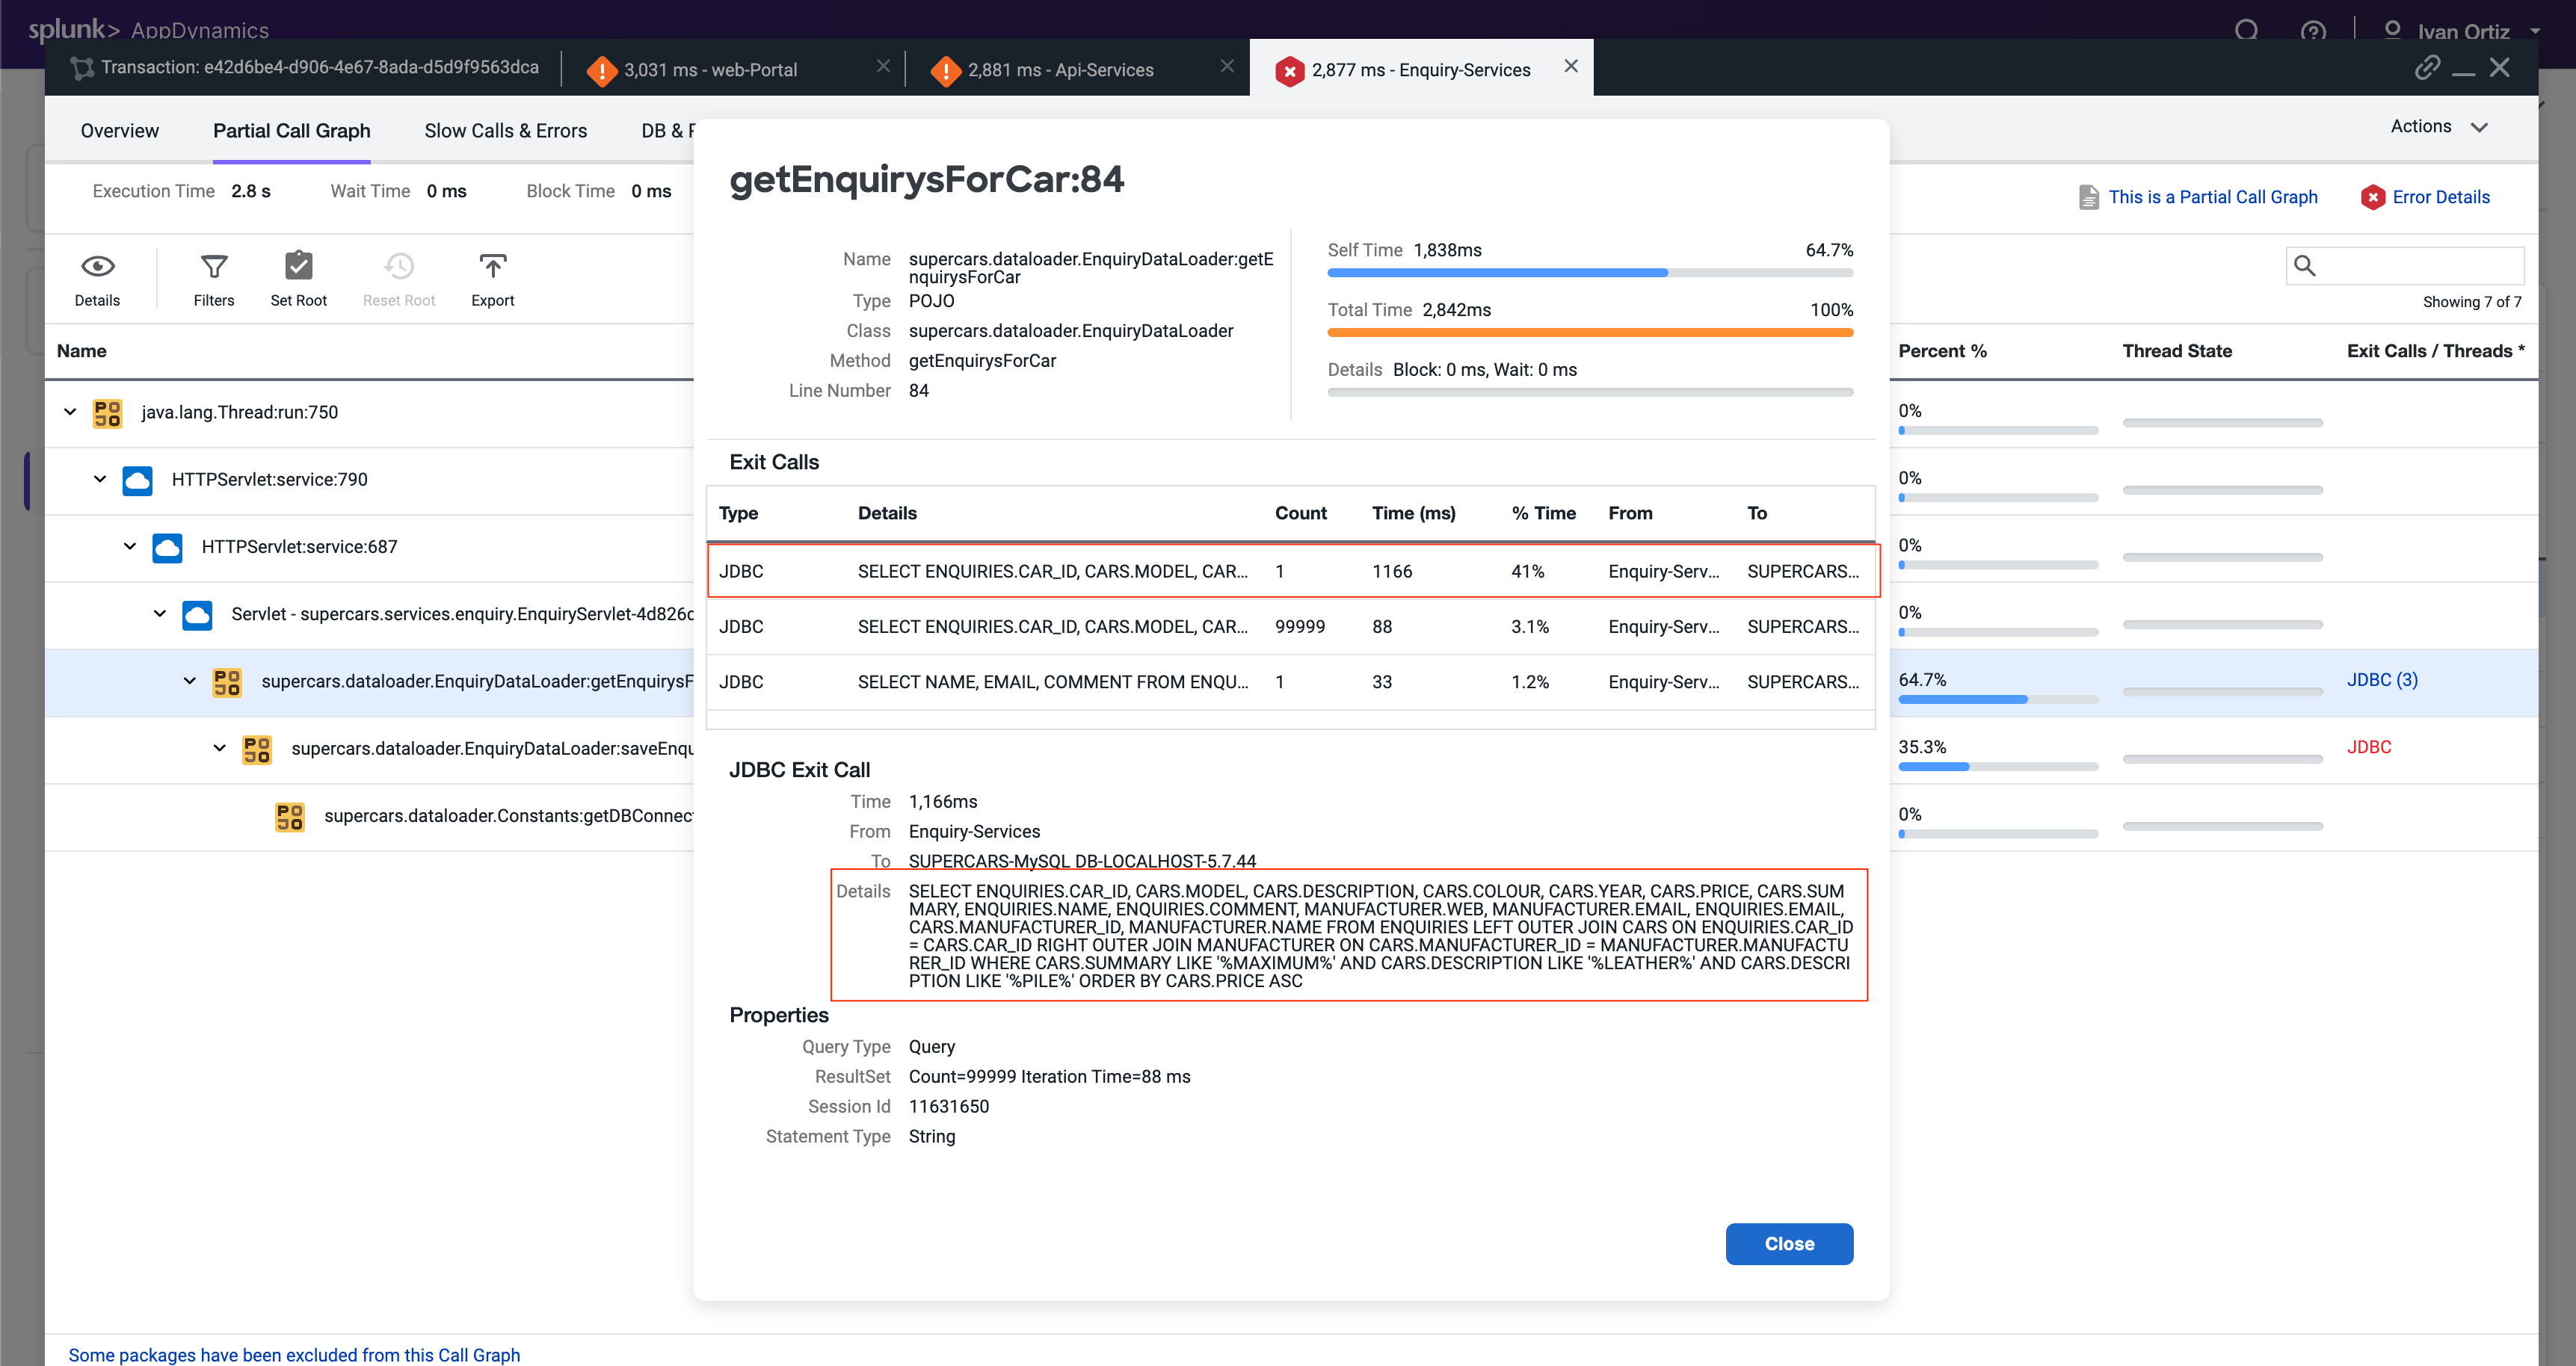
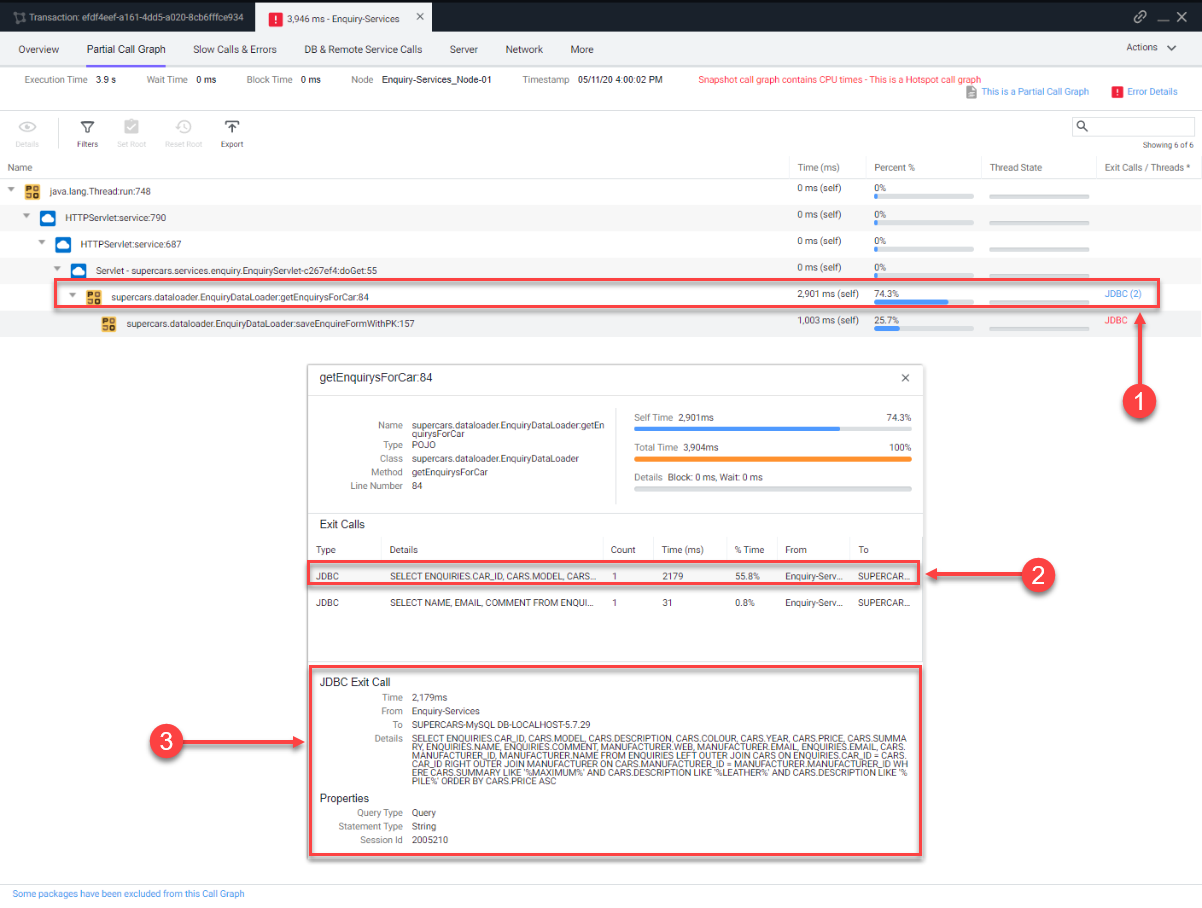
The next tab that opens shows the call graph of the Enquiry-Services Tier. We can see that there were JDBC calls to the database that caused issues with the transaction.
Click the JDBC link with the largest time to open the detail panel for the JDBC calls.
The detail panel for the JDBC exit calls shows the specific query that took most of the time. We can see the full SQL statement along with the SQL parameter values.
Summary
In this lab, we first used Business Transactions to identify a very slow transaction that required troubleshooting. We then examined the call graph to pinpoint the specific part of the code causing delays. Following that, we drilled down into downstream services and the database to further analyze the root cause of the slowness. Finally, we successfully identified the exact inefficient SQL query responsible for the performance issue. This comprehensive approach demonstrates how AppDynamics helps in isolating and resolving transaction bottlenecks effectively.
7. Troubleshooting Errors & Exceptions
In this exercise, you will learn how to effectively detect and diagnose errors within your application to identify their root causes. Additionally, you will explore how to pinpoint specific nodes that may be underperforming or experiencing errors, and apply troubleshooting techniques to resolve these performance issues. This hands-on experience will enhance your ability to maintain application health and ensure optimal performance.
Find Specific Errors Within Your Application
AppDynamics makes it easy to find errors and exceptions within your application. You can use the Errors dashboard to see transactions snapshots with errors and find the exceptions that are occurring most often. Identifying errors quickly helps prioritize fixes that improve application stability and user experience. Understanding the types and frequency of exceptions allows you to focus on the most impactful issues.
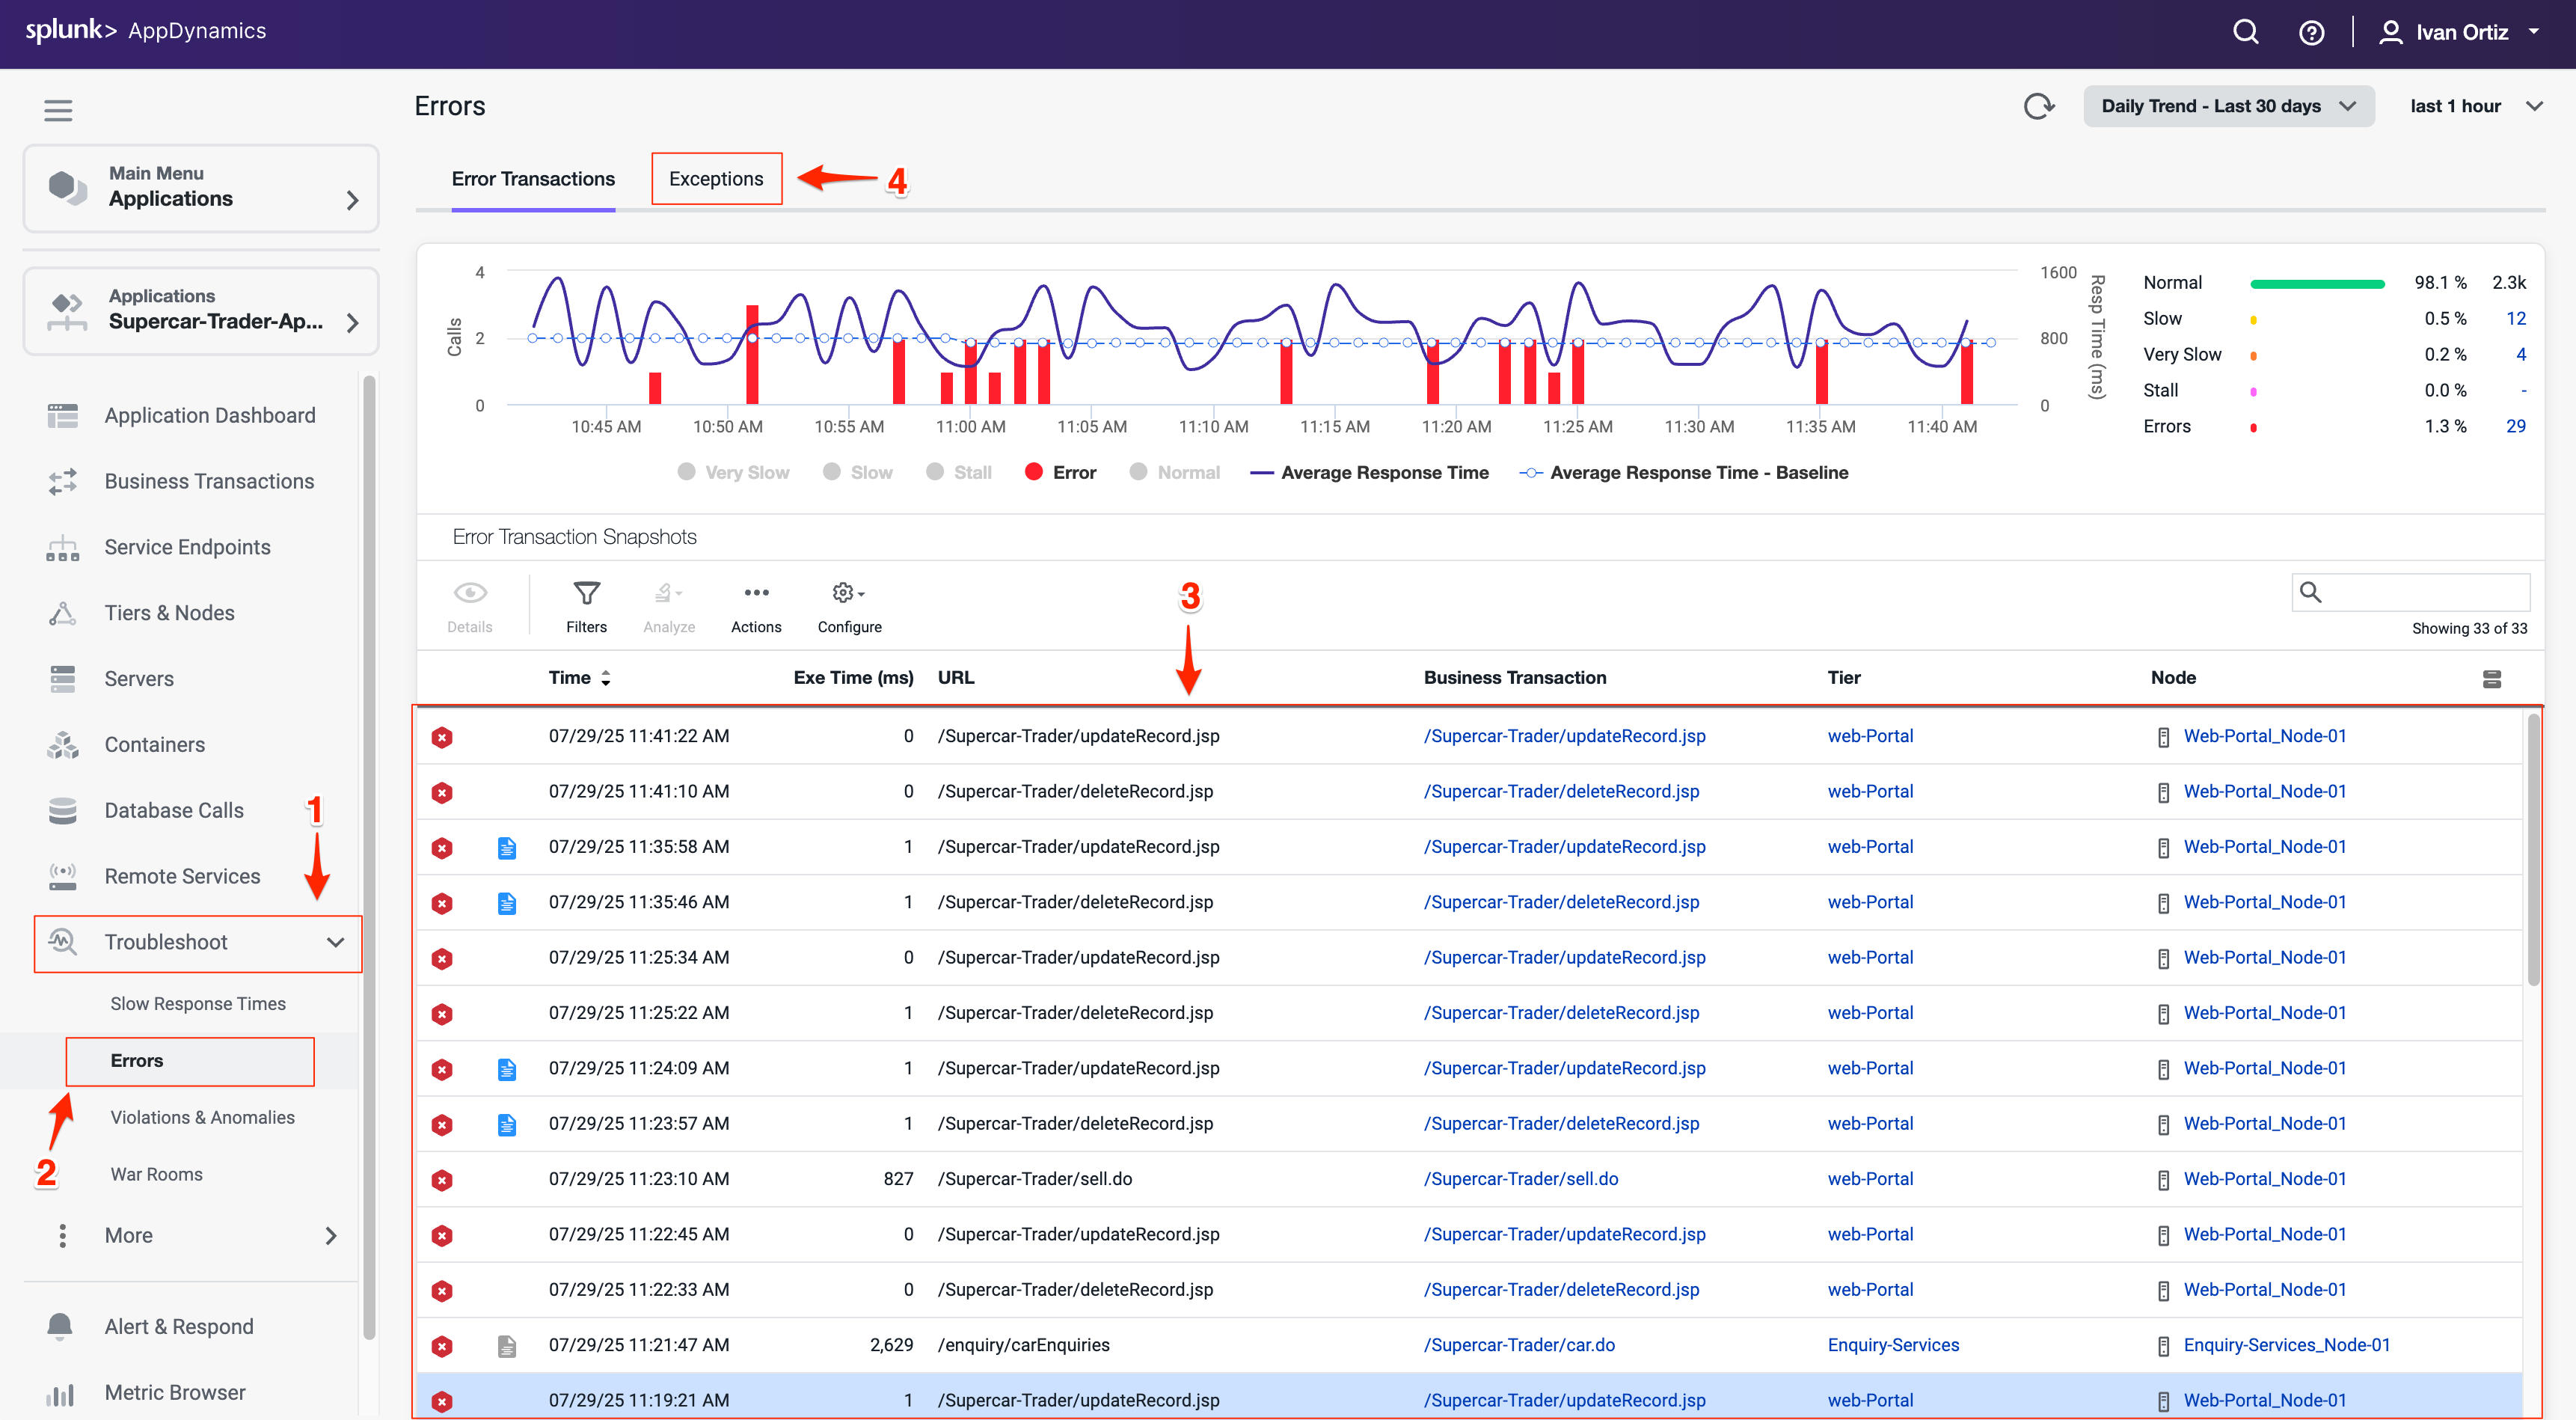
Click on the Troubleshoot option on the left menu.
Click on the Errors option on the left menu. This navigates you to the Errors dashboard where you can quickly identify business transactions with errors
Explore a few of the error transaction snapshots. Reviewing snapshots helps you see the exact context and flow when errors occurred.
Click on the Exceptions tab to see exceptions grouped by type. Grouping by exception type helps identify recurring problems and patterns.
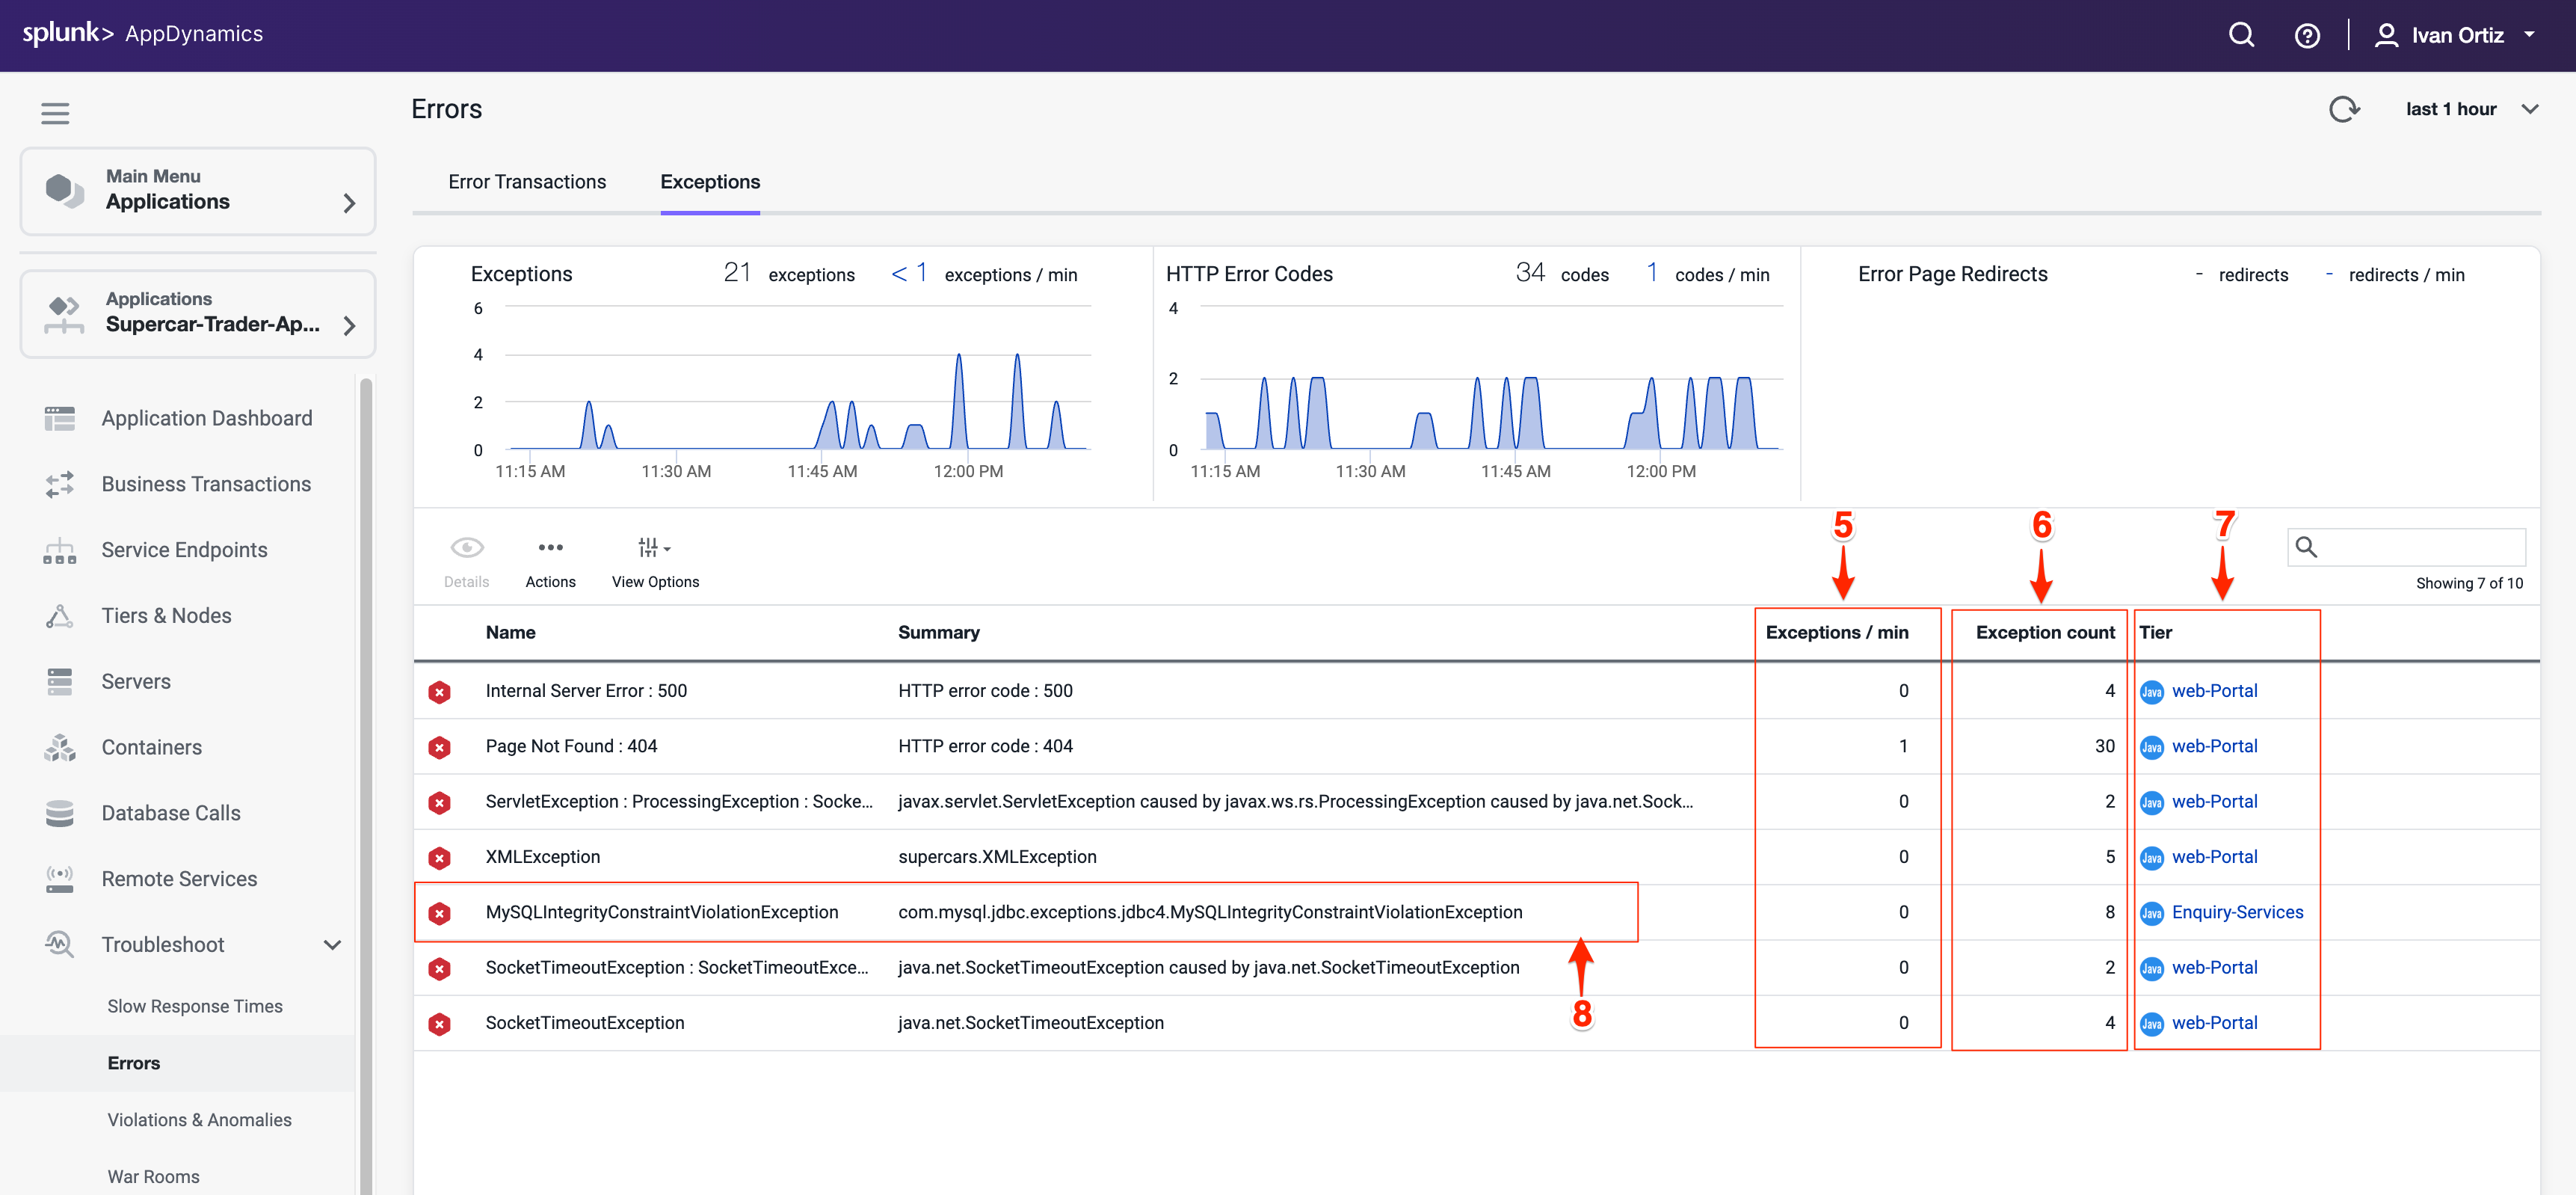
The Exceptions tab shows you what types of exceptions are occurring the most within the application so you can prioritize remediating the ones having the most impact.
Observe the Exceptions per minute and Exception count (6) to understand error frequency. High frequency exceptions often indicate critical issues needing immediate attention.
Note the Tier where exceptions occur to localize the problem within your application architecture. Knowing the affected tier helps narrow down the root cause.
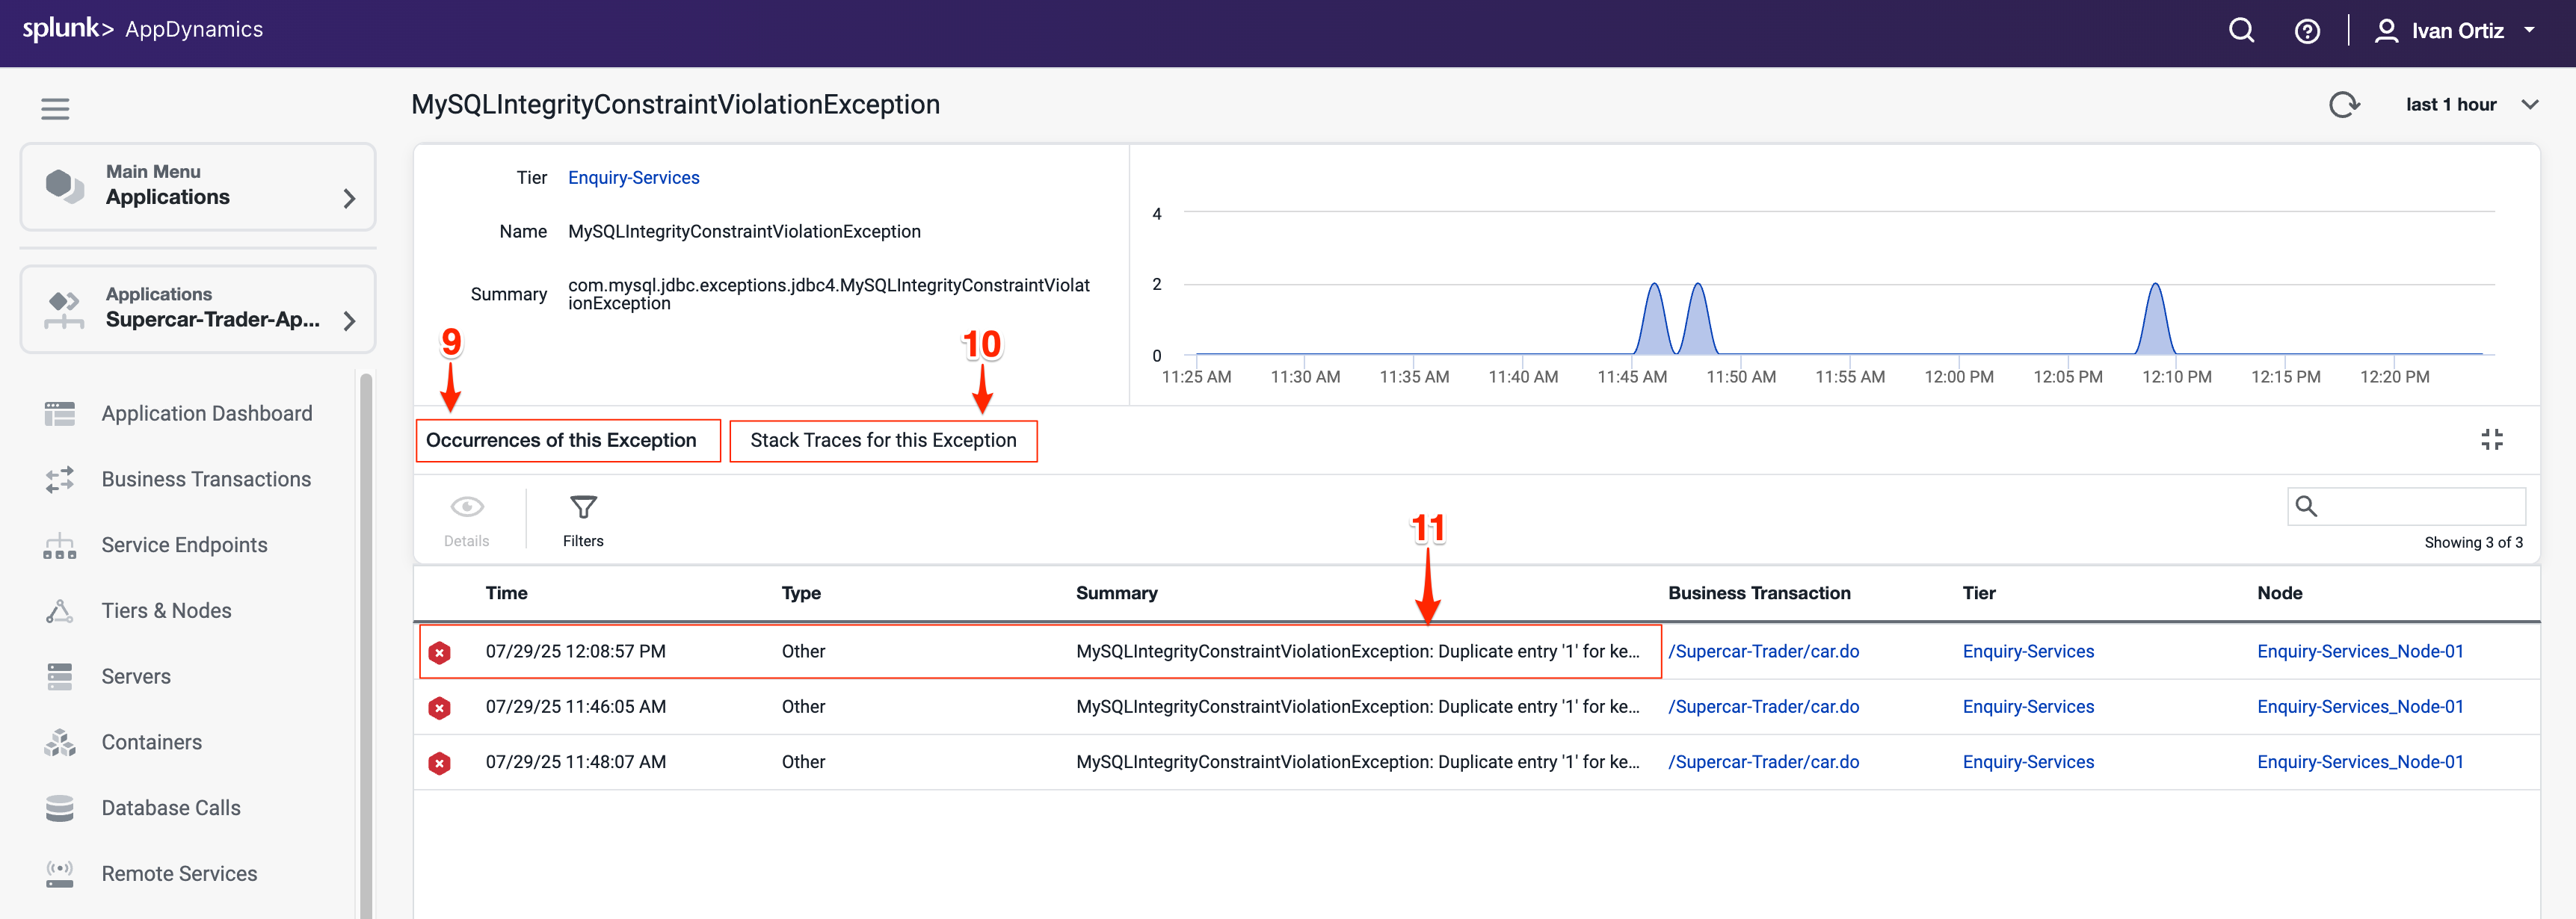
Double-click on the MySQLIntegrityConstraintViolationException type to drill deeper.
Review the overview dashboard showing snapshots that experienced this exception type.
The tab labeled Stack Traces for this Exception shows you an aggregated list of the unique stack traces generated by this exception type. Stack traces provide the exact code paths causing the error, essential for debugging.
Double-click a snapshot to open it and see the error in context.
This shows the transaction flow and pinpoints where the error happened.
When you open an error snapshot from the exceptions screen, the snapshot opens to the specific segment within the snapshot where the error occurred.
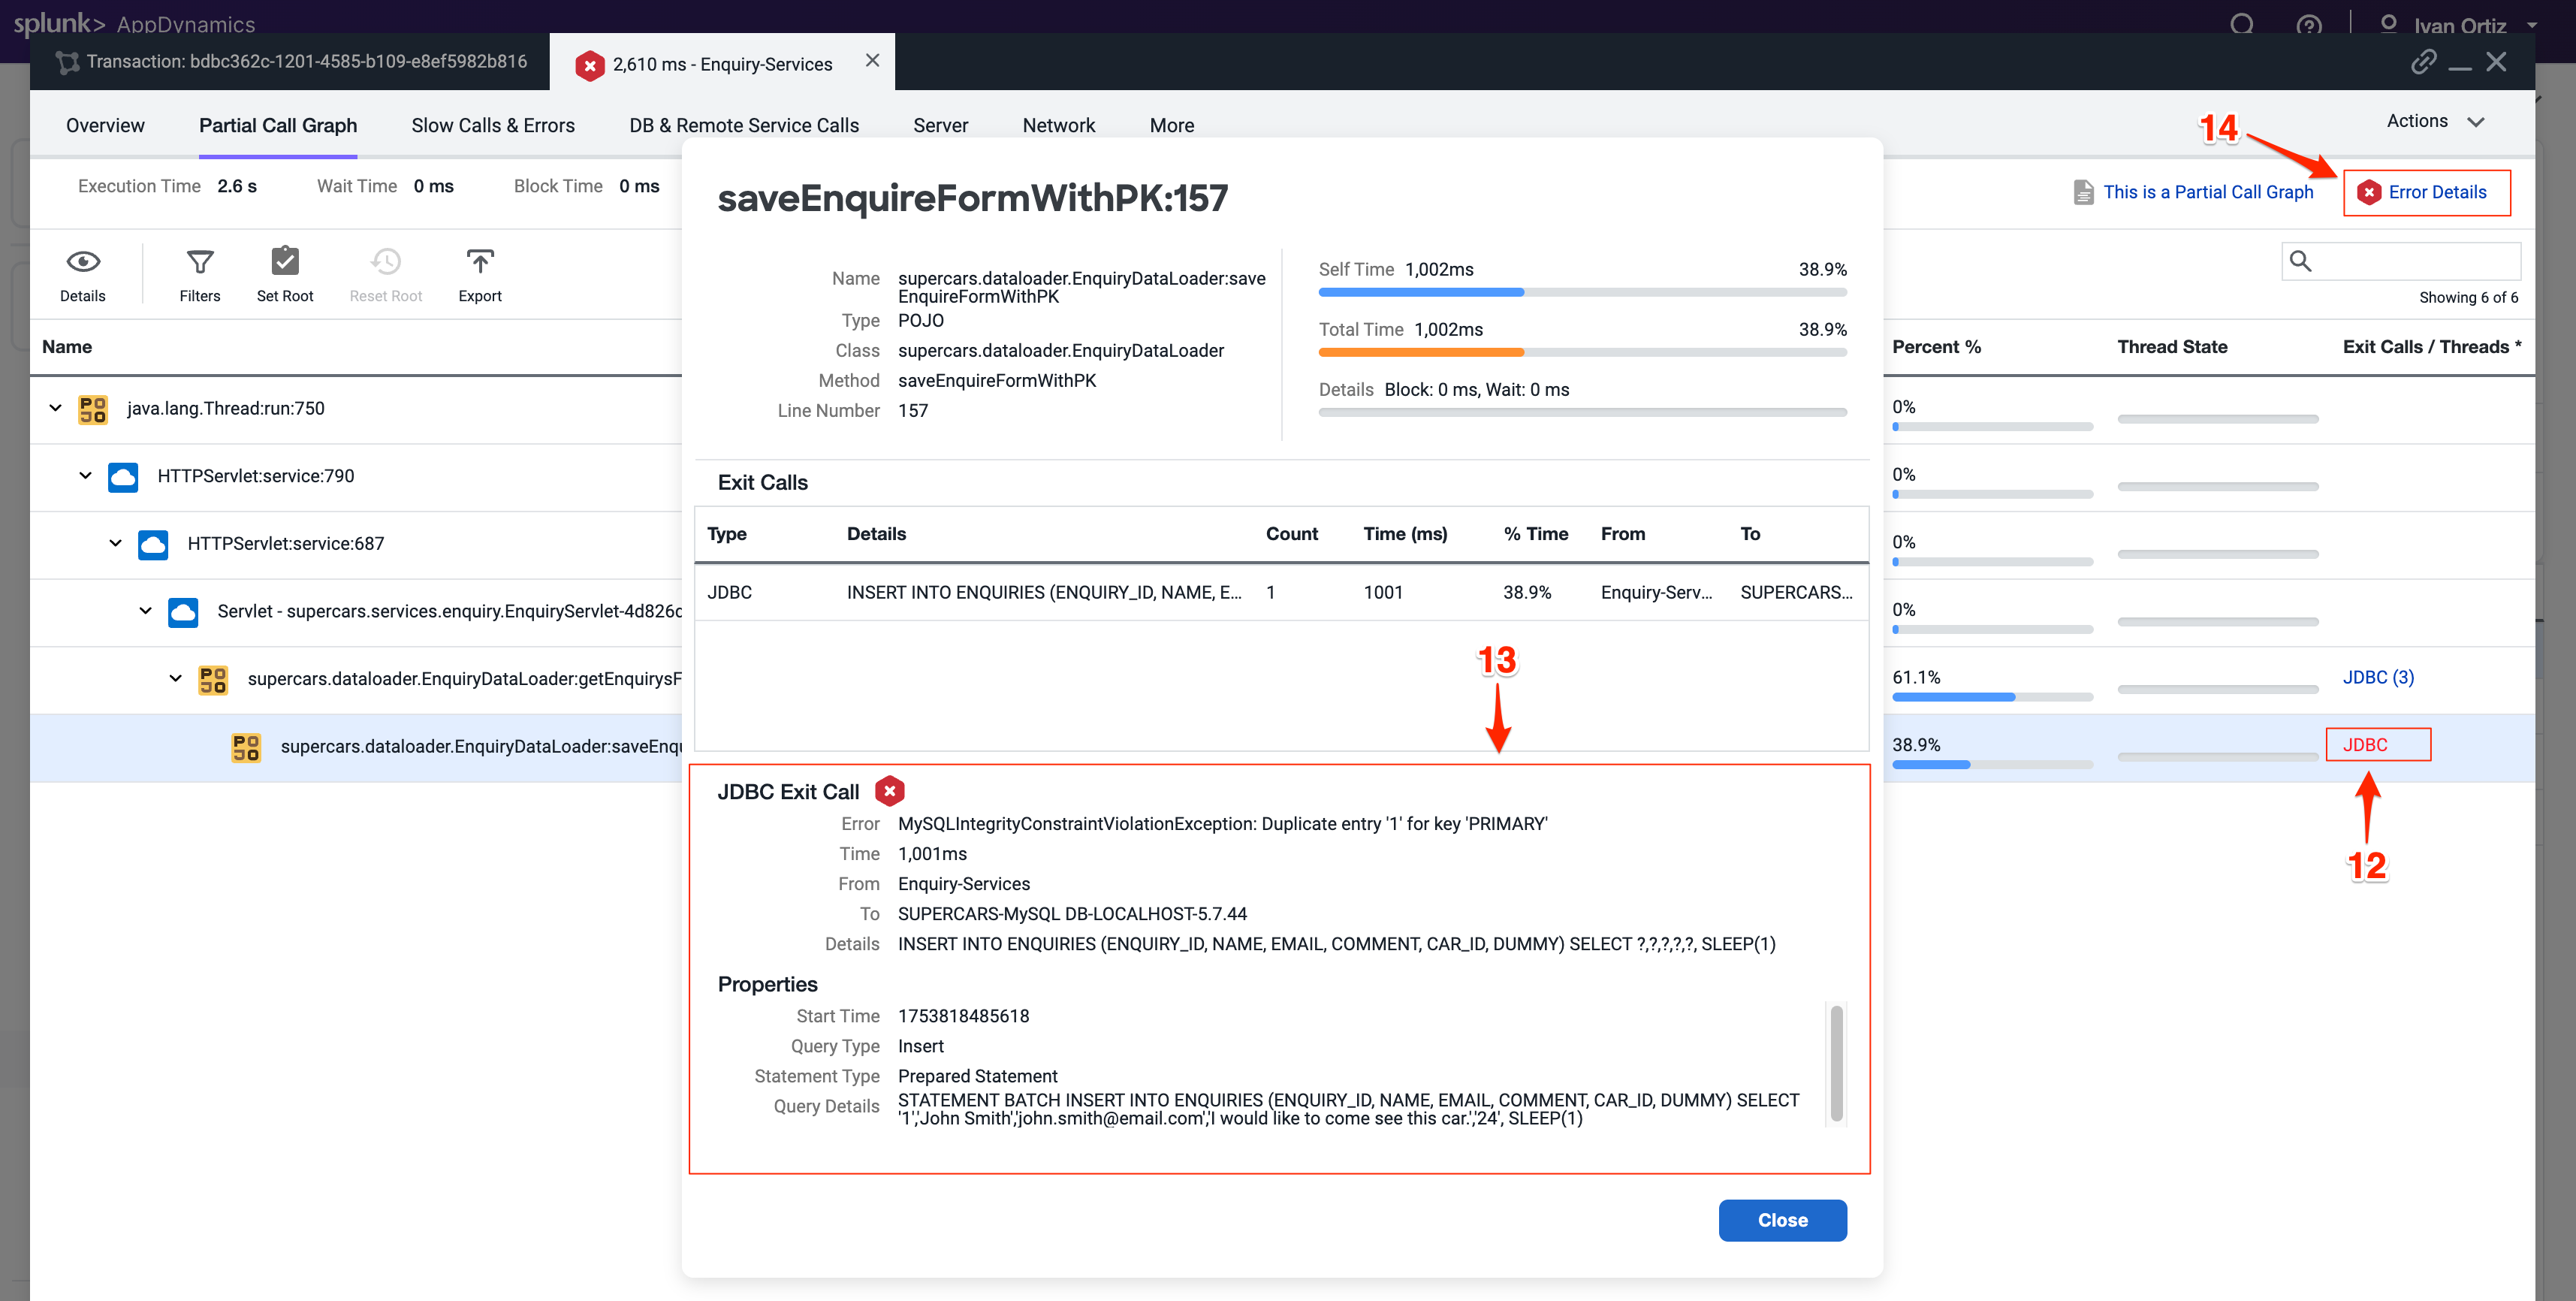
Notice exit calls in red text indicating errors or exceptions.
Drill into the exit call to view detailed error information.
Click Error Details to see the full stack trace. Full stack traces are critical for developers to trace and fix bugs.
Tip
If you want to learn more about error handling and exceptions, refer to the official AppDynamics documentation in the following link: here.
Troubleshoot Node Issues
Node health directly impacts application performance and availability. Early detection of node issues prevents outages and ensures smooth operation. AppDynamics provides visual indicators throughout the UI, making it easy to quickly identify issues.
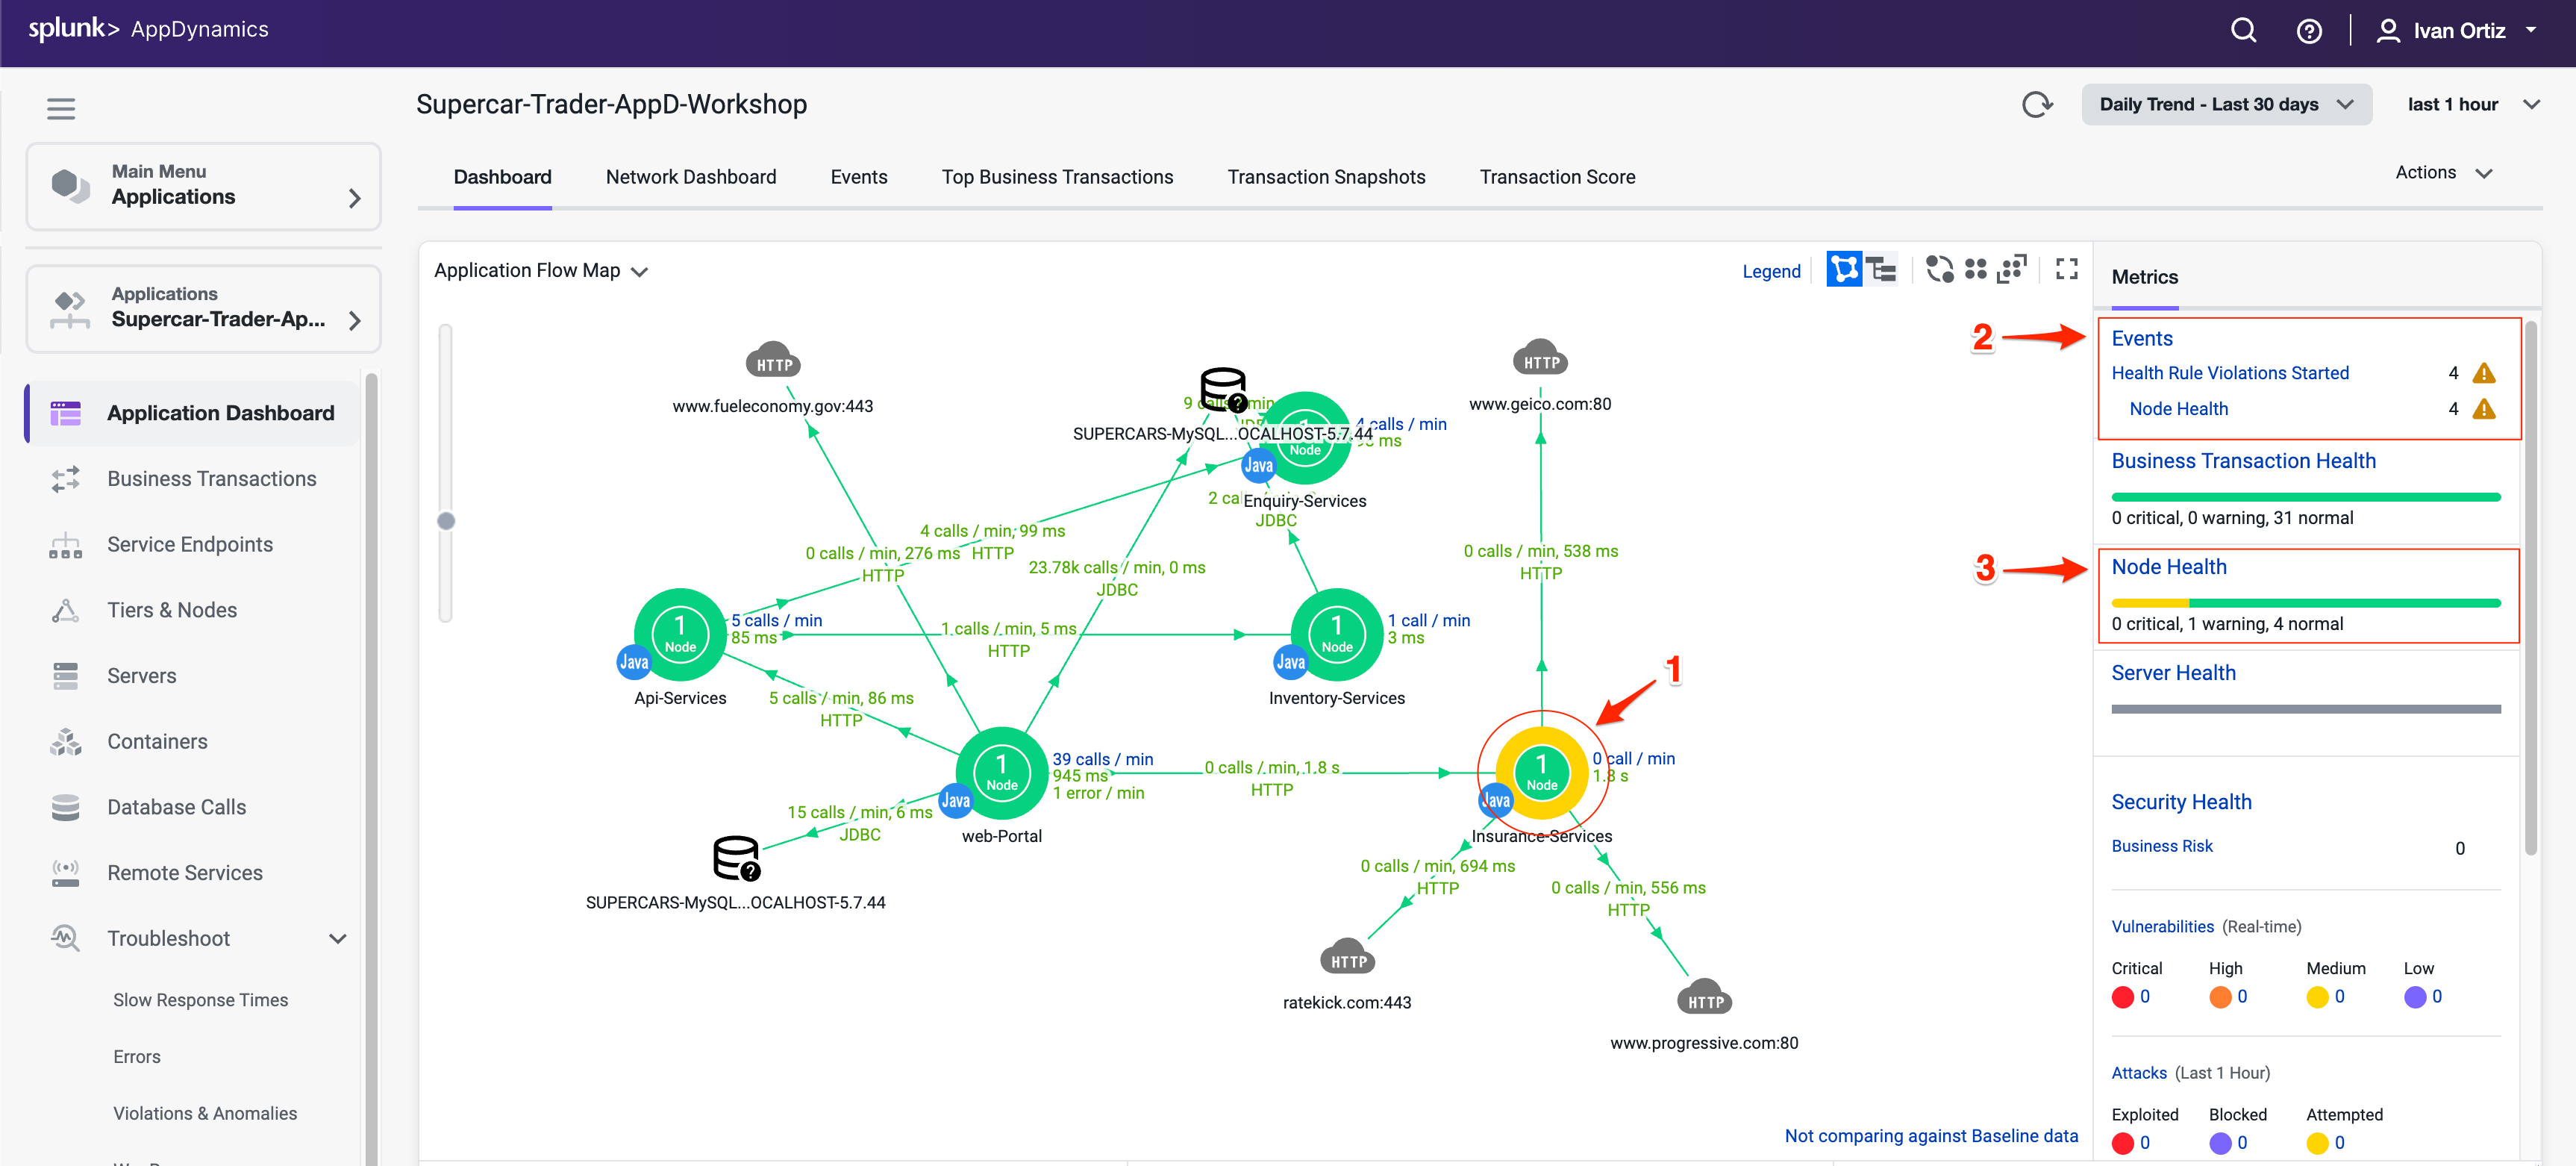
You can see indicators of Node issues in three areas on the Application Dashboard.
Observe the Application Dashboard for visual indicators of node problems. Color changes and icons provide immediate alerts to issues
The Events panel shows Health Rule Violations, including those related to Node Health.
The Node Health panel tells you how many critical or warning issues are occurring for Nodes. Click on the Node Health link in the Node Health panel to drill into the Tiers & Nodes dashboard.
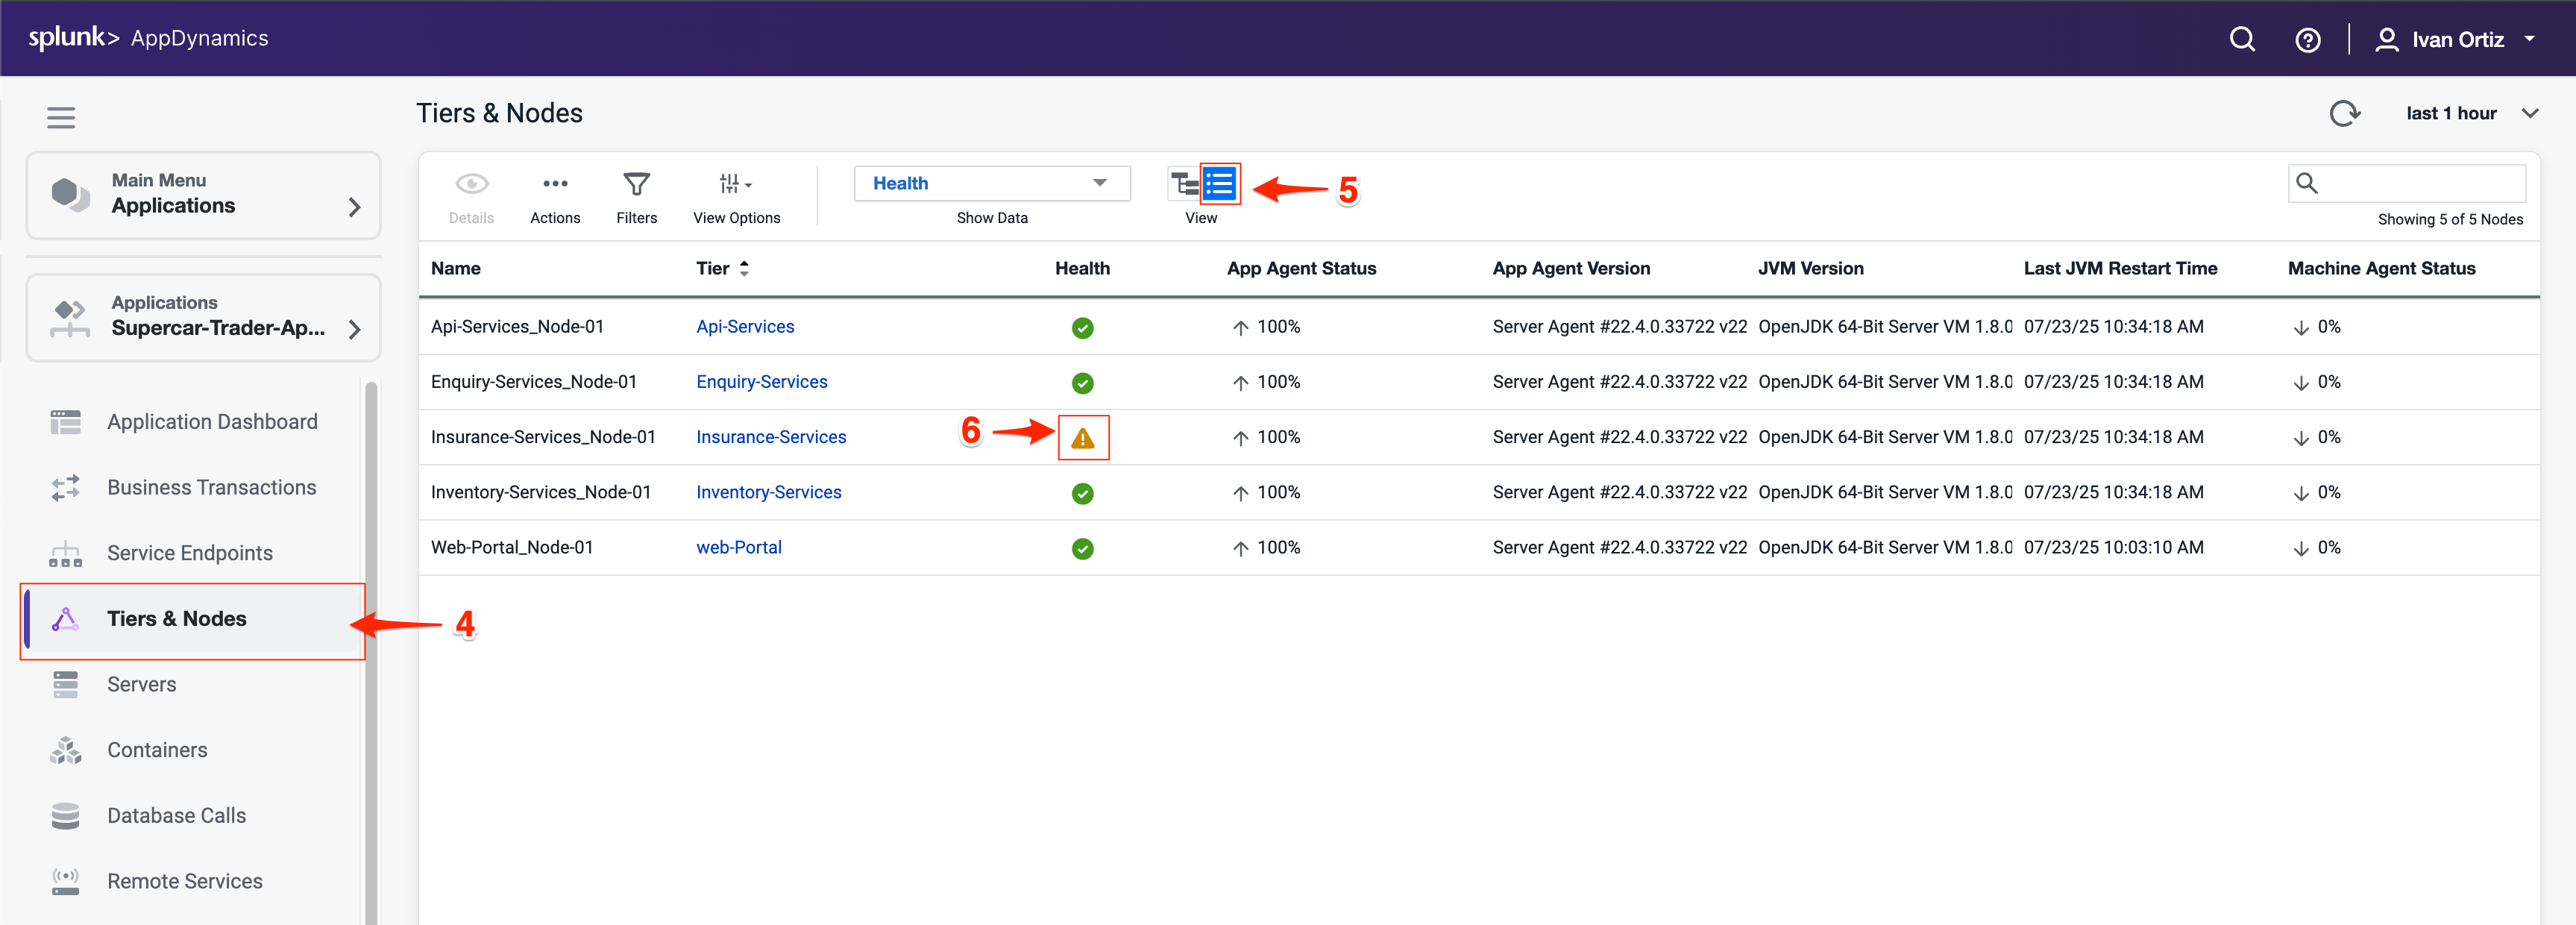
Alternatevely, you can click Tiers & Nodes on the left menu to reach the Tiers & Nodes dashboard
Switch to Grid View for an organized list of nodes. Grid view makes it easier to scan and find nodes with warnings.
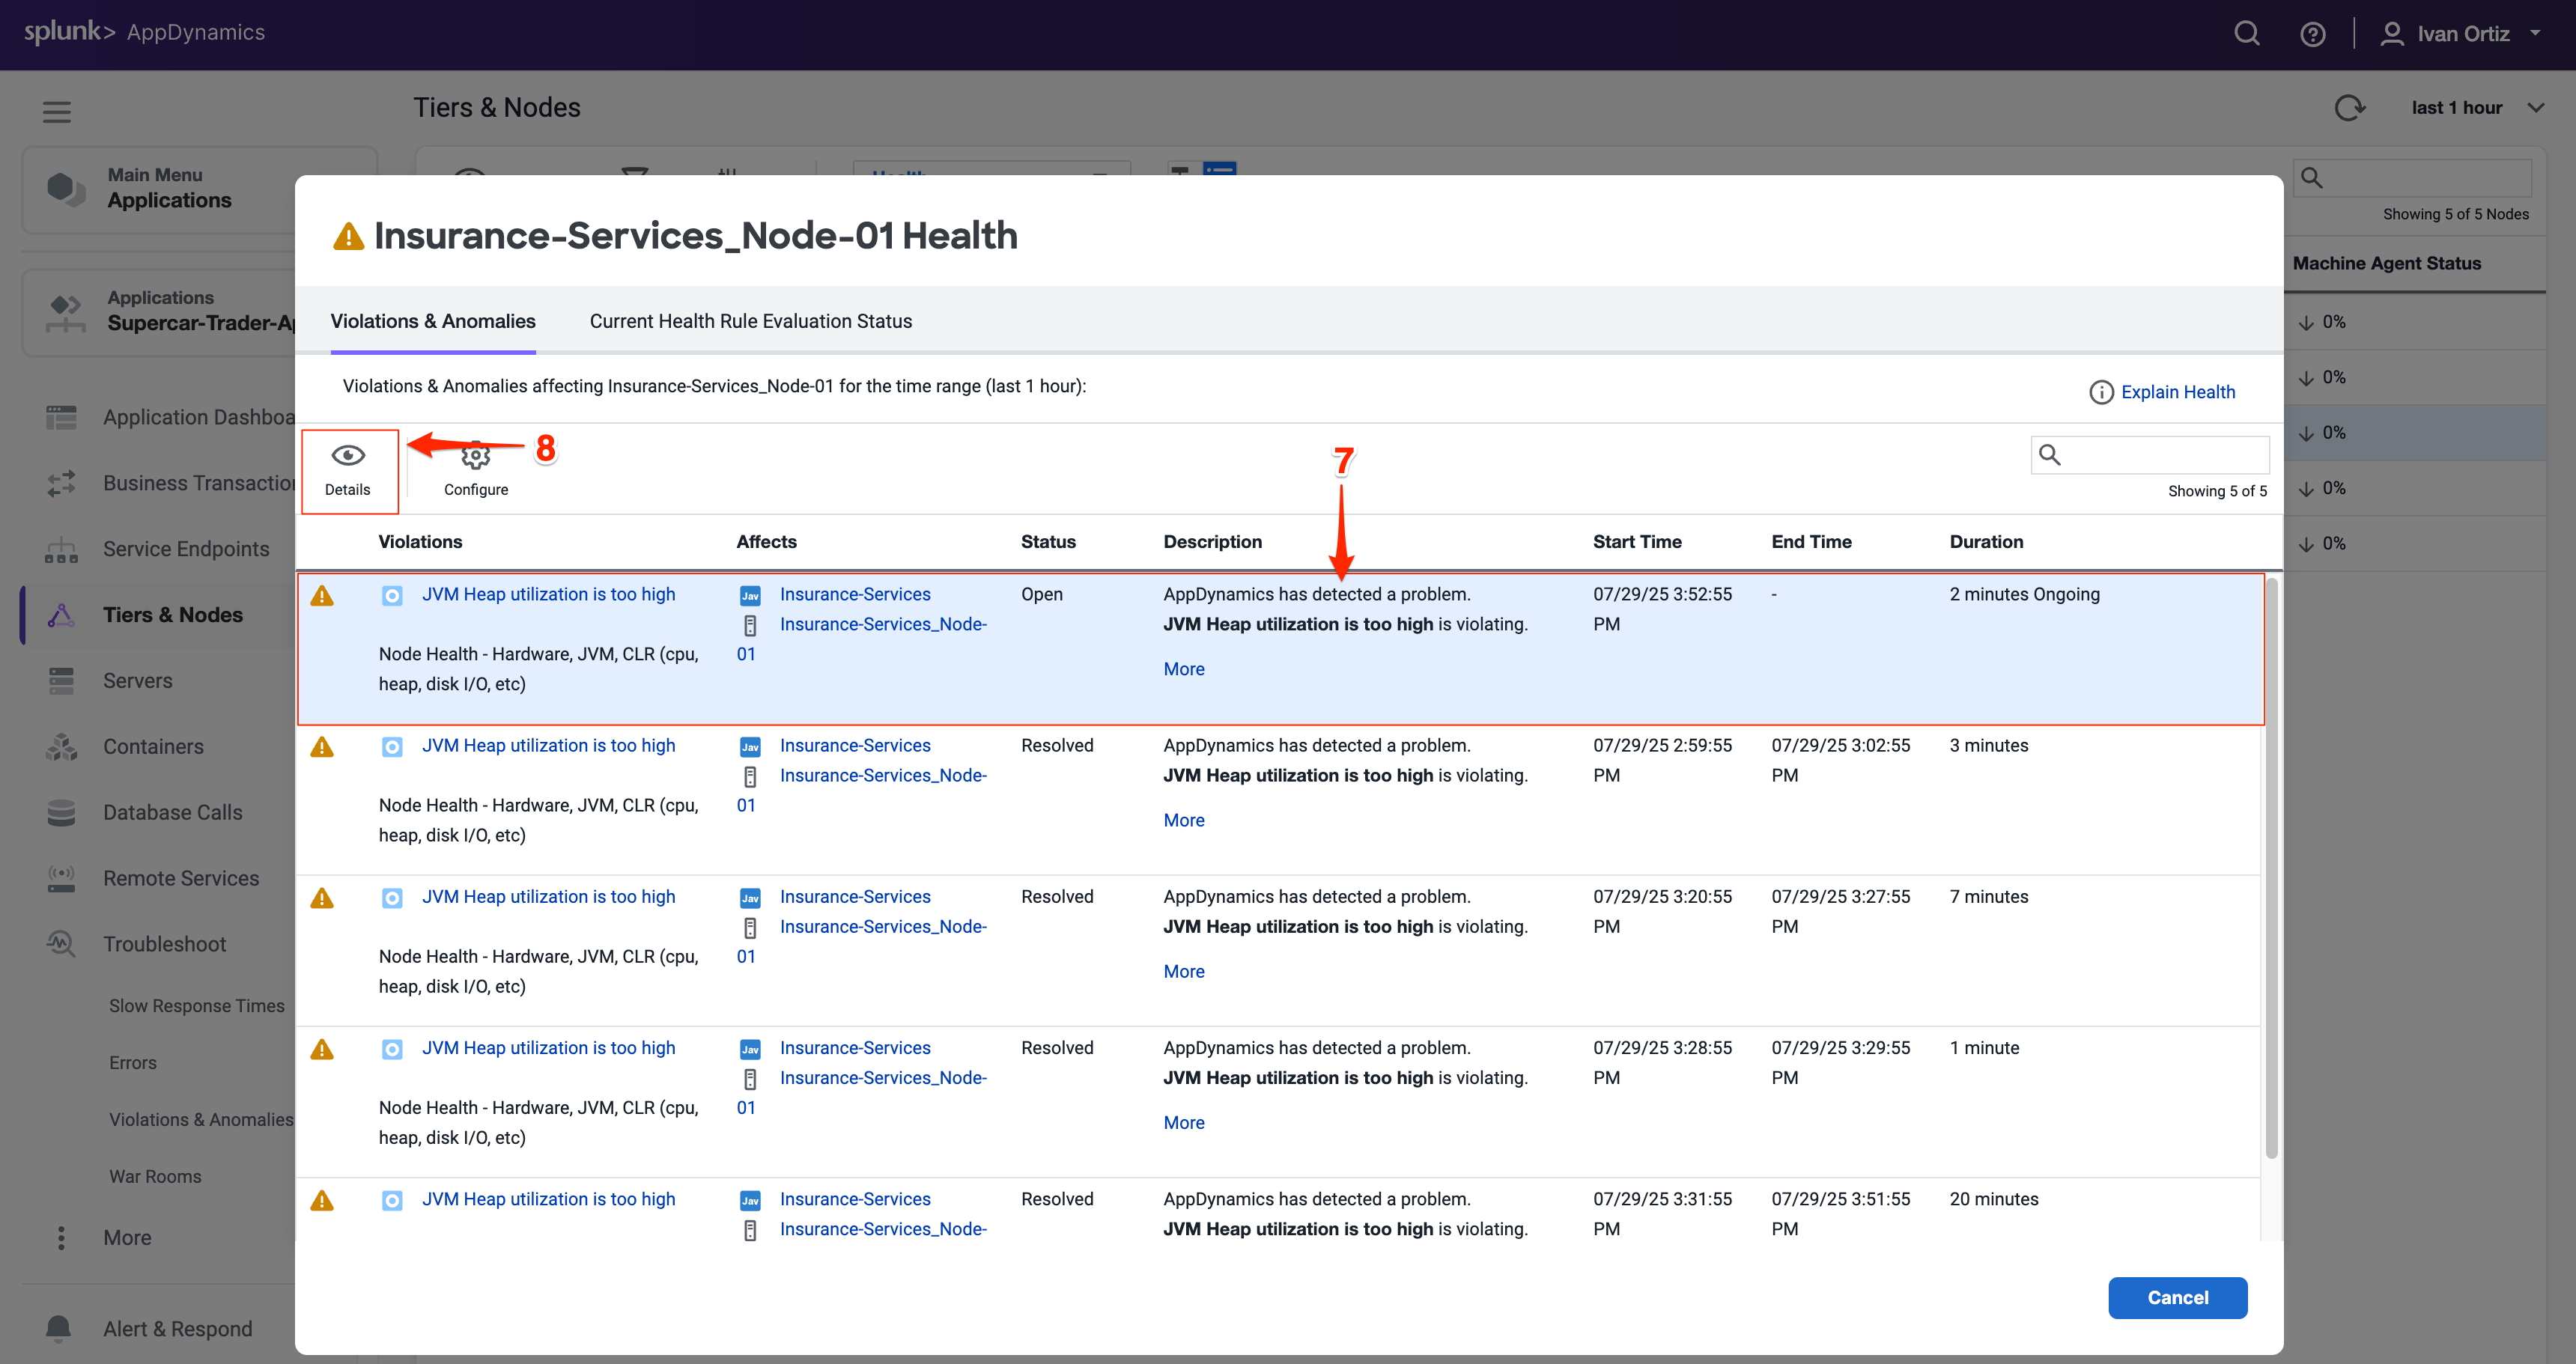
Click on the warning icon for the Insurance-Services_Node-01 Node.
Review the Health Rule Violations summary and click on violation descriptions.
Click on the Details button to see the details.
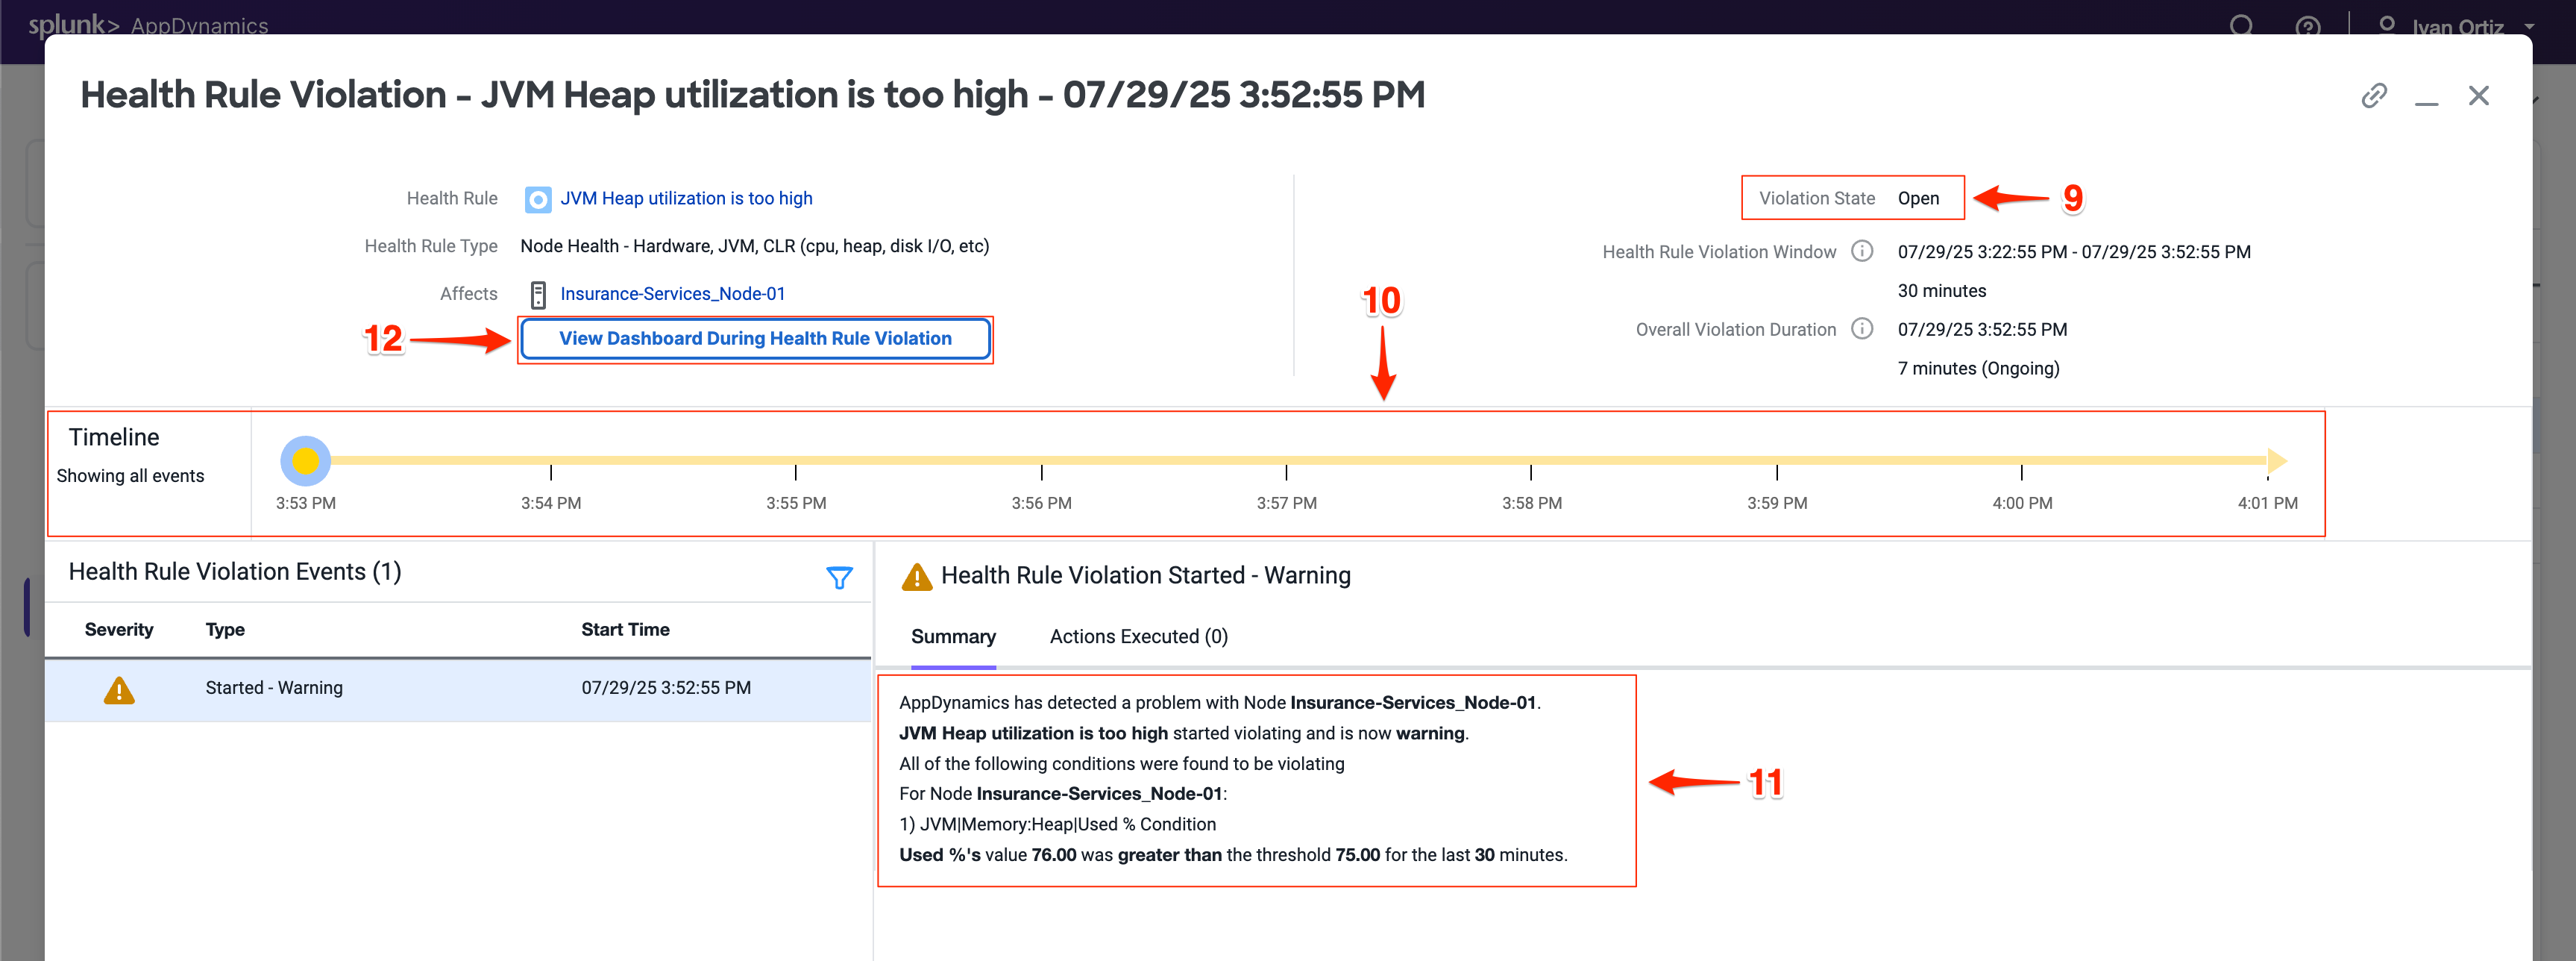
The Health Rule Violation details viewer shows you:
The current state of the violation.
The timeline of when the violation was occurring.
The specifics of what the violation is and the conditions that triggered it.
Click on the View Dashboard During Health Rule Violation to see node metrics at the time of the issue. Correlating violations with performance metrics aids diagnosis.
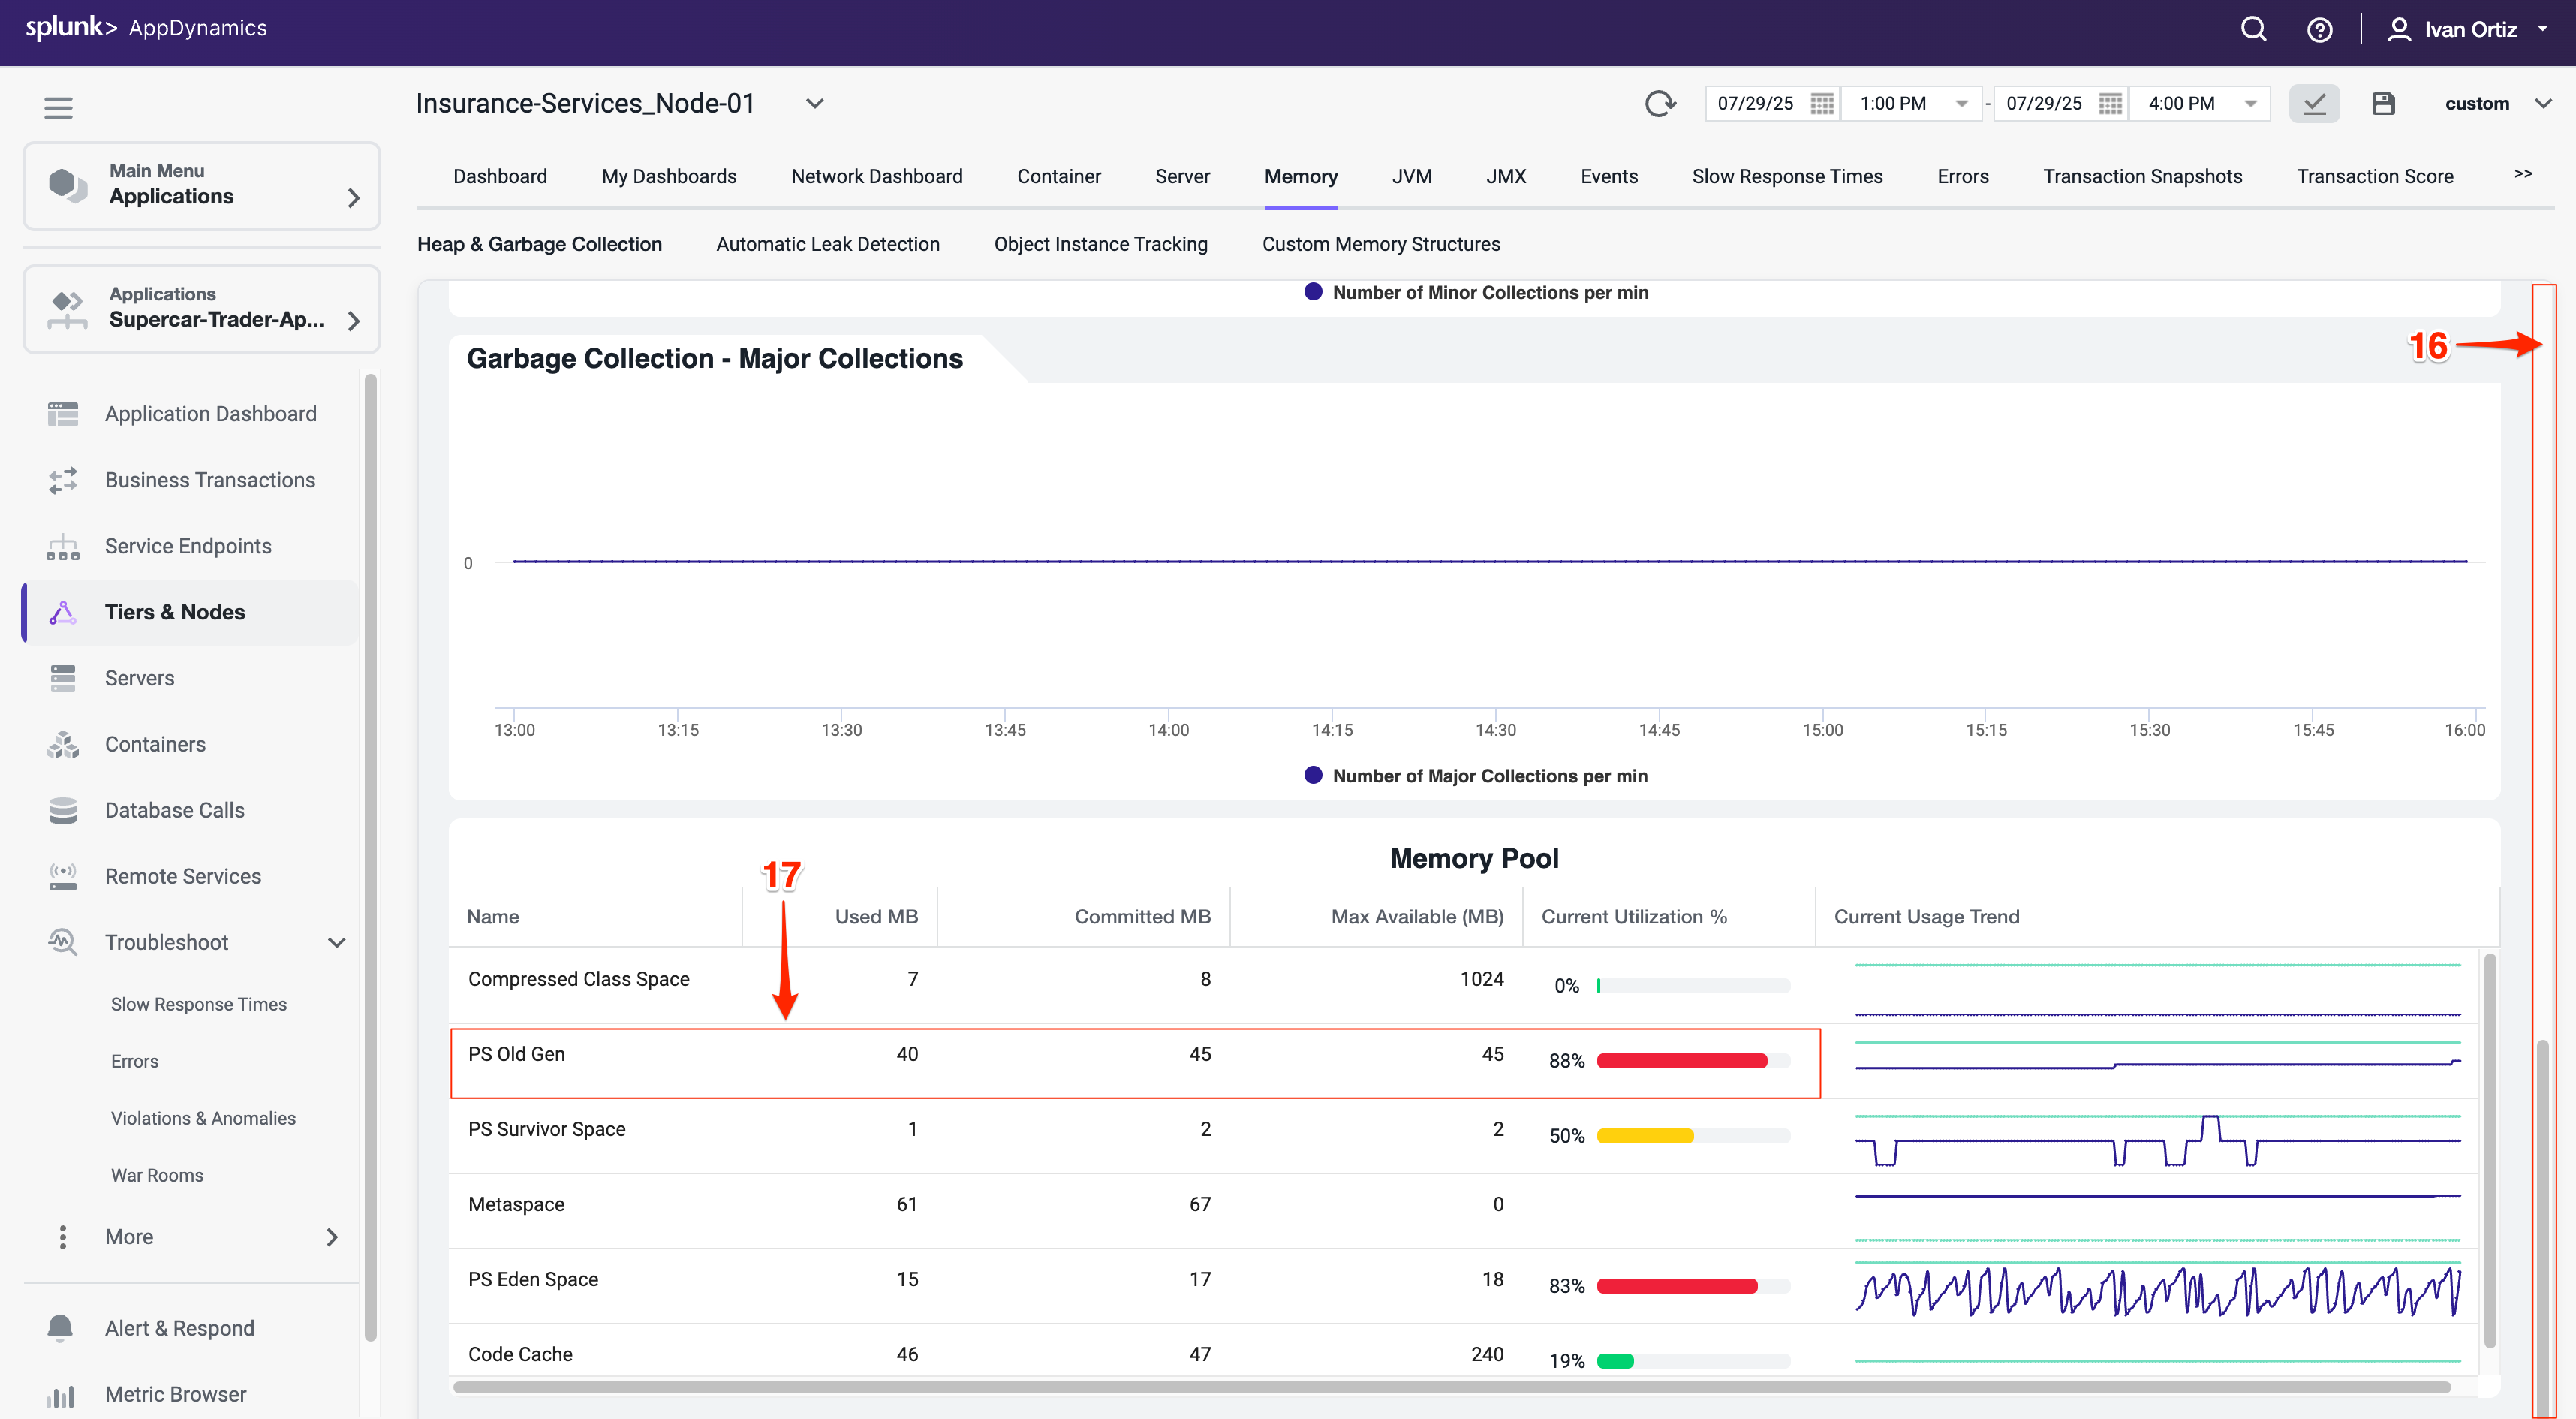
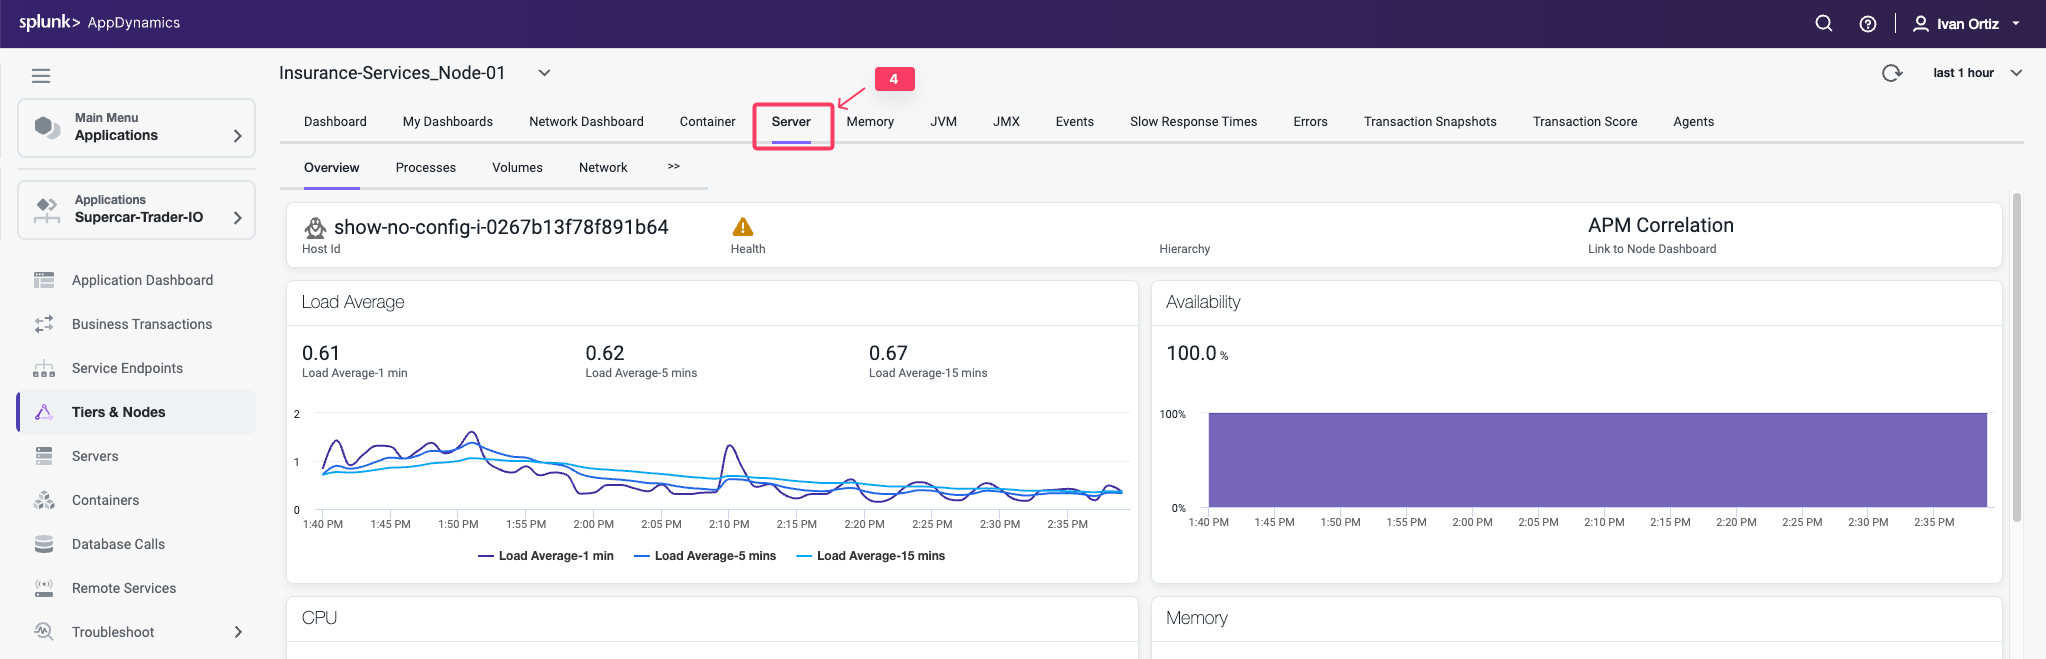
When you click on the View Dashboard During Health Rule Violation button, it opens the Server tab of the Node dashboard by default.
If you haven’t installed the AppDynamics Server Visibility Monitoring agent yet then you won’t see the resource metrics for the host of the Node. You will be able to see those metrics in the next lab. The AppDynamics Java agent collects memory metrics from the JVM via JMX.
Investigate the JVM heap data using the steps below.
Click on the Memory tab.
Look at the current heap utilization.
Notice the Major Garbage Collections that have been occurring.
Note: If you have an issue seeing the Memory screen, try using an alternate browser (Firefox should render correctly for Windows, Linux, and Mac).

Use the outer scroll bar to scroll to the bottom of the screen.
Note high PS Old Gen memory usage as a potential sign of memory leaks or inefficient garbage collection. Identifying memory pressure early can prevent outages.
You can read more about Node and JVM monitoring here and here.
Summary
In this lab, you learned how to effectively use AppDynamics to identify and troubleshoot application errors and node health issues. You started by locating specific errors and exceptions using the Errors dashboard, understanding their frequency, types, and impact on your application. You drilled down into error snapshots and stack traces to pinpoint the root cause of failures.
Next, you explored node health monitoring by interpreting visual indicators on the Application Dashboard and investigating Health Rule Violations. You learned to analyze JVM memory metrics to detect potential performance bottlenecks related to garbage collection and heap usage.
Together, these skills enable proactive monitoring and rapid troubleshooting to maintain application performance and reliability.
Server Visibility Monitoring
2 minutes
Prerequsites
This is a continuation of the Application Performance Monitoring lab. Verify that your application is running and has load for the past hour. If needed return to the Generate Application Load section to restart the load generator.
Objectives
In this Lab you will learn about AppDynamics Server Visibility Monitoring and Service Availability Monitoring.
When you have completed this lab, you will be able to:
Download the AppDynamics Server Visibility Agent.
Install the AppDynamics Server Visibility Agent.
Monitor server health.
Understand the agent’s extended hardware metrics.
Quickly see underlying infrastructure issues impacting your application performance.
Workshop Environment
The lab environment has two hosts:
The first host runs the AppDynamics Controller and will be referred to from this point on as the Controller.
The second host runs the Supercar Trader application used in the labs. It will be the host where you will install the AppDynamics agents and will be referred to from this point on as the Application VM.
The purpose of Supercar-Trader collection is to generate dynamic traffic (business transactions) for AppDynamics Controller.
Subsections of Server Visibility Monitoring
Deploy Machine Agent
5 minutes
In this exercise you will perform the following actions:
Run a script that will install the Machine agent
Configure the Machine agent
Start the Machine agent
Note
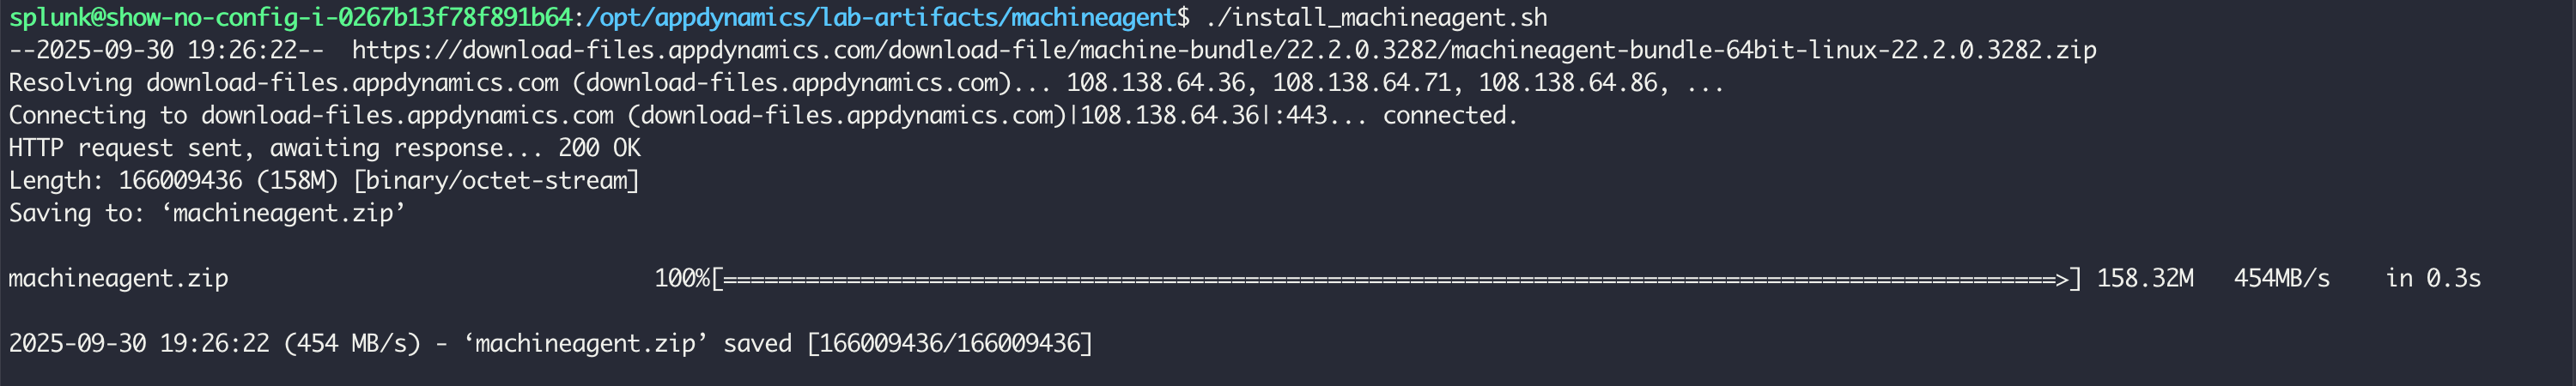
We will use a script to download the machine agent into your EC2 instance. Normally, you would have to download the machine agent by logging into https://accounts.appdynamics.com/ but due to potential access limitations we will use the script which downloads it directly from the portal. If you have access to the AppDynamics portal and would like to download the machine agent, you can follow the below steps to download it and reference the steps used in the Install Agent section of the APM lab to SCP it into your VM.
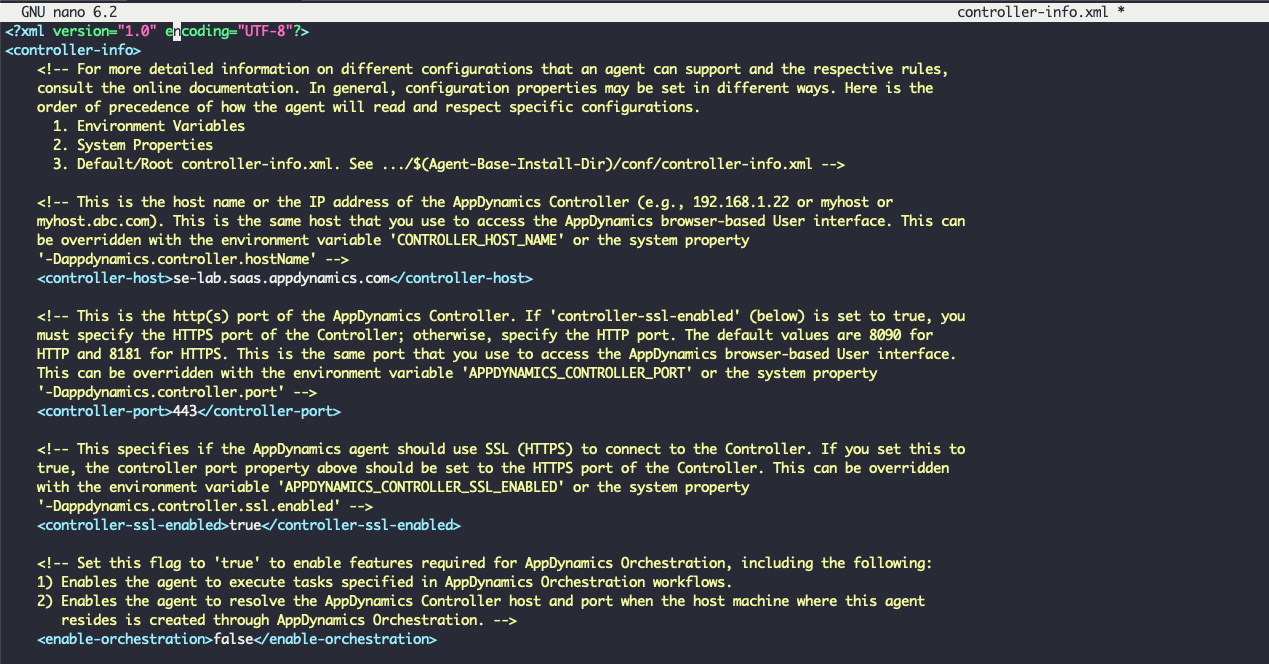
Edit the “controller-info.xml” file of the machine Agent and insert the values for the properties you obtained from the Java Agent configuration file, listed below.
controller-host
controller-port
controller-ssl-enabled
account-name
account-access-key
You will need to set the “sim-enabled” property to true and then save the file which should look similar to the image below.
cd /opt/appdynamics/machineagent/conf
nano controller-info.xml
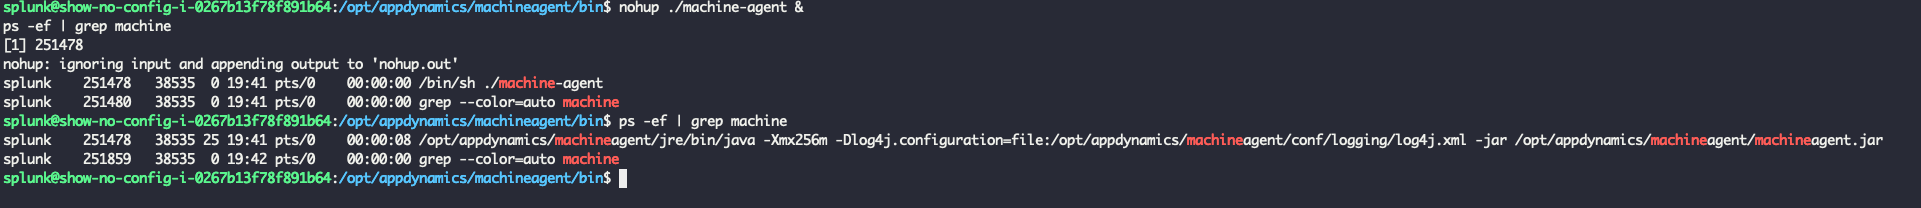
Start the Server Visibility agent
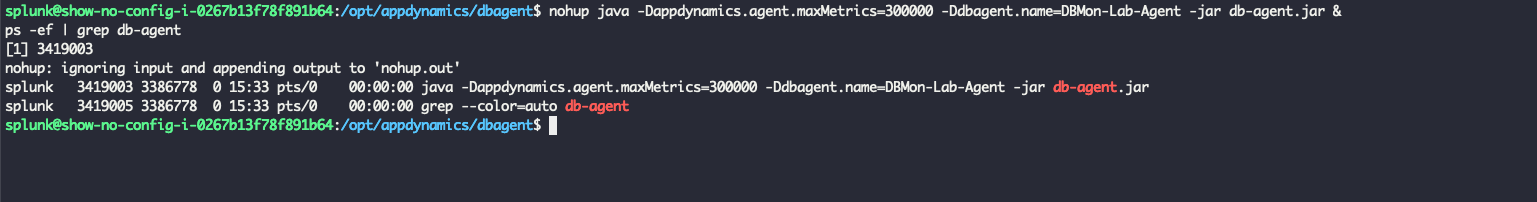
Use the following commands to start the Server Visibility agent and verify that it started.
cd /opt/appdynamics/machineagent/bin
nohup ./machine-agent &ps -ef | grep machine
You should see output similar to the following image.
Monitor Server Health
2 minutes
In this exercise you will complete the following tasks:
Review the Server Main dashboard
Review the Server Processes dashboard
Review the Server Volumes dashboard
Review the Server Network dashboard
Navigate between Server and Application contexts
Review the Server Main Dashboard
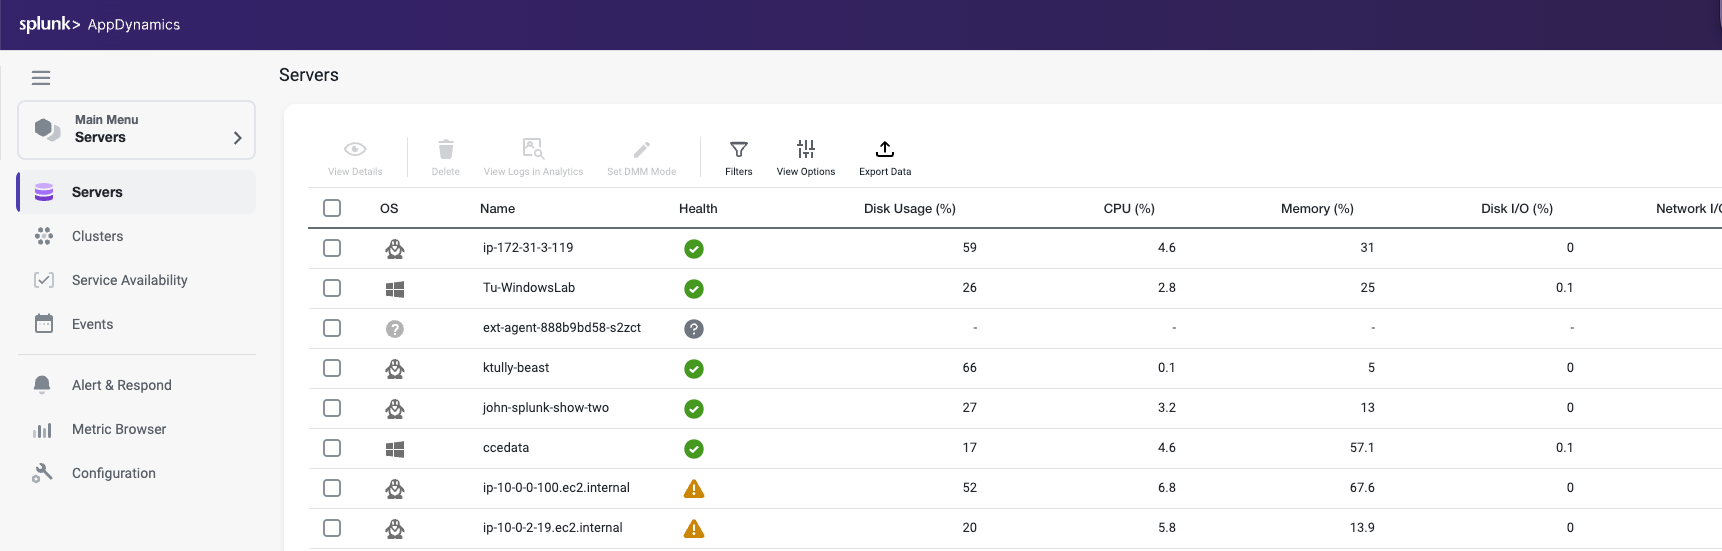
Now that you have the Machine agent installed, let’s take a look at some of the features available in the Server Visibility module. From your Application Dashboard, click on the Servers tab and drill into the servers main dashboard by following these steps.
Click the Servers tab on the left menu.
Check the checkbox on the left for your server.
Click View Details.
You can now explore the server dashboard. This dashboard enables you to perform the following tasks:
See charts of key performance metrics for the selected monitored servers, including:
Server availability
CPU, memory, and network usage percentages
Server properties
Disk, partition, and volume metrics
Top 10 processes consuming CPU resources and memory.
You can read more about the Server Main dashboard here.
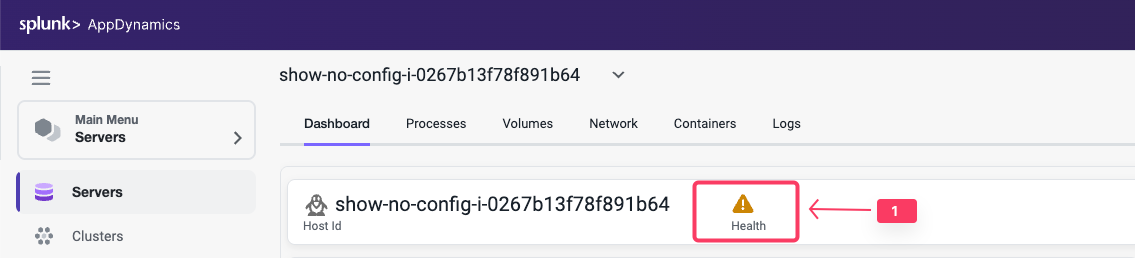
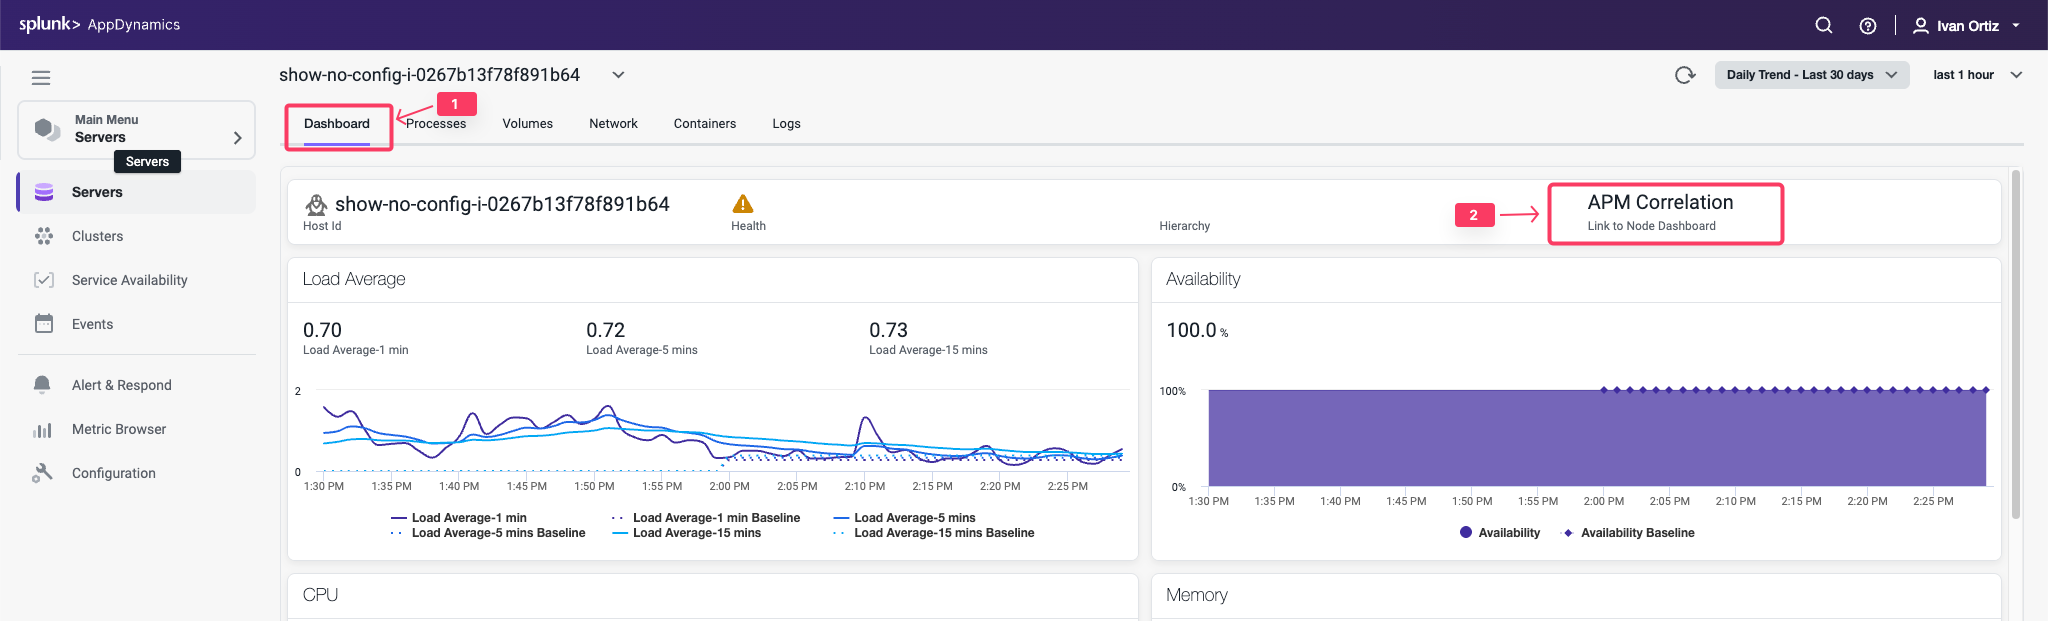
Review the Top Pane of the dashboard which provides you the following information:
Host Id: This is an ID for the server that is unique to the Splunk AppDynamics Controller
Health: Shows the overall health of the server.
Hierachy: Arbitrary hierarchy to group your severs together. See documentation for additional details here
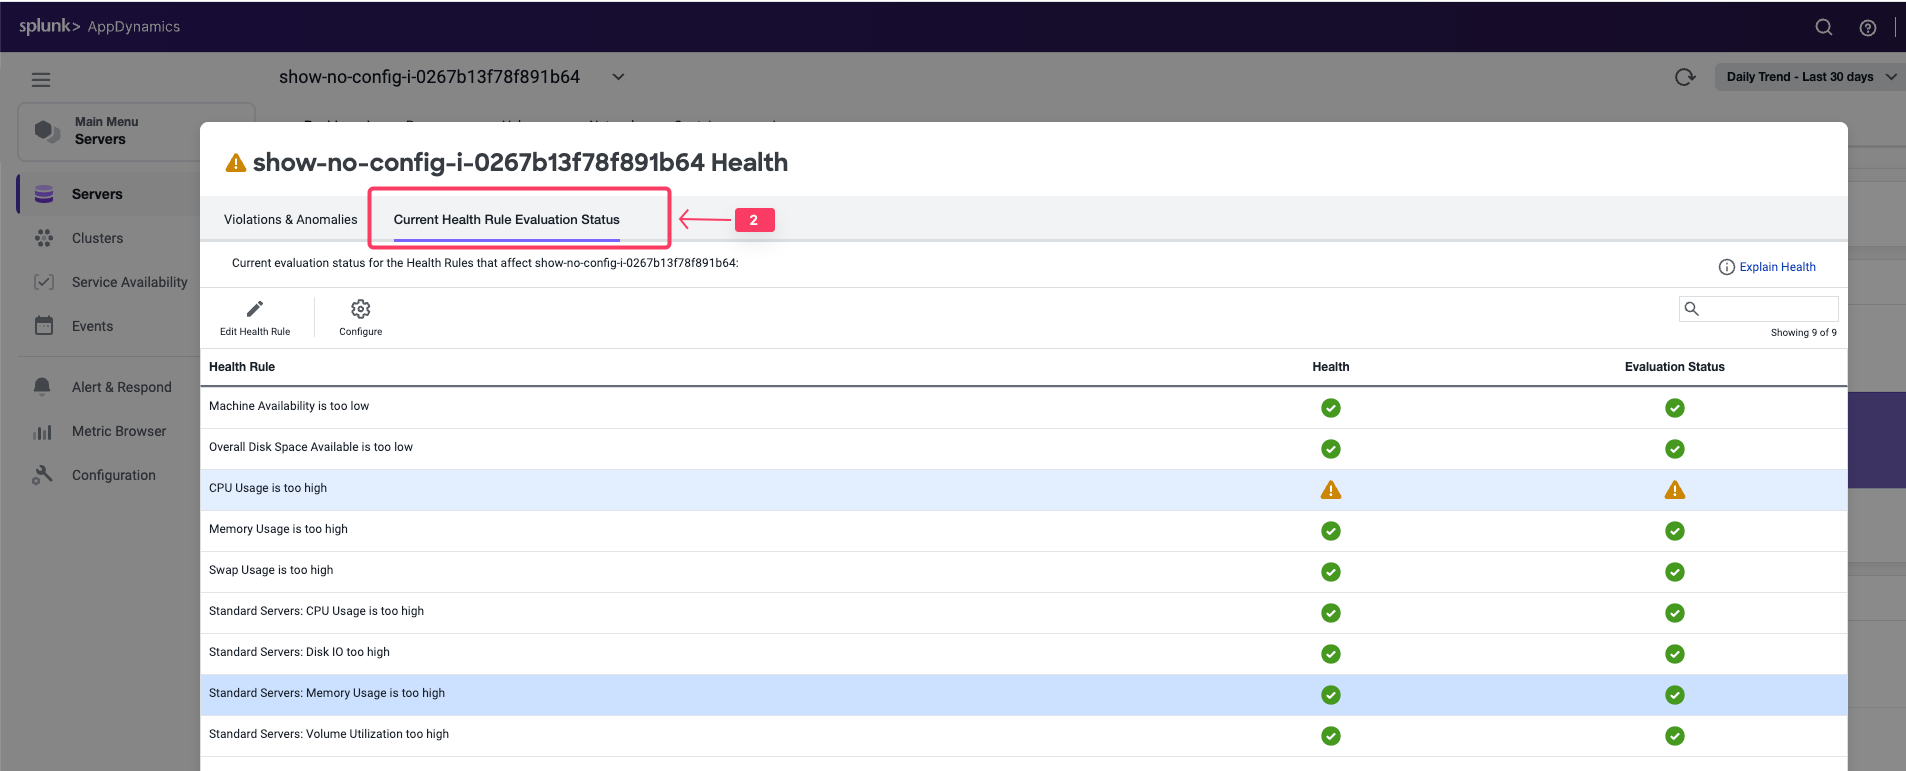
Click on the health server icon to view the Violations * Anomalies panel. Review the panel to identify potential issues
Click on the Current Health Rule Evaluation Status to see if there are any current issues being alerted on for this server
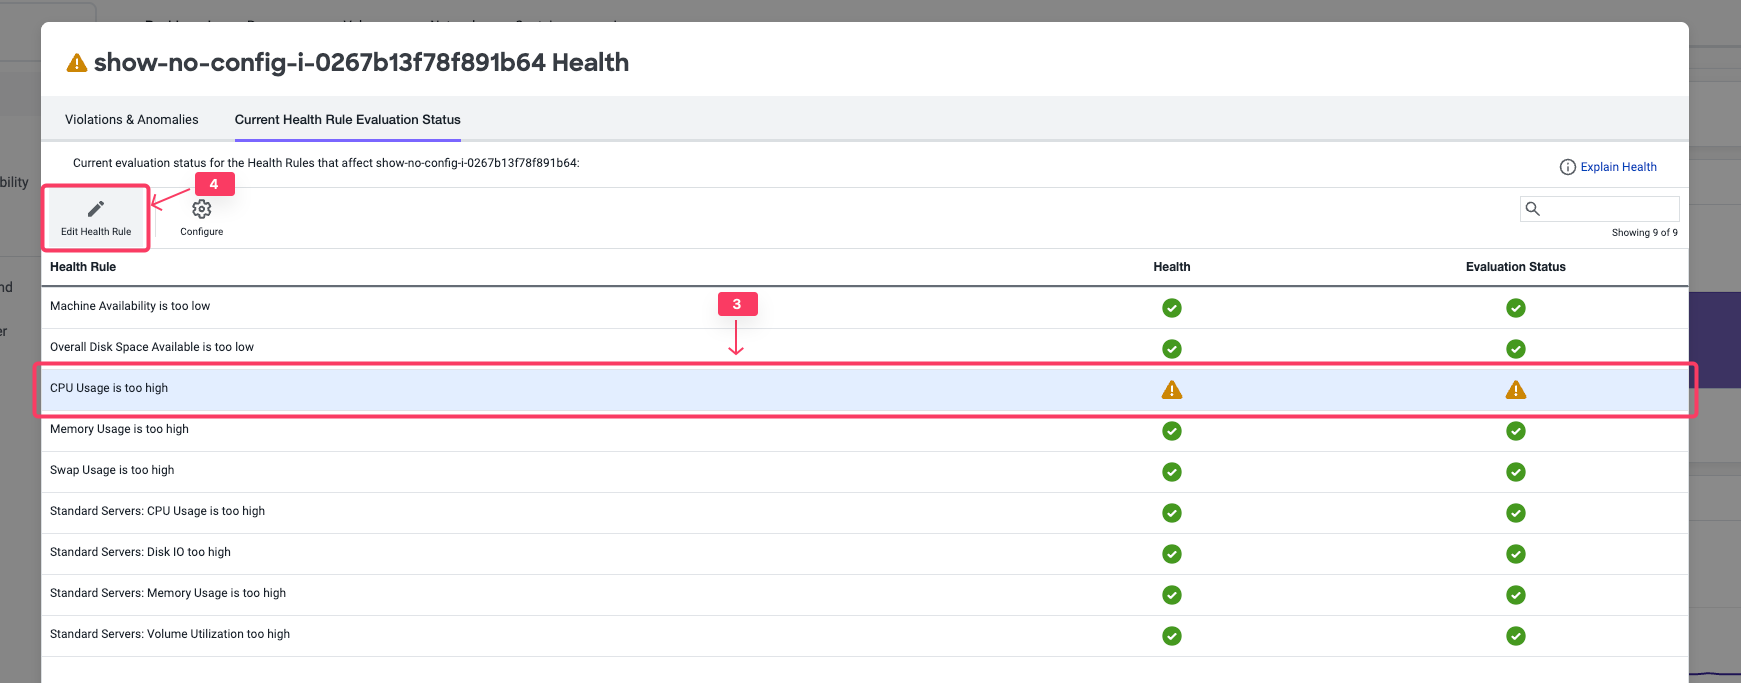
Click on the CPU Usage too high rule
Click on Edit Health Rule. This will open the Edit Health Rule panel
This panel gives us the ability to configure the Health Rule. A different lab will go into more details on creating and customizing health rules. For now we will just review the existing rule
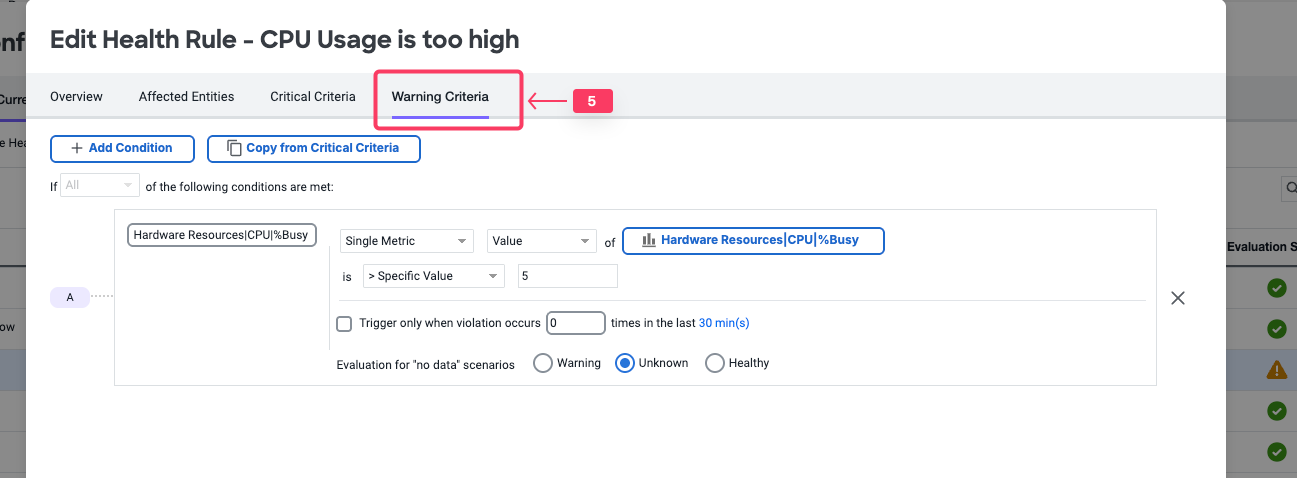
Click on the Warning Criteria
In this example we can see that the warning criteria is set when the CPU is above 5%. This is the reason why our health rule is showing a warning and not a healthy state. Cancel out of the Edit Health Rule panel to get back to the Server Dashboard
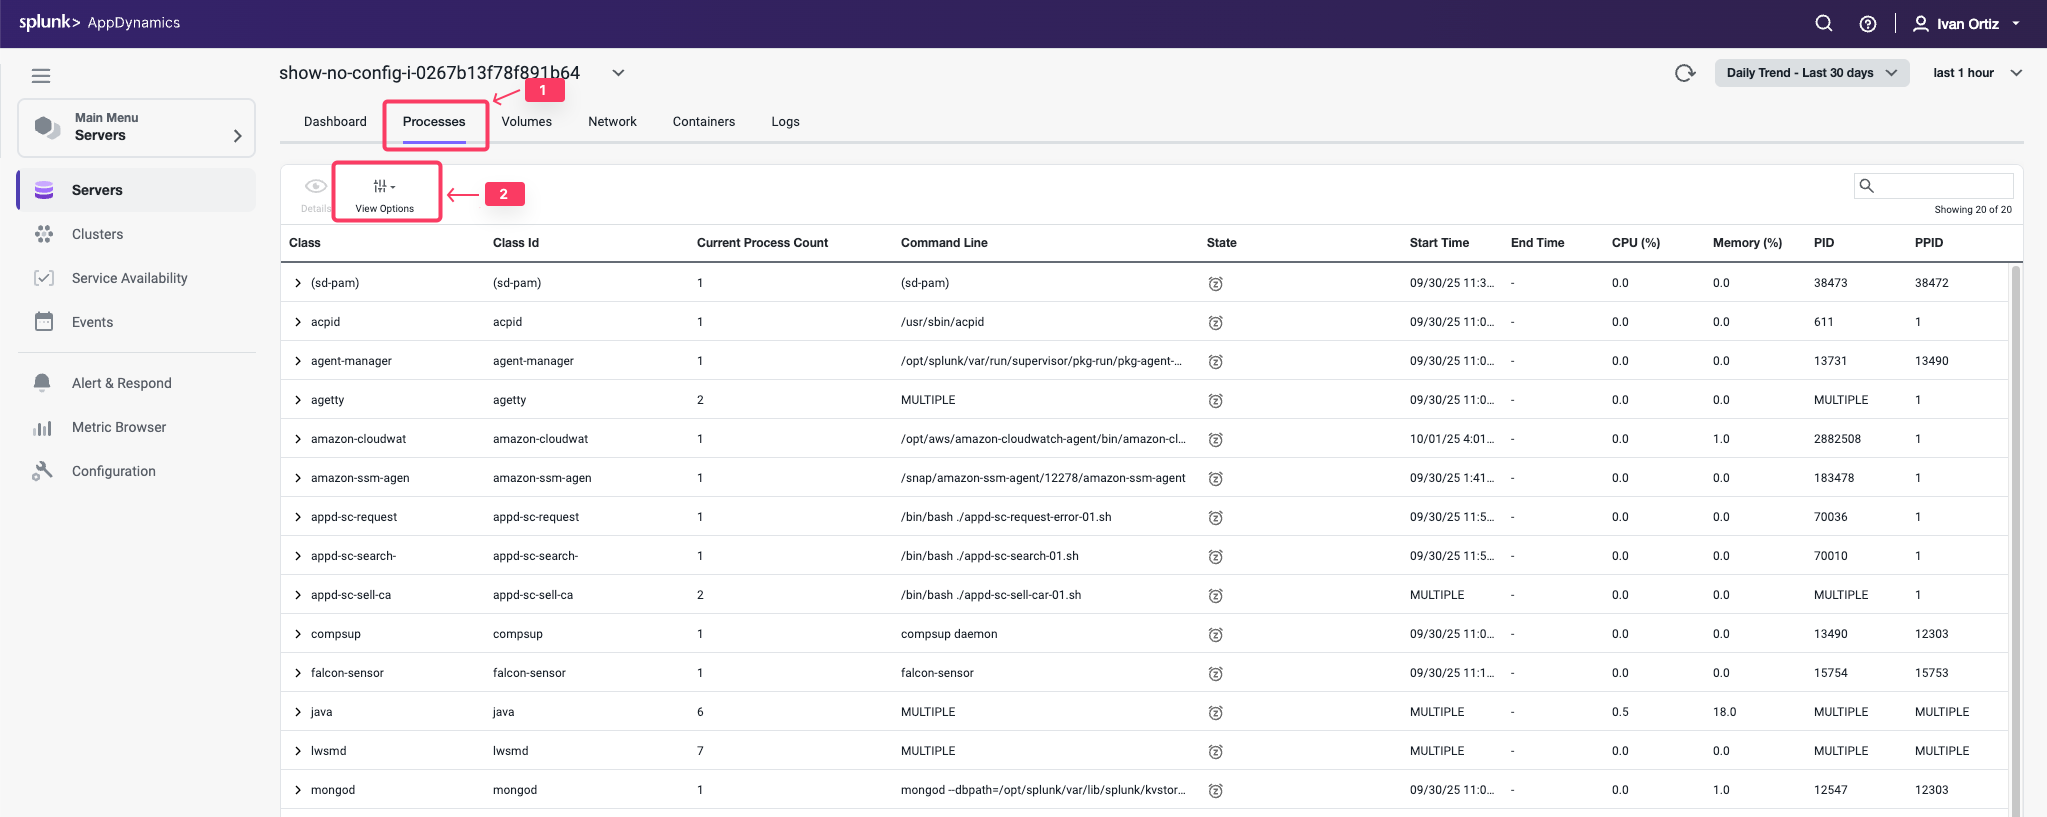
Review the Server Processes Dashboard
Click the Processes tab.
Click View Options to select different data columns. Review the KPIs available to view
You can now explore the server processes dashboard. This dashboard enables you to perform the following tasks:
View all the processes active during the selected time period. The processes are grouped by class as specified in the ServerMonitoring.yml file.
View the full command line that started this process by hovering over the process entry in the Command Line column.
Expand a process class to see the processes associated with that class.
Use View Options to configure which columns to display in the chart.
Change the time period of the metrics displayed.
Sort the chart using the columns as a sorting key. You can not sort on sparkline charts: CPU Trend and Memory Trend.
See CPU and Memory usage trends at a glance.
You can read more about the Server Processes dashboard here.
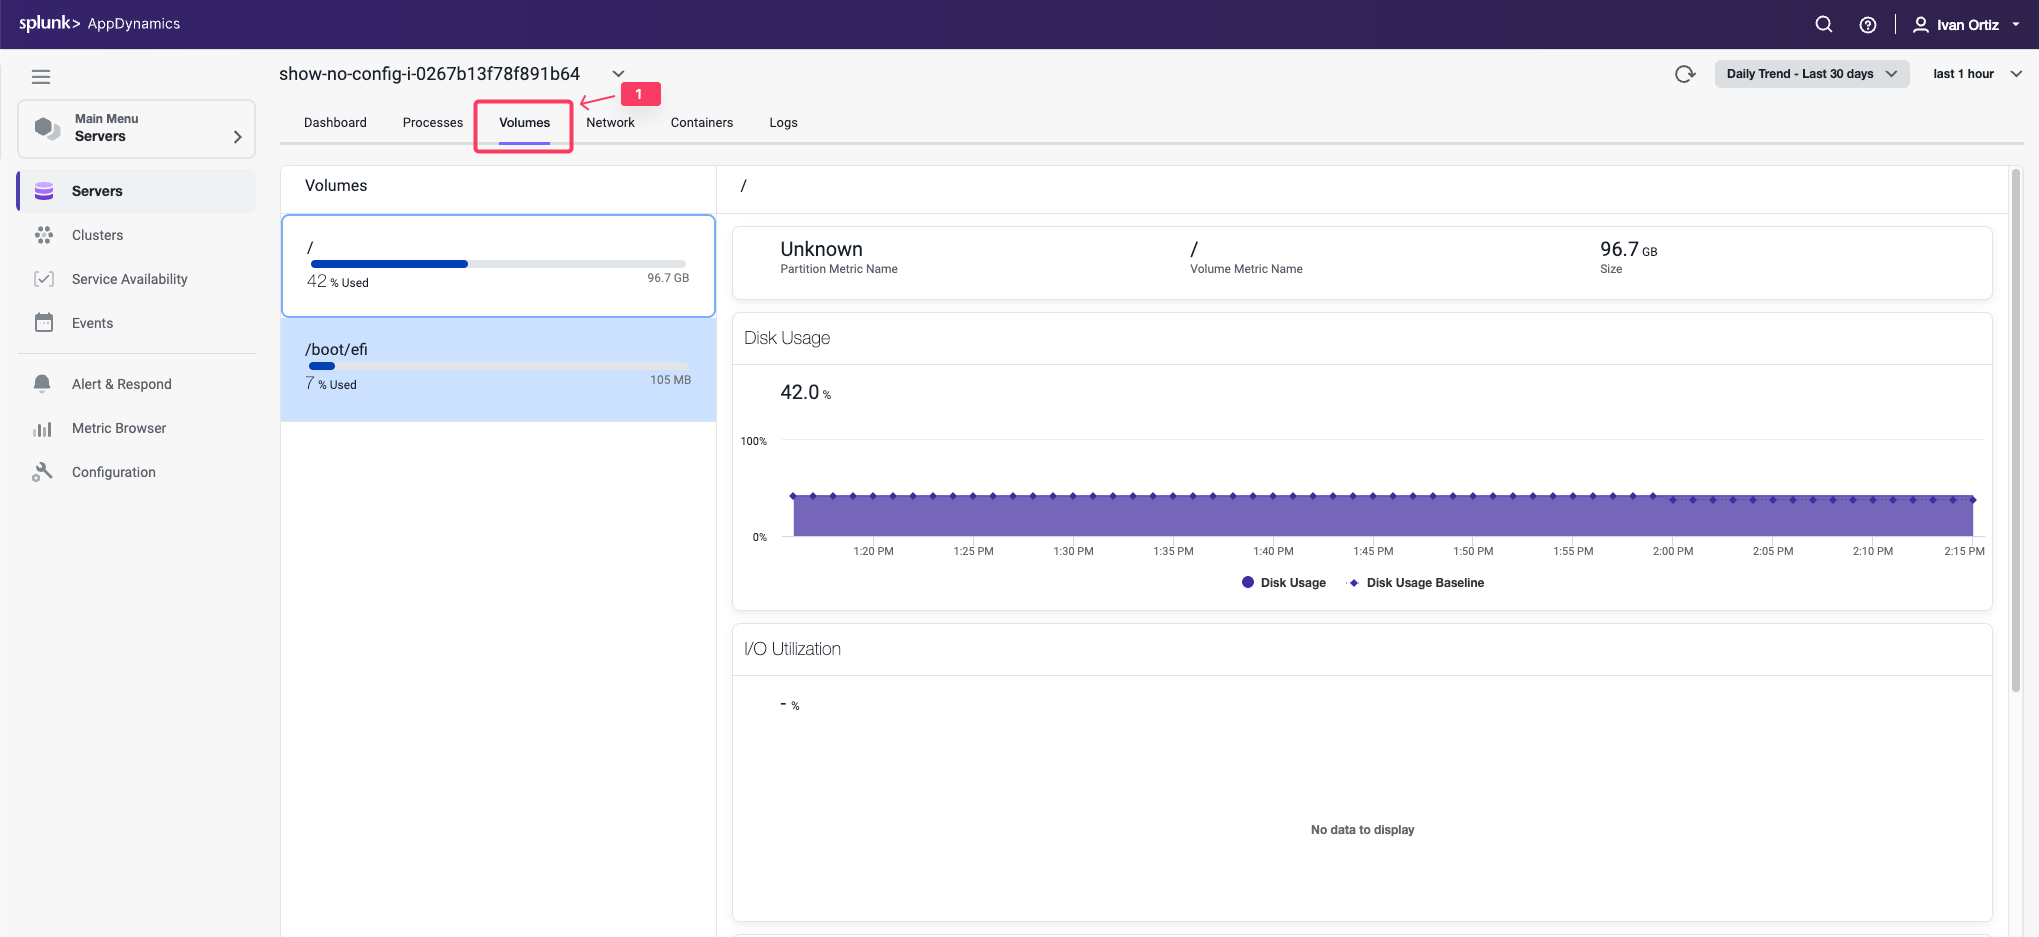
Review the Server Volumes Dashboard
Click the Volumes tab.
You can now explore the server volumes dashboard. This dashboard enables you to perform the following tasks:
See the list of volumes, the percentage used and total storage space available on the disk, partition or volume.
See disk usage and I/O utilization, rate, operations per second, and wait time.
Change the time period of the metrics collected and displayed.
Click on any point on a chart to see the metric value for that time.
You can read more about the Server Volumes dashboard here.
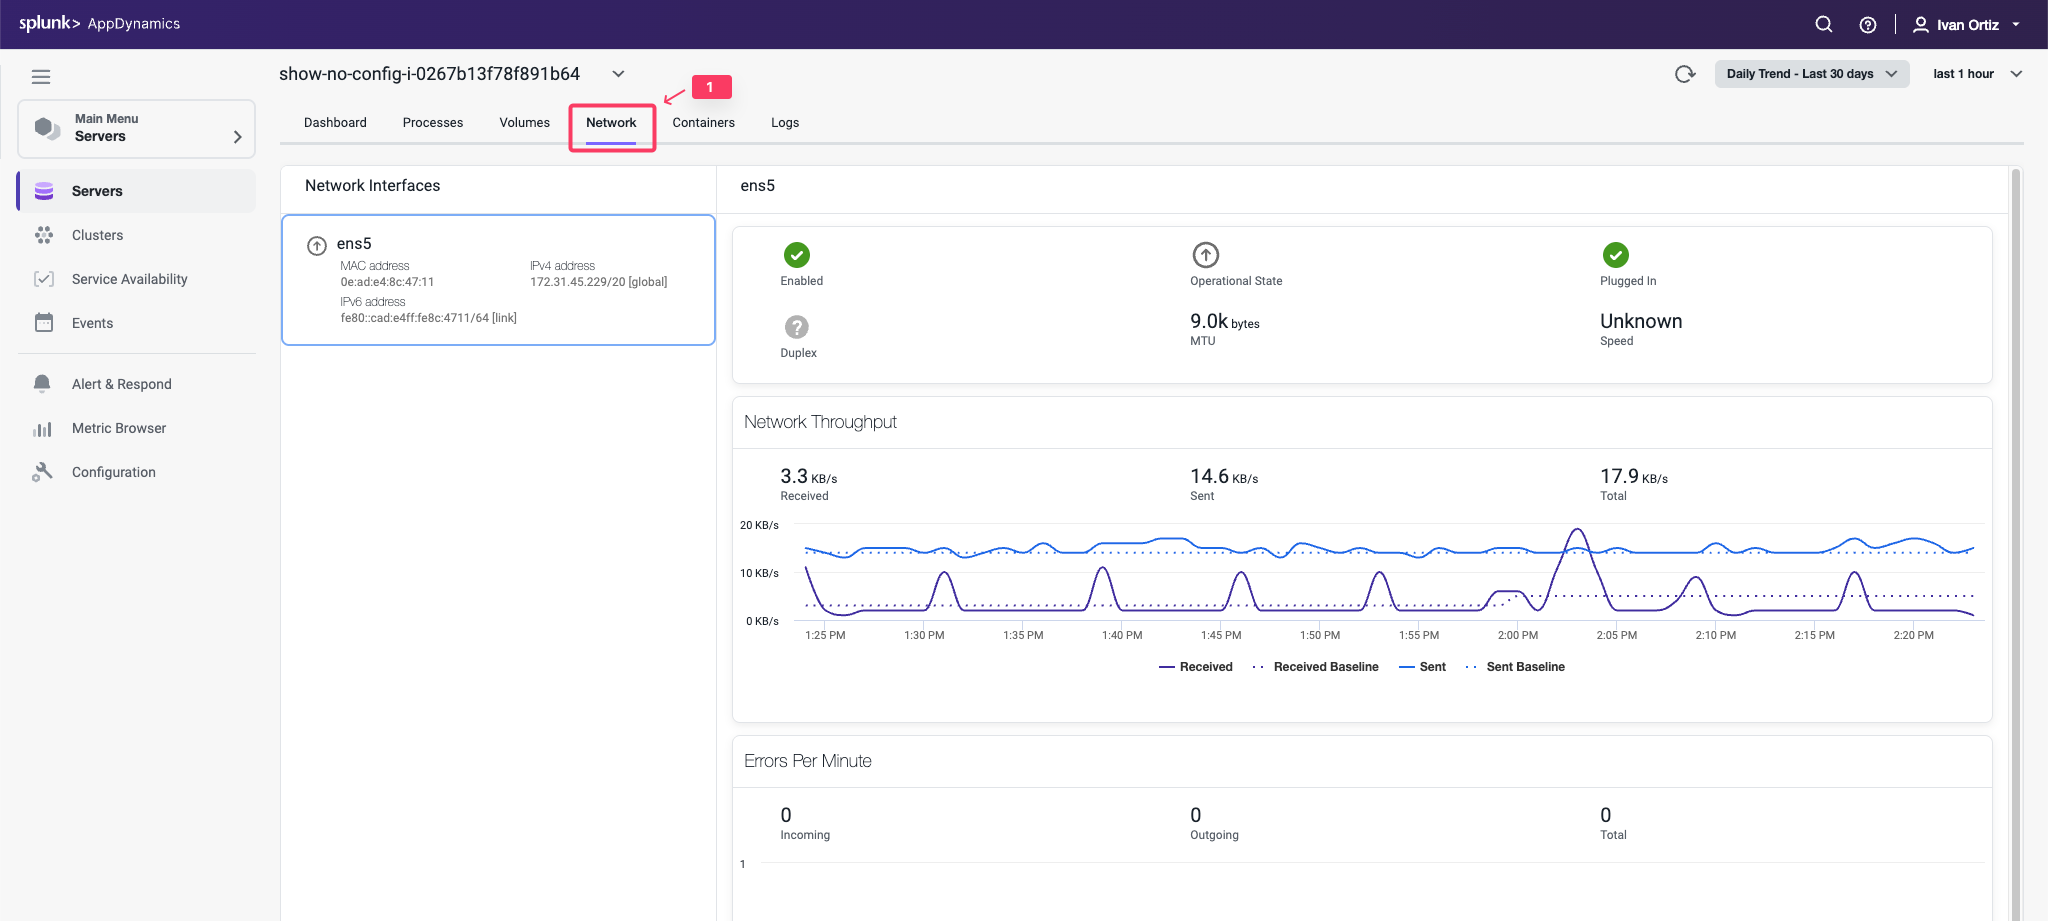
Review the Server Network Dashboard
Click the Network tab.
You can now explore the Server Network dashboard. This dashboard enables you to perform the following tasks:
See the MAC, IPv4, and IPv6 address for each network interface.
See whether or not the network interface is enabled, functional, its operational state equipped with an ethernet cable that is plugged in, operating in full or half-full duplex mode, maximum transmission unit (MTU) or size (in bytes) of the largest protocol data unit that the network interface can pass, speed of the ethernet connection in Mbit/sec.
View network throughput in kilobytes/sec and packet traffic.
Change the time period of the metrics displayed.
Hover over on any point on a chart to see the metric value for that time.
You can read more about the Server Network dashboard here.
Correlate Between Server and APM
3 minutes
Navigate between Server and Application Contexts
The Server Visibility Monitoring agent automatically associates itself with any Splunk AppDynamics APM agents running on the same host.
With Server Visibility enabled, you can access server performance metrics in the context of your applications. You can switch between server and application contexts in different ways. Follow these steps to navigate from the server main dashboard to one of the Nodes running on the server.
Click the Dashboard tab to return to the main Server Dashboard.
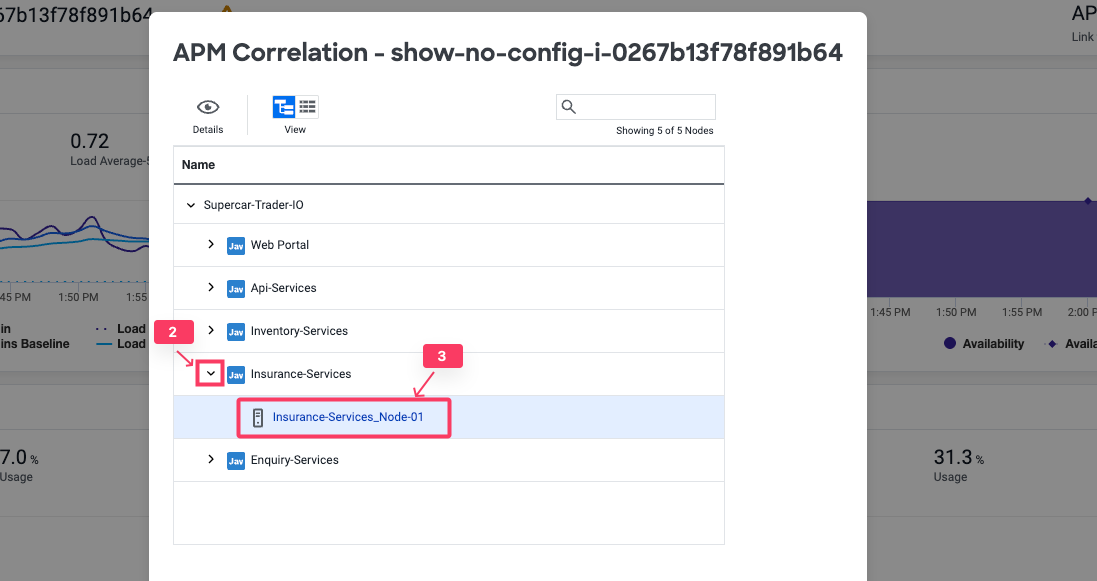
Click the APM Correlation link.
Click the down arrow on one of the listed Tiers.
Click the Node of the Tier link.
You are now on the Node Dashboard.
Click the Server tab to see the related host metrics
When you have the Server Visibility Monitoring agent installed, the host metrics are always available within the context of the related Node.
You can read more about navigating between Server and Application Contexts here.
Business iQ
2 minutes
Objectives
In this Learning Lab you learn about AppDynamics Business iQ.
When you have completed this lab, you will be able to:
Enable analytics with the new Agentless Analytics Java Agent (v 4.5.15 +).
Configure HTTP data collectors.
Configure method invocation data collectors.
Understand dashboard components.
Build a business dashboard.
Workshop Environment
The lab environment has two hosts:
The first host runs the AppDynamics Controller and will be referred to from this point on as the Controller.
The second host runs the Supercar Trader application used in the labs. It will be the host where you will install the AppDynamics agents and will be referred to from this point on as the Application VM.
Controller VM
Application VM
Subsections of Business iQ
Lab Prerequisite
3 minutes
In this exercise you will complete the following tasks:
Access your AppDynamics Controller from your web browser.
Verify transaction load to the application.
Restart the application and transaction load if needed.
Verify you see the five different Tiers on the flow map.
Verify there has been consistent load over the last 1 hour.
Check the list of business transactions:
Click the Business Transactions option on the left menu.
Verify you see the eleven business transactions seen below.
Verify that they have some number of calls during the last hour.
Note: If you don’t see the Calls column, you can click the View Options toolbar button to show that column.
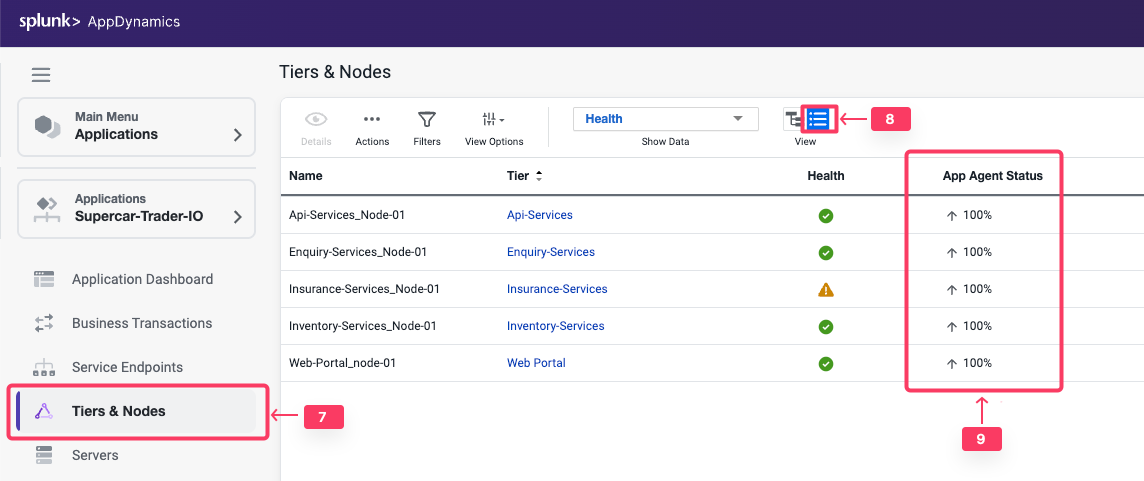
Check the agent status for the Nodes:
Click the Tiers & Nodes option on the left menu.
Click Grid View.
Verify that the App Agent Status for each Node is greater than 90% during the last hour.
Restart the Application and Load Generation if Needed
If any of the checks you performed in the previous steps could not be verified, SSH into your Application VM and follow these steps to restart the application and transaction load.
Use the following commands to stop the running instance of Apache Tomcat.
cd /usr/local/apache/apache-tomcat-9/bin
./shutdown.sh
Use the command below to check for remaining application JVMs still running.
ps -ef | grep Supercar-Trader
If you find any remaining application JVMs still running, kill the remaining JVMs using the command below.
sudo pkill -f Supercar-Trader
Use the following commands to stop the load generation for the application. Wait until all processes are stopped.
cd /opt/appdynamics/lab-artifacts/phantomjs
./stop_load.sh
Restart the Tomcat server:
cd /usr/local/apache/apache-tomcat-9/bin
./startup.sh
Wait for two minutes and use the following command to ensure Apache Tomcat is running on port 8080.
Use the following commands to start the load generation for the application.
cd /opt/appdynamics/lab-artifacts/phantomjs
./start_load.sh
You should see output similar to the following image.
Enable Analytics on the Application
2 minutes
Analytics formerly required a separate agent that was bundled with Machine Agent. However, Analytics is now agentless and embedded in the APM Agent for both .NET Agent >= 20.10 and Java Agent >= 4.5.15 on Controllers >= 4.5.16
In this exercise you will access your AppDynamics Controller from your web browser and enable the Agentless Analytics from there.
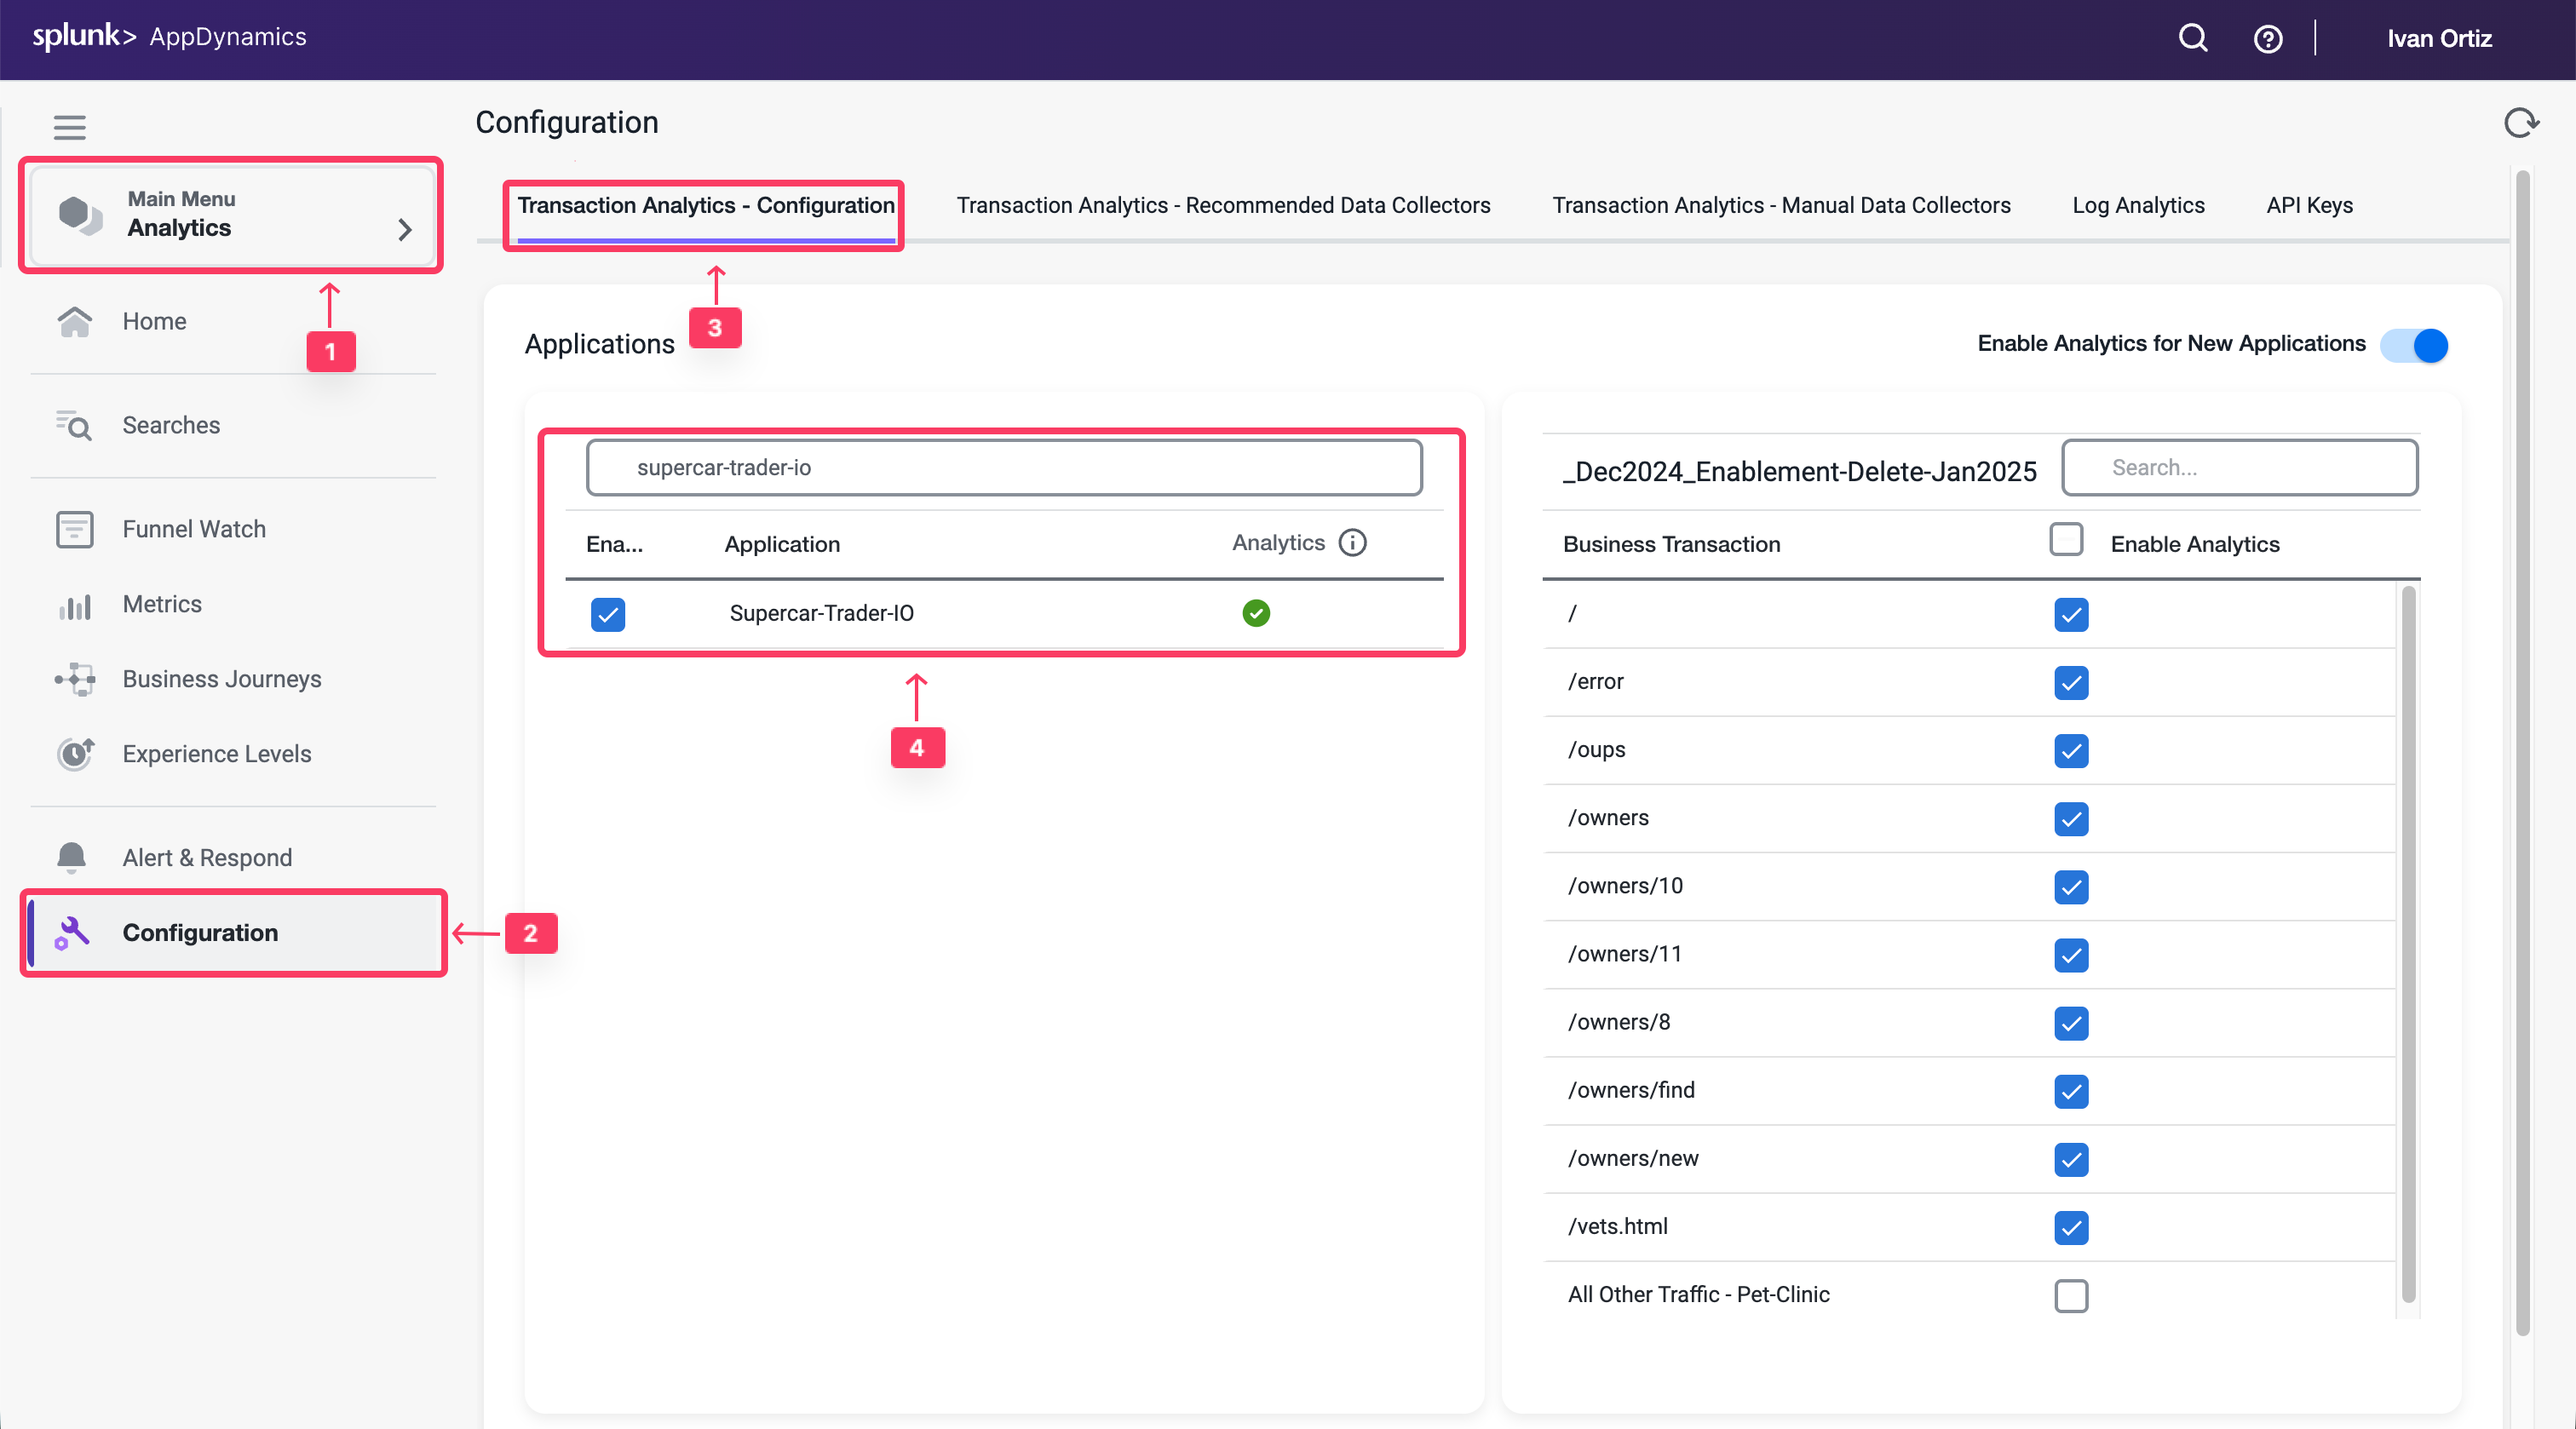
** Select the Analytics tab at the top left of the screen.
** Select the Configuration Left tab.
** Select the Transaction Analytics - Configuration tab.
** Mark the Checkbox next to Your Application Supercat-Trader-YOURINITIALS
** Click the Save button
Validate Transaction Summary
You want to verify that Analytics is working for that application and showing transactions.
Select the Analytics tab tab on the left menu.
Select the Home tab.
Under Transactions from filter to your application Supercar-Trader-YOURINITIALS
Configure HTTP Data Collectors
2 minutes
Data collectors enable you to supplement business transaction and transaction analytics data with application data. The application data can add context to business transaction performance issues. For example, they show the values of particular parameters or return value for business transactions affected by performance issues, such as the specific user, order, or product.
HTTP data collectors capture the URLs, parameter values, headers, and cookies of HTTP messages that are exchanged in a business transaction.
In this exercise you will perform the following tasks:
Enable all HTTP data collectors.
Observe and Select relevant HTTP data collectors.
Capture Business Data in Analytics using HTTP Params.
Validate Analytics on HTTP Parameters.
Enable all HTTP data collectors
Initially, you can capture all HTTP data collectors to learn which useful parameters you can capture into Analytics and use it in your Dashboards
Tip
It is strongly recommended that you perform this step on a UAT environment, not production.
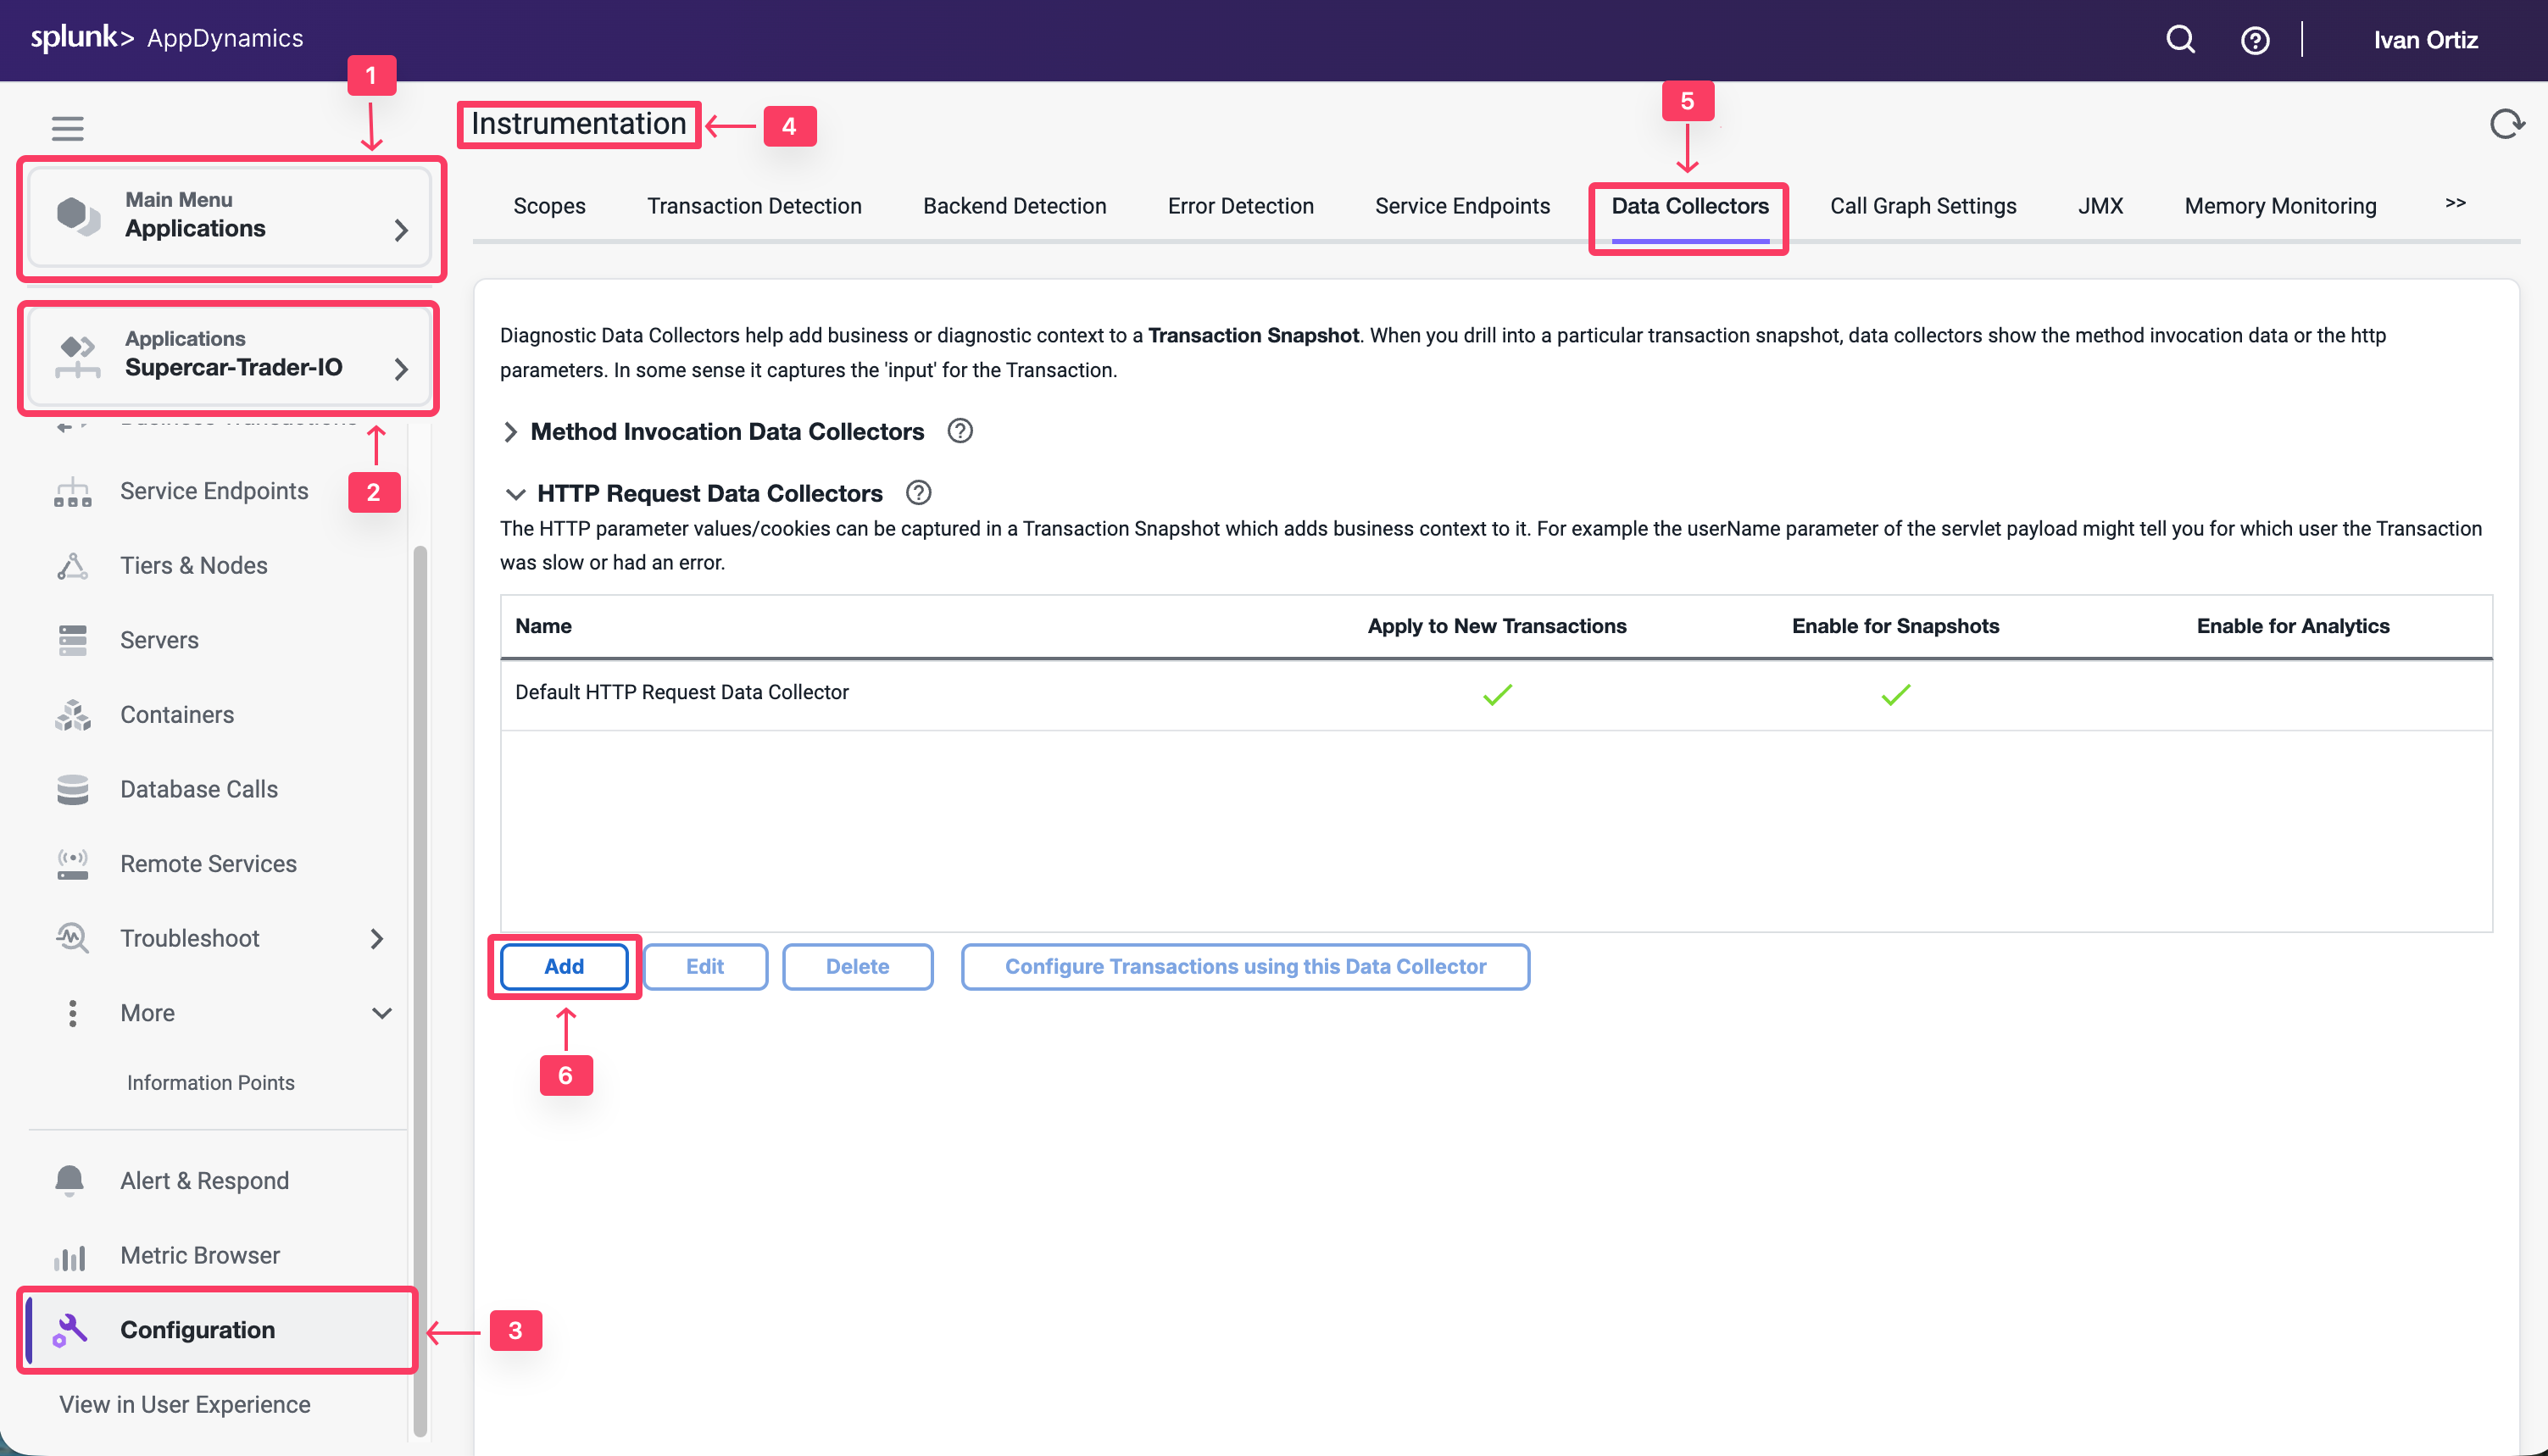
Select the Applications tab at the top left of the screen.
Select the Supercar-Trader-YOURINITIALS Application.
Select the Configuration Left tab.
Click on the Instrumentation Link.
Select the Data Collectors tab.
Click on the Add Button in the HTTP Request Data Collectors
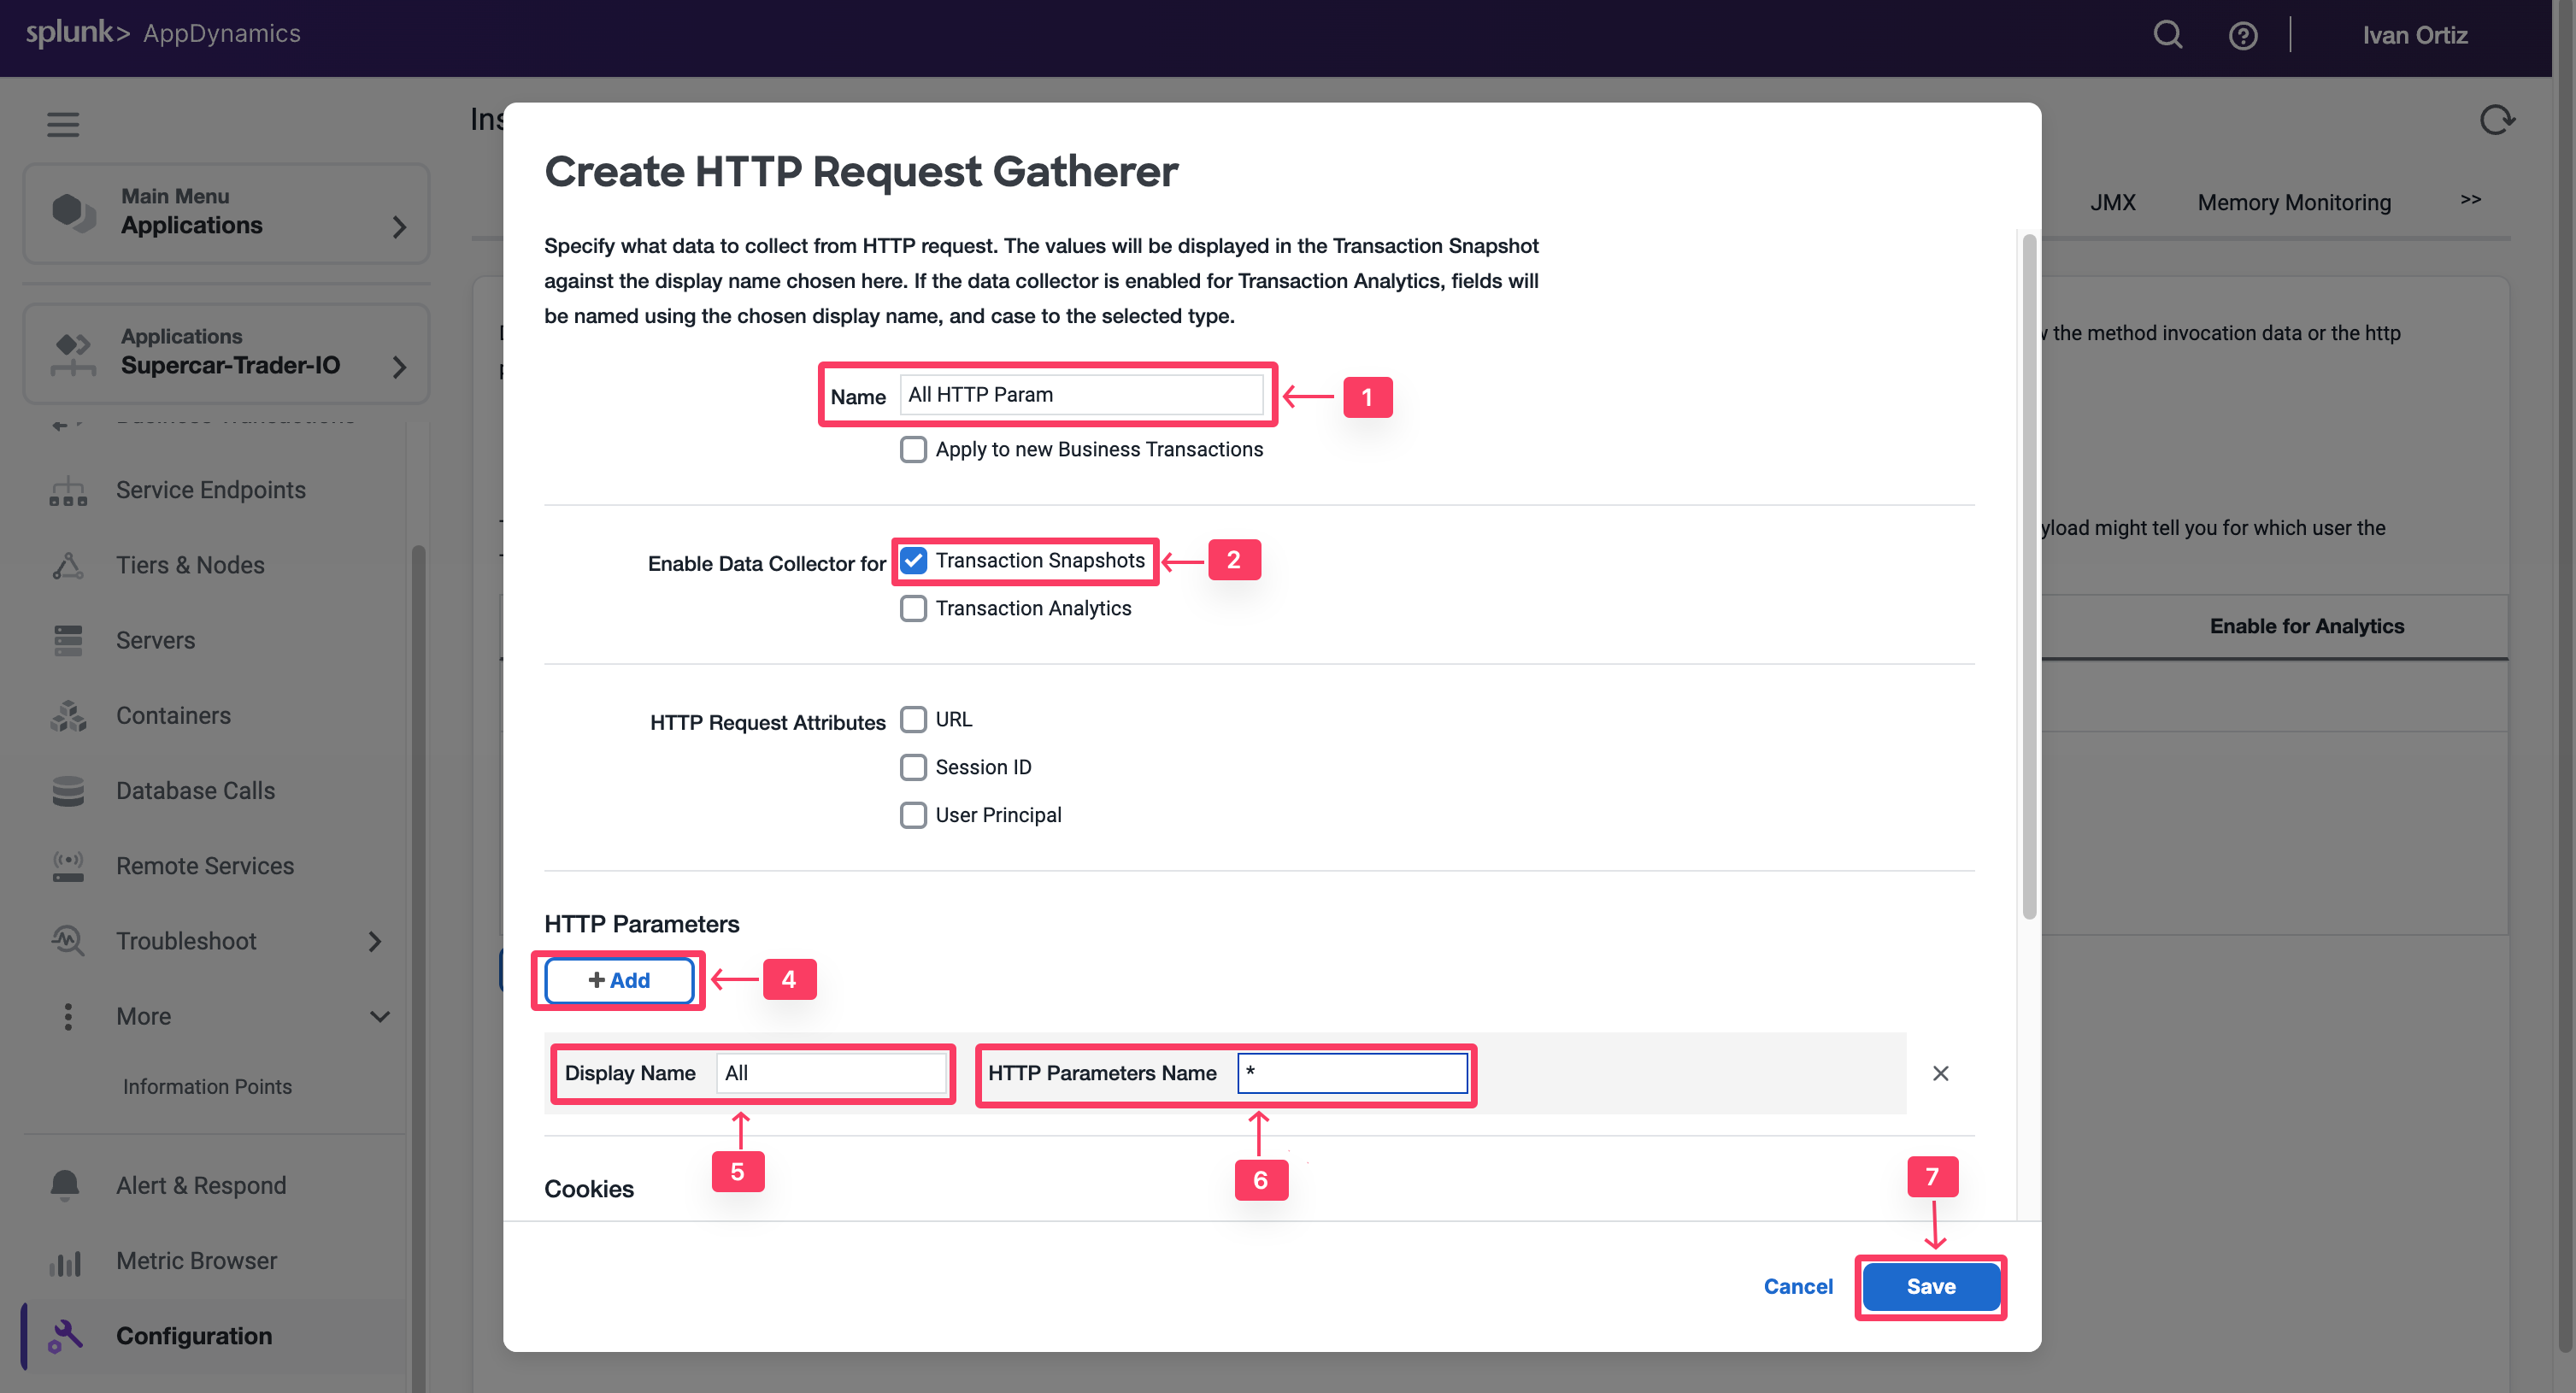
You will now configure an HTTP data collector to capture all HTTP Parameters. You will only enable it on Transaction Snapshots to avoid any overheads until you identify the precise parameters that you need for Transaction Analytics
For the Name, specify All HTTP Param.
Under Enable Data Collector for check the box for Transaction Snapshots.
Do not enable Transaction Analytics.
Click on + Add in the HTTP Parameters section.
For the new Parameter, specify All as the Display Name
Then specify an asterisk * in the HTTP Parameter name.
Click Save
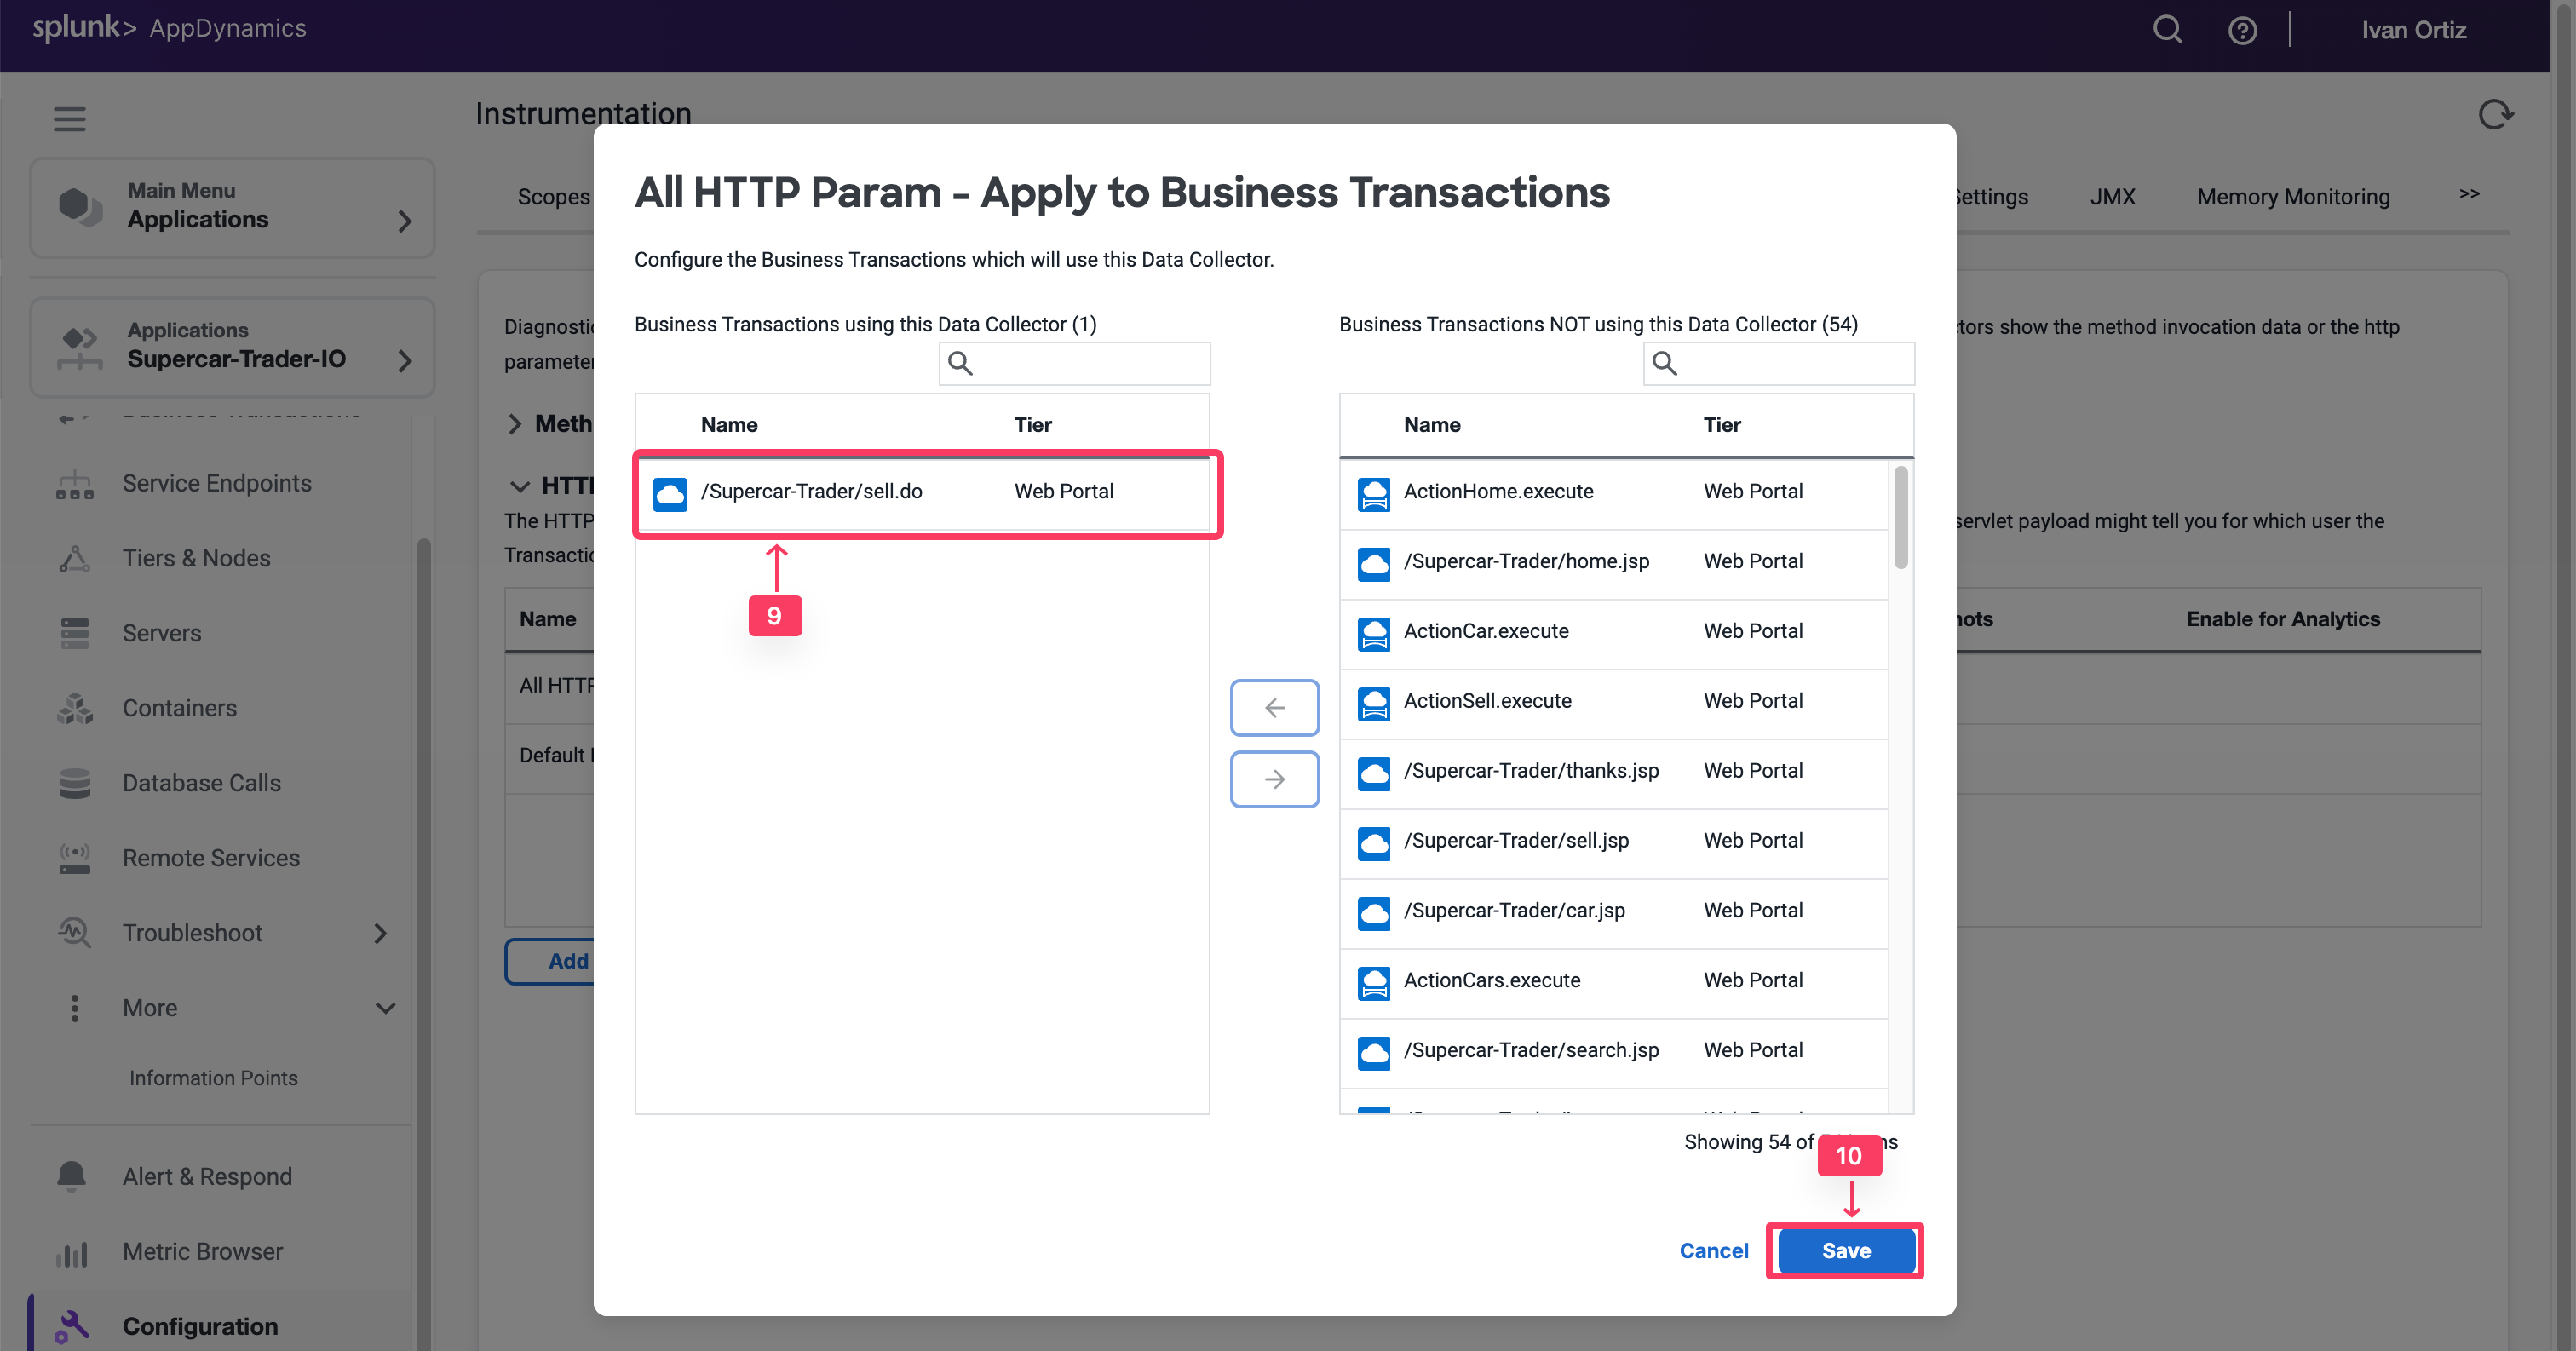
Click “Ok” to confirm the data collector.
Enable /Supercar-Trader/sell.do Transaction
Click Save
Observe and Select Relevant HTTP Data Collectors
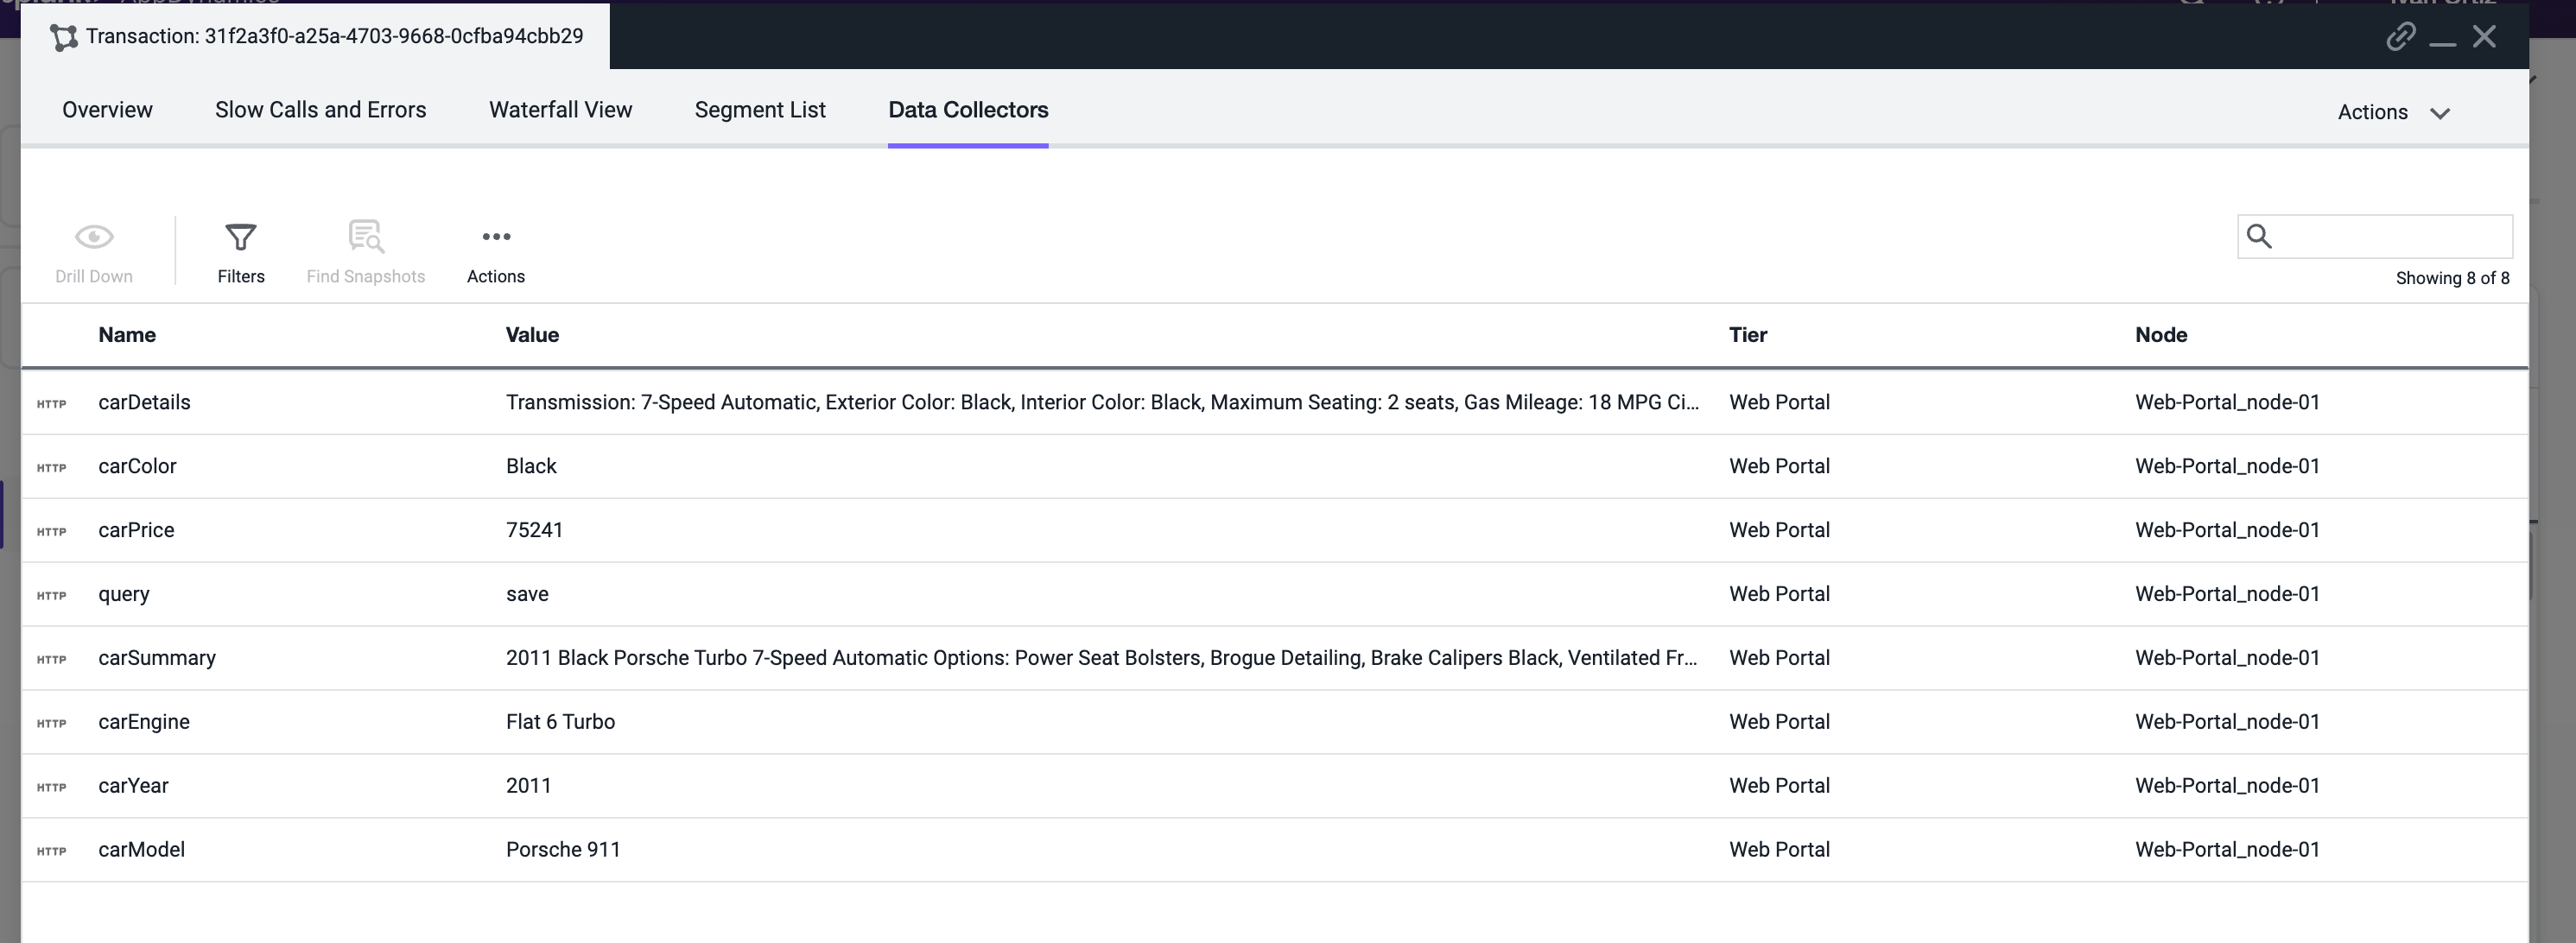
Apply load on the Application, specifically the SellCar transaction. Open one of its snapshots with Full Call Graph, and select the Data Collectors Tab.
You can now see all HTTP Parameters. You will see a number of key metrics, such as Car Price, Color, Year, and more.
Note the exact Parameter names to add them again in the HTTP Parameters list and enable them in Transaction Analytics.
Once they are added, delete the All HTTP Param HTTP data collector.
Capture Business Data in Analytics with HTTP Params
You will now configure the HTTP data collector again, but this time you will capture only the useful HTTP Parameters and enable them in Transaction Analytics. Add a new HTTP Data Collector: Application -> Configuration -> Instrumentation -> Data Collector tab -> Click Add Under the HTTP Request Data Collectors section
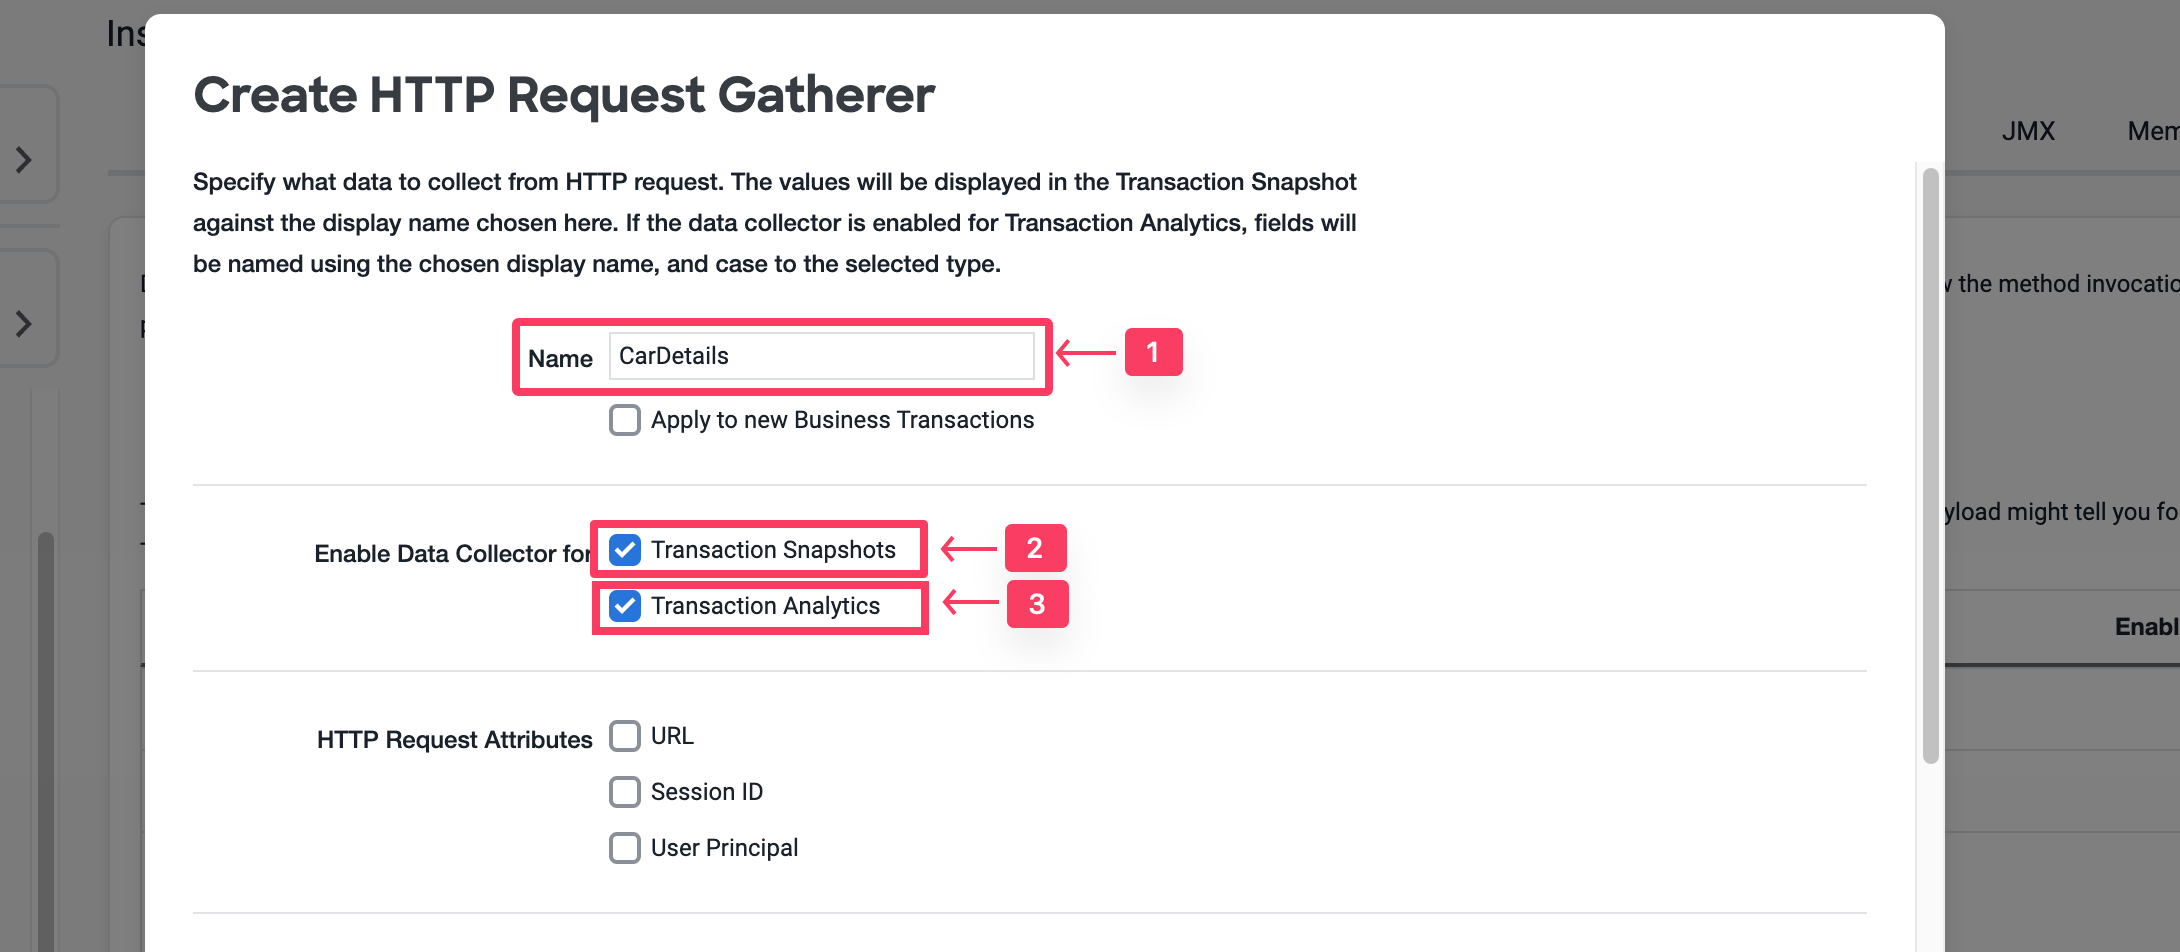
In the Name, specify CarDetails.
Enable Transaction Snapshots.
Enable Transaction Analytics.
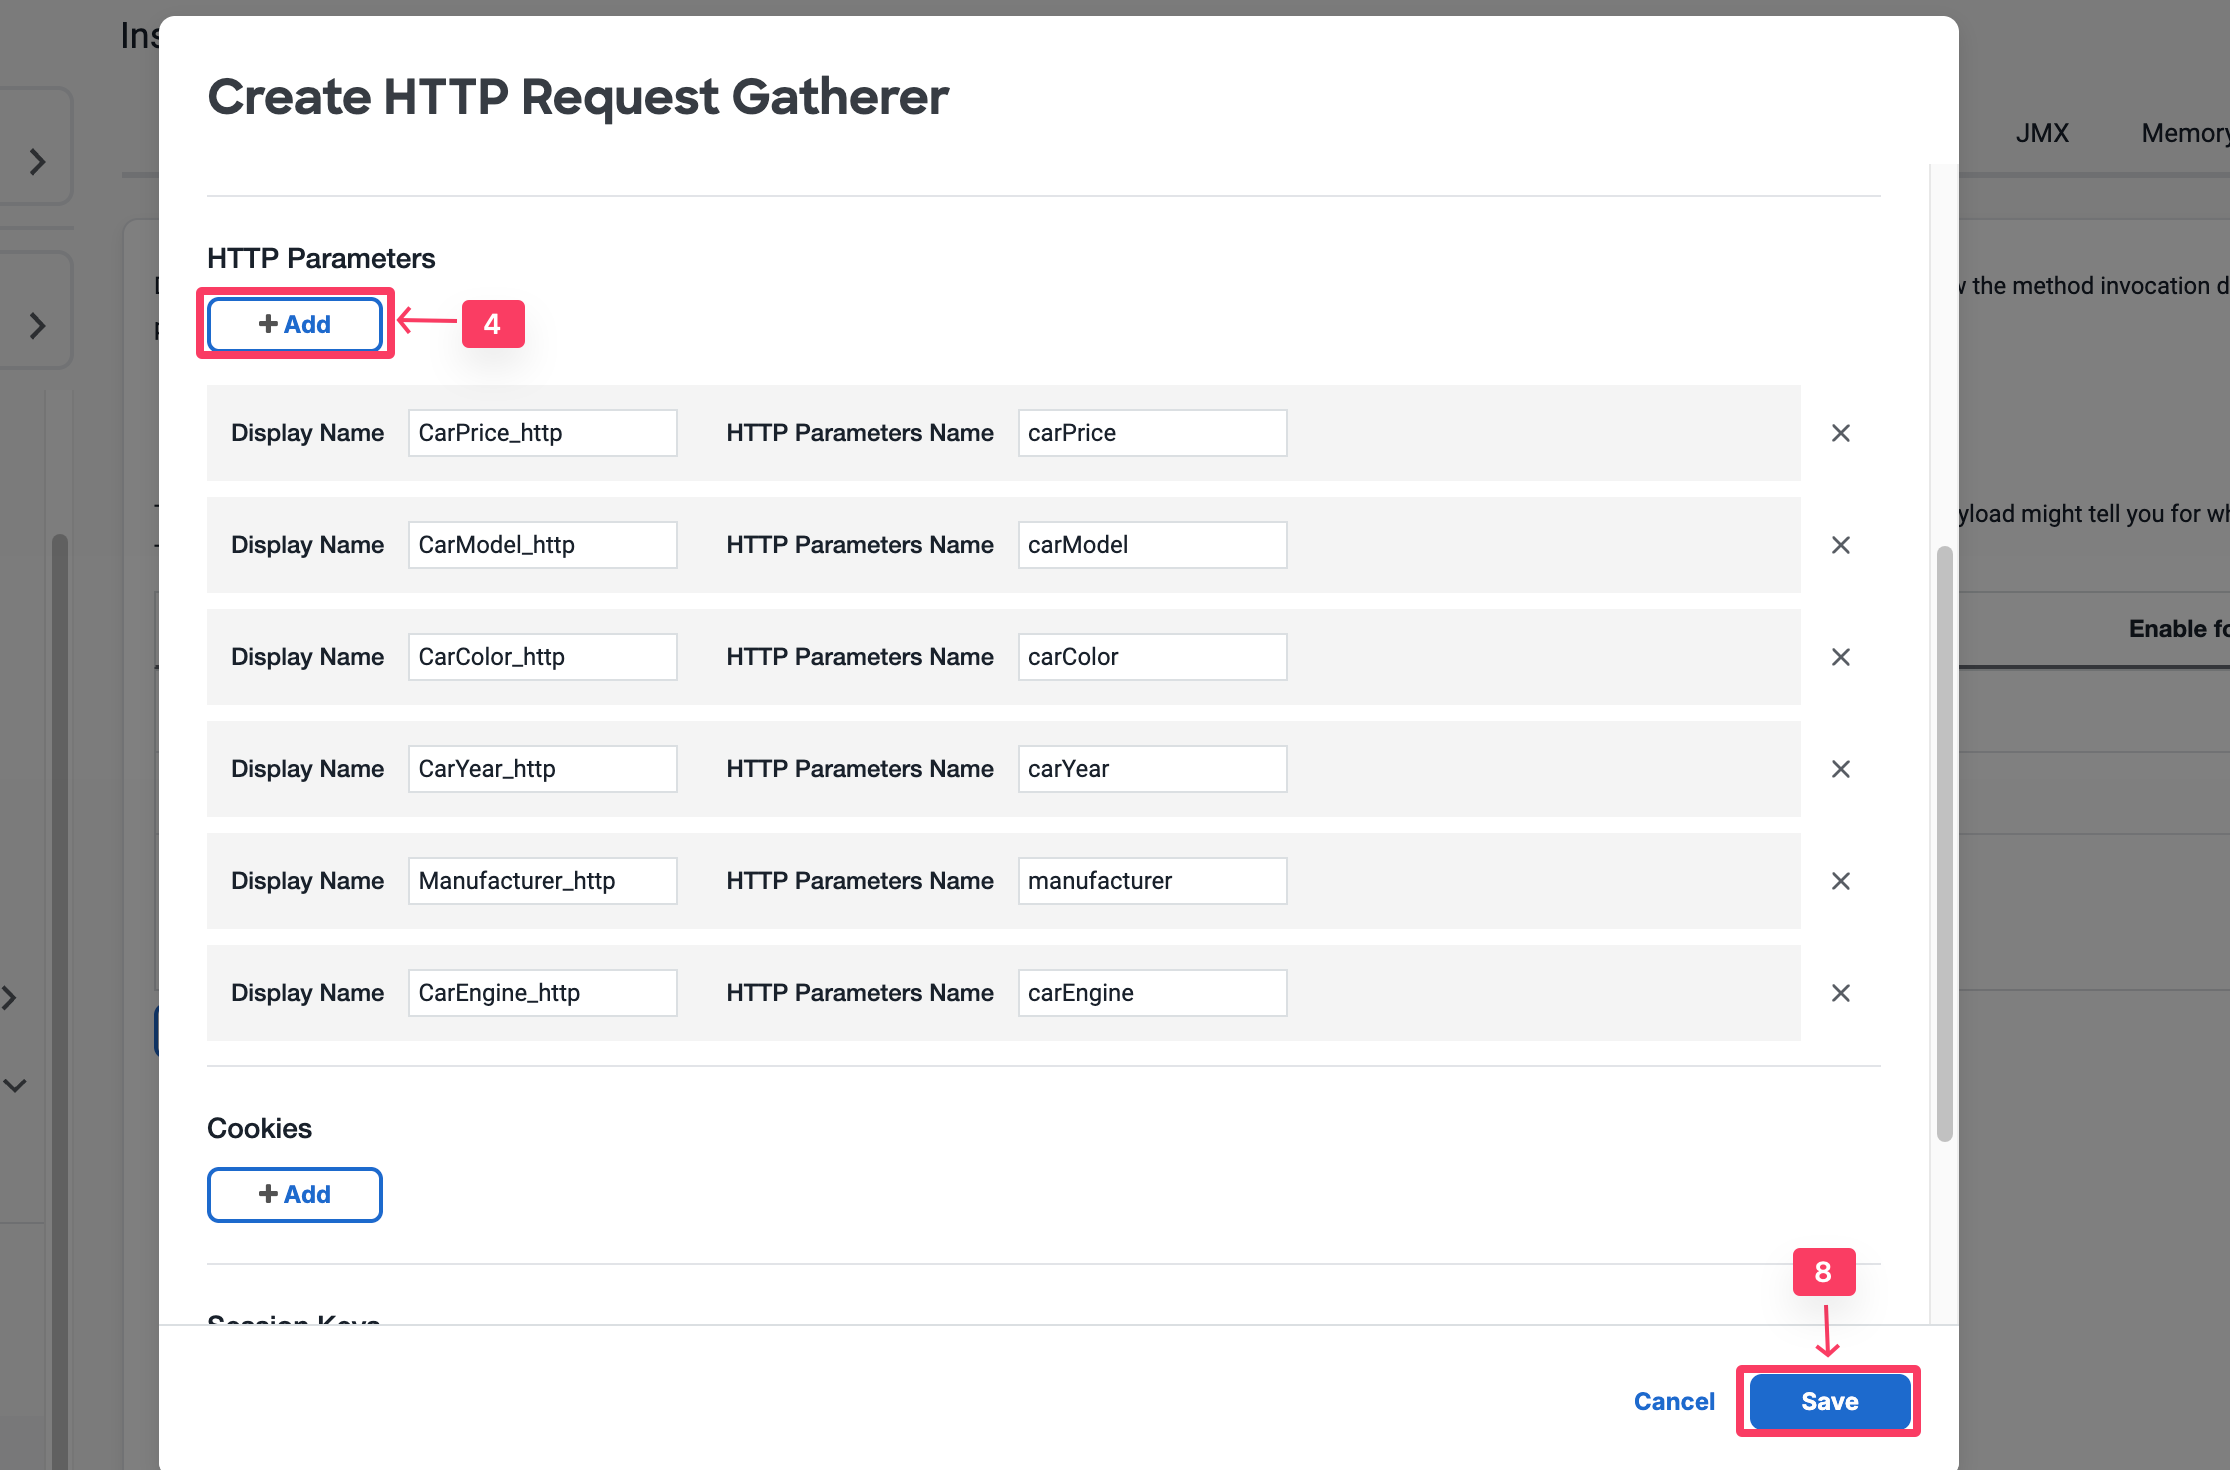
Click + Add in the HTTP Parameters section.
For the new Parameter, specify CarPrice_http as the Display Name
Then specify carPrice as the HTTP Parameter name.
Repeat for the rest of the Car Parameters as shown below.
Click Save
Click Ok to acknowledge the Data Collector implementation
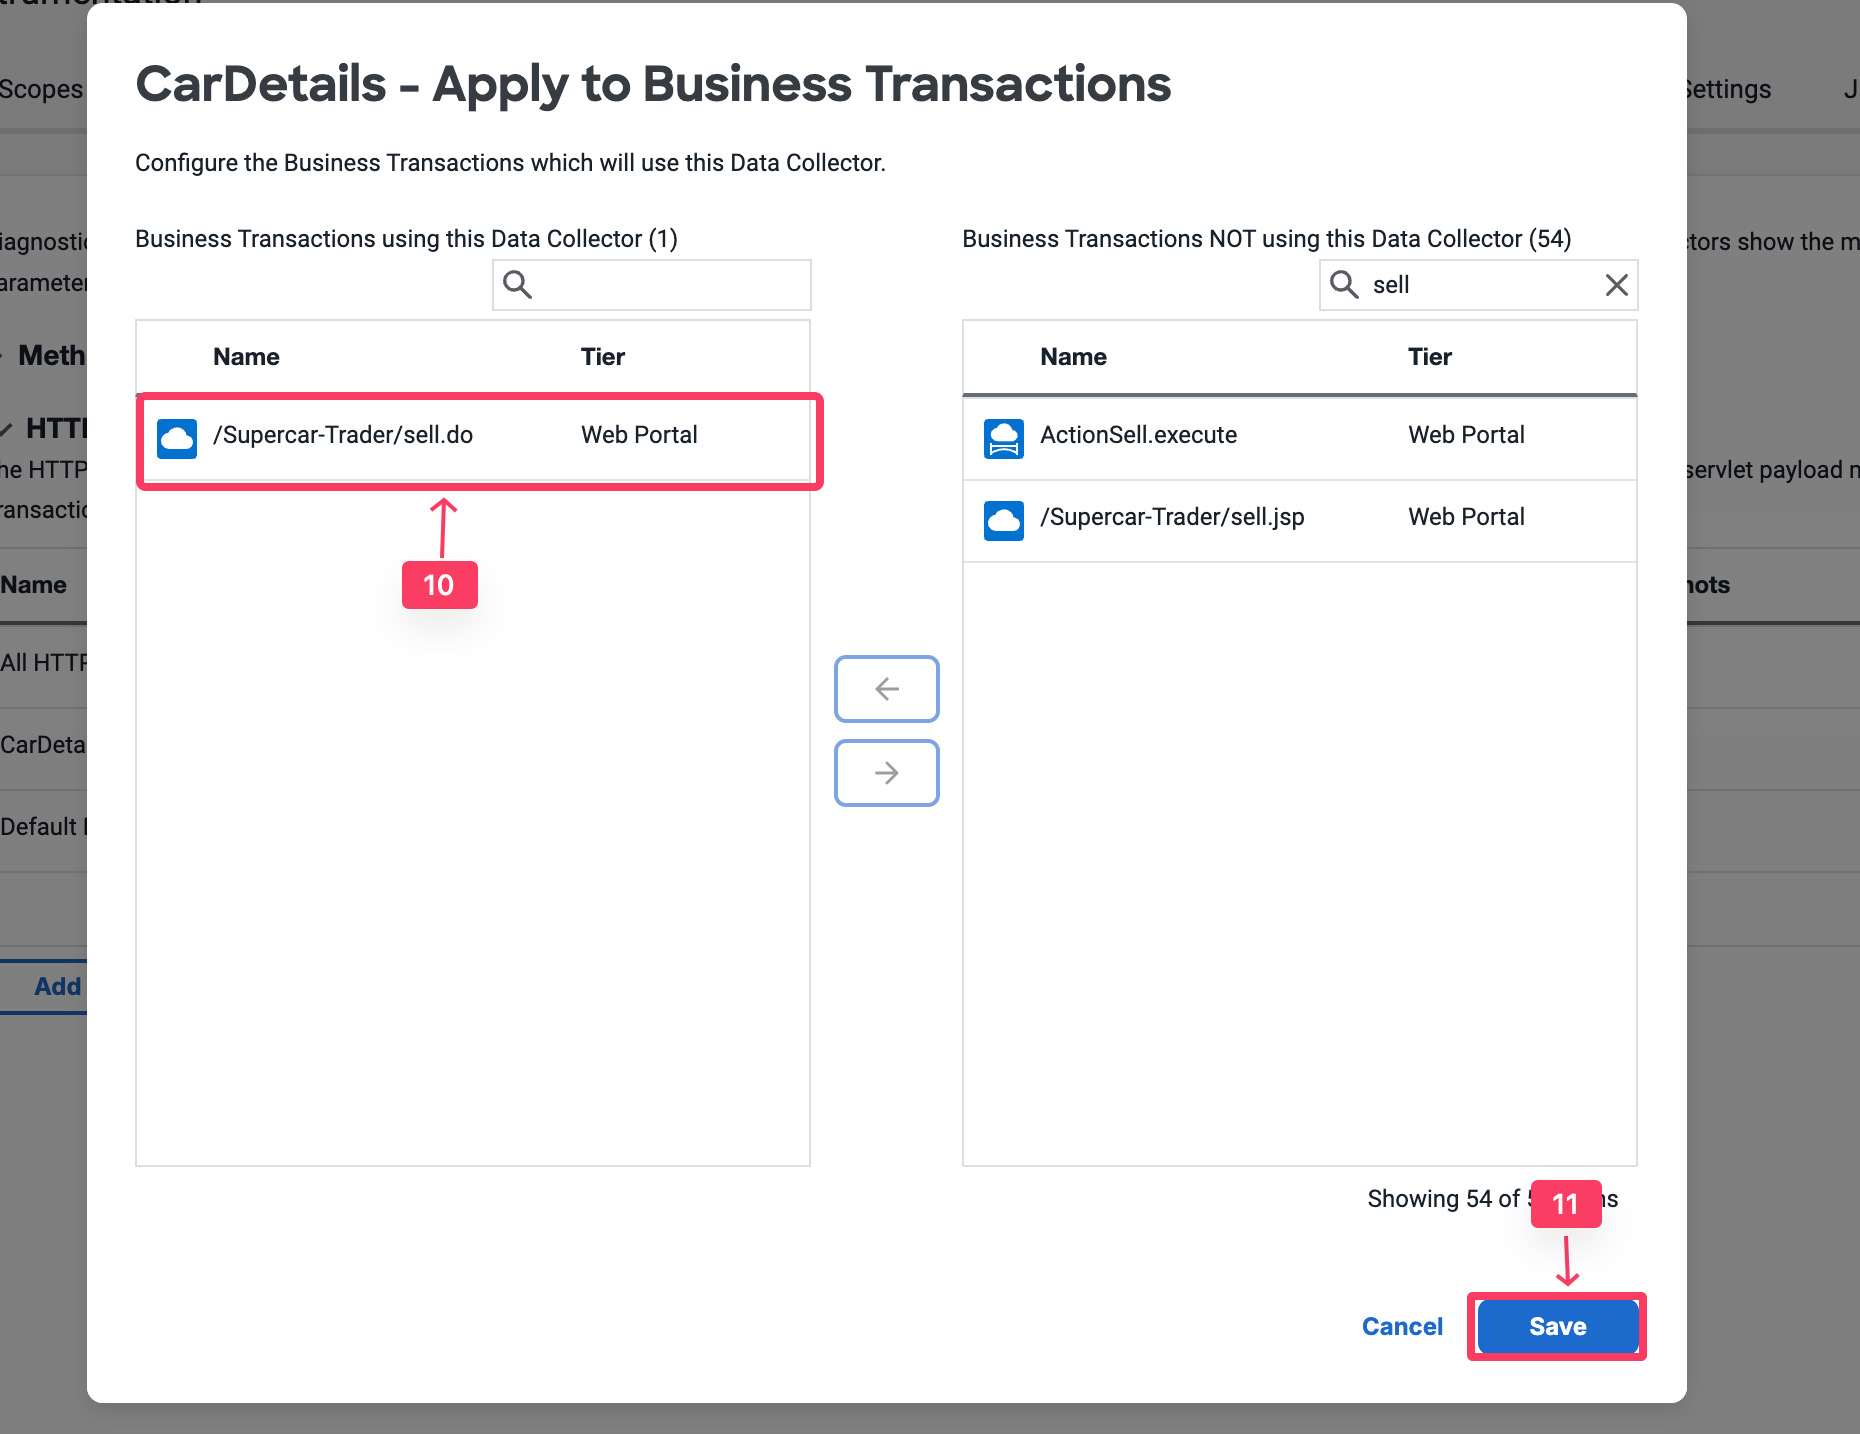
Enable /Supercar-Trader/sell.do Transaction
Click Save
Delete the All HTTP Param Collector by Clicking on it, then click Delete button.
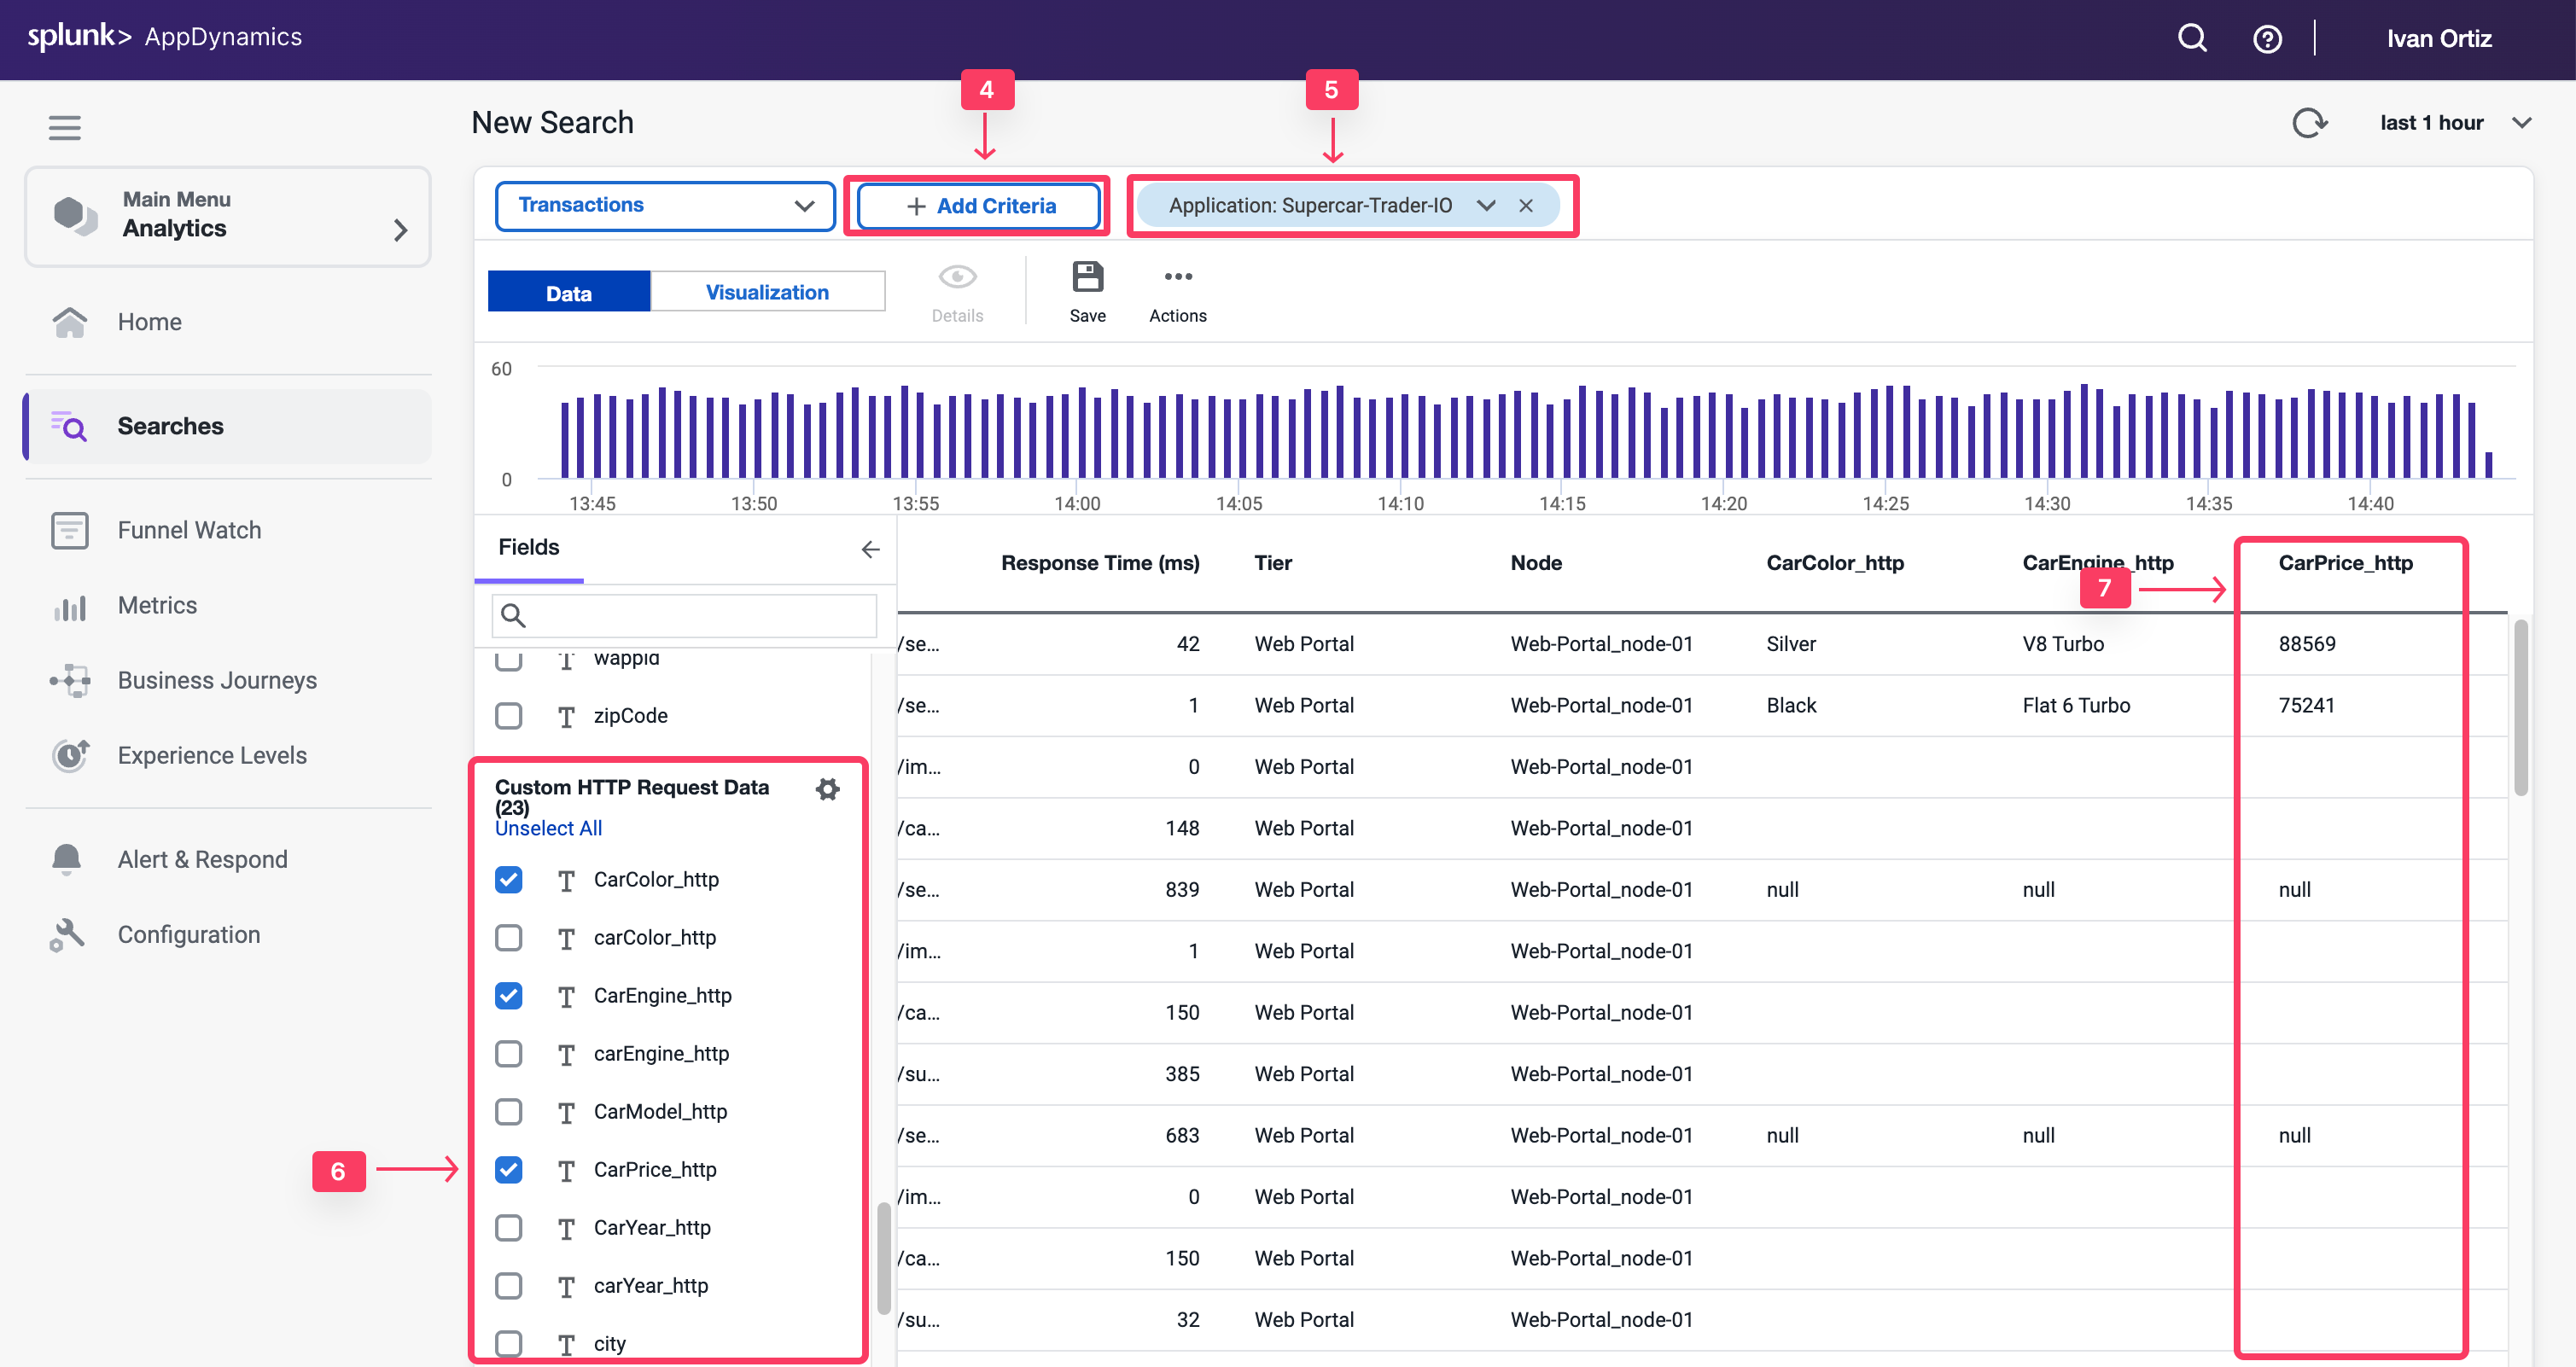
Validate Analytics on HTTP Parameters
You will now validate whether the business data was captured by HTTP data collectors in AppDynamics Analytics.
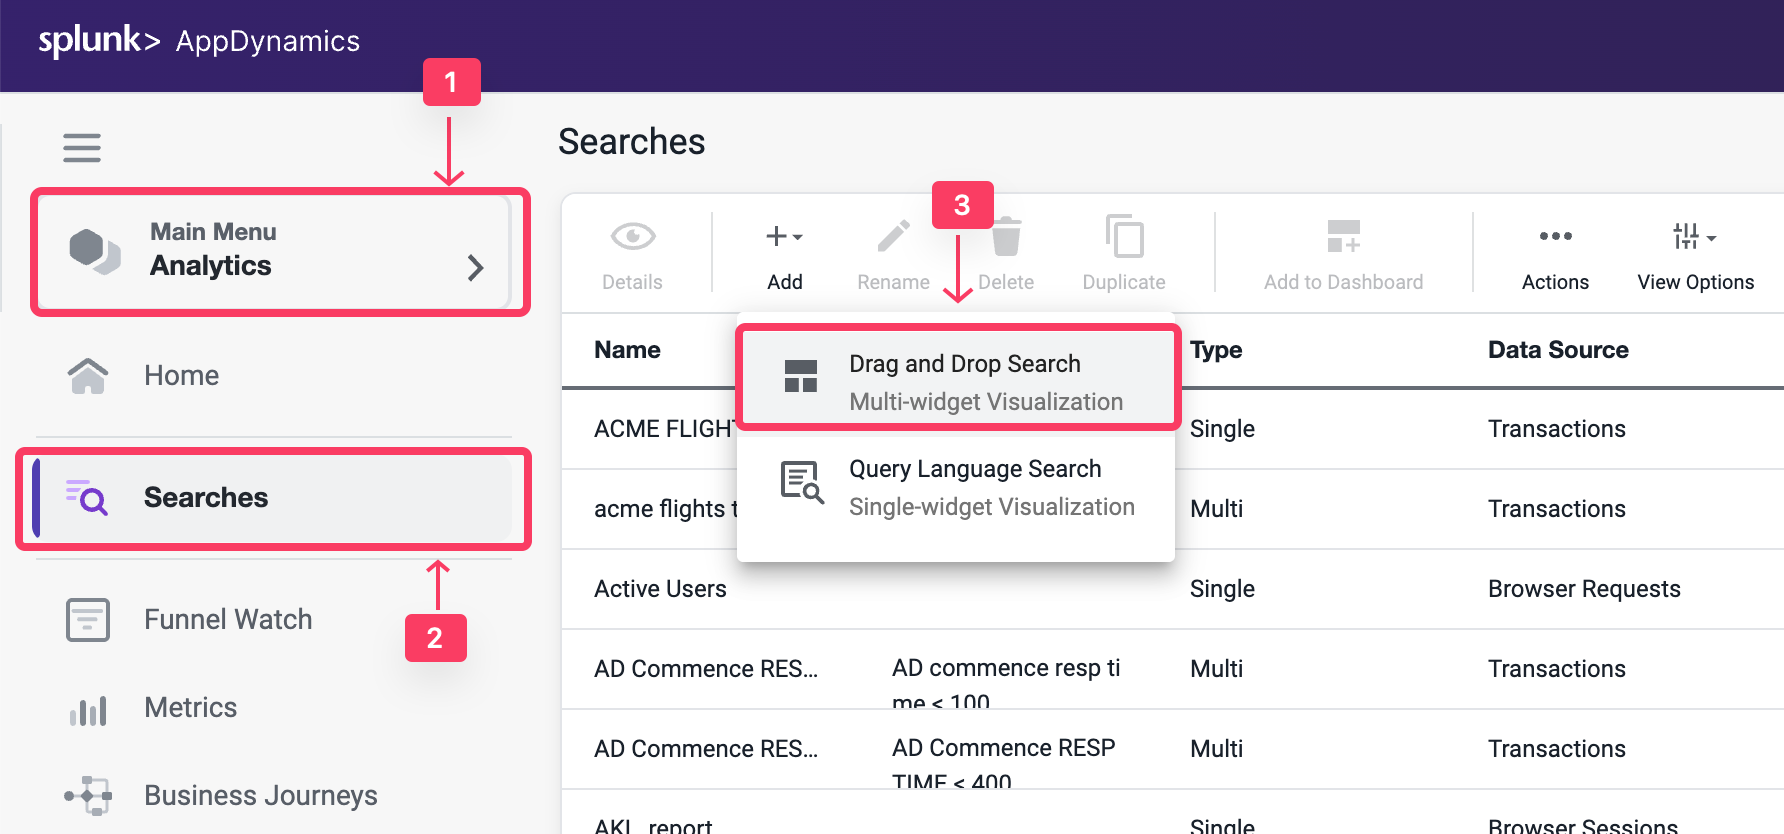
Select the Analytics tab at the top left of the screen.
Select the Searches tab
Click the + Add button and create a new Drag and Drop Search.
Click + Add Criteria
Select Application and Search For Your Application Name Supercar-Trader-YOURINITIALS
Under the Fields panel verify that the Business Parameters appear as a field in the Custom HTTP Request Data.
Check the box for CarPrice_http and Validate that the field has data.
Configure Method Data Collectors
2 minutes
Method invocation data collectors capture code data such as method arguments, variables, and return values. If HTTP data collectors don’t have sufficient business data, you can still capture these information from the code execution.
In this exercise you will perform the following tasks:
Discover methods.
Open a discovery session.
Discover method parameters.
Drill down to an object within the code.
Create a method invocation data collector.
Validate analytics on method invocation data collectors.
Open a Discovery Session
You may not have an application developer available to identify the method or parameters from the source code. However, there is an approach to discover the application methods and objects directly from AppDynamics.
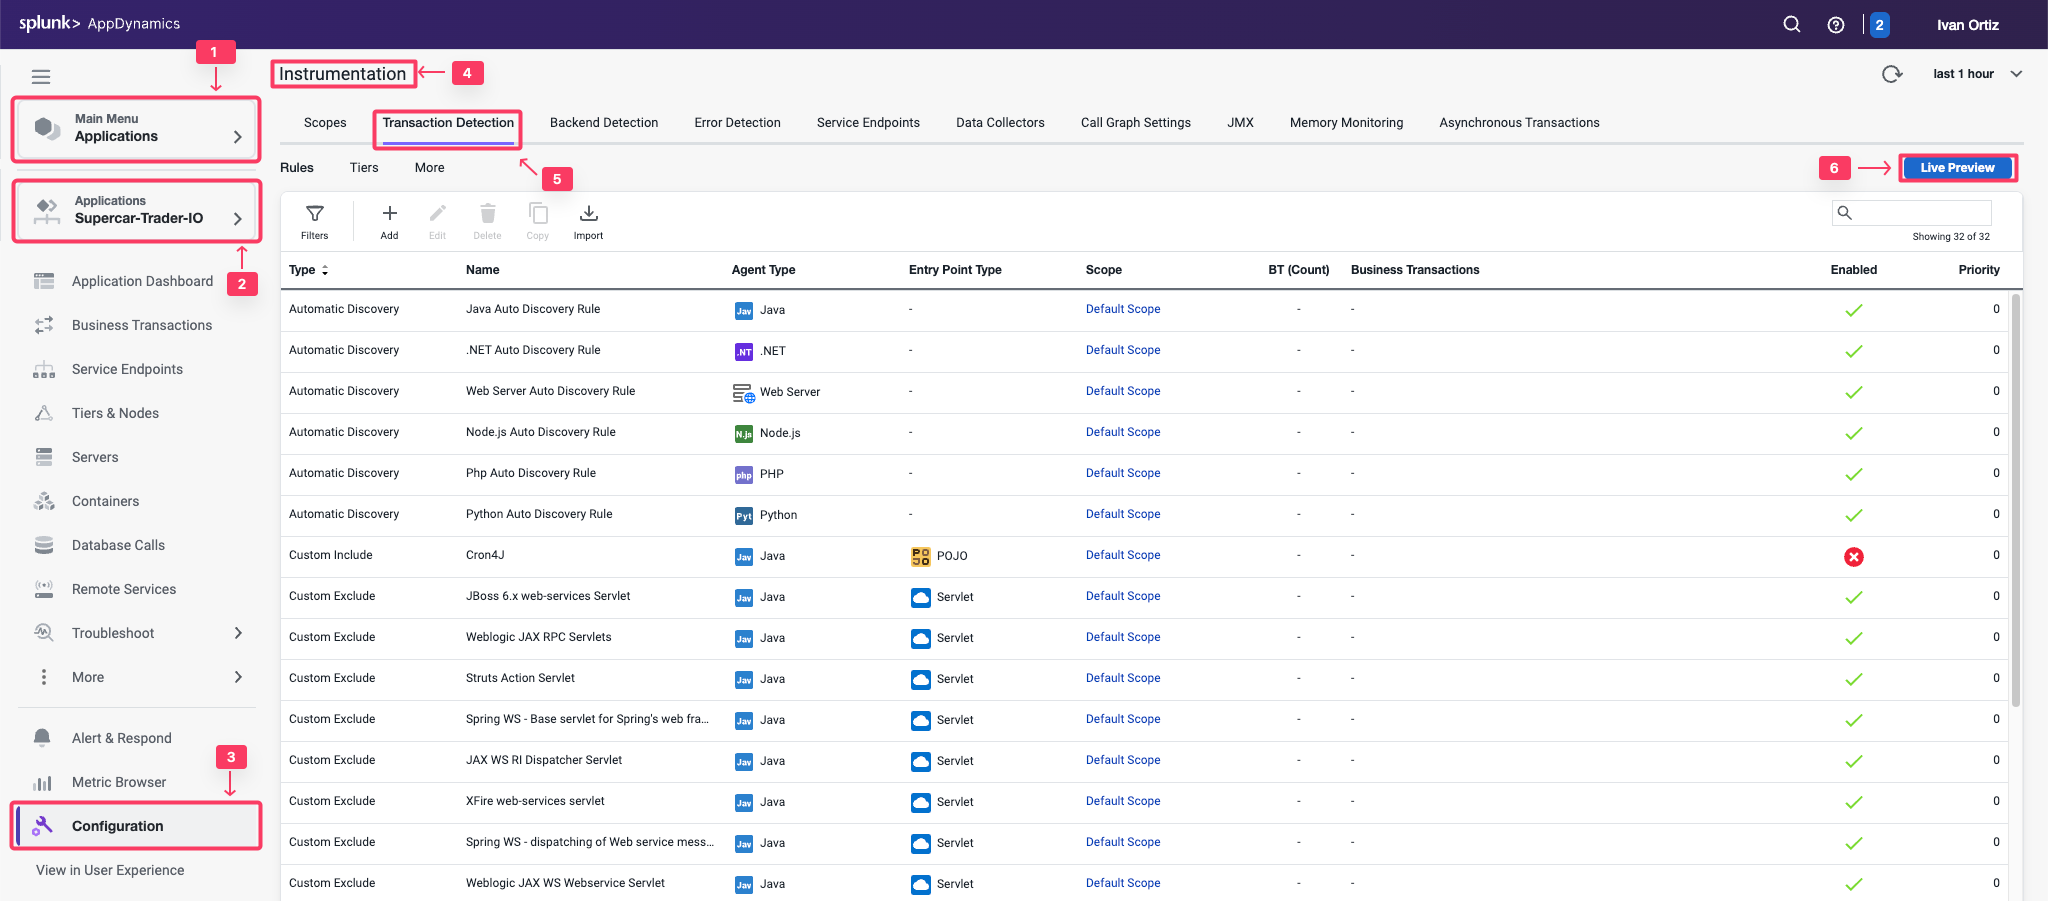
Select the Applications tab at the top left of the screen.
Select Supercar-Trader-YOURINITIALS application
Select the Configuration tab.
Click on the Instrumentation link.
Select the Transaction Detection tab.
Click on the Live Preview Button on the tight.
Click on Start Discovery Session button
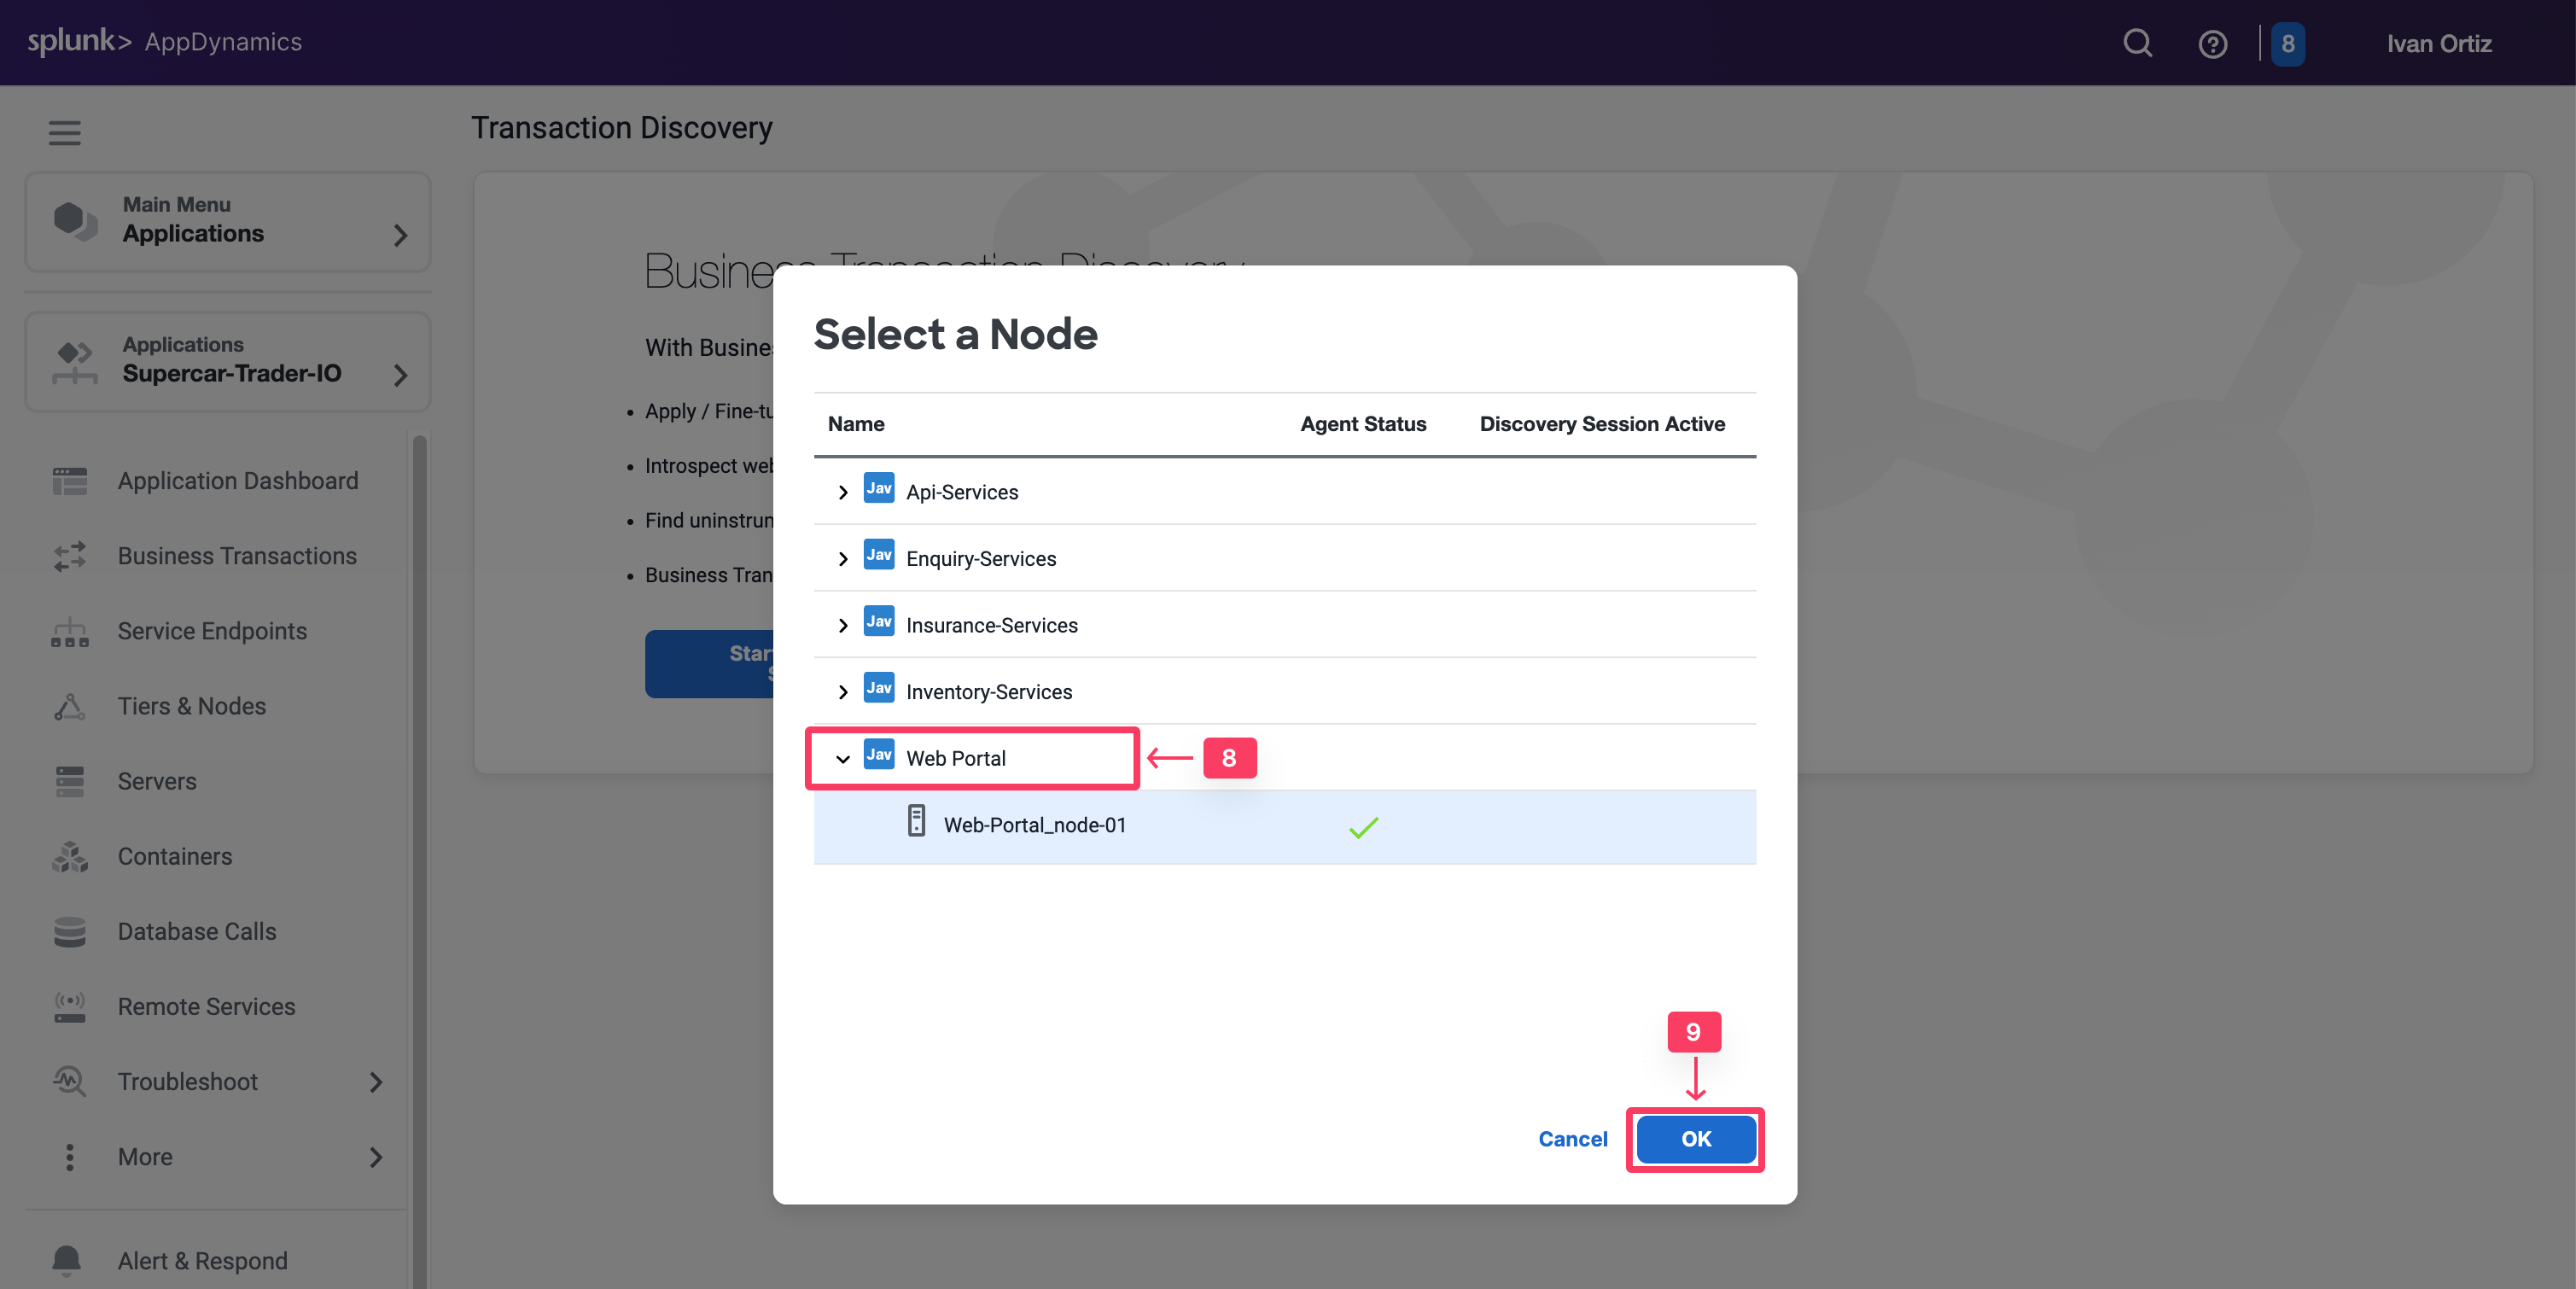
Select the Web-Portal Node in the pop-up windows. It should be the same node that the method you are investigating runs on
Click Ok
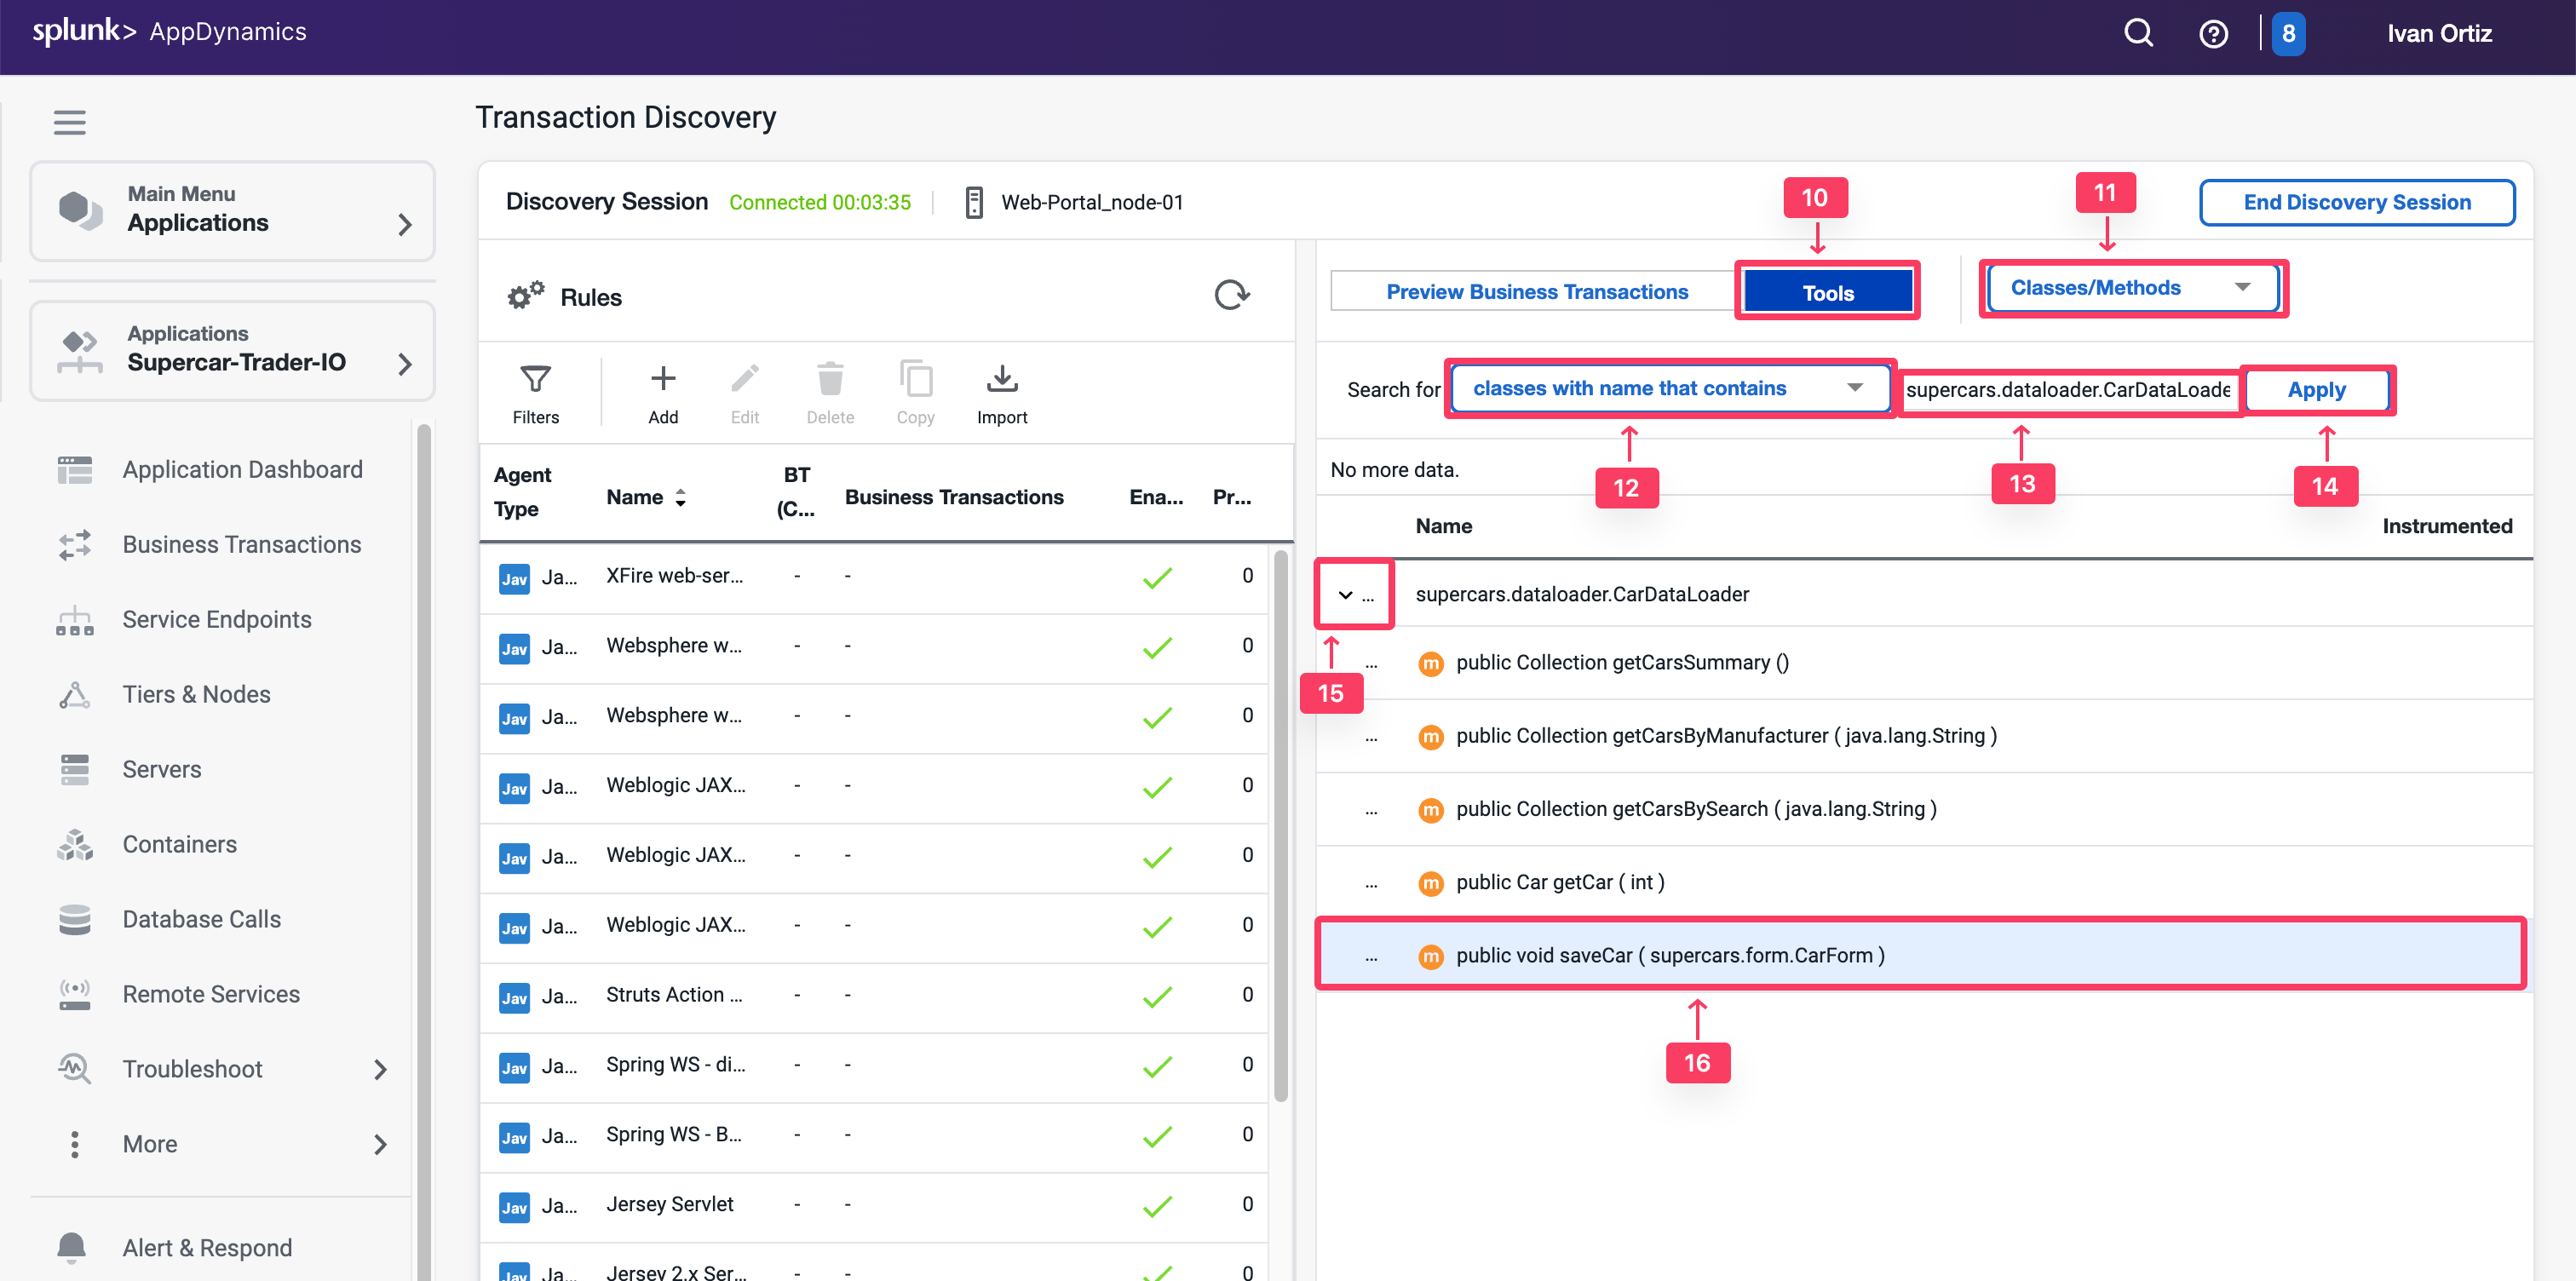
Select Tools on the right toggle.
Select Classes/Methods in the drop-down list.
Select Classes with name in the Search section.
Type in the class name supercars.dataloader.CarDataLoader in the text box. To find the class name you can search through call graphs, or ideally find it in the source code.
Click Apply to search for the matching class methods.
Once the results appear, expand the class that matches your search.
Look for the same method saveCar.
Note that the saveCar method takes a CarForm object as an input parameter.
Drill Down to the Object
Now you have found the method, explore its parameters to find out where you can pull the car details properties.
You saw that saveCar method takes the complex object CarForm as an input parameter. This object will hold the form data that was entered on the application webpage. Next, you need to inspect that object and find out how you can pull the car details from it.
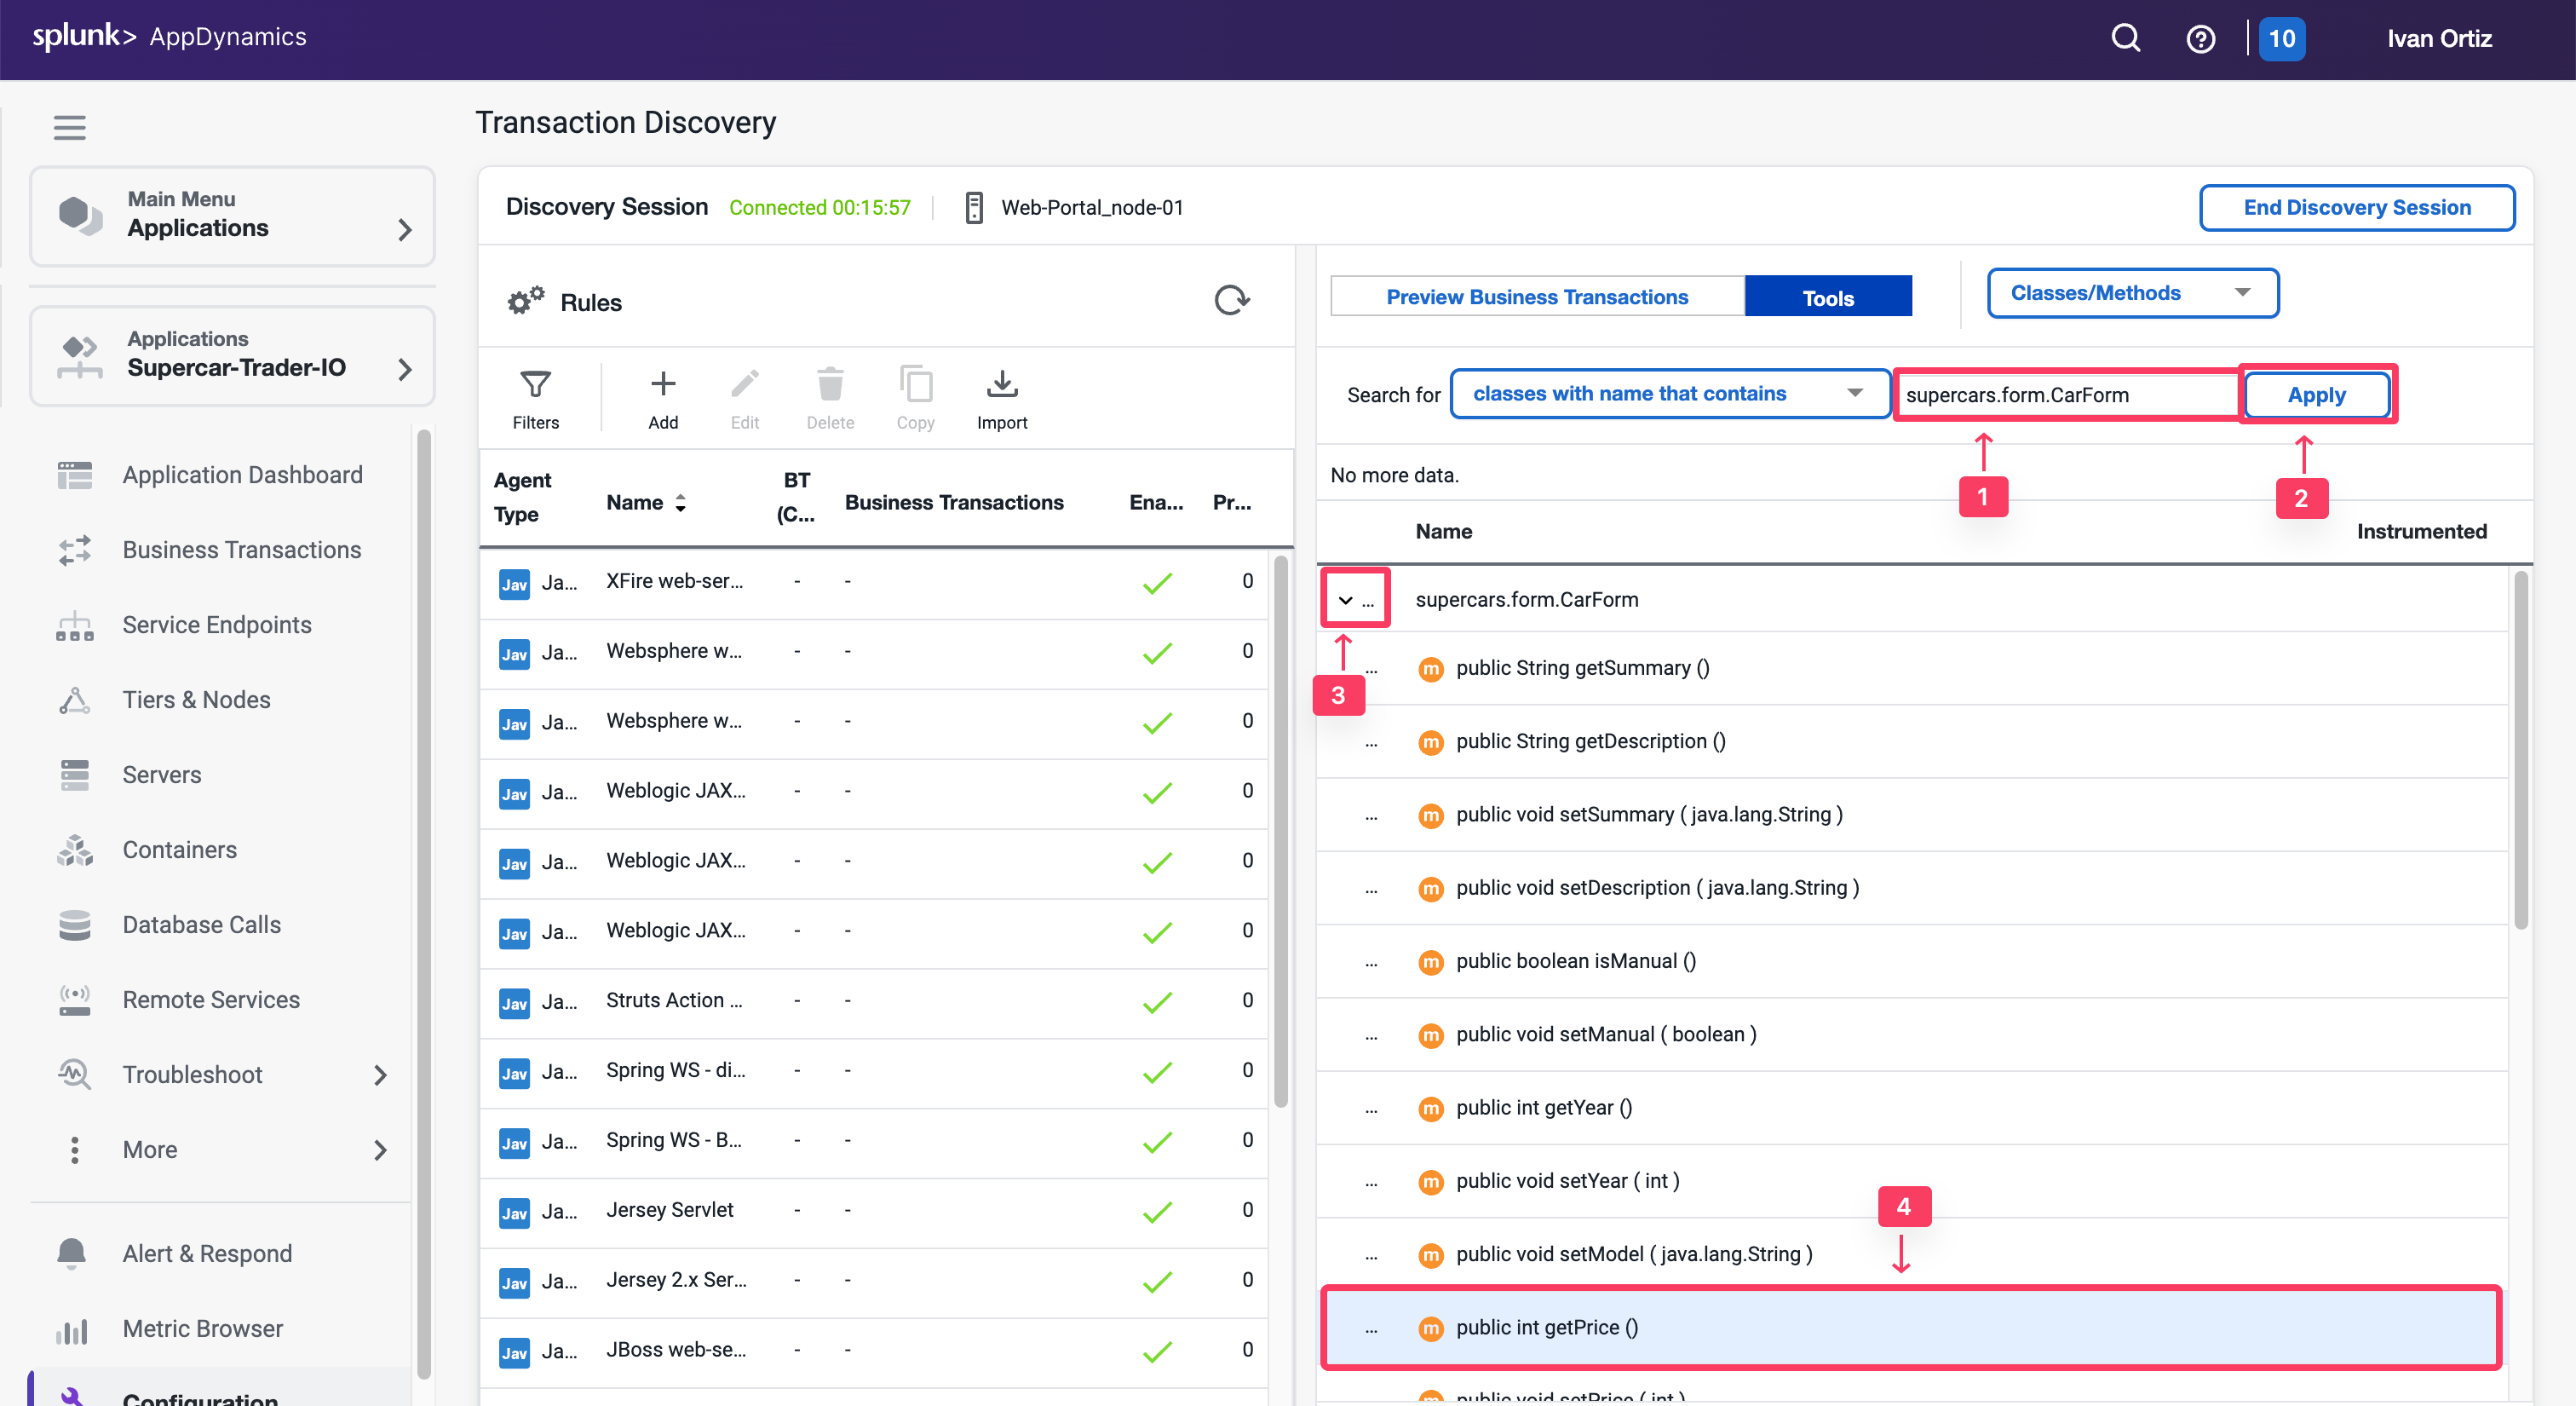
Type in the class name of the input object supercars.form.CarForm in the text box
Click Apply to search for the class methods.
When the results appear, expand the supercars.form.CarForm class that matches the search.
Look for the methods that will return the car details that you want. You will find get methods for price, model, color, and more.
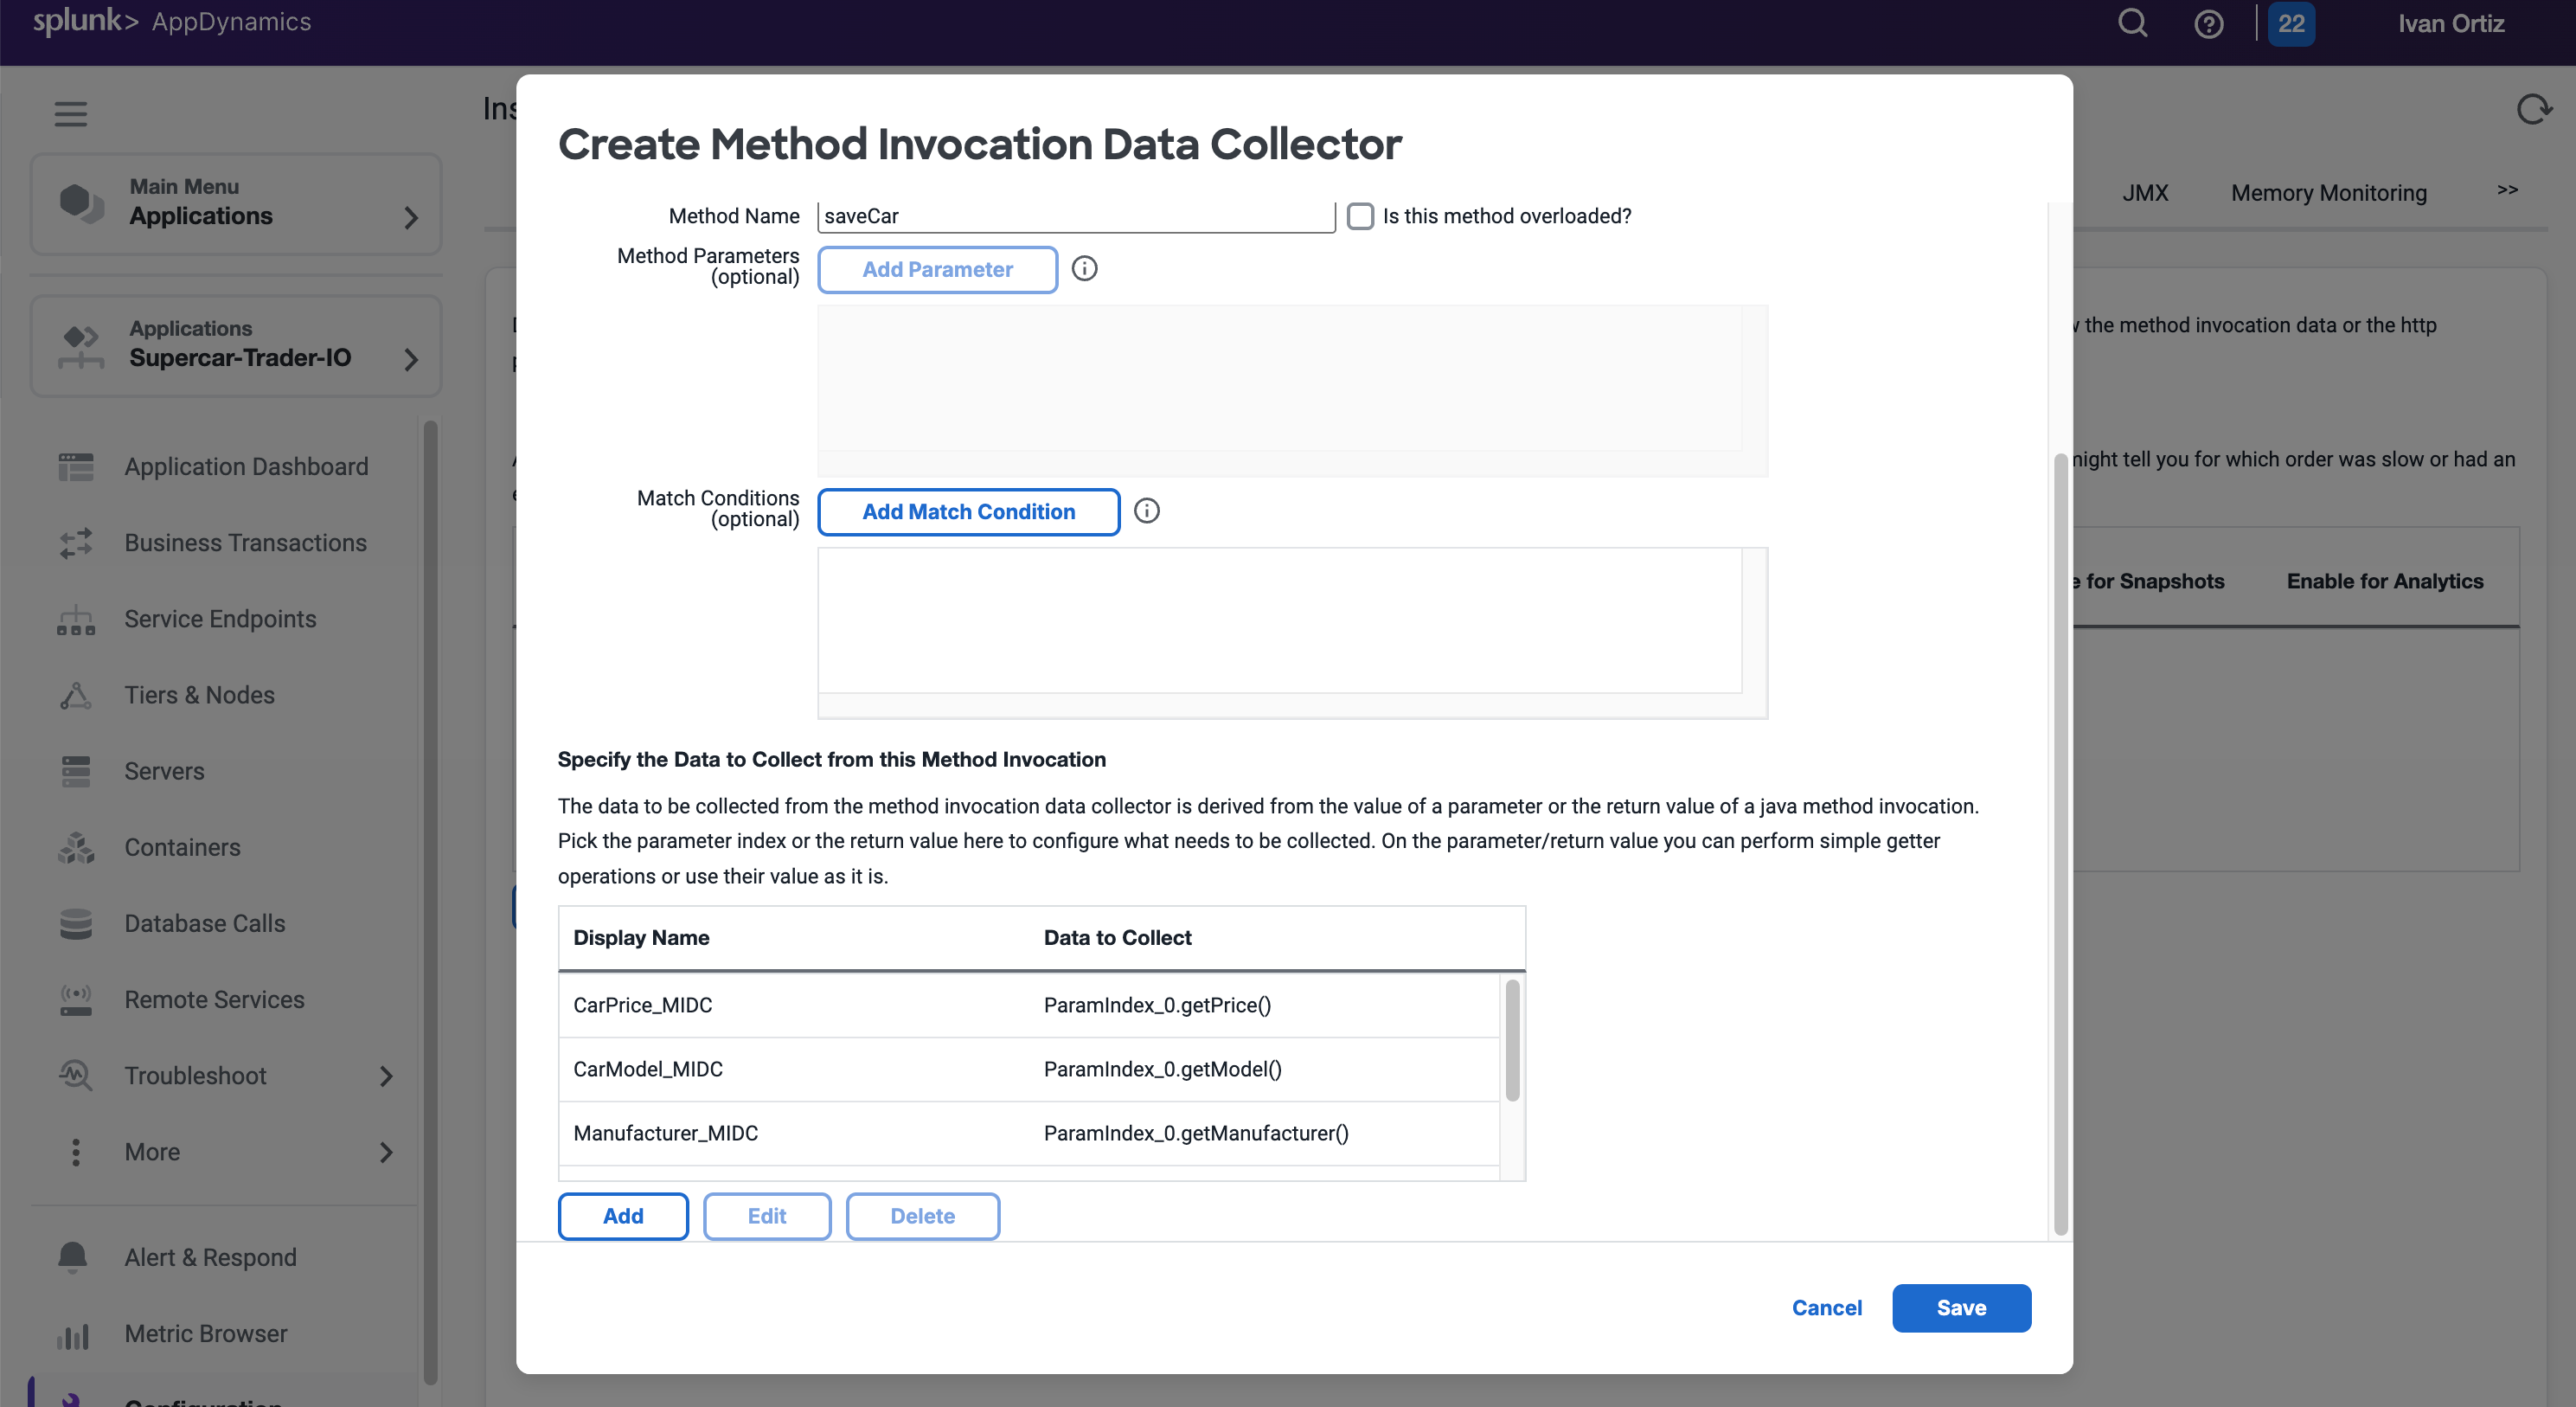
Create Method Invocation Data Collector
With the findings from the previous exercises, you can now configure a method invocation data collector to pull the car details directly from the running code in runtime.
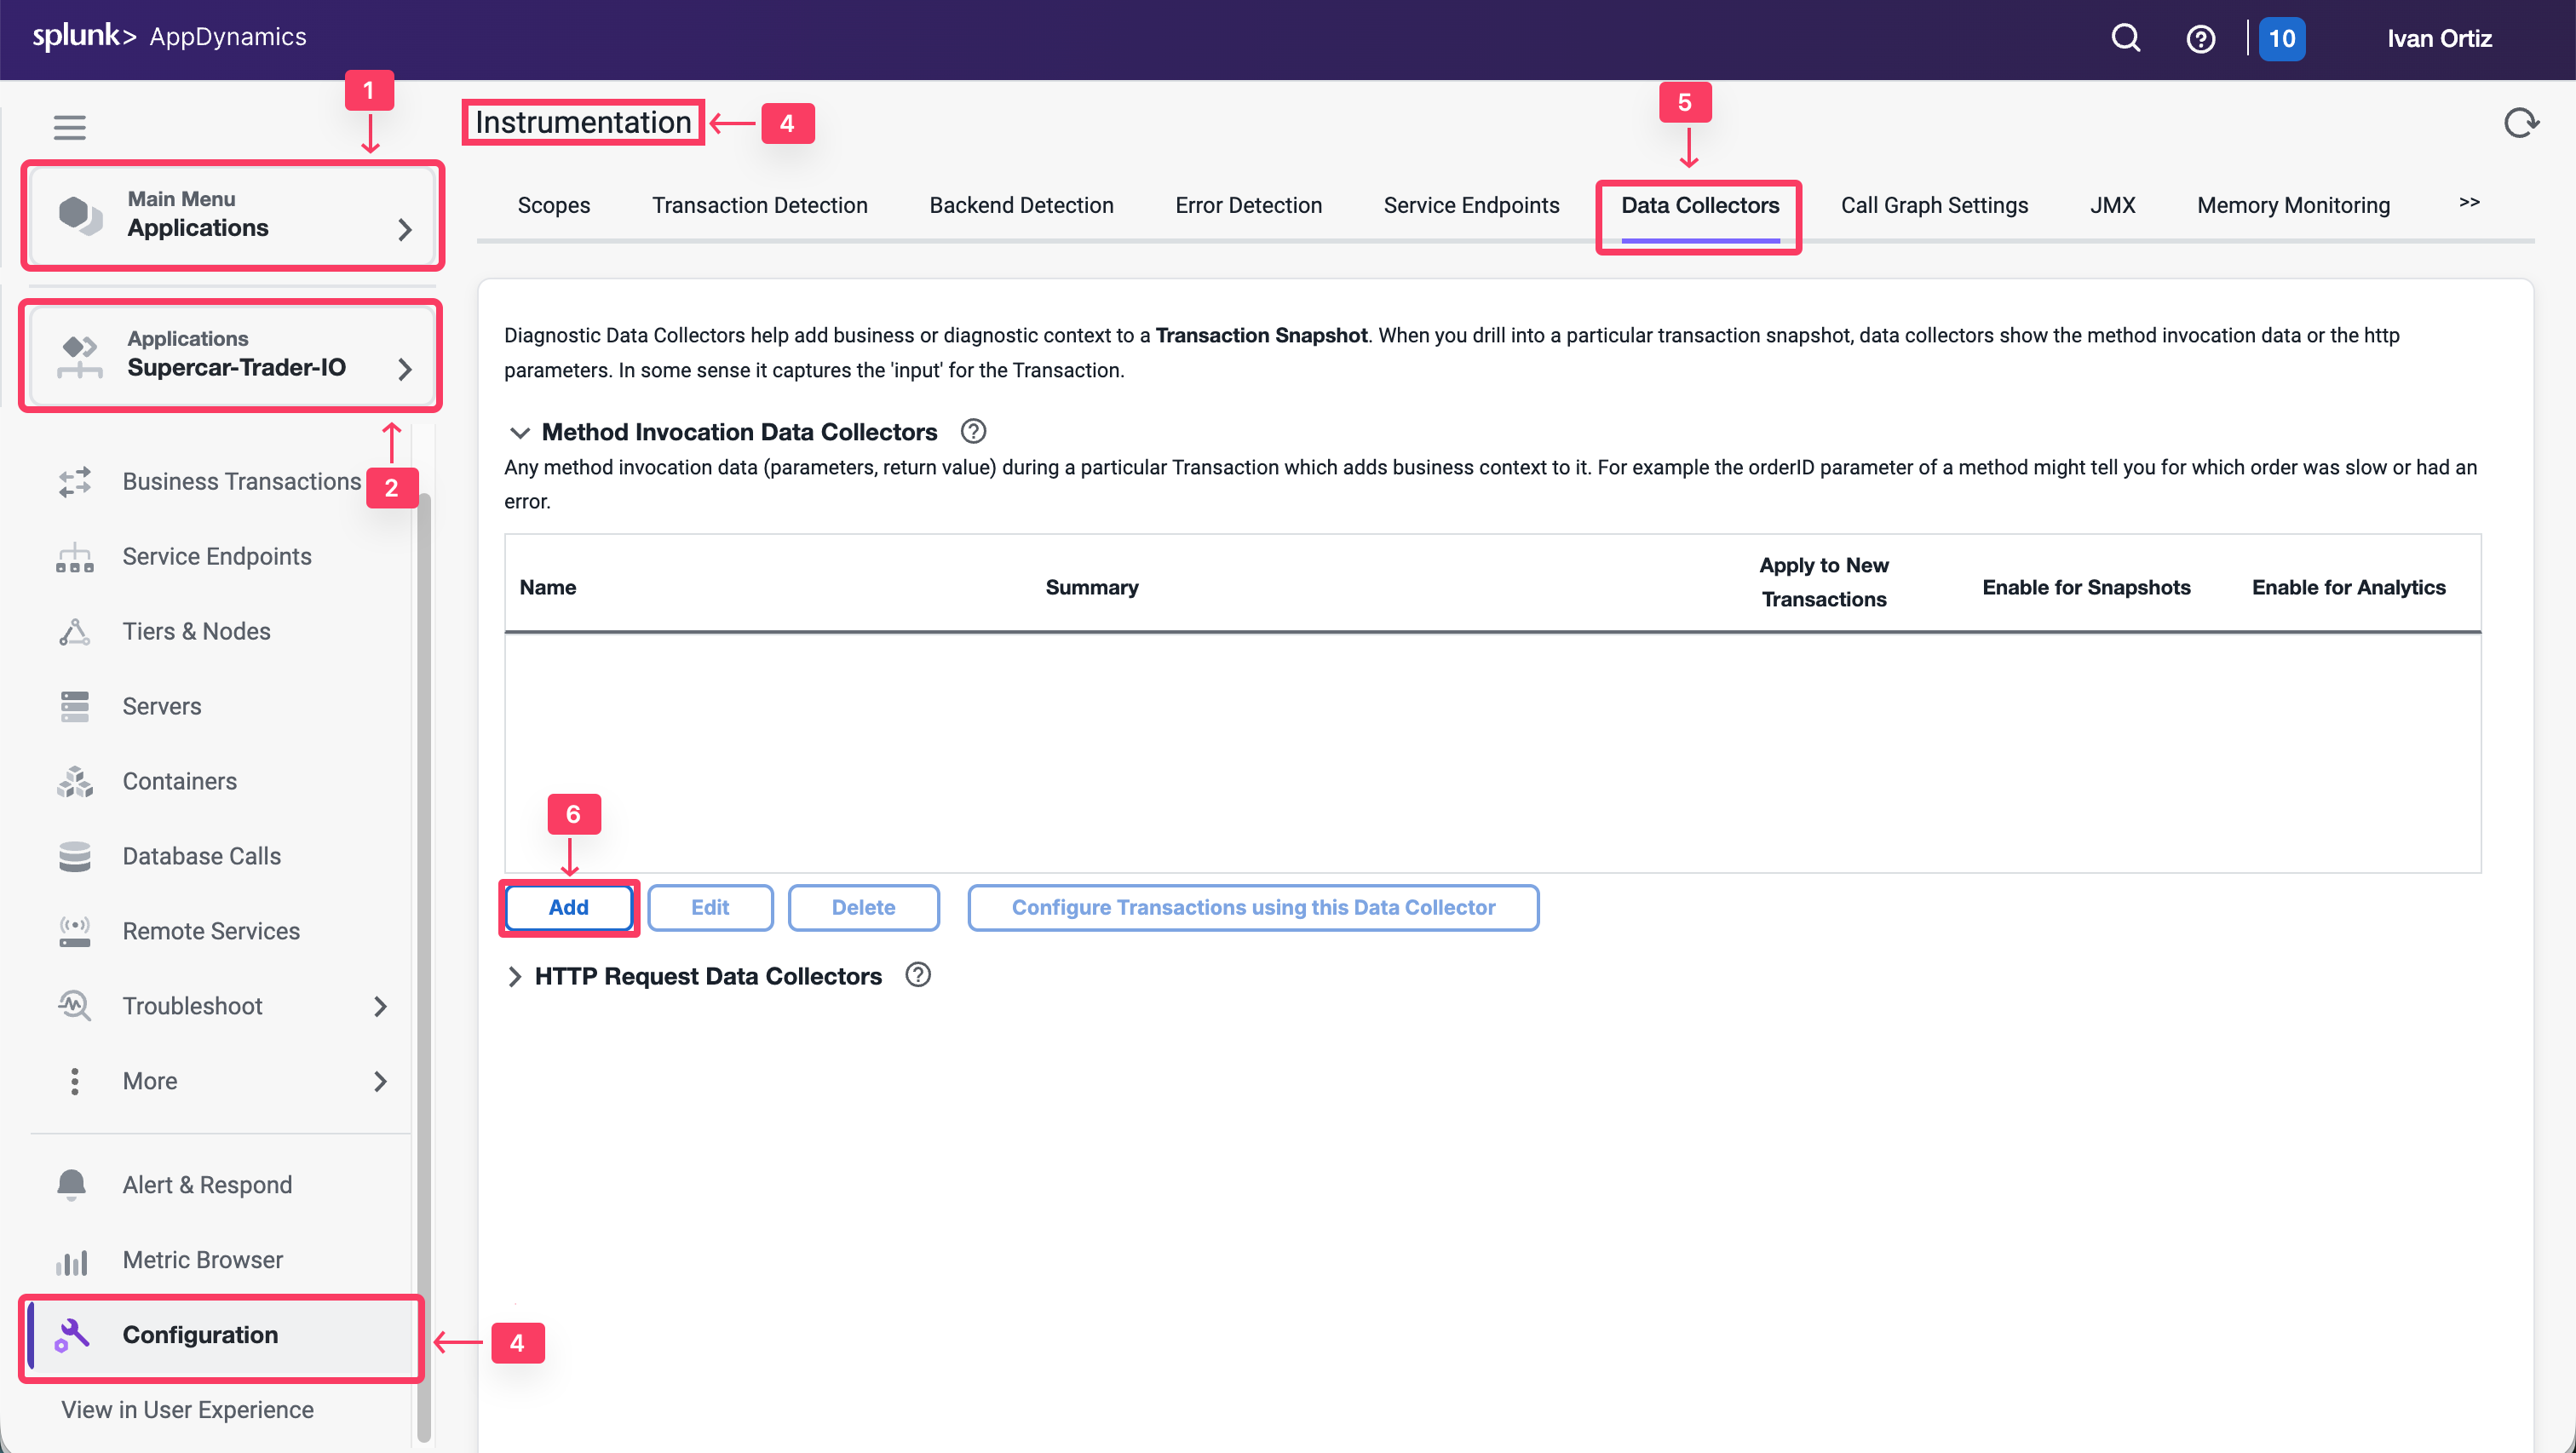
Select the Applications tab.
Select Supercar-Trader-YOURINITIALS Application
Select the Configuration tab.
Click on the Instrumentation link.
Select the Data Collectors tab.
Click Add in the Method Invocation Data Collectors.
We will create a method invocation data collector to capture the car details.
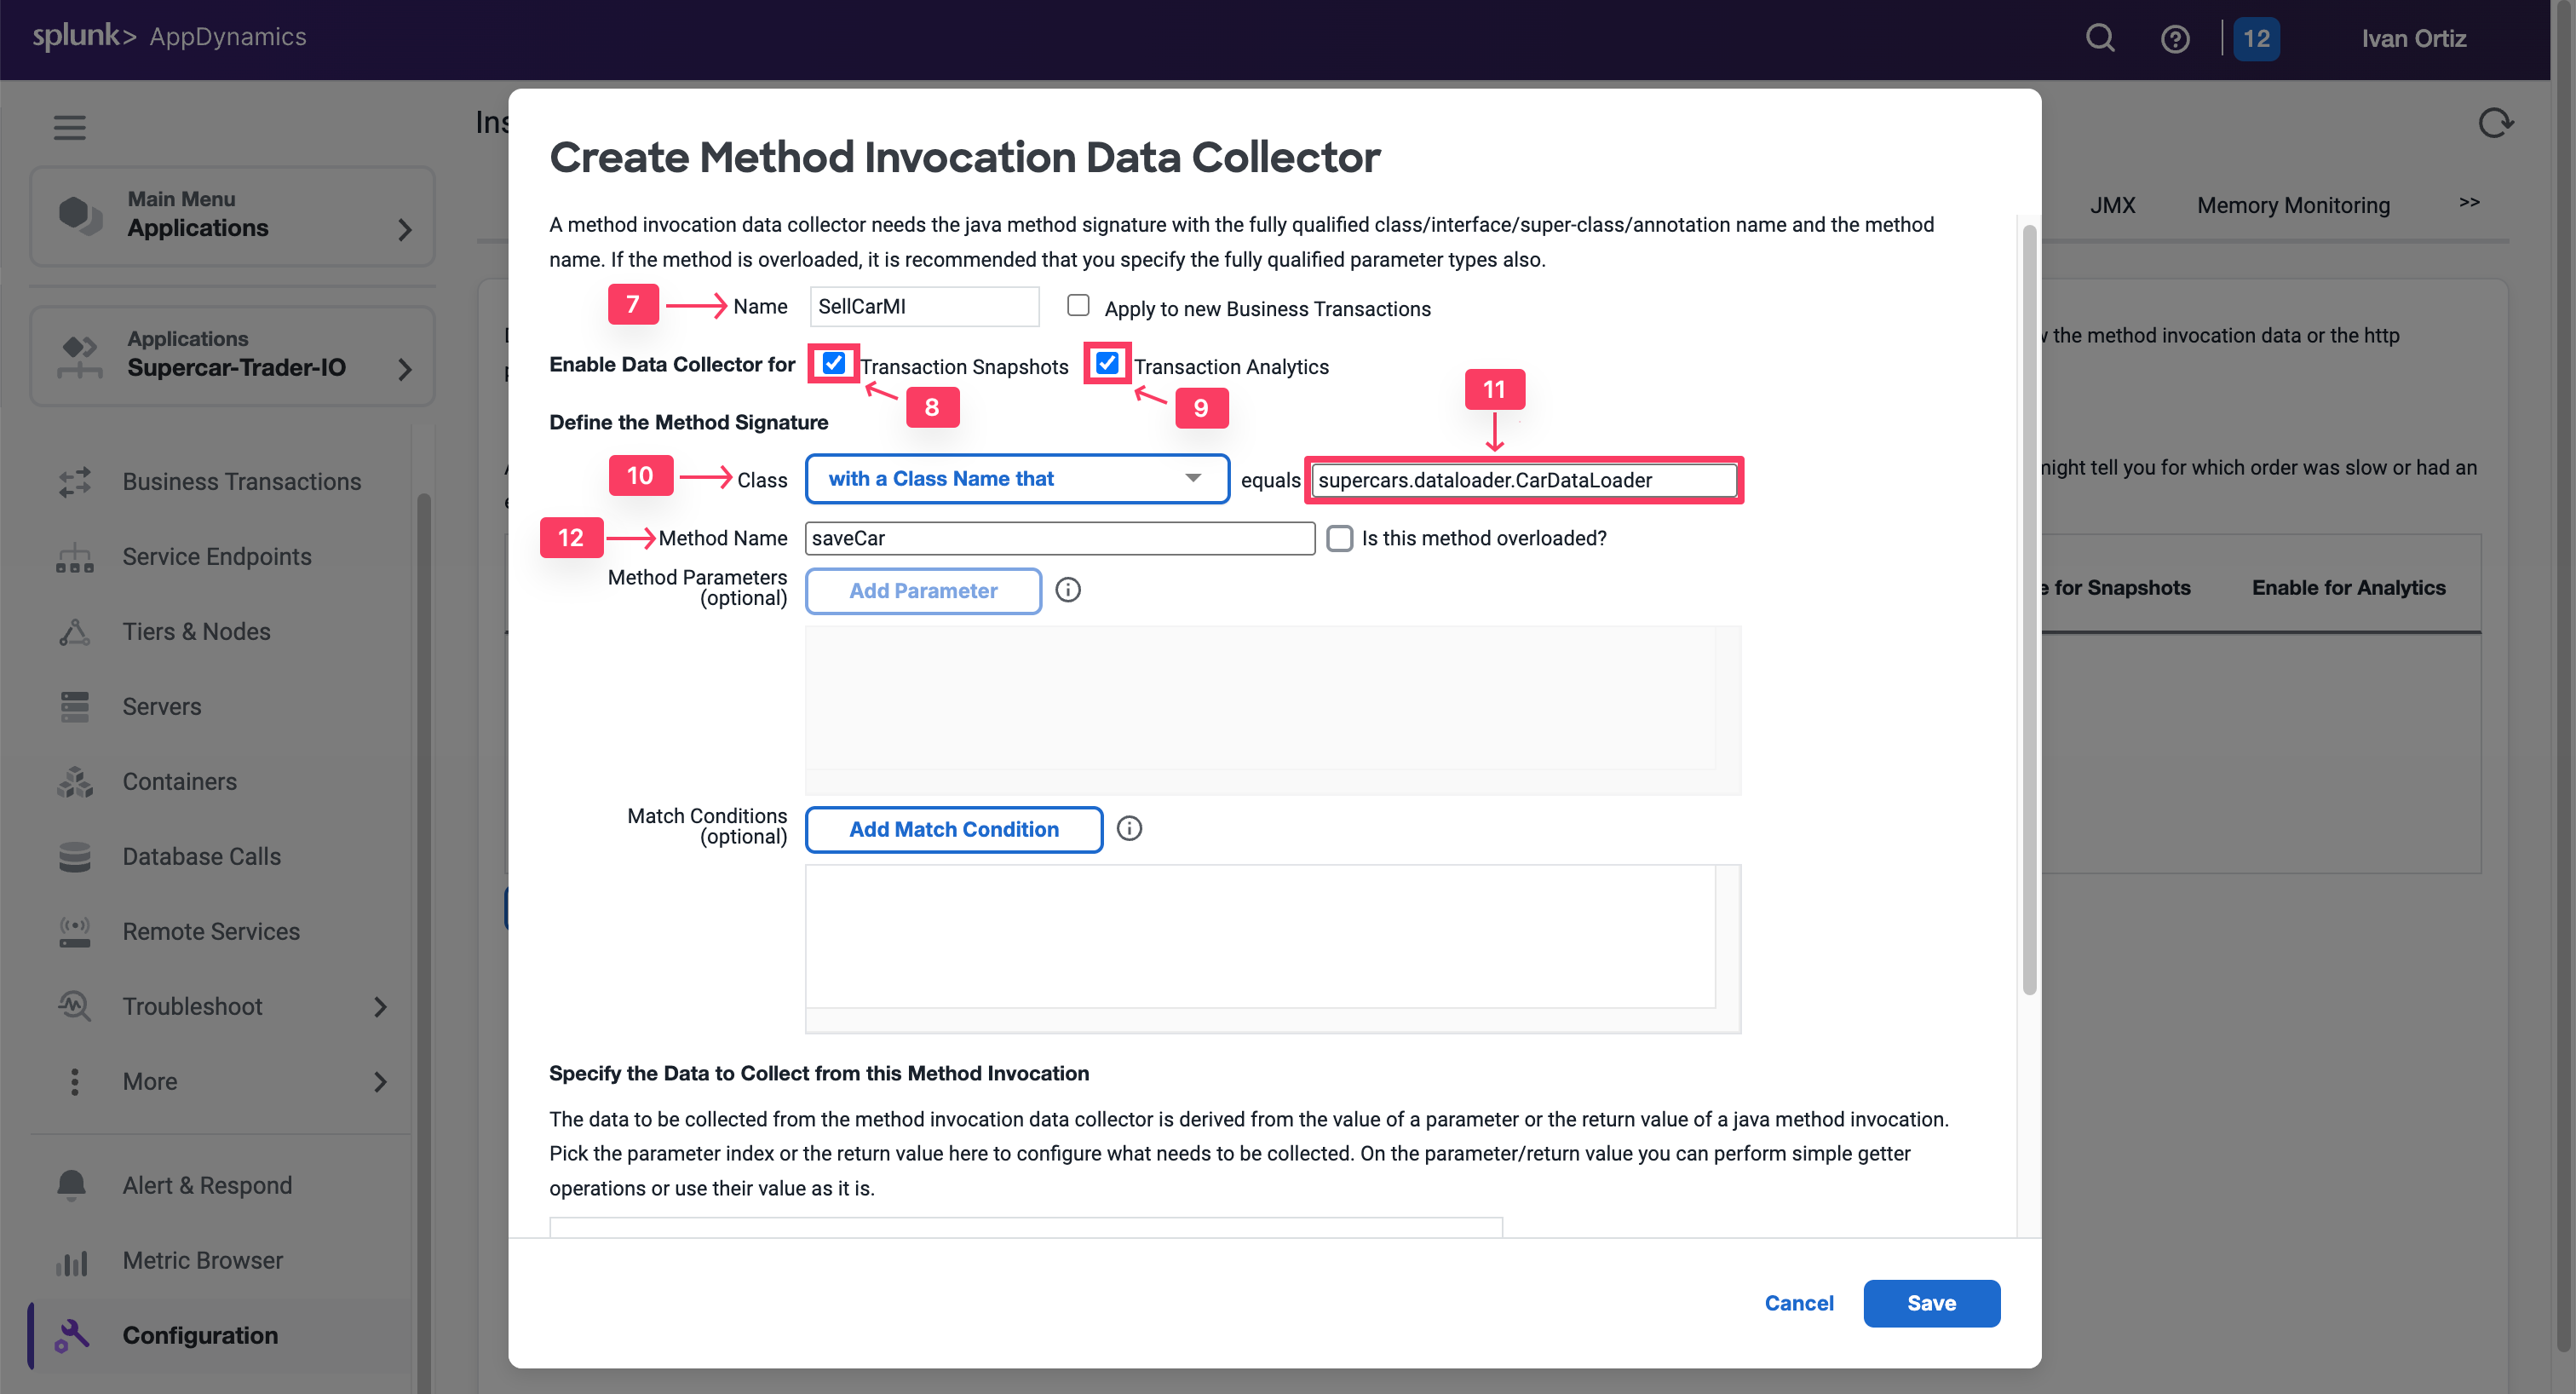
For the Name, specify SellCarMI-YOURINITIALS.
Enable Transaction Snapshots.
Enable Transaction Analytics.
Select with a Class Name that.
Add supercars.dataloader.CarDataLoader as the Class Name.
Add saveCar as the Method Name.
Then as observed, the Input Parameter of Index 0 in SaveCar method was an on Object of Class CarForm, and then there is a Getter method inside that object that returns the car details properties such as getPrice().
So to explain that how we fetched that value in the MIDC, we will do the below:
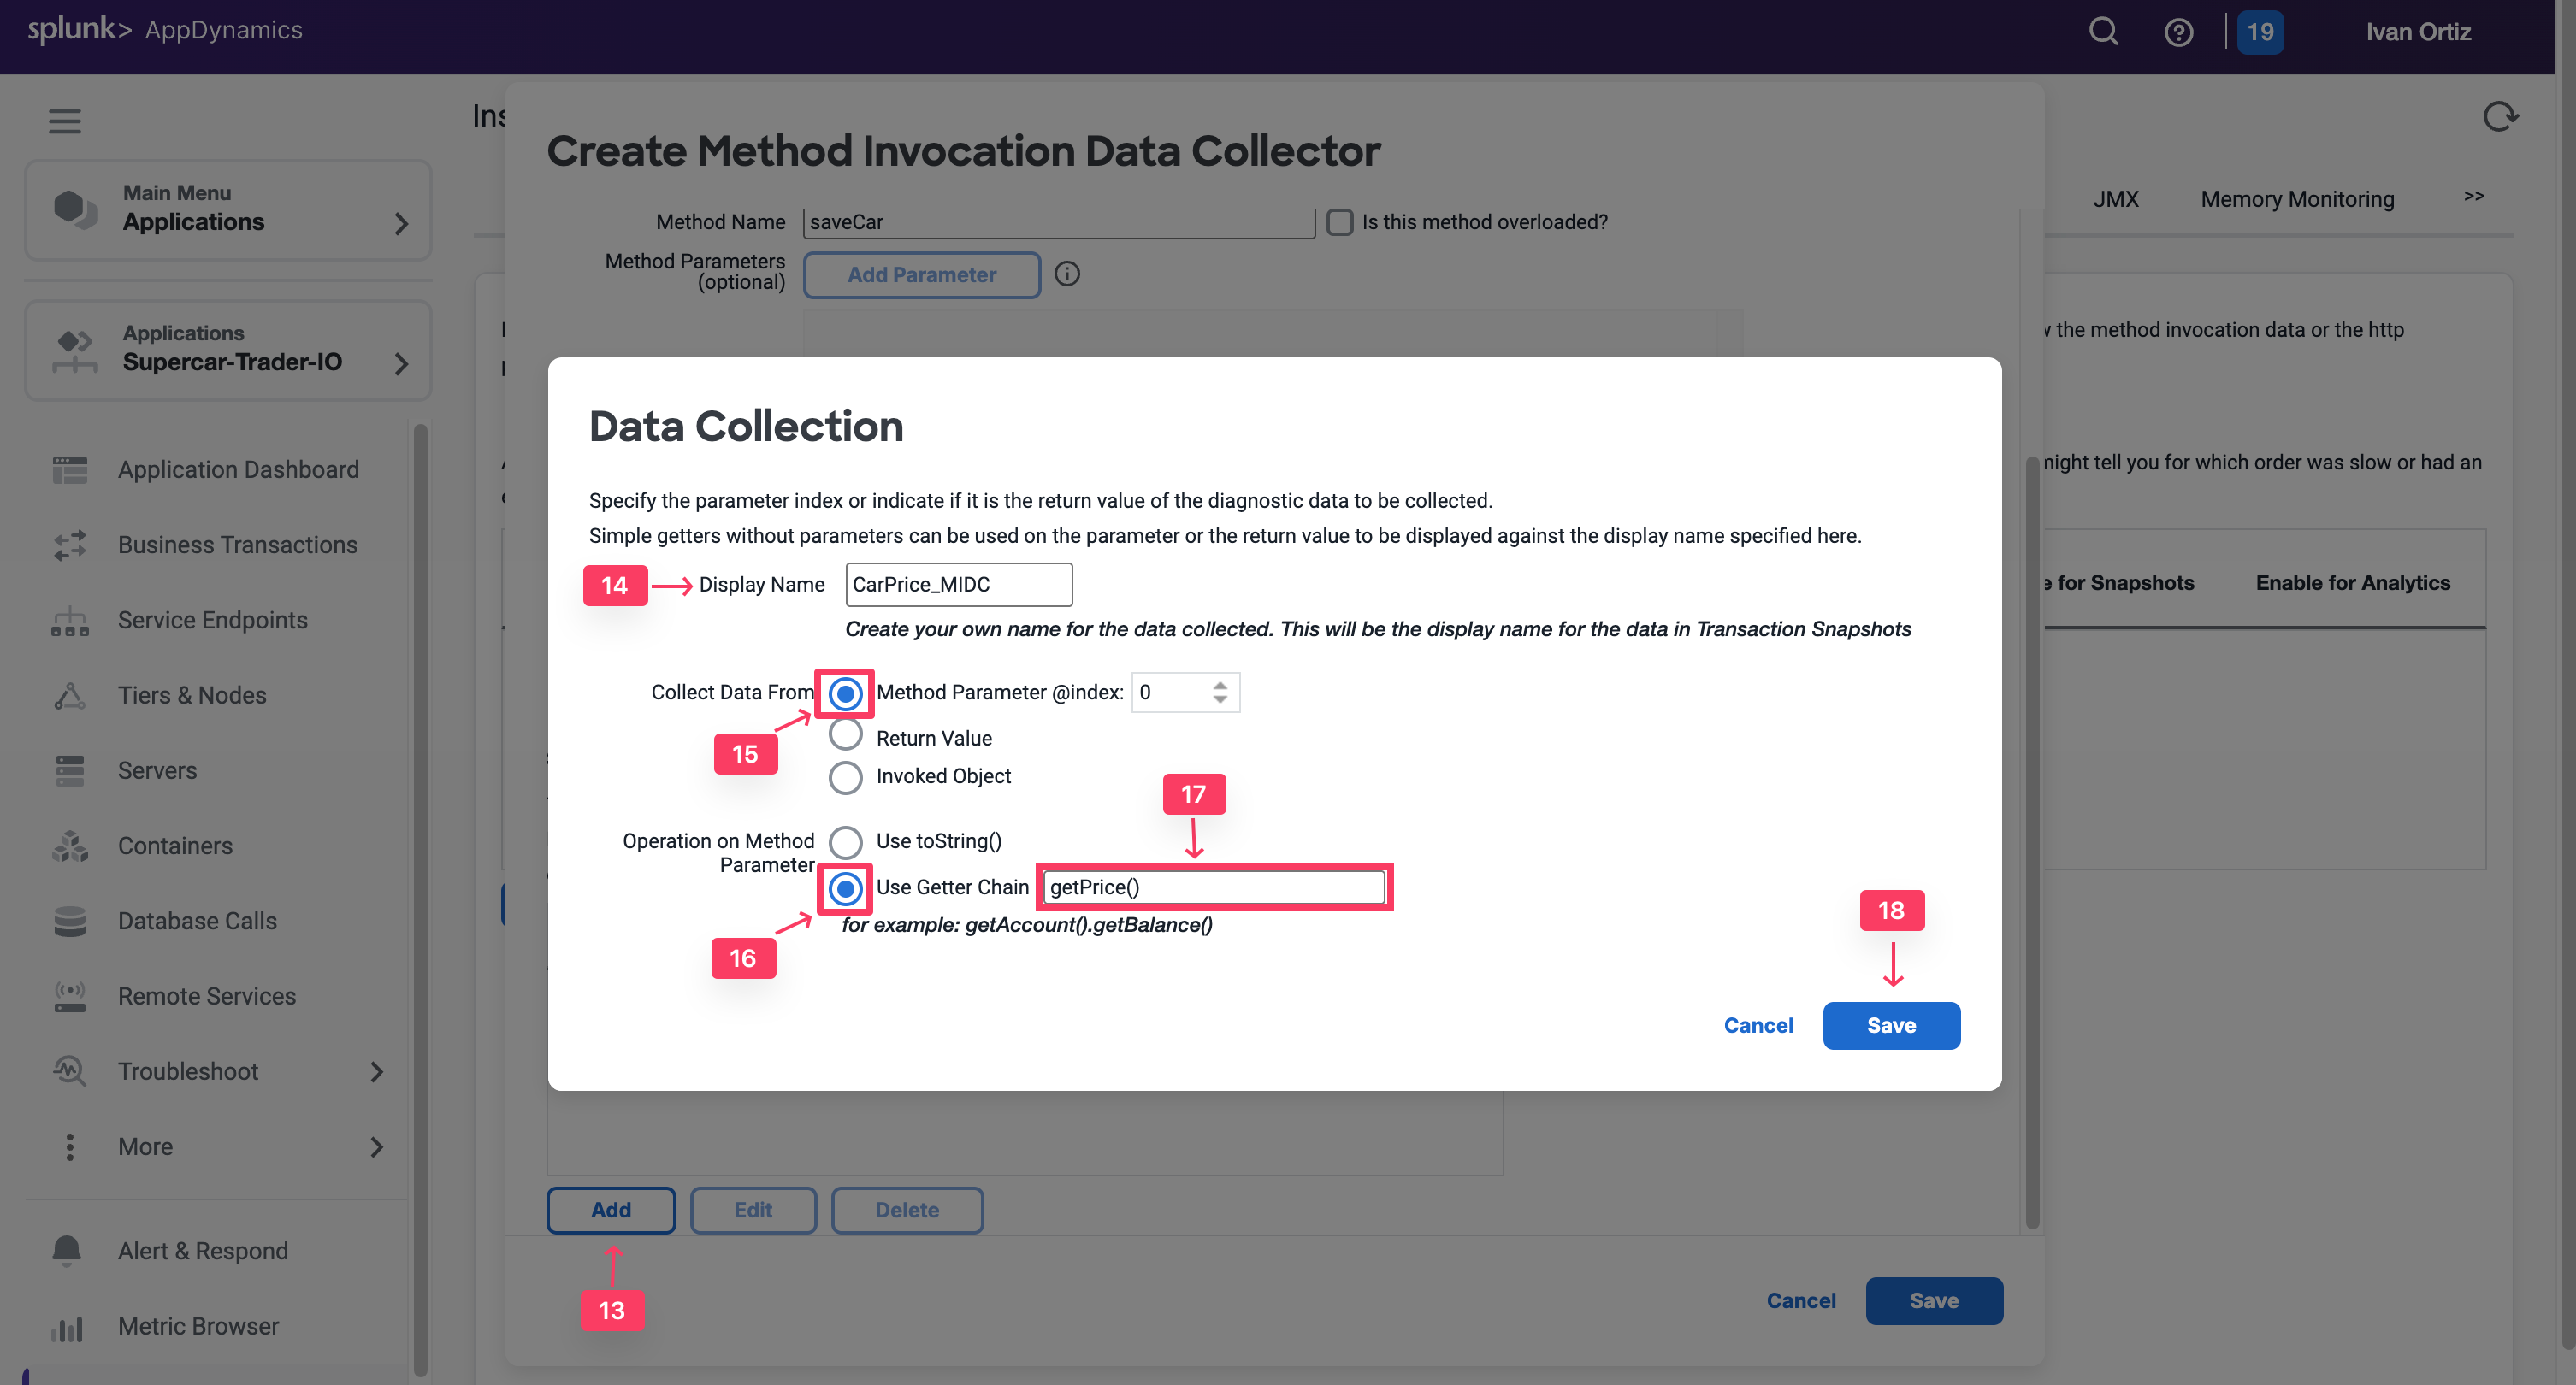
Click on Add at the bottom of the MIDC panel, to specify the new data that you want to collect.
In the Display Name, specify CarPrice_MIDC
In the Collect Data From, select Method Parameter of Index 0, which is our CarForm Object.
For the Operation on Method Parameter, select Use Getter Chain. You will be calling a method inside CarForm to return the car details.
Then specify getPrice(), the Getter method inside the CarForm class that will return the price.
Click Save.
Repeat the above steps for all the properties, including color, model, and any others that you want to collect data for.
Save MIDC, and apply to the ”/Supercar-Trader/sell.do” business transaction.
The implementation of the MIDC requires that we restart the JVM:
SSH into your EC2 instance
Shutdown the Tomcat Sever
cd /usr/local/apache/apache-tomcat-9/bin
./shutdown.sh
If you find any remaining application JVMs still running, kill the remaining JVMs using the command below.
sudo pkill -f Supercar-Trader
Restart the Tomcat Server
./startup.sh
Validate that the Tomcat server is running, this can take a few minutes
Go to the website and apply some manual load on the Sell Car Page by submitting the form a couple of times.
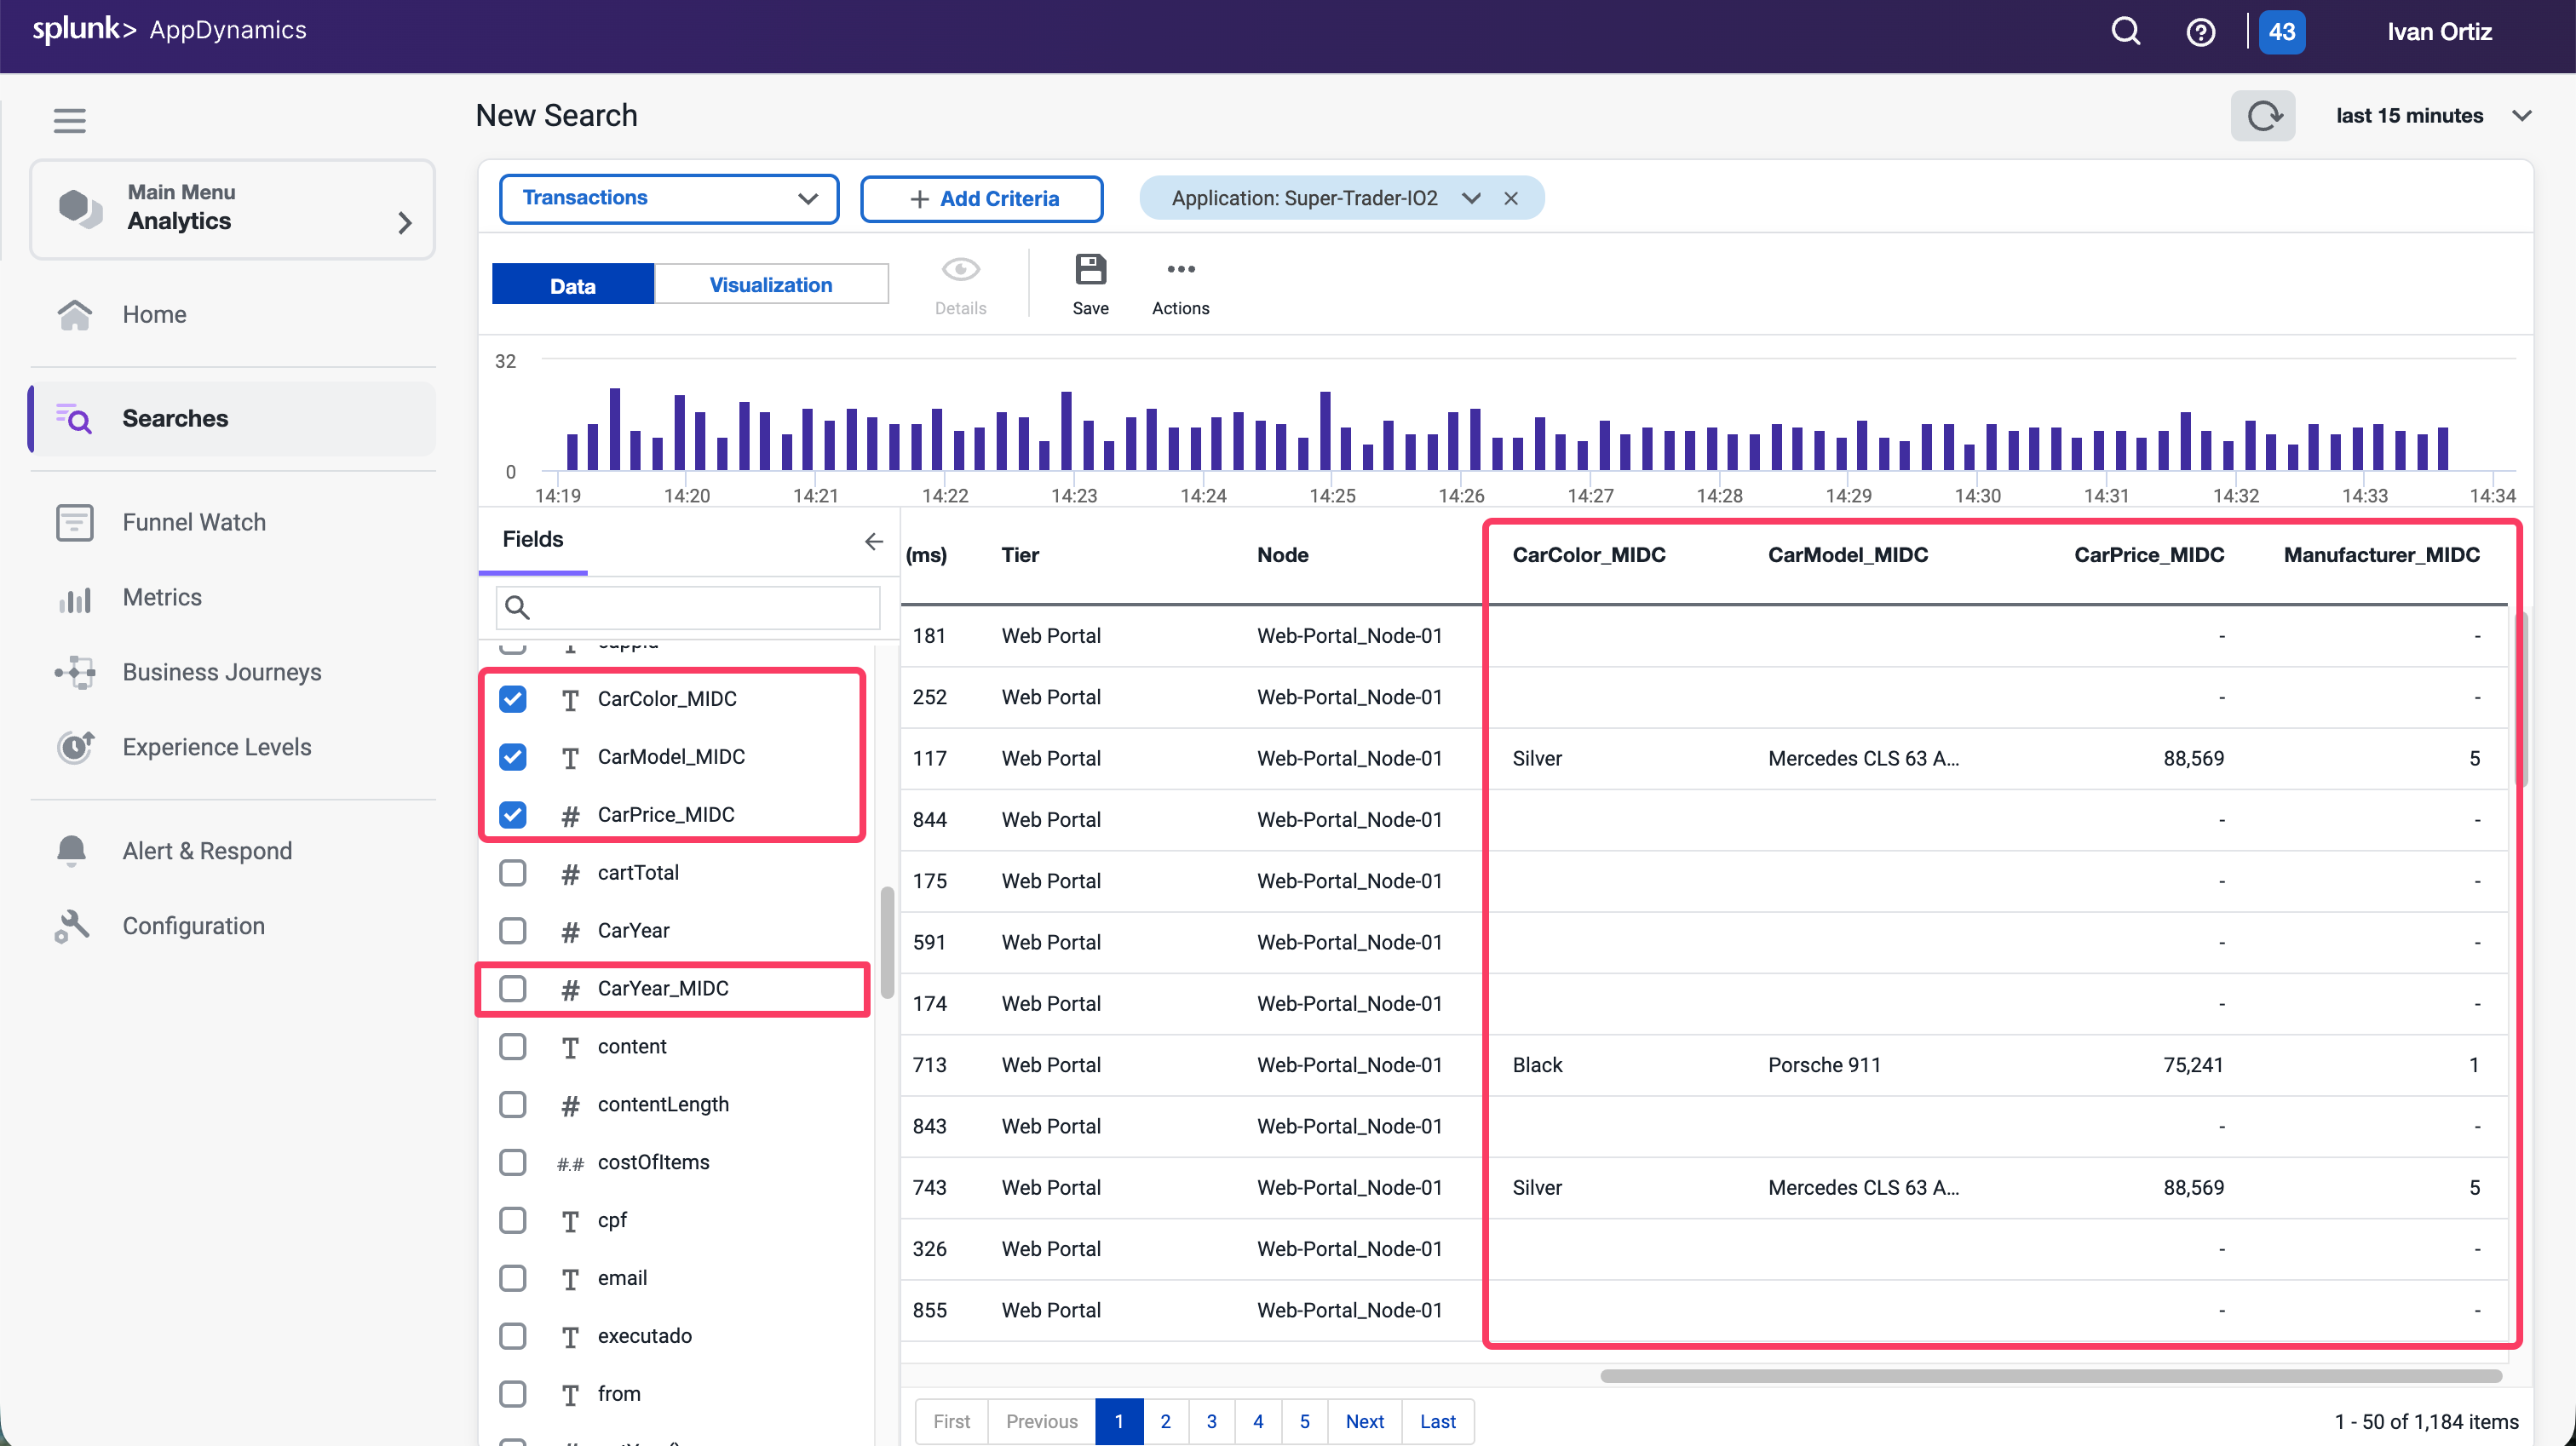
You will now verify if the business data was captured by HTTP data collectors in AppDynamics Analytics.
Select the Analytics tab.
Select the Searches tab and Add a new Drag and Drop Search.
Click the + Add button and create a new Drag and Drop Search.
Click + Add Criteria
Select Application and Search For Your Application Name Supercar-Trader-YOURINITIALS
Verify that the Business Parameters appear as a field in the Custom Method Data.
Verify that the CarPrice Field has data.
Conclusion
You have now captured the business data from the Sell Car transaction from the node at runtime. This data can be used in the Analytical and Dashboard features within AppDynamics to provide more context to the business and measure IT impact on the business.
Dashboard Components
2 minutes
The ability to build dashboards is a vital component of the AppDynamics capabilities and value. In this exercise,you will work with some of the dashboard components that can be used to build compelling dashboards.
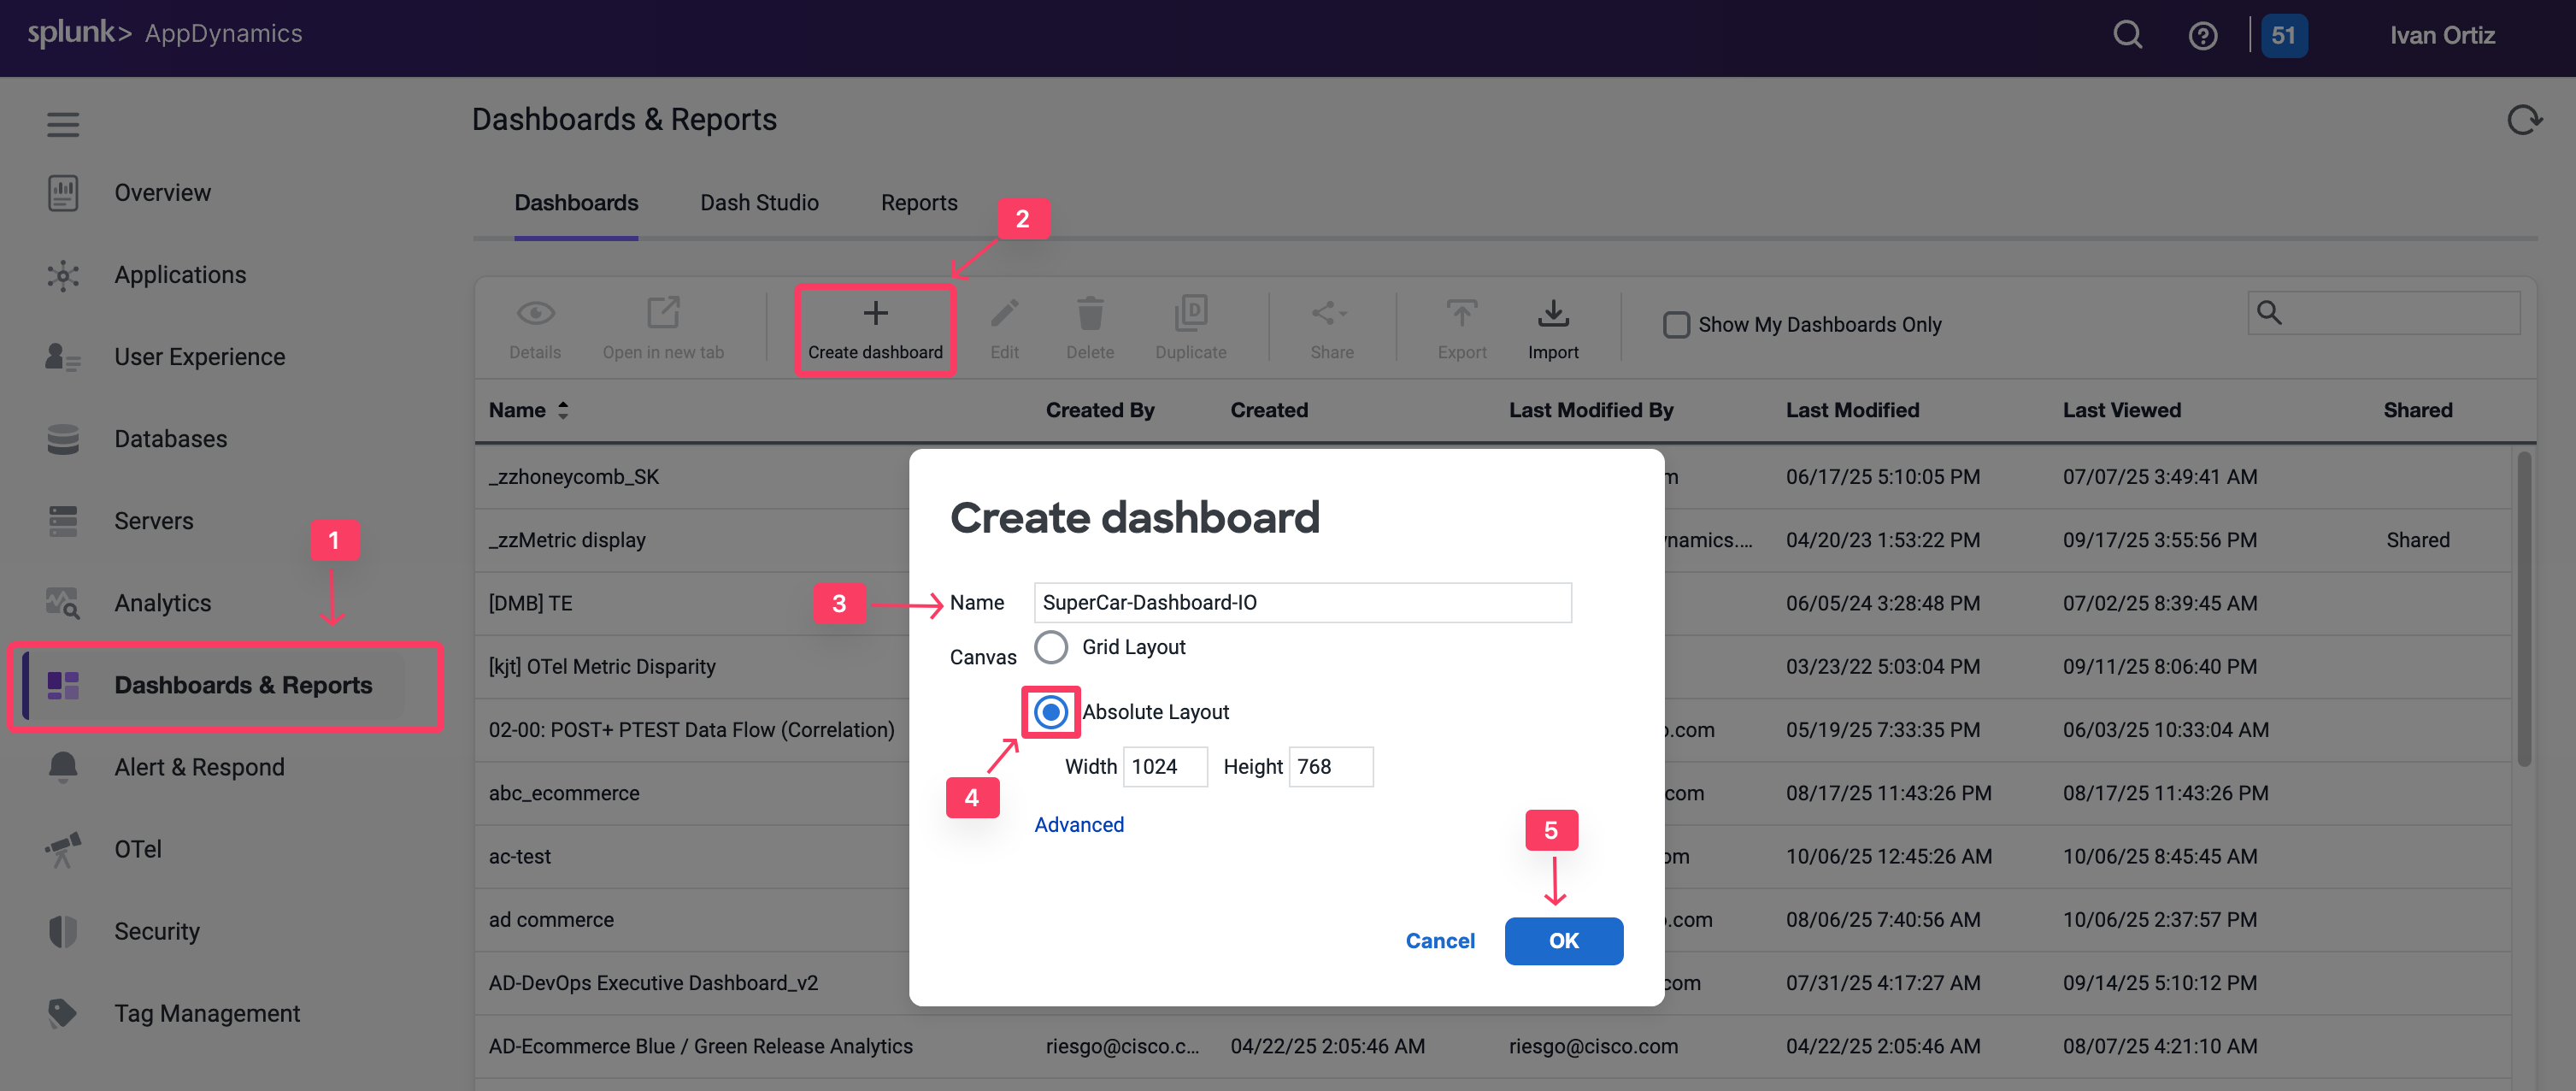
Create a new dashboard
Select the Dashboard & Reports tab.
Click Create Dashboard.
Enter a dashboard name such as SuperCar-Dashboard-YOURINITIALS.
Select Absolute Layout as the Canvas Type.
Click OK.
Now open the newly created empty dashboard. You will now add various widget types.
Dashboard components custom widget builder
The custom widget builder is a highly flexible tool that can generate representations of data, including numeric vews, time series, pie charts, and more. It is based on the AppDynamics AD Query Language.
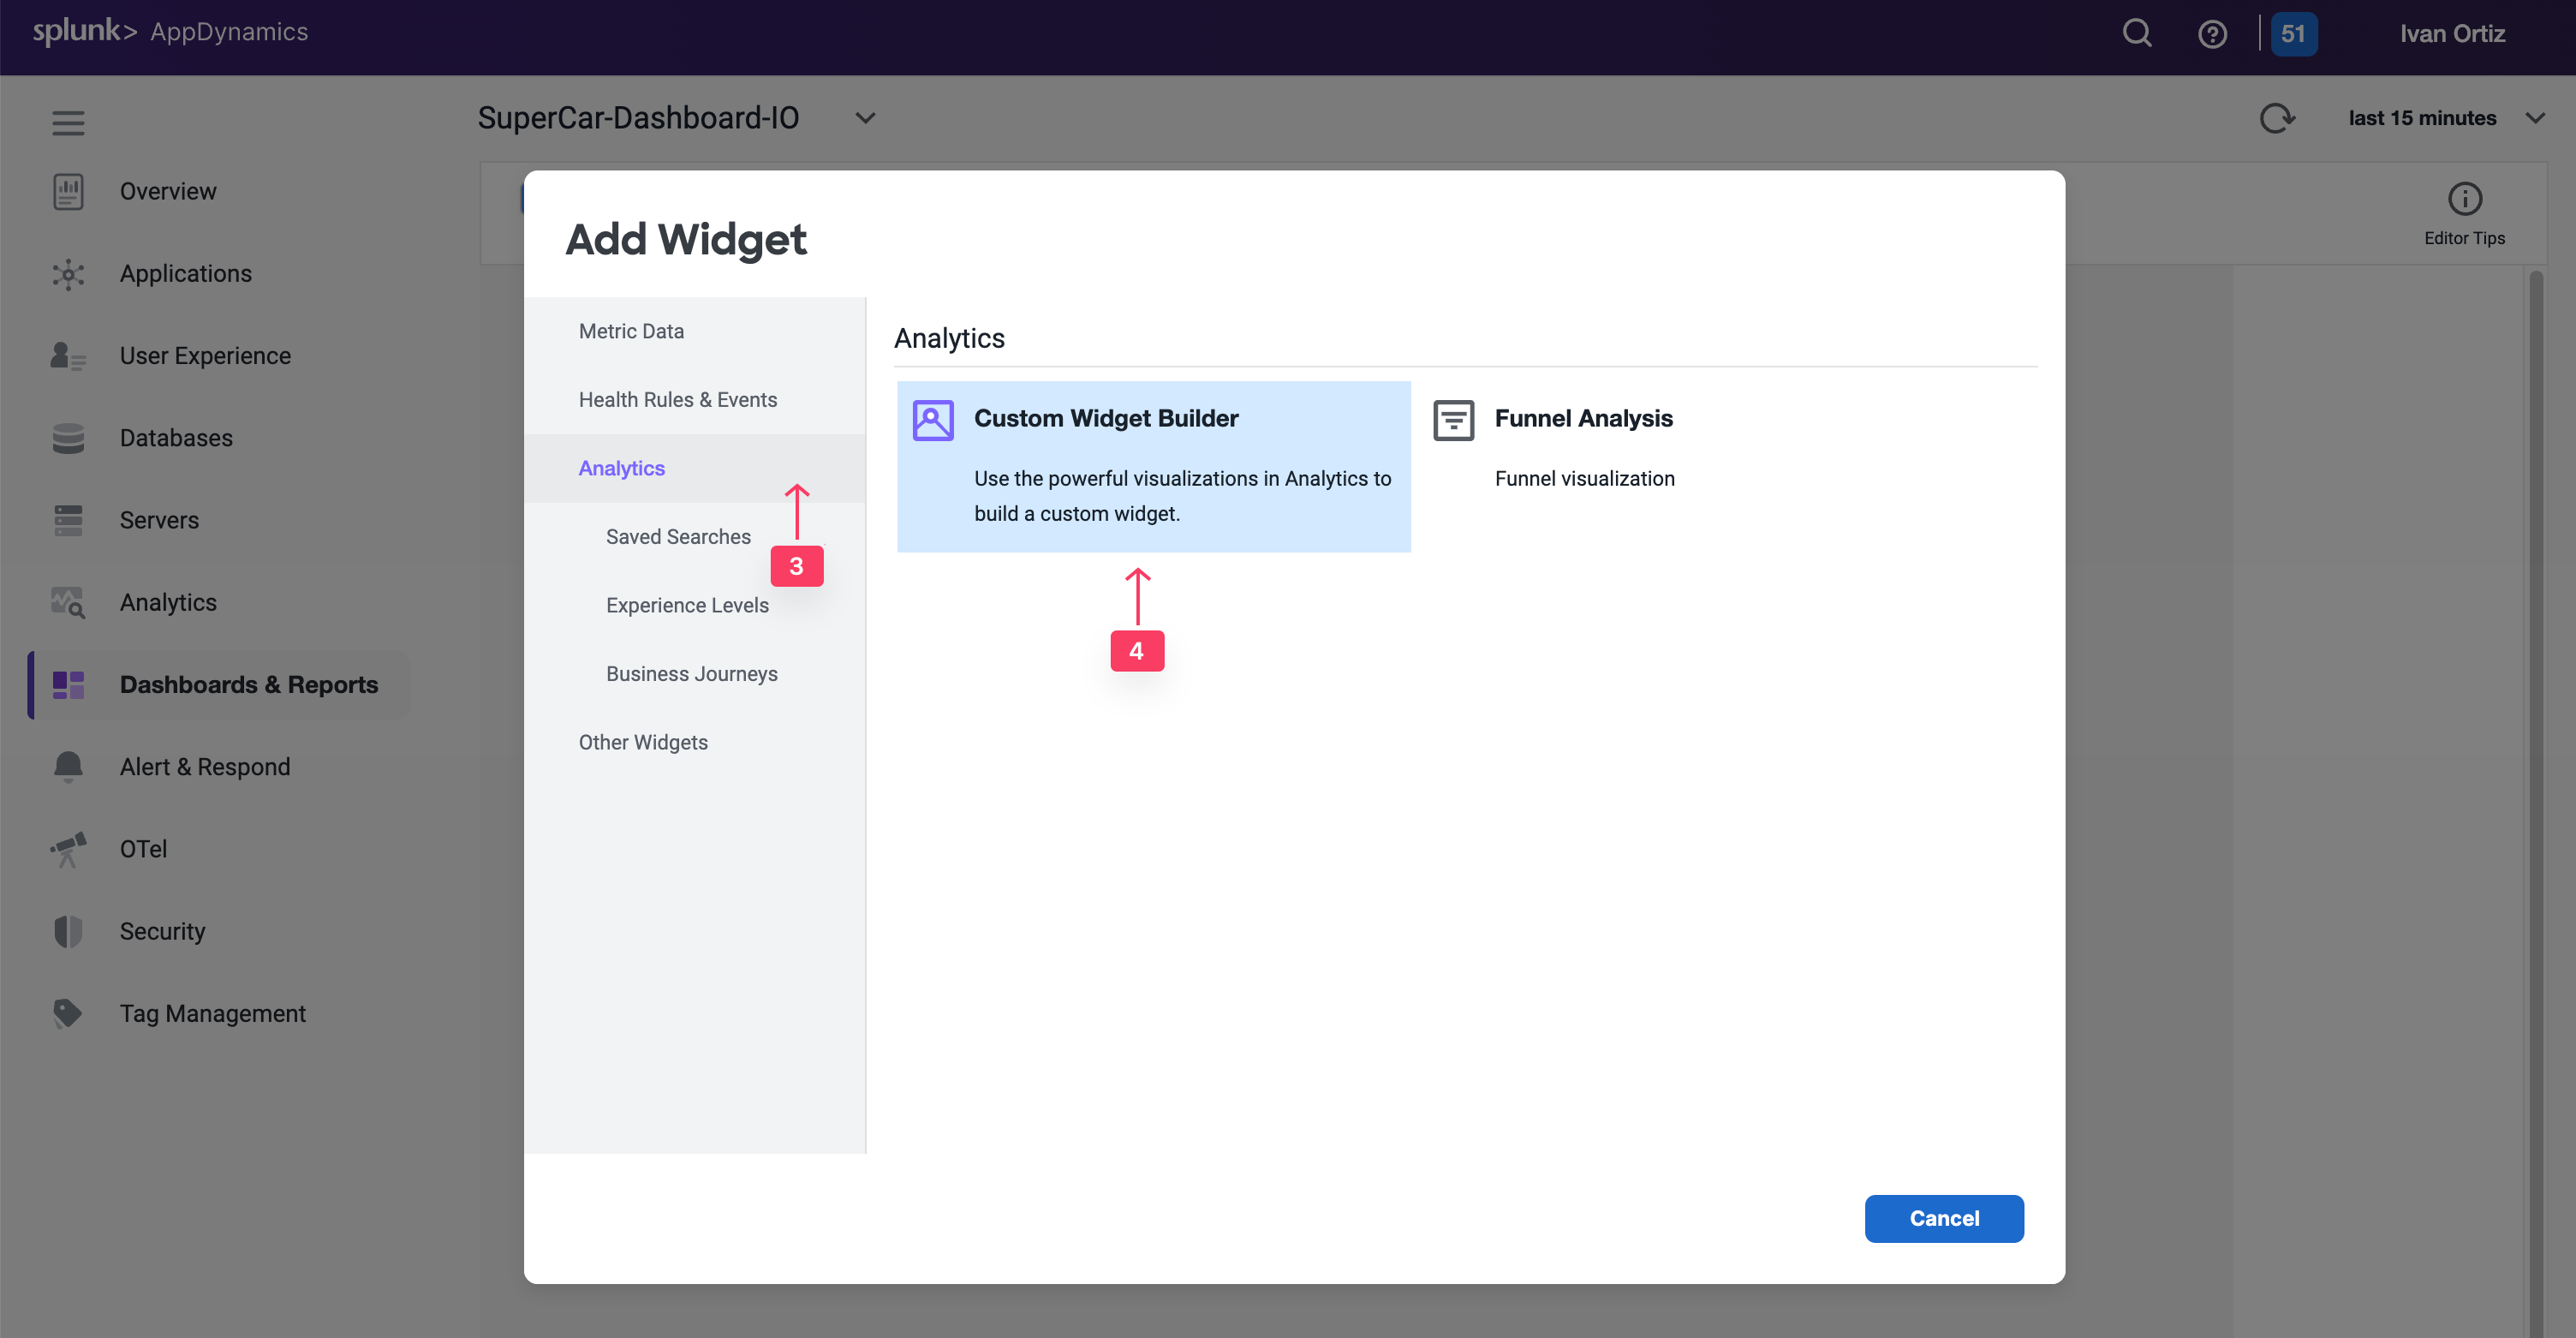
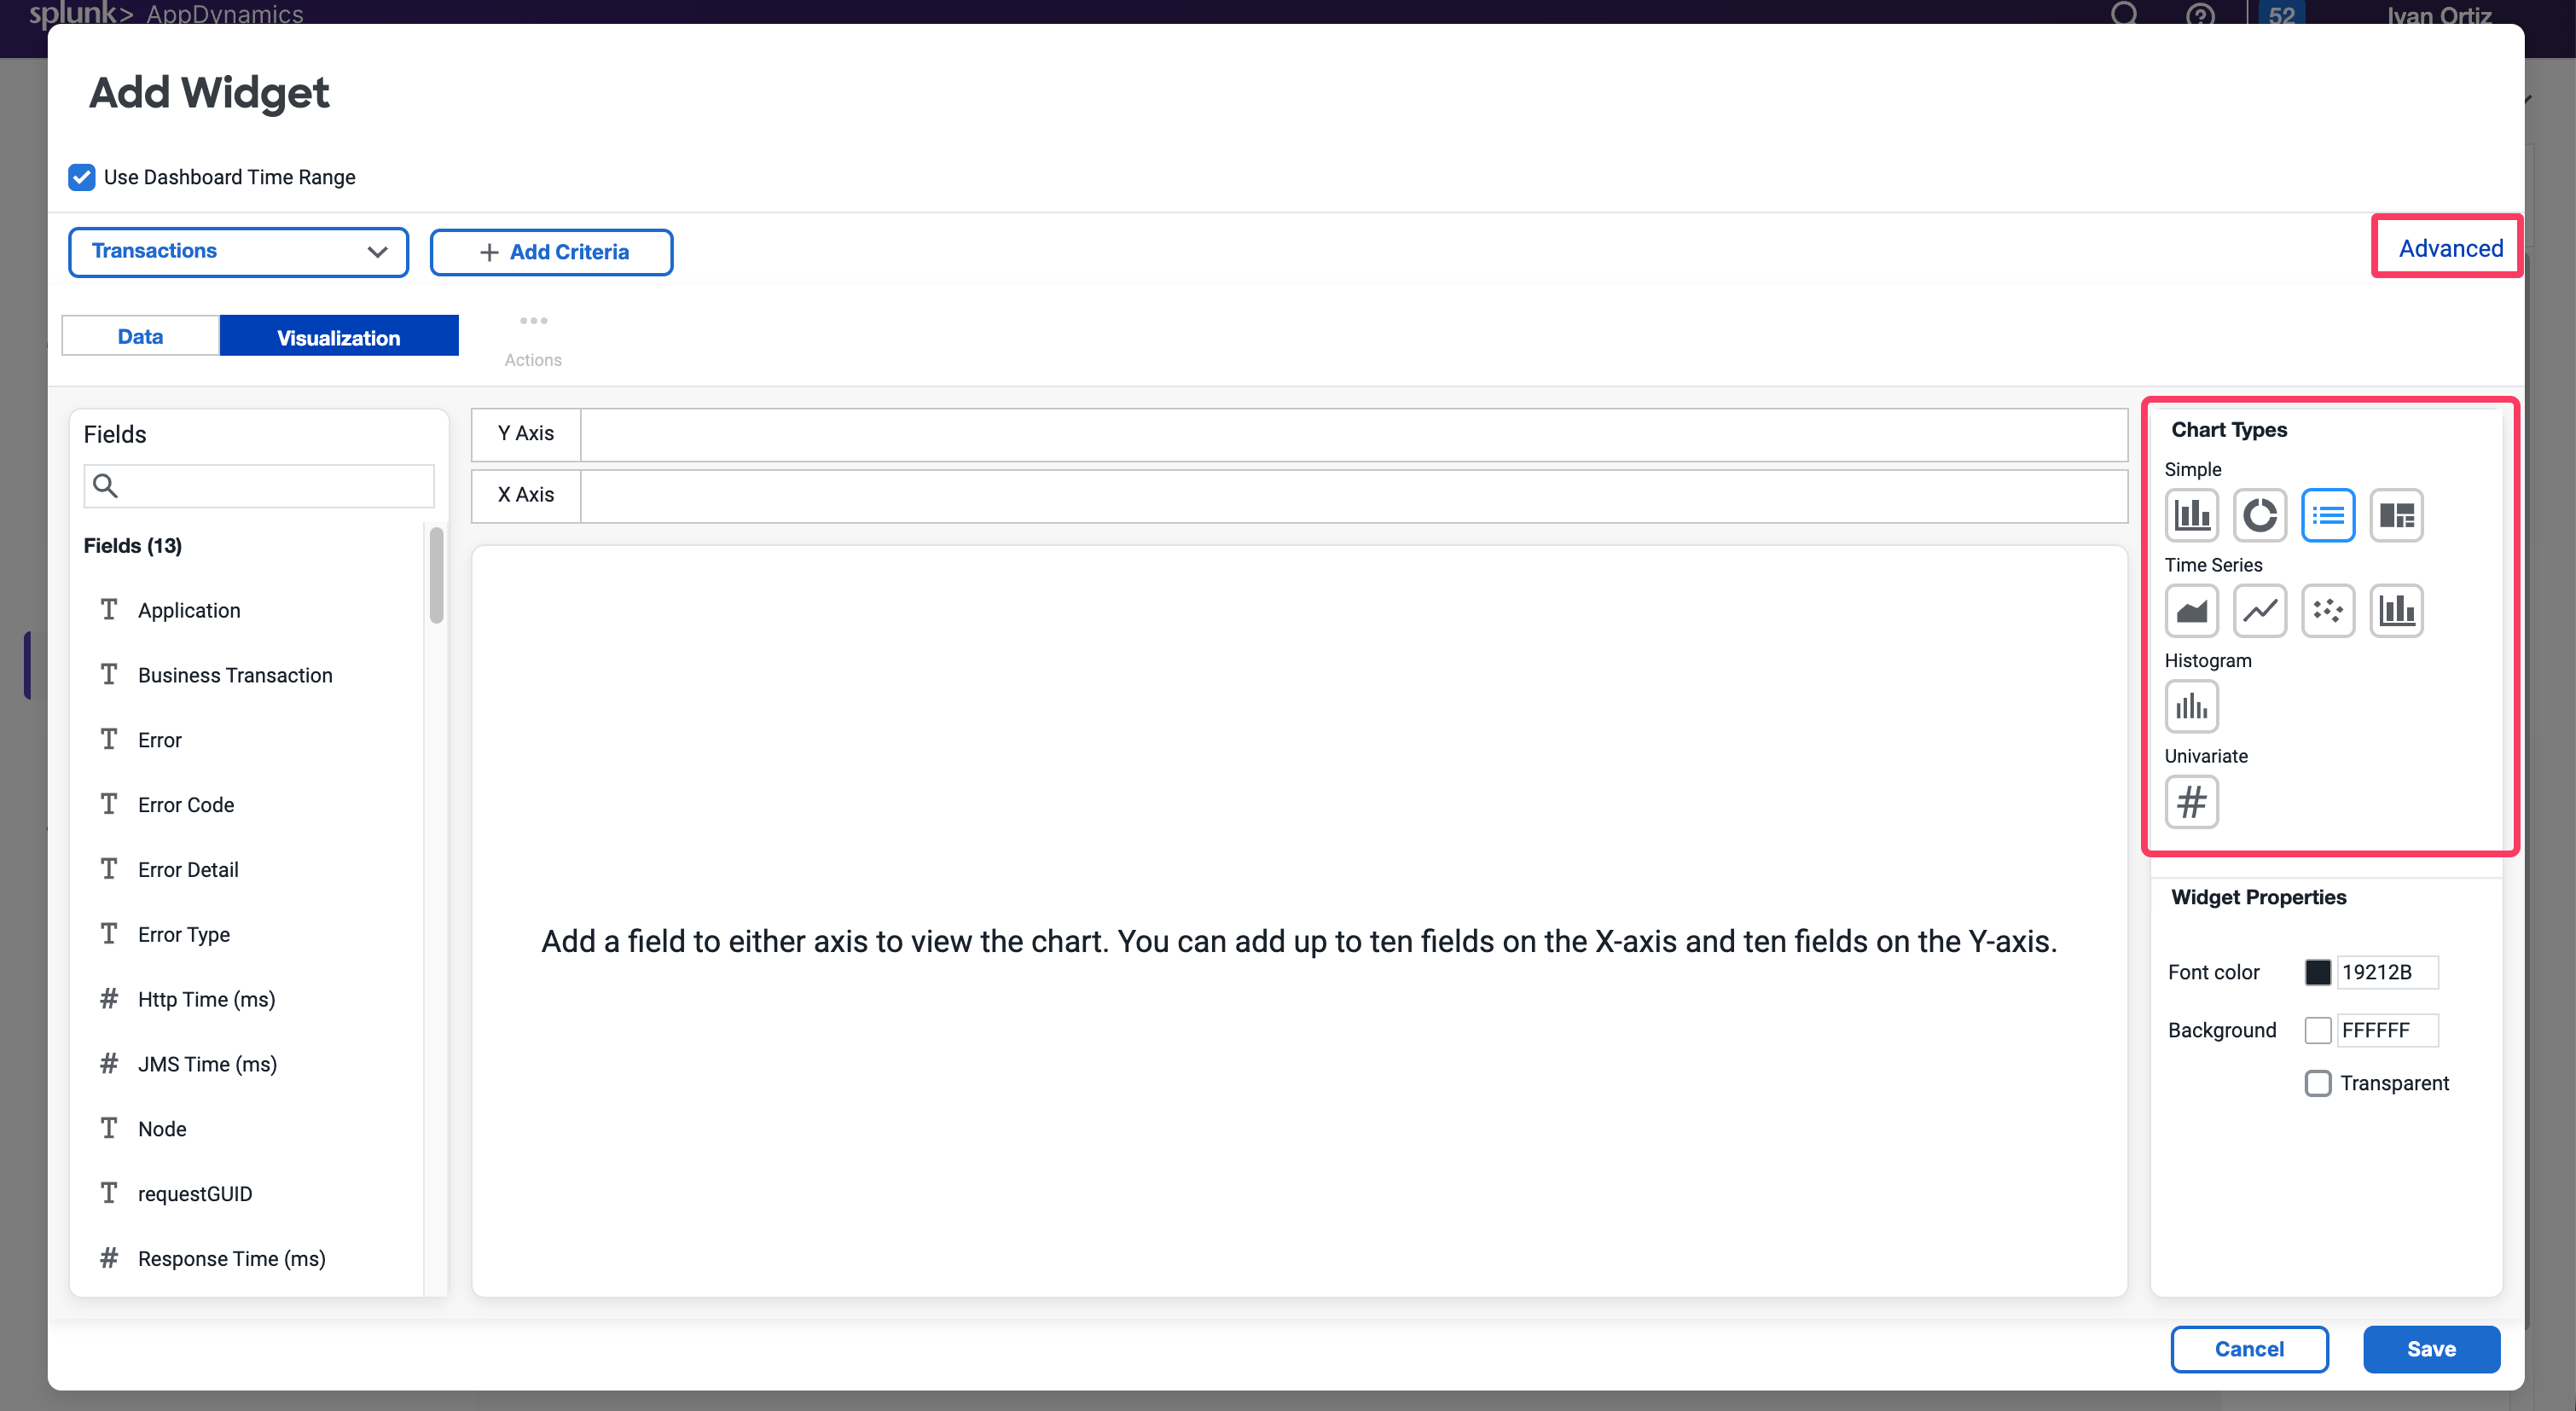
To create a widget, follow these steps:
Toggle the Edit Mode at the upper left corner of the dashboard.
Click Add Widget.
Select the Analytics tab on the left.
Click Custom Widget Builder.
There are many chart types that you can create in the Customer Widget Builder. You can simply drag or drop information or create an AD Query in the Advanced pane..
For now, we will cover Numeric, Bar and Pie Charts.
Numeric charts
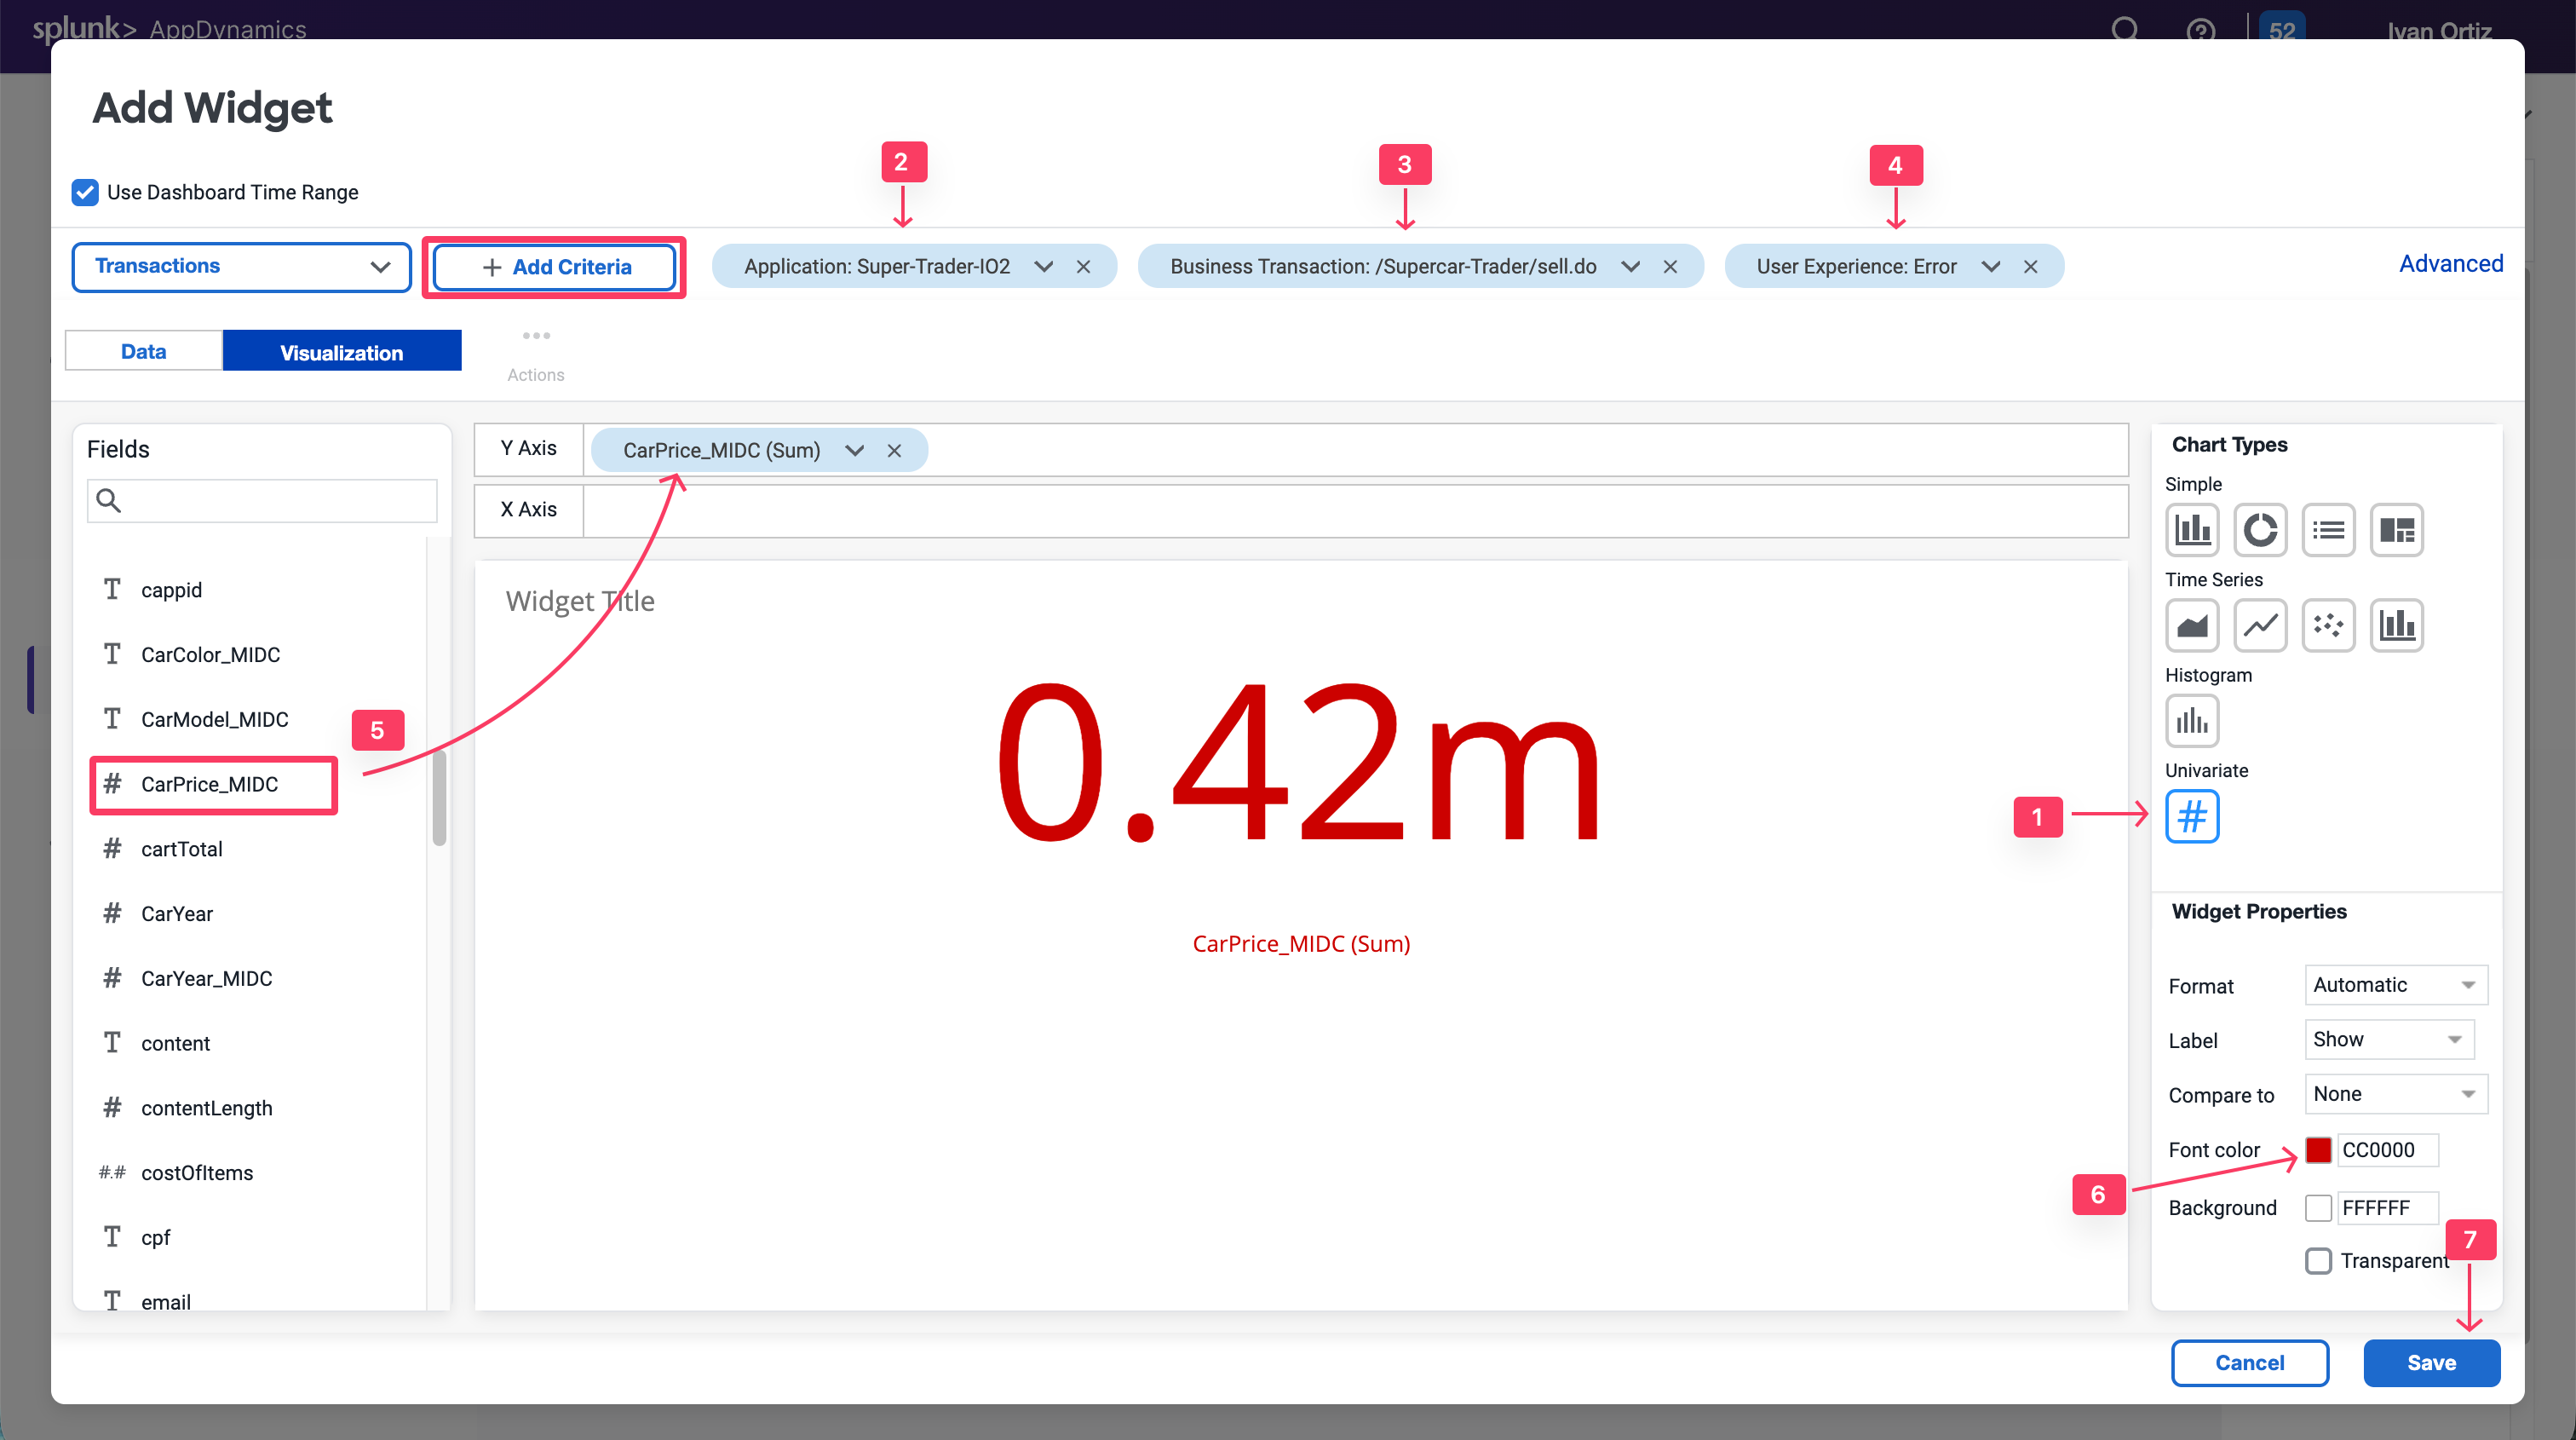
Exercise: Quantifying the dollar amount impacted by errors enables you to show the impact of IT performance on the business revenue.
Select the Numeric chart type.
Add a Filter on the Application field and Select your application name: Supercar-Trader-YOURINITIALS
Add a filter on the /Supercar-Trader/sell.do business transactions.
Add a filter on the User Experience Field selecting only the Error to show the impact of errors.
Find the CarPrice_MIDC field on the left panel and drag and drop it into the Y-Axis. Notice that SUM is the Aggregation used to capture the total price per model.
Change the font color to red for better visibility.
Click Save.
Note that you could do the same for the $ Amount Transacted Successfully criterion by changing the user experience filter to only include NORMAL, SLOW and VERY SLOW.
You could also baseline this metric by creating a custom metric in the Analytics module and defining a health rule that indicates if the $ Amount Impacted is equal to or higher than the baseline. You can also add a label for the currency.
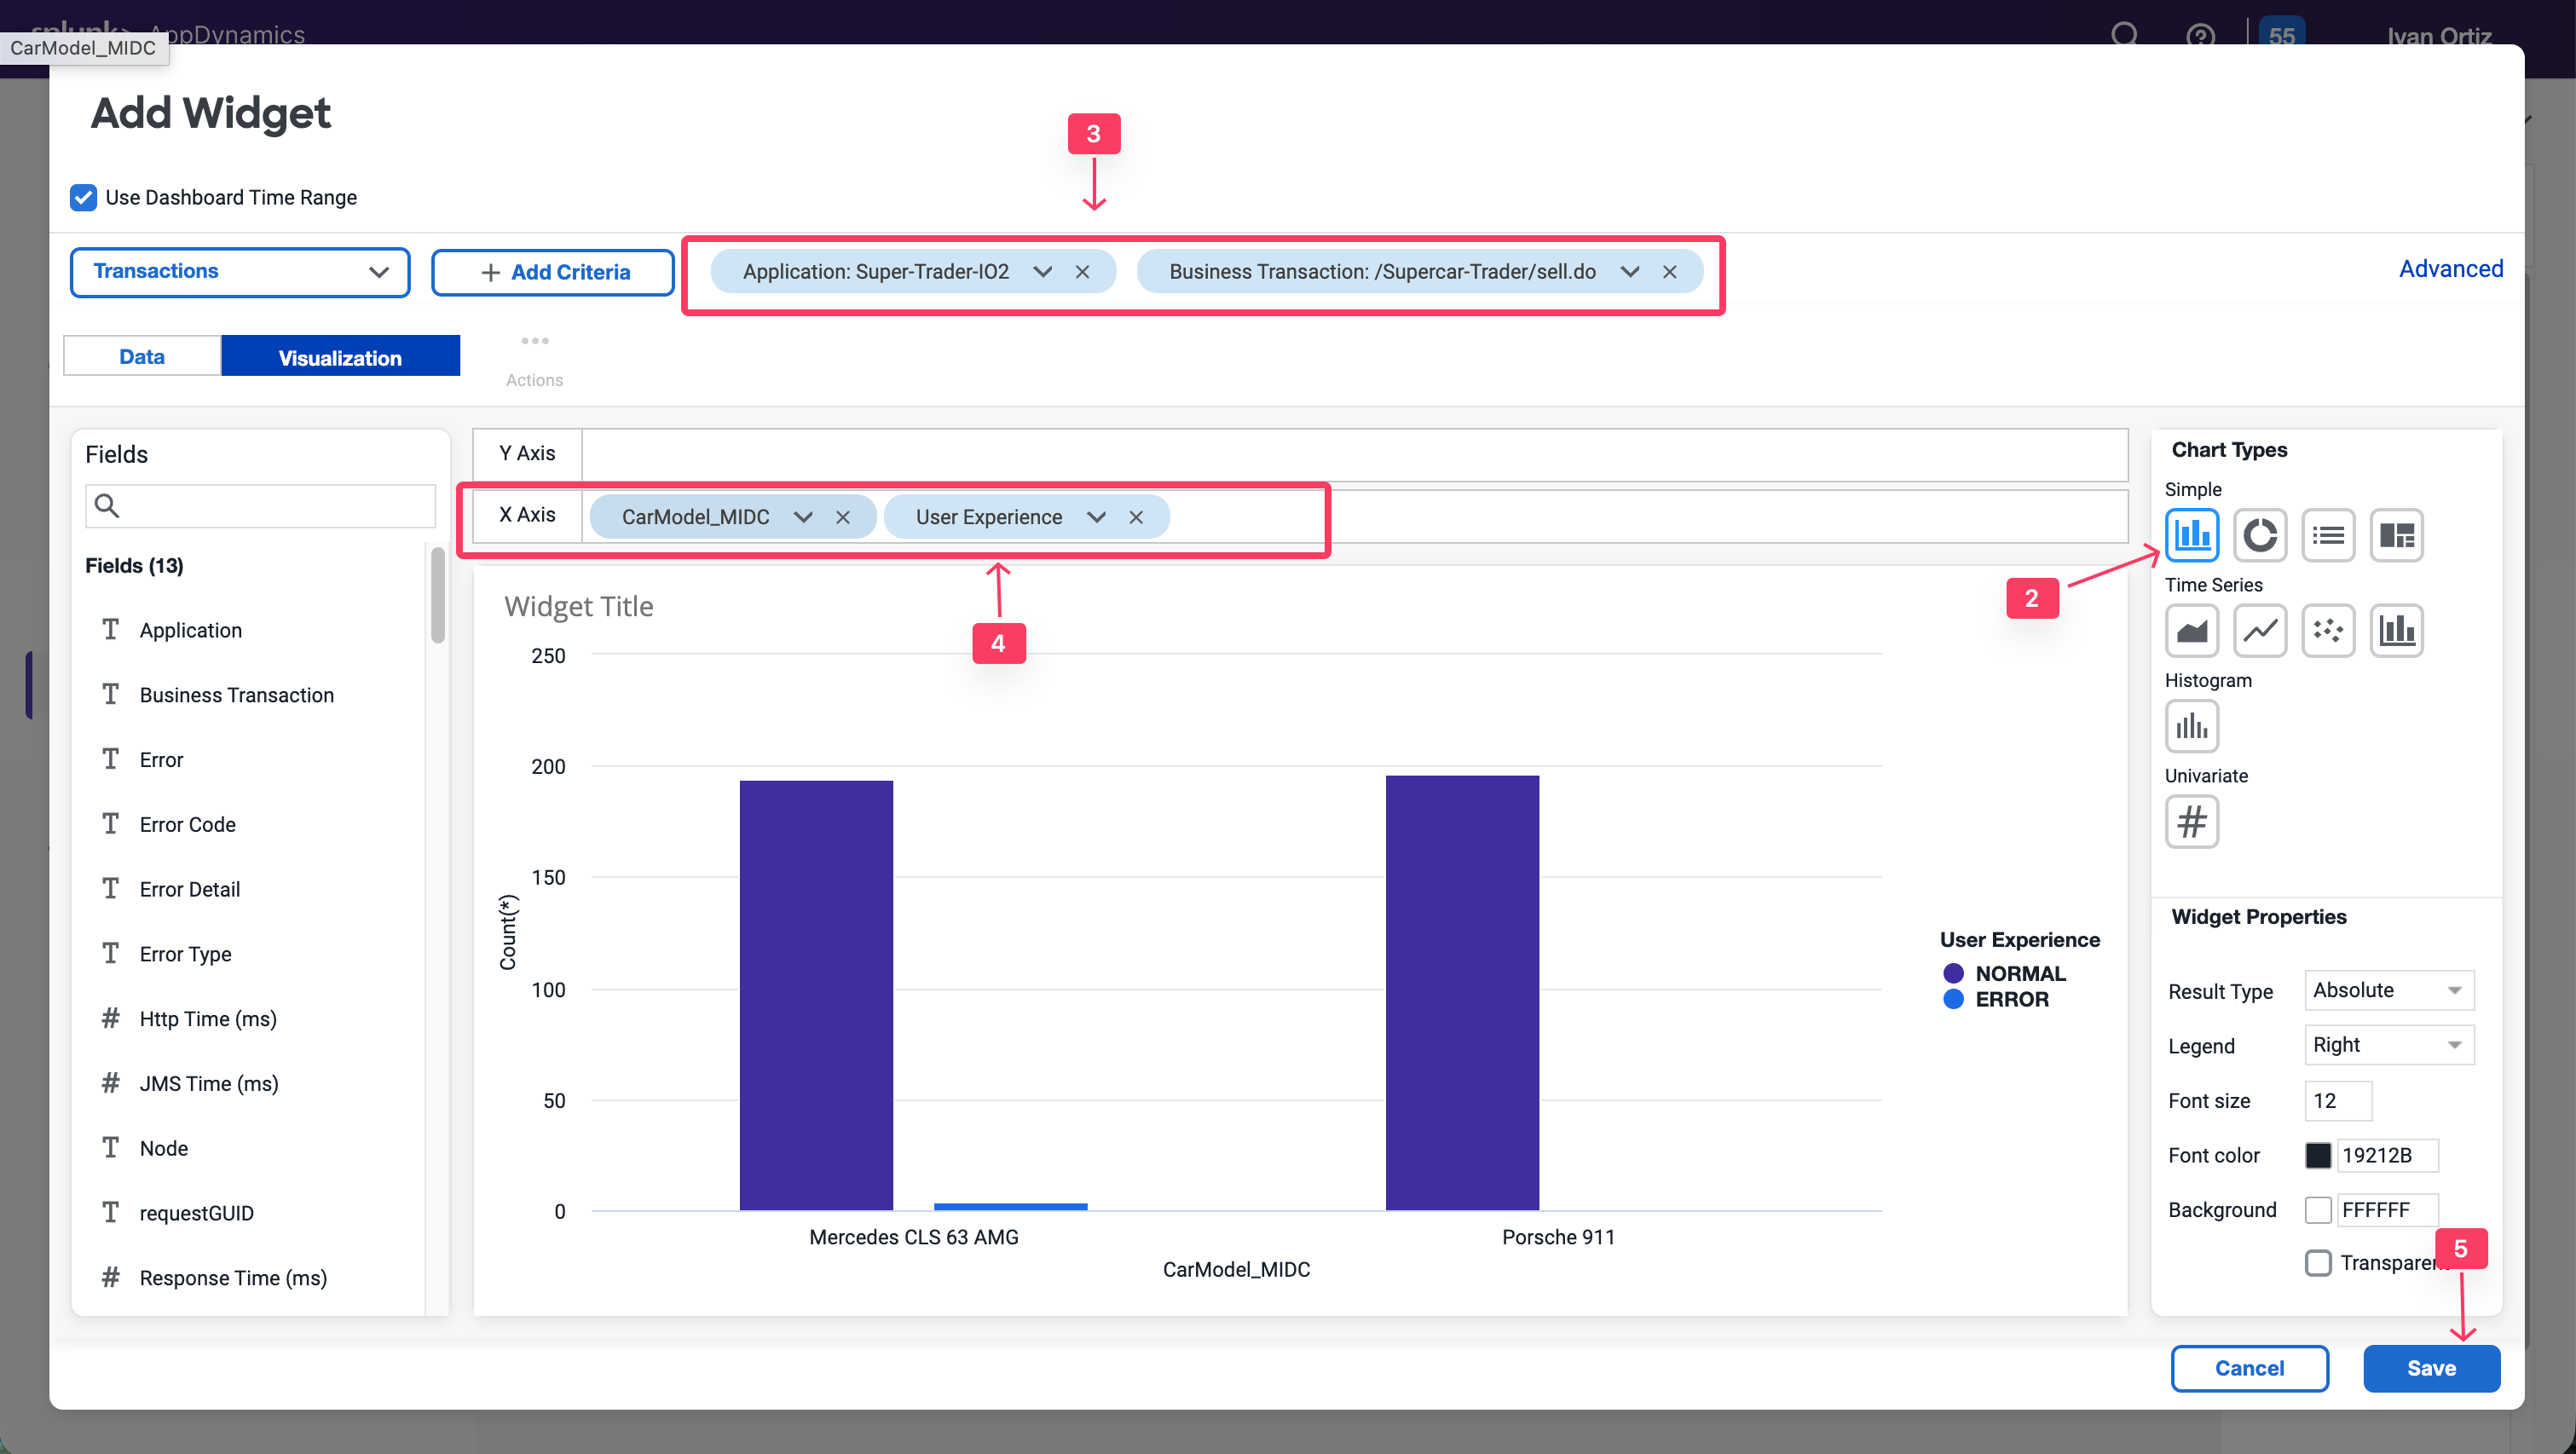
Bar charts
Exercise: You will now create a bar chart to visualize Top Impacted Car Models. The chart will show the car models of all of the SellCar transactions, categorized by the User Experience.
Create a New Widget by clicking + Add Widget, Analytics and Custom Widger Builder
Select the Column chart type.
Add the following filters: Application = Supercar-Trader-YOURINITIALS and Business Transaction = /Supercar-Trader/sell.do.
Add CarModel_MIDC and User Experience to the X-Axis.
Click Save.
This chart type can be adjusted based on your need. For example, you could group the X-AXIS by Customer Type, Company, Organization, and more. Refer to the following example.
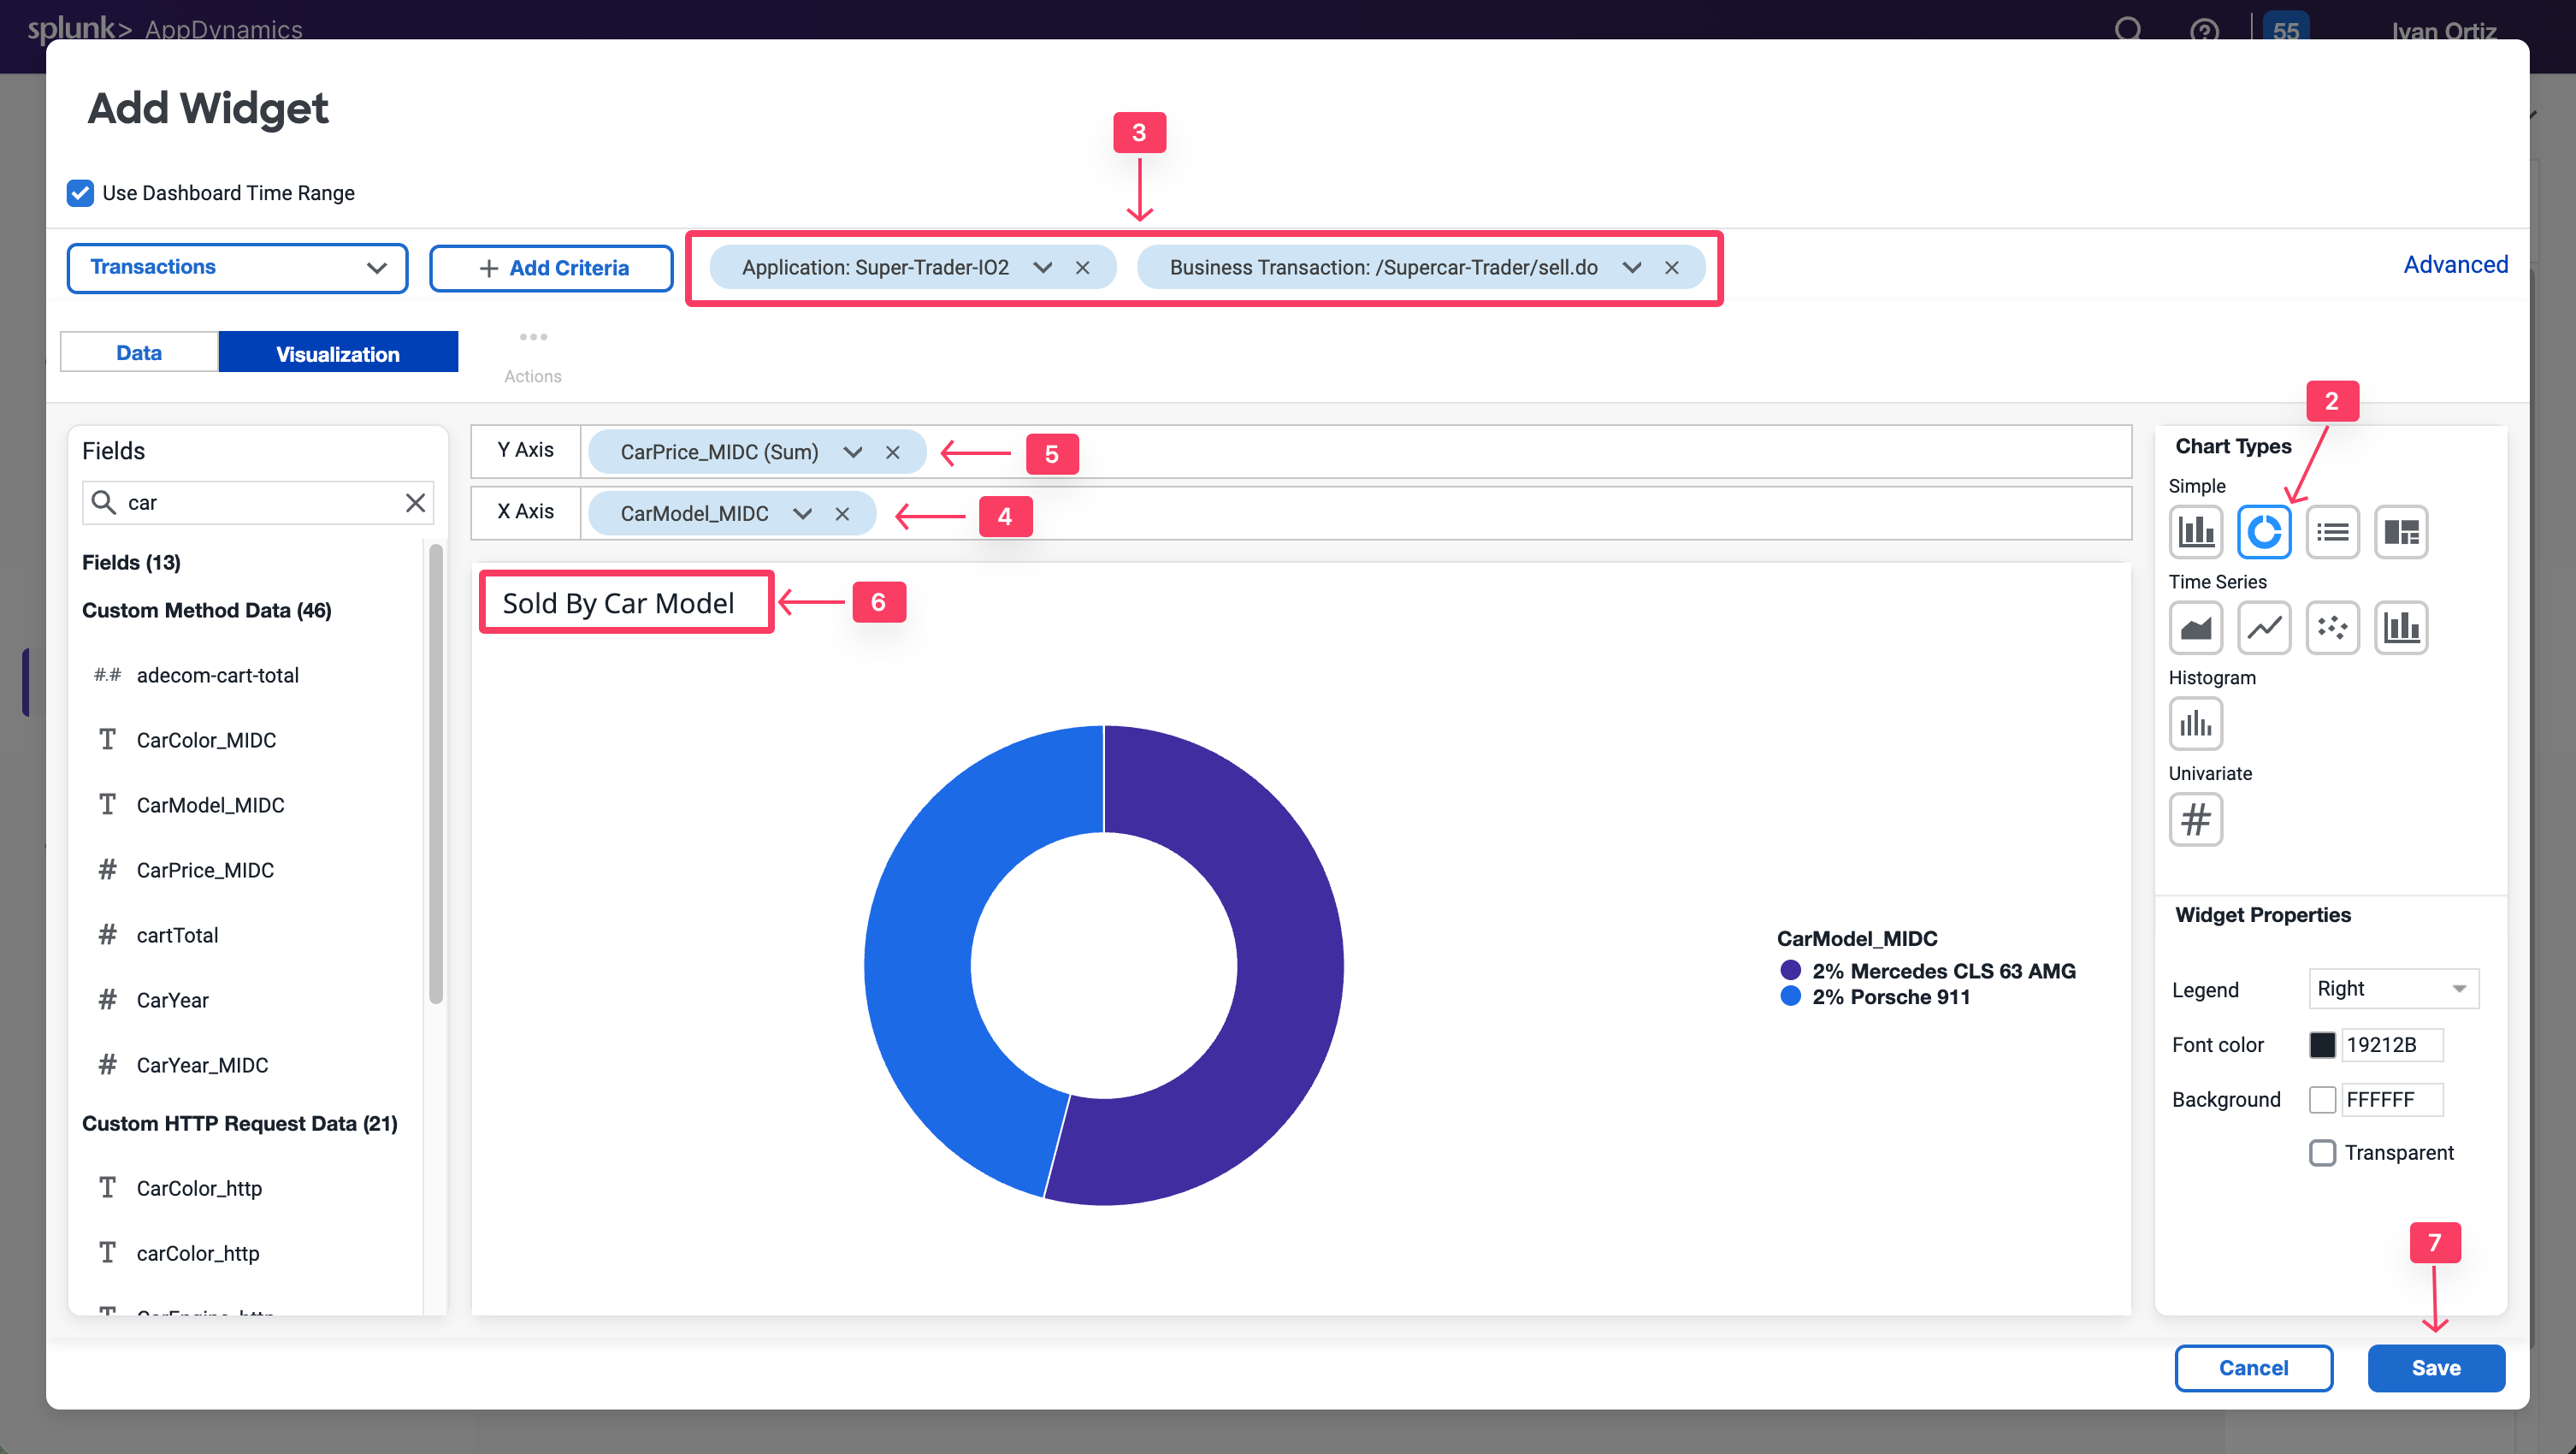
Pie charts
You will now create a pie chart that shows all the car models reported by the sellCar transaction and the sum of prices per model. This will show the most highly-demanded model in the application.
Create a new Widget
Select the Pie chart type.
Add the following filters: Application = Supercar-Trader-YOURINITIALS and Business Transaction = /Supercar-Trader/sell.do.
Add CarModel_MIDC in the X-Axis
Add CarPrice_MIDC in the Y-Axis. Note that SUM is the aggregation used to capture the total price per model.
Add a Title Sold by Car Model
Click Save.
Refer to the following example for more uses of the pie chart widget.
Dashboard components: Conversion funnels
Conversion funnels help visualize the flow of users or events through a multi-step process. This enables you to better understand which steps can be optimized for more successful convergence. You can also use conversion funnels to examine the IT perfomance of every step, to understand how they impact the user experience and identify the cause of user drop-offs.
Note that the funnel is filtered according to the users who executed this path in that specific order, not the total visits per step.
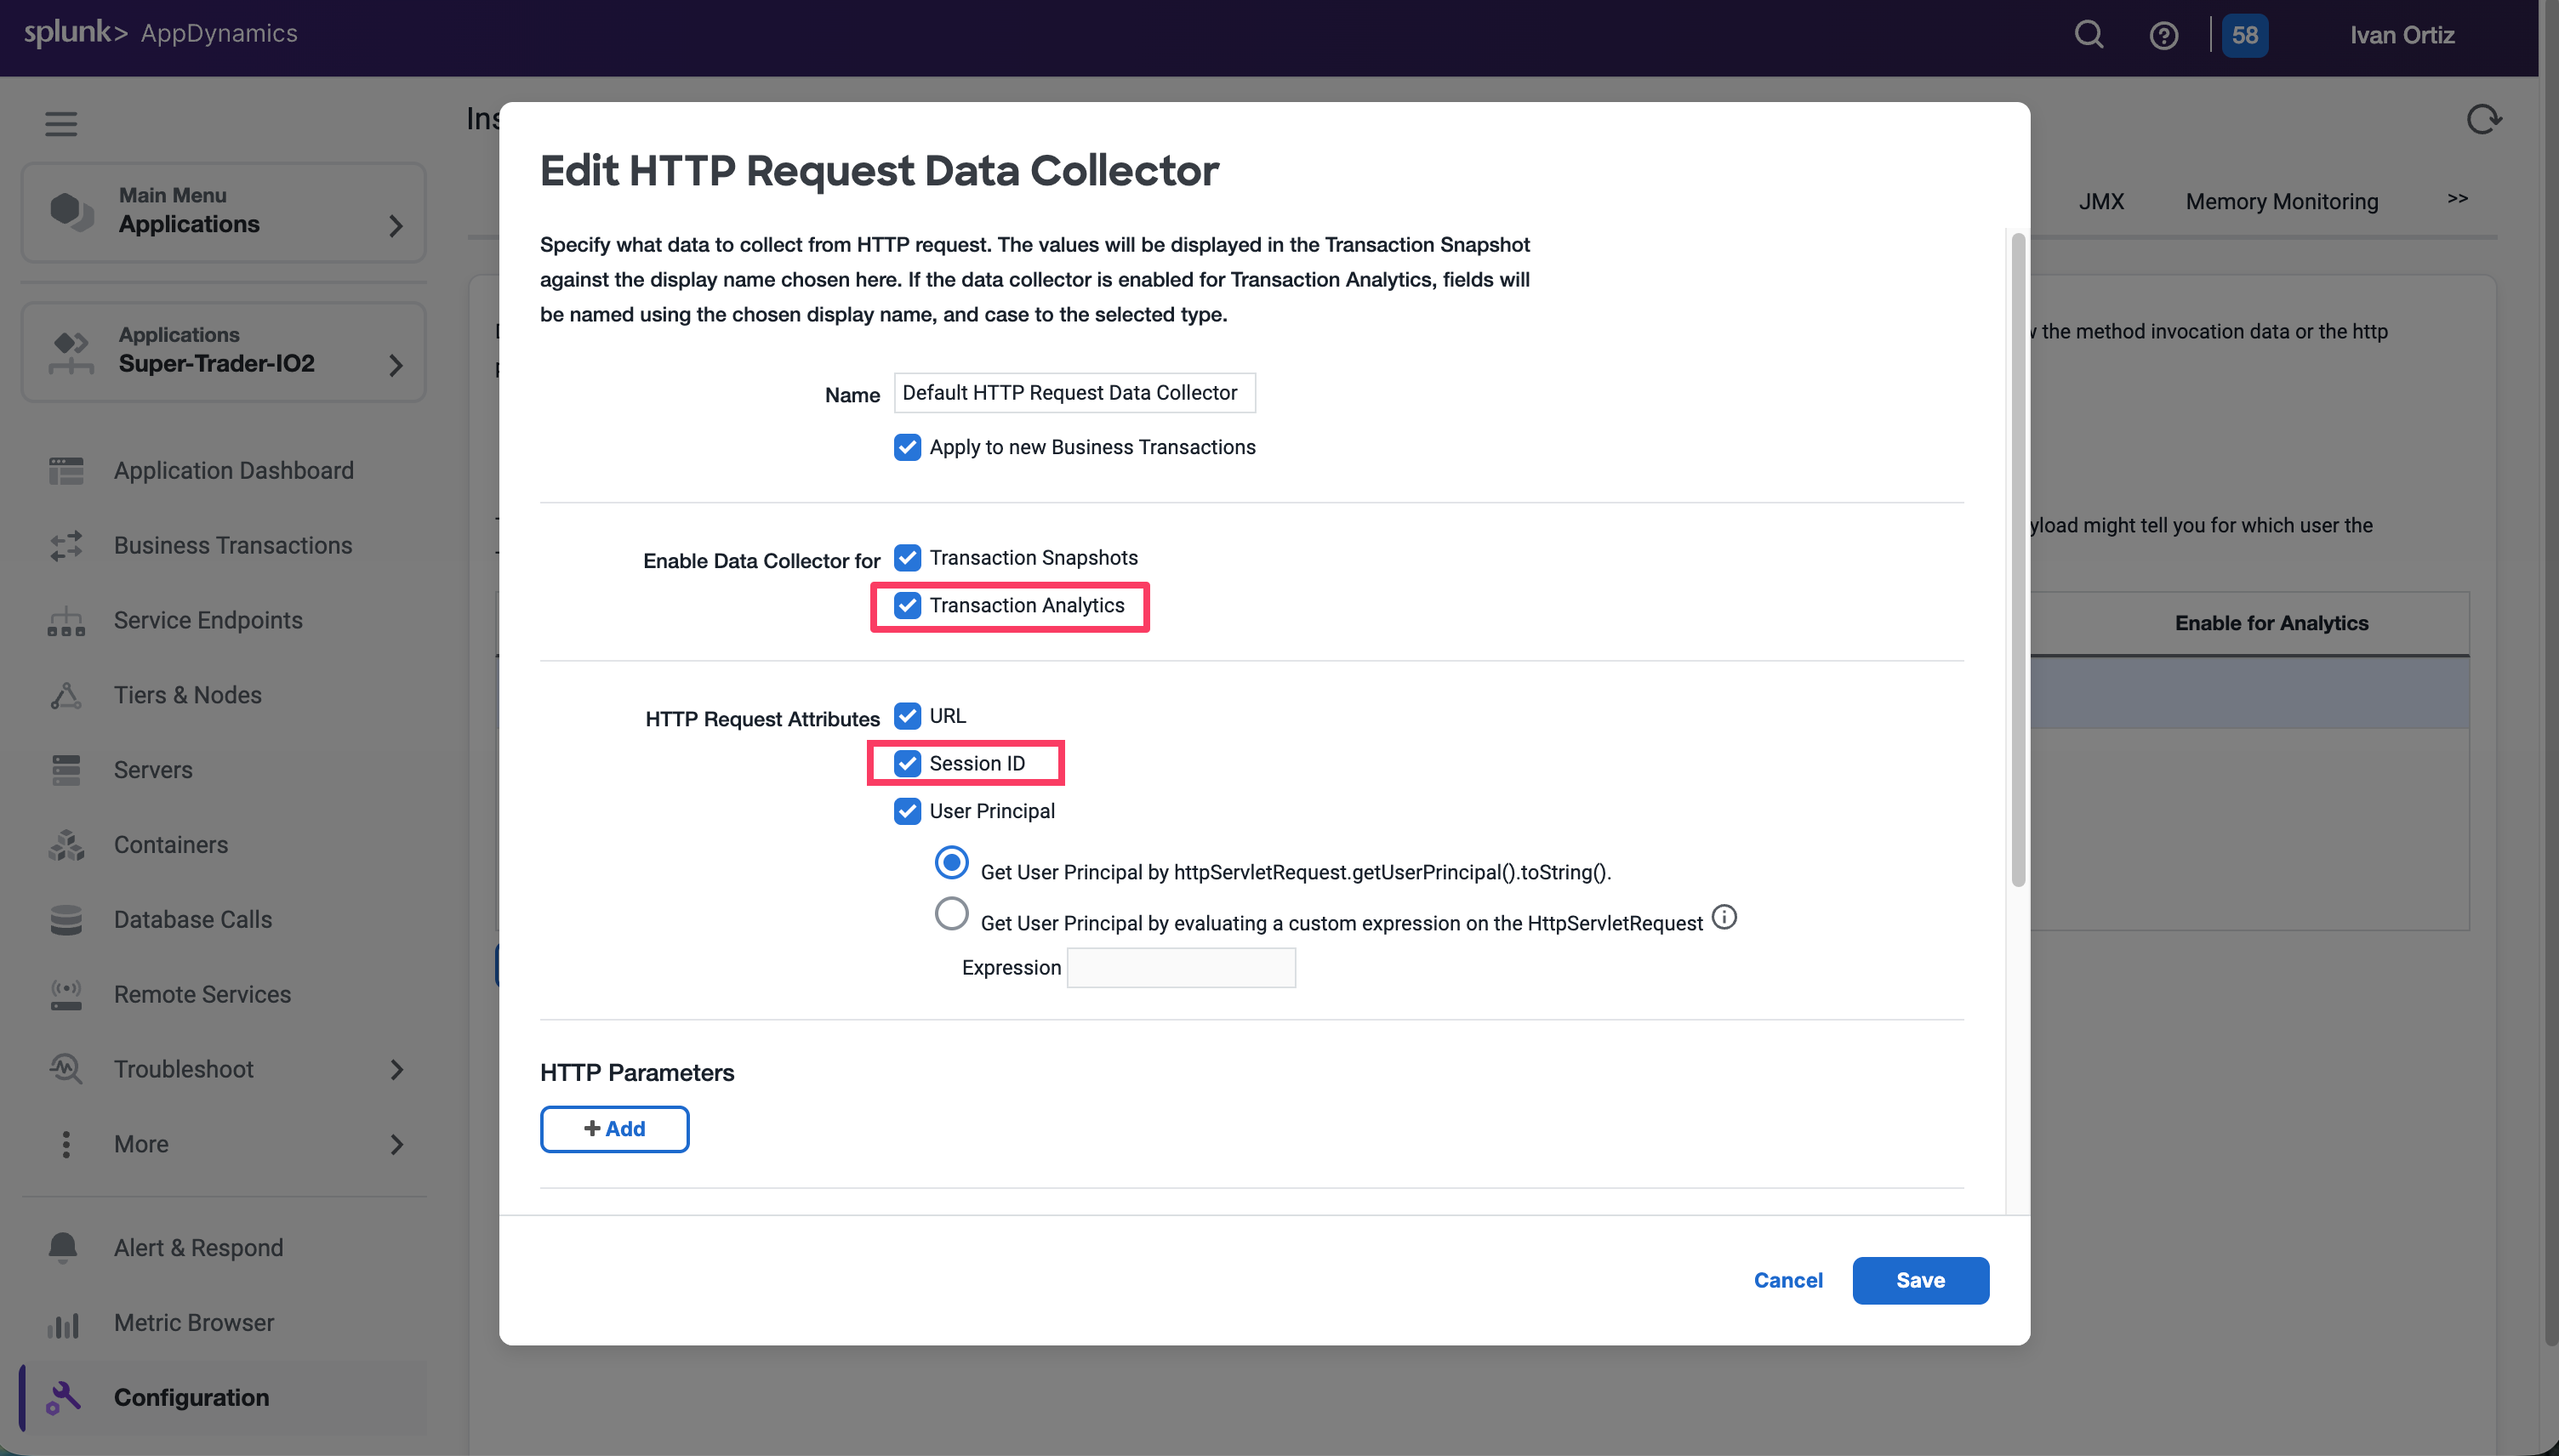
The first step of funnel creation is to select a unique identifier of the transaction that can represent each user navigation through the funnel. Usually, the Session ID is the best choice, since it persists through each step in the funnel.
A Session ID can be captured from the transactions. You’ll need a SessionId data collector to use it as a counter for the Funnel transactions.
For Java applications, AppDynamics has the capability to Session IDs in the default HTTP data collector. You’ll ensure that it is enabled and apply it to all business transactions to capture the Session ID for every transaction.
Select the Applications tab.
Select Supercar-Trader-YOURINITIALS Application.
Select the Configuration Left tab.
Click Instrumentation.
Select the Data Collectors tab.
Edit the Default HTTP Request Request Data Collectors.
Select Transaction Analytics.
Verify that SessionID is selected.
Click Save.
Now apply some load by navigating multiple times from the /Supercar-Trader/home.do page. Then, directly navigate to /Supercar-Trader/sell.do page on the application.
Now Return to your Dashboard to create the funnel widget.
Toggle the Edit slider.
Click Add Widget.
Select the Analytics tab.
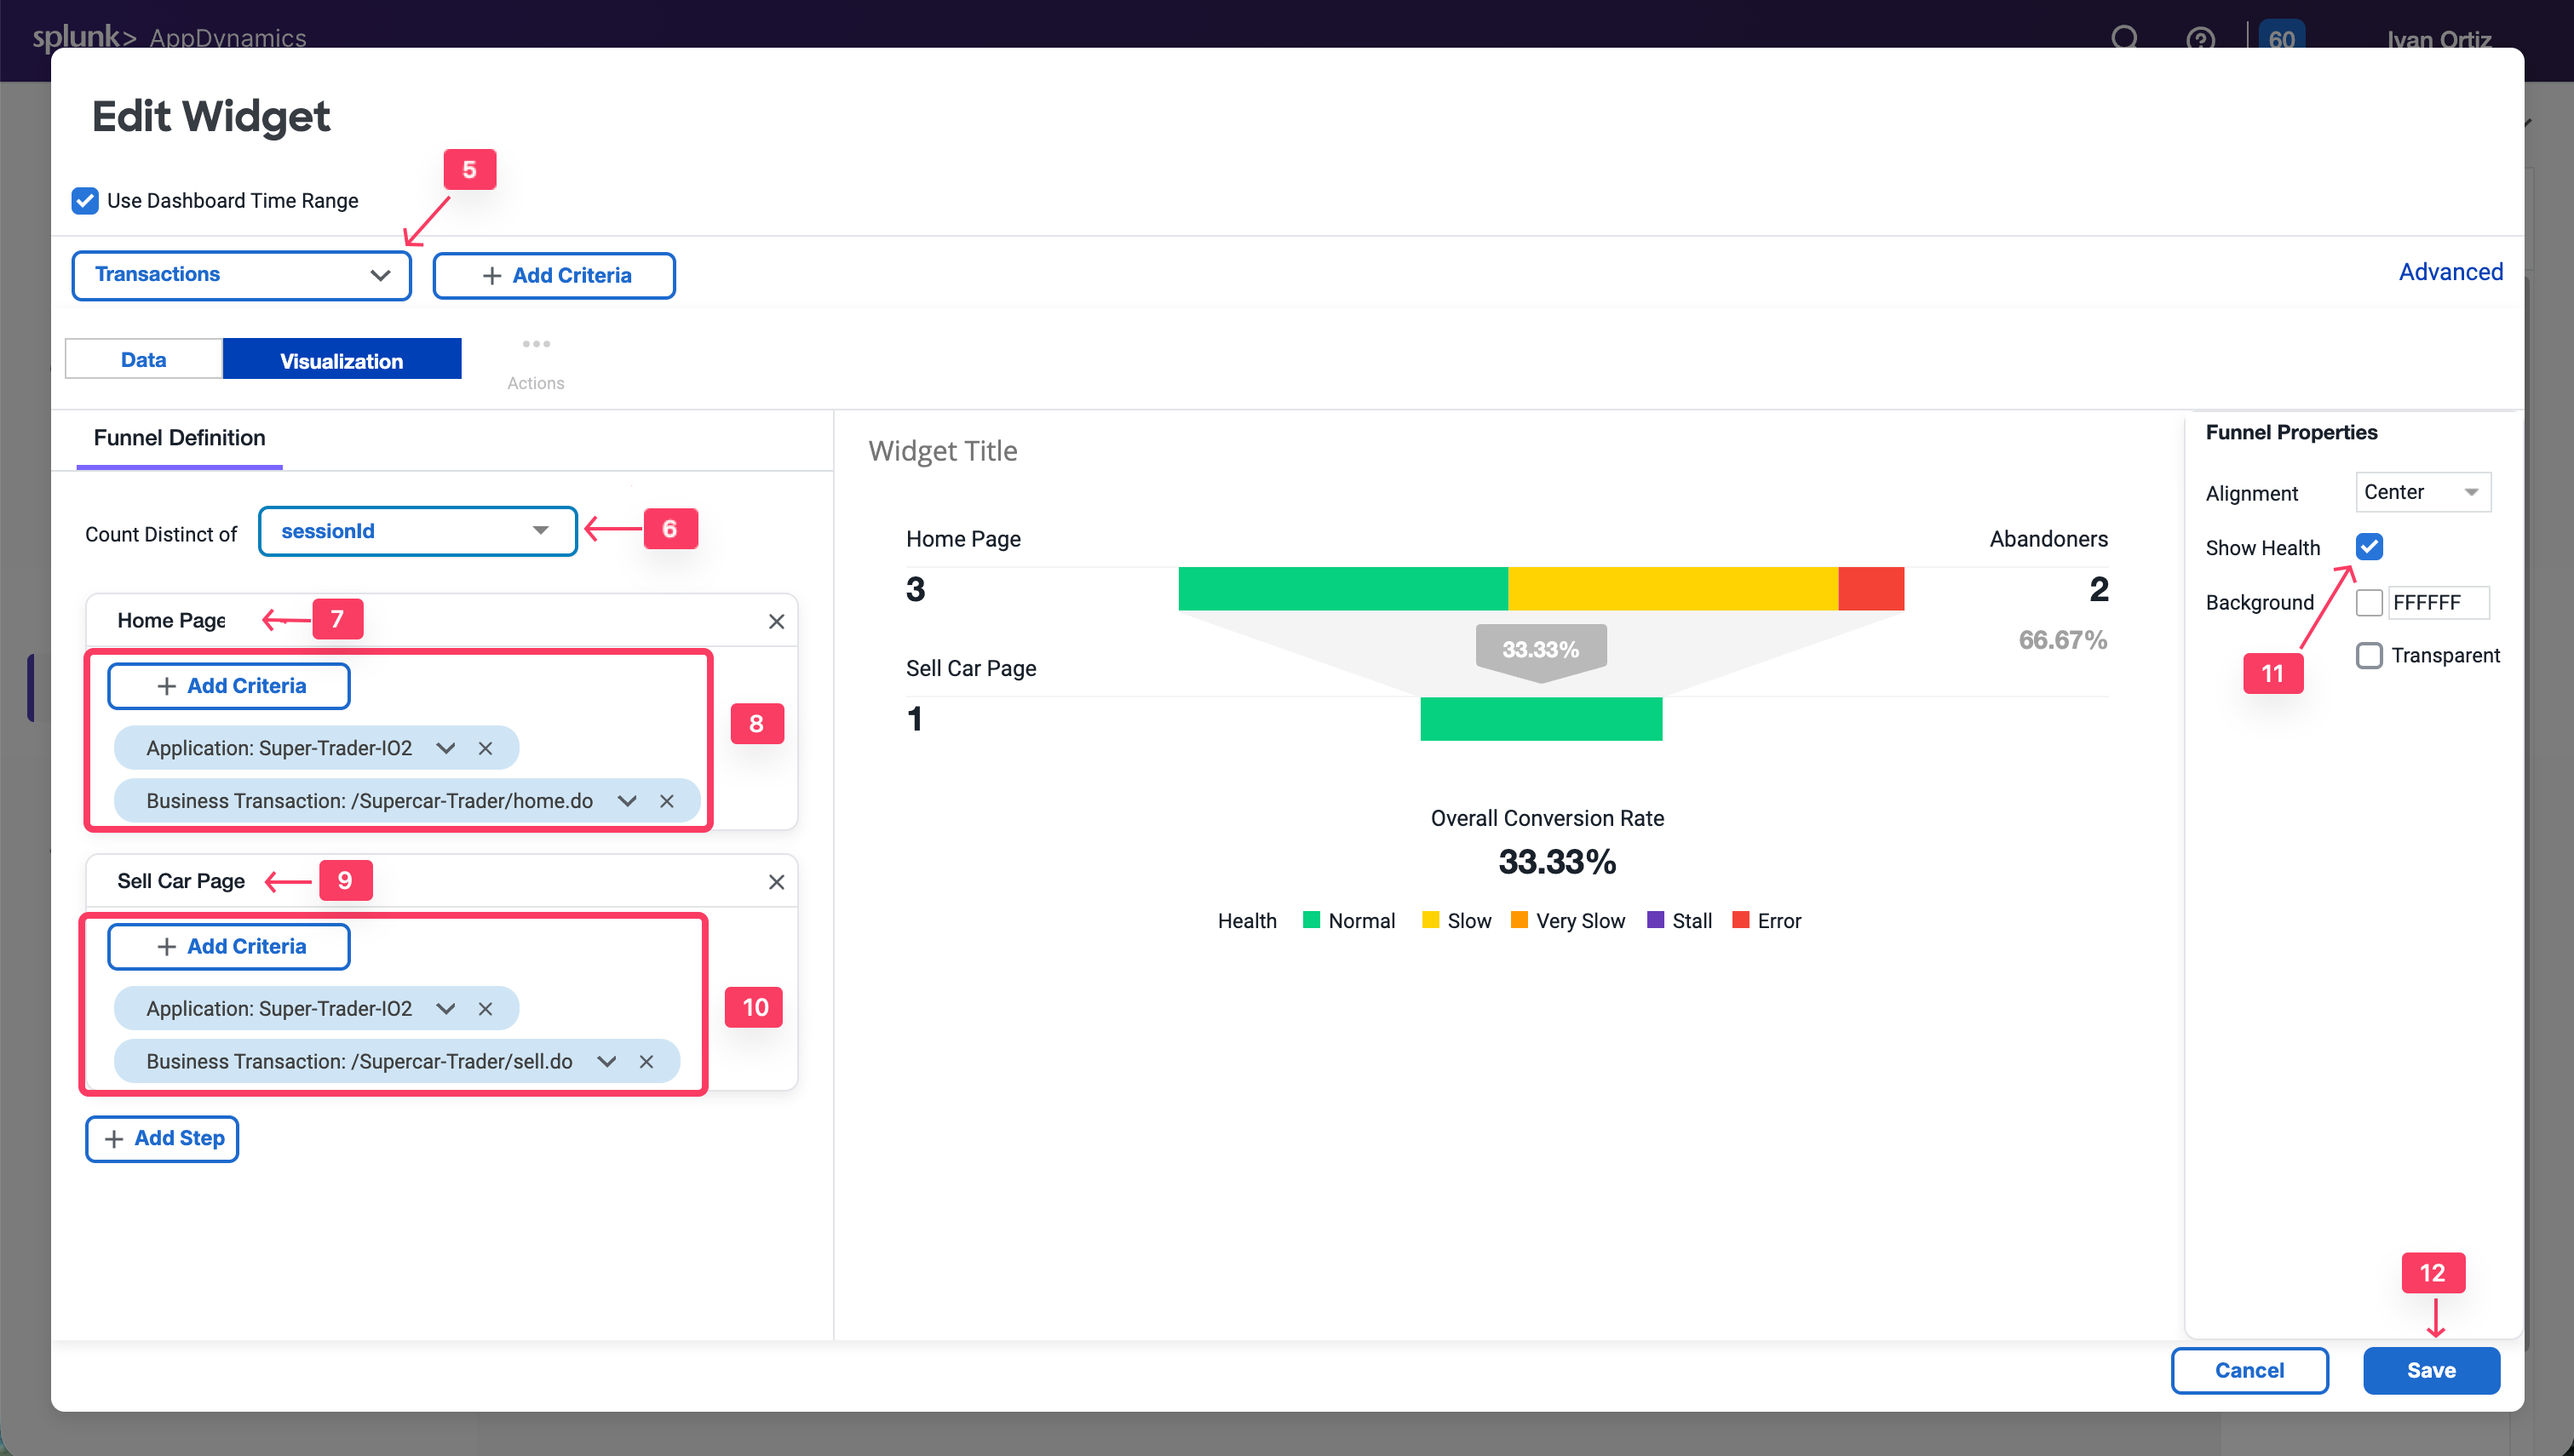
Click Funnel Analysis.
Select Transactions from the drop-down list.
Under Count Distinct of, select uniqueSessionId from the drop-down list.
Click Add Step. Name it Home Page.
Click on Add Criteria. Add the following criteria: Application: Supercar-Trader-YOURINITIALS & Business Transactions: /Supercar-Trader/home.do.
Click Add Step. Name it SellCar Page.
Click on Add Criteria. Add the following criteria: Application: Supercar-Trader-YOURINITIALS & Business Transactions: /Supercar-Trader/sell.do.
Select the Show Health Checkbox on the right panel to visualize the transaction health in the flow map.
Click Save
Build Your Dashboard
20 minutes
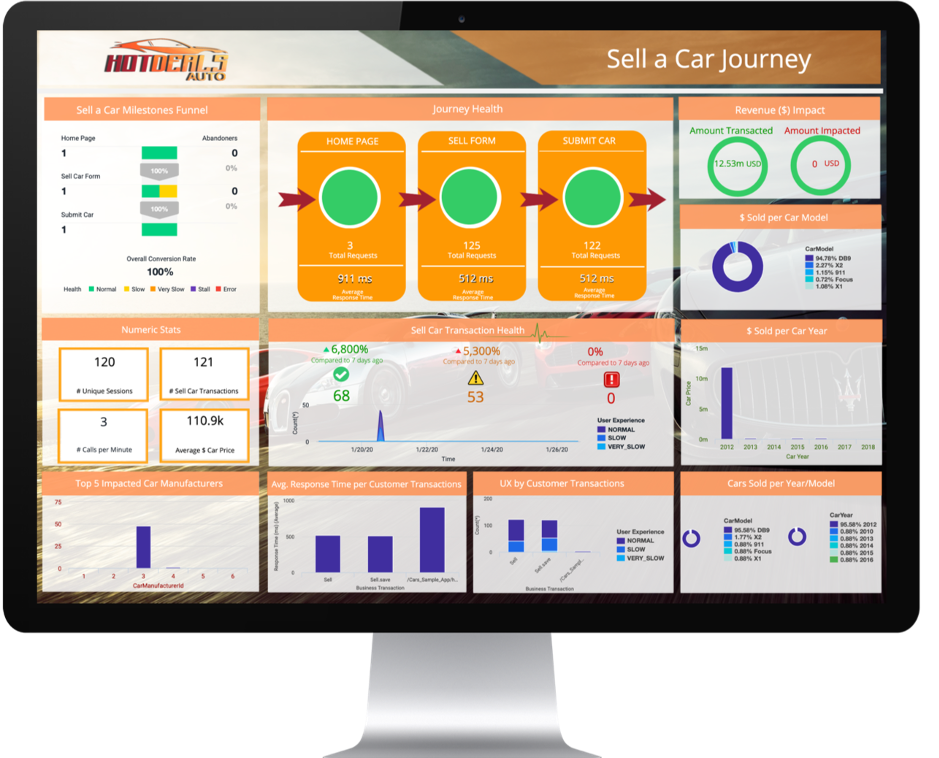
Exercise - Build Your Own Dashboard
To conclude this Learning Lab, use the business data that was captured in the earlier exercise using method invocation data collectors and your understanding of the dashboard components to build an IT Business Impact Dashboard.
Refer to the following example and build your own dashboard, using the same data and widgets.
Congratulations! You have completed the BusinessIQ Fundamentals Learning Lab!
Browser Real User Monitoring (BRUM)
2 minutes
Objectives
In this Learning Lab you learn how to use AppDynamics to monitor the health of your browser-based application.
When you have completed this lab, you will be able to:
Create a browser application in the Controller
Configure the Browser Real User Monitoring (BRUM) agent to monitor your web application’s health.
Troubleshoot performance issues and find the root cause, whether it occurs on the browser side or the server side of the transaction.
Workshop Environment
The workshop environment has two hosts:
The first host runs the AppDynamics Controller and will be referred to from this point on as the Controller.
The second host runs the Supercar Trader application used in the labs. It will be the host where you will install the AppDynamics agents and will be referred to from this point on as the Application VM.
Verify you see the five different Tiers on the flow map.
Verify there has been consistent load over the last 1 hour.
Check the list of business transactions:
Click the Business Transactions option on the left menu.
Verify you see the eleven business transactions seen below.
Verify that they have some number of calls during the last hour.
Note: If you don’t see the Calls column, you can click the View Options toolbar button to show that column.
Check the agent status for the Nodes:
Click the Tiers & Nodes option on the left menu.
Click Grid View.
Verify that the App Agent Status for each Node is greater than 90% during the last hour.
Restart the Application and Load Generation if Needed
If any of the checks you performed in the previous steps could not be verified, SSH into your Application VM and follow these steps to restart the application and transaction load.
Use the following commands to stop the running instance of Apache Tomcat.
cd /usr/local/apache/apache-tomcat-9/bin
./shutdown.sh
Use the command below to check for remaining application JVMs still running.
ps -ef | grep Supercar-Trader
If you find any remaining application JVMs still running, kill the remaining JVMs using the command below.
sudo pkill -f Supercar-Trader
Use the following commands to stop the load generation for the application. Wait until all processes are stopped.
cd /opt/appdynamics/lab-artifacts/phantomjs
./stop_load.sh
Restart the Tomcat server:
cd /usr/local/apache/apache-tomcat-9/bin
./startup.sh
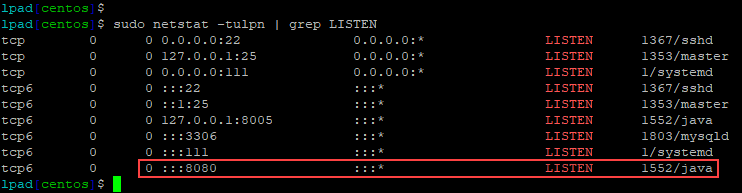
Wait for two minutes and use the following command to ensure Apache Tomcat is running on port 8080.
sudo netstat -tulpn | grep LISTEN
You should see output similar to the following image showing that port 8080 is in use by Apache Tomcat.
Use the following commands to start the load generation for the application.
cd /opt/appdynamics/lab-artifacts/phantomjs
./start_load.sh
You should see output similar to the following image.
Create Browser Application
2 minutes
In this exercise you will complete the following tasks:
Access your AppDynamics Controller from your web browser.
Use the following steps to create your new browser application.
Note
It is very important that you create a unique name for your browser application in Step 5 below.
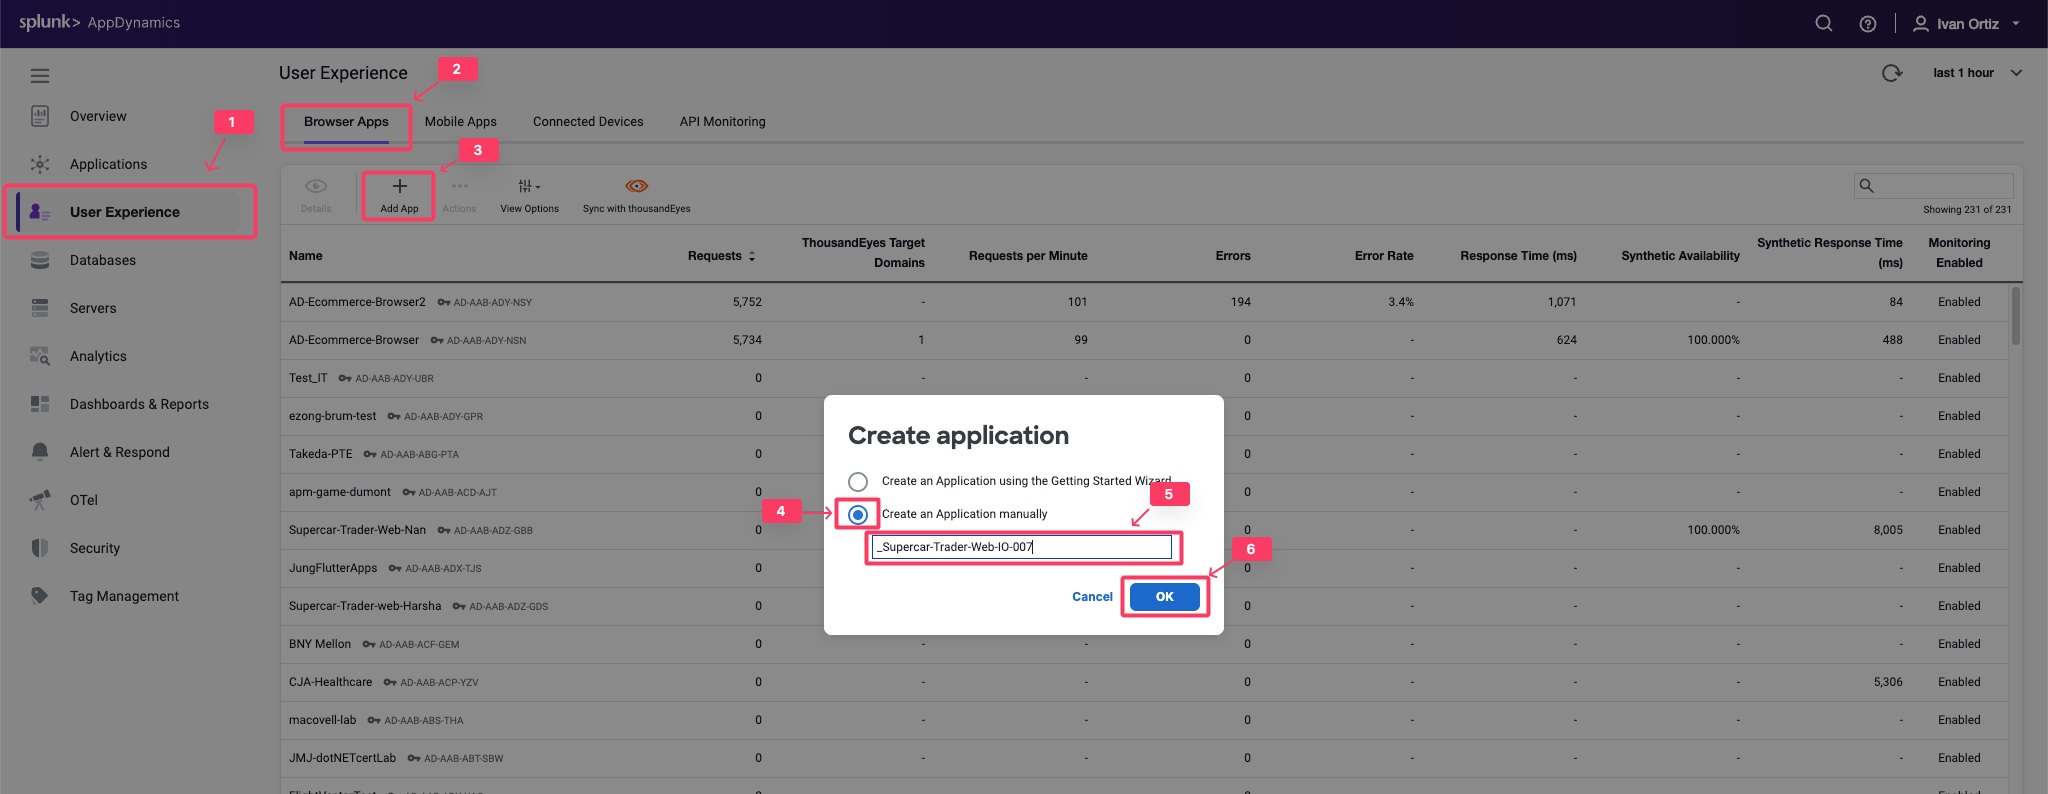
Click the User Experience tab on the top menu.
Click the Browser Apps option under User Experience.
Click Add App.
Choose the option Create an Application manually.
Type in a unique name for your browser application in the format Supercar-Trader-Web-<your_initials_or_name>-<four_random_numbers>
Example 1: Supercar-Trader-Web-JFK-3179
Example 2: Supercar-Trader-Web-JohnSmith-0953
Click OK.
You should now see the Browser App Dashboard for the Supercar-Trader-Web-##-#### application.
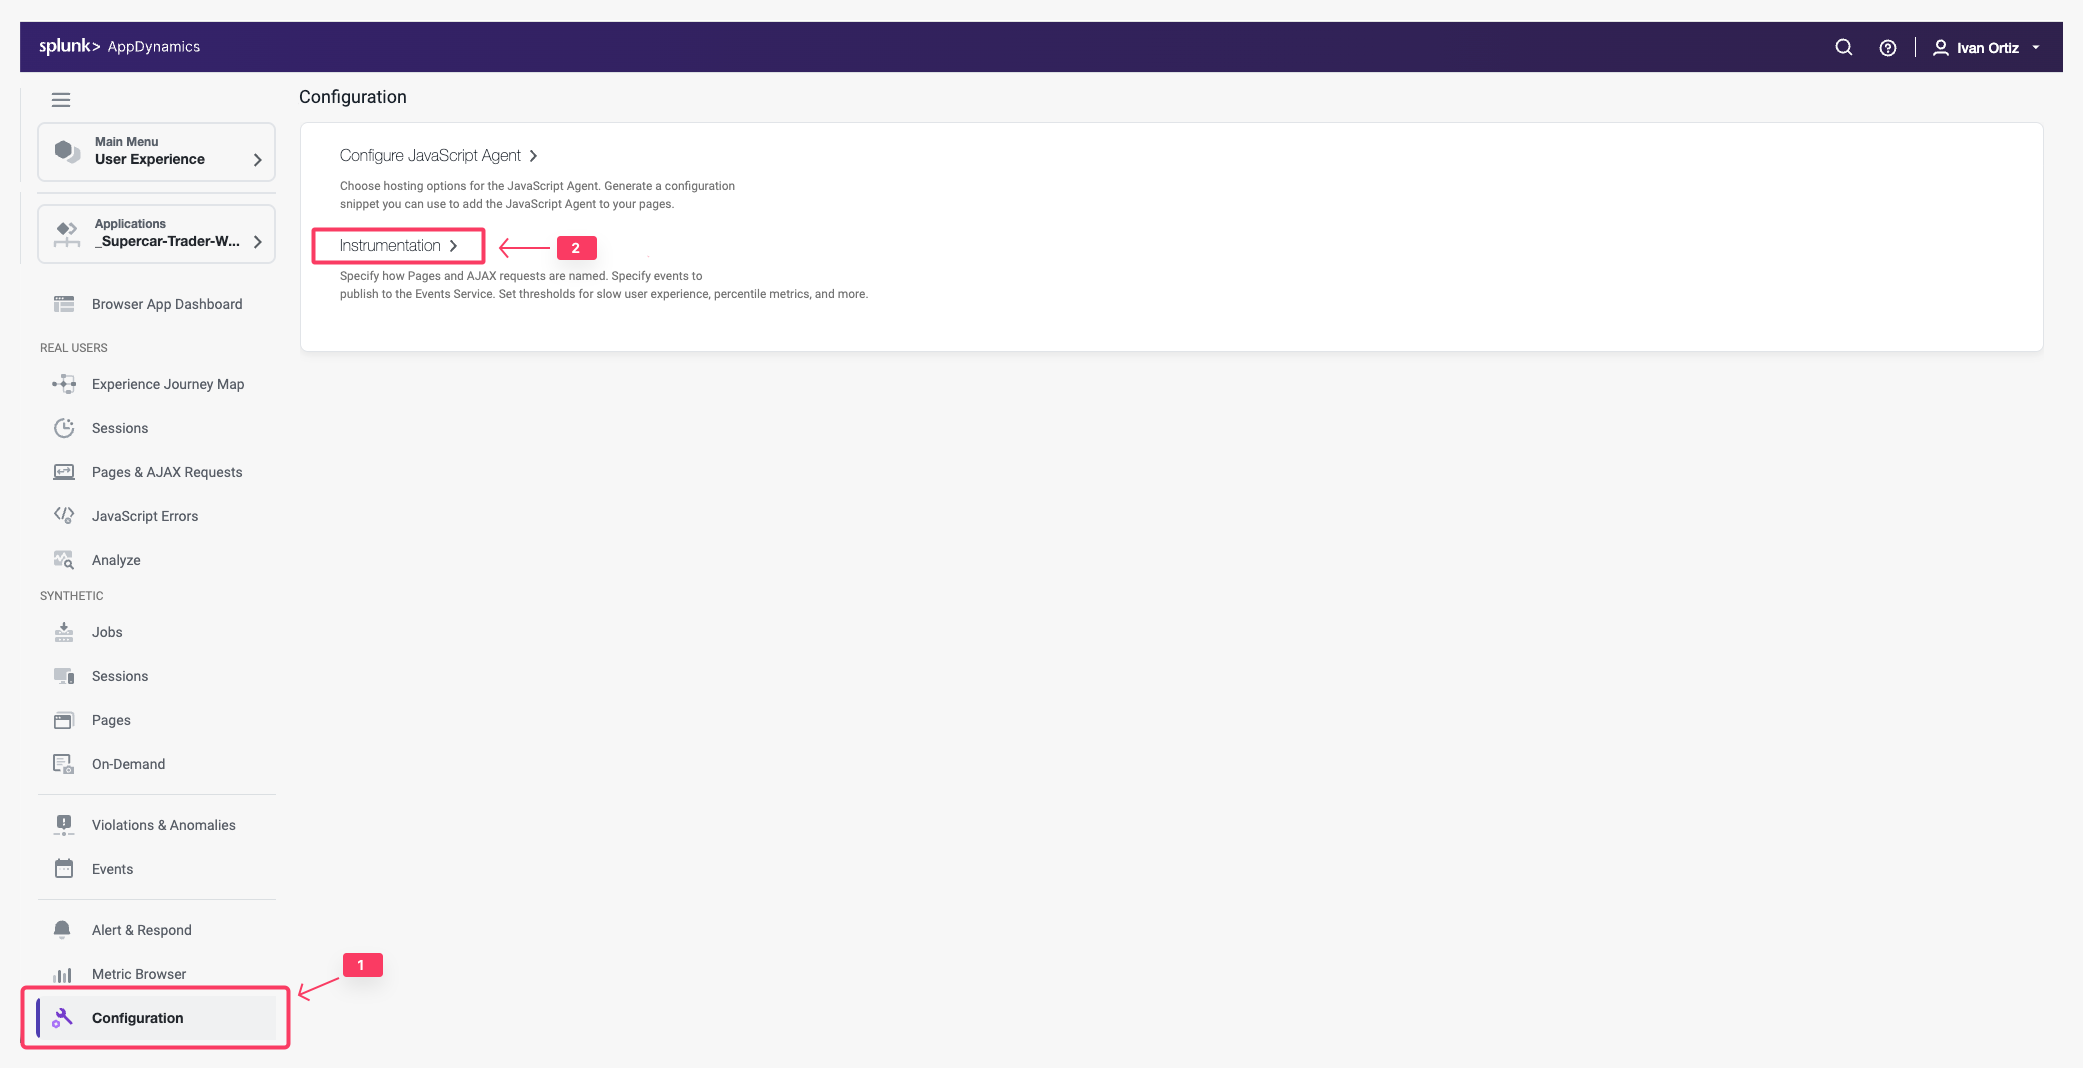
Click the Configuration tab on the left menu.
Click the Instrumentation option.
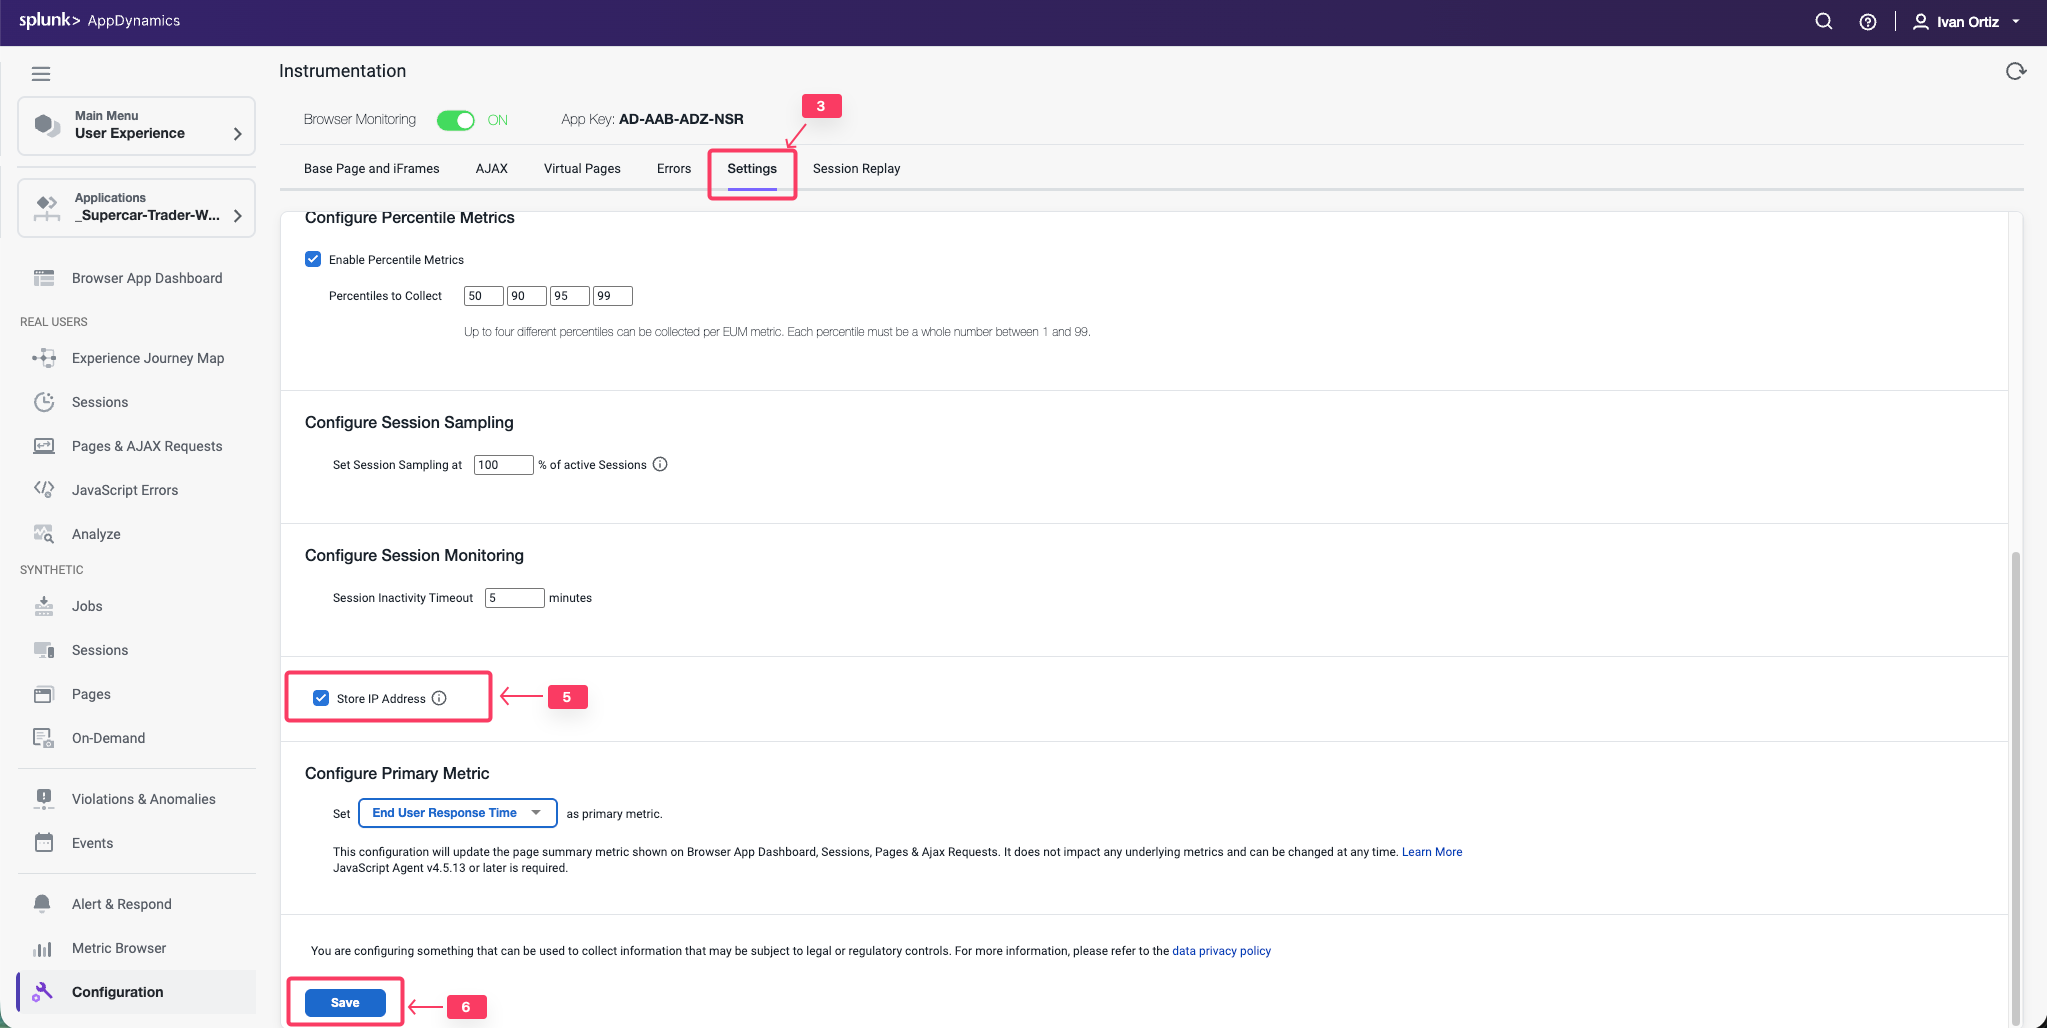
Change the default configuration to have the IP Address stored along with the data captured by the browser monitoring agent by following these steps.
Click the Settings tab.
Use the scroll bar on the right to scroll to the bottom of the screen.
Check the Store IP Address check box.
Click Save.
You can read more about configuring the Controller UI for Browser RUM here.
Configure Agent Injection
3 minutes
In this exercise you will complete the following tasks:
Enable JavaScript Agent injection.
Select Business Transactions for injection.
Enable JavaScript Agent injection
While AppDynamics supports various methods for injecting the JavaScript Agent, you will be using the Auto-Injection method in this lab. Follow these steps to enable the Auto-Injection of the JavaScipt Agent.
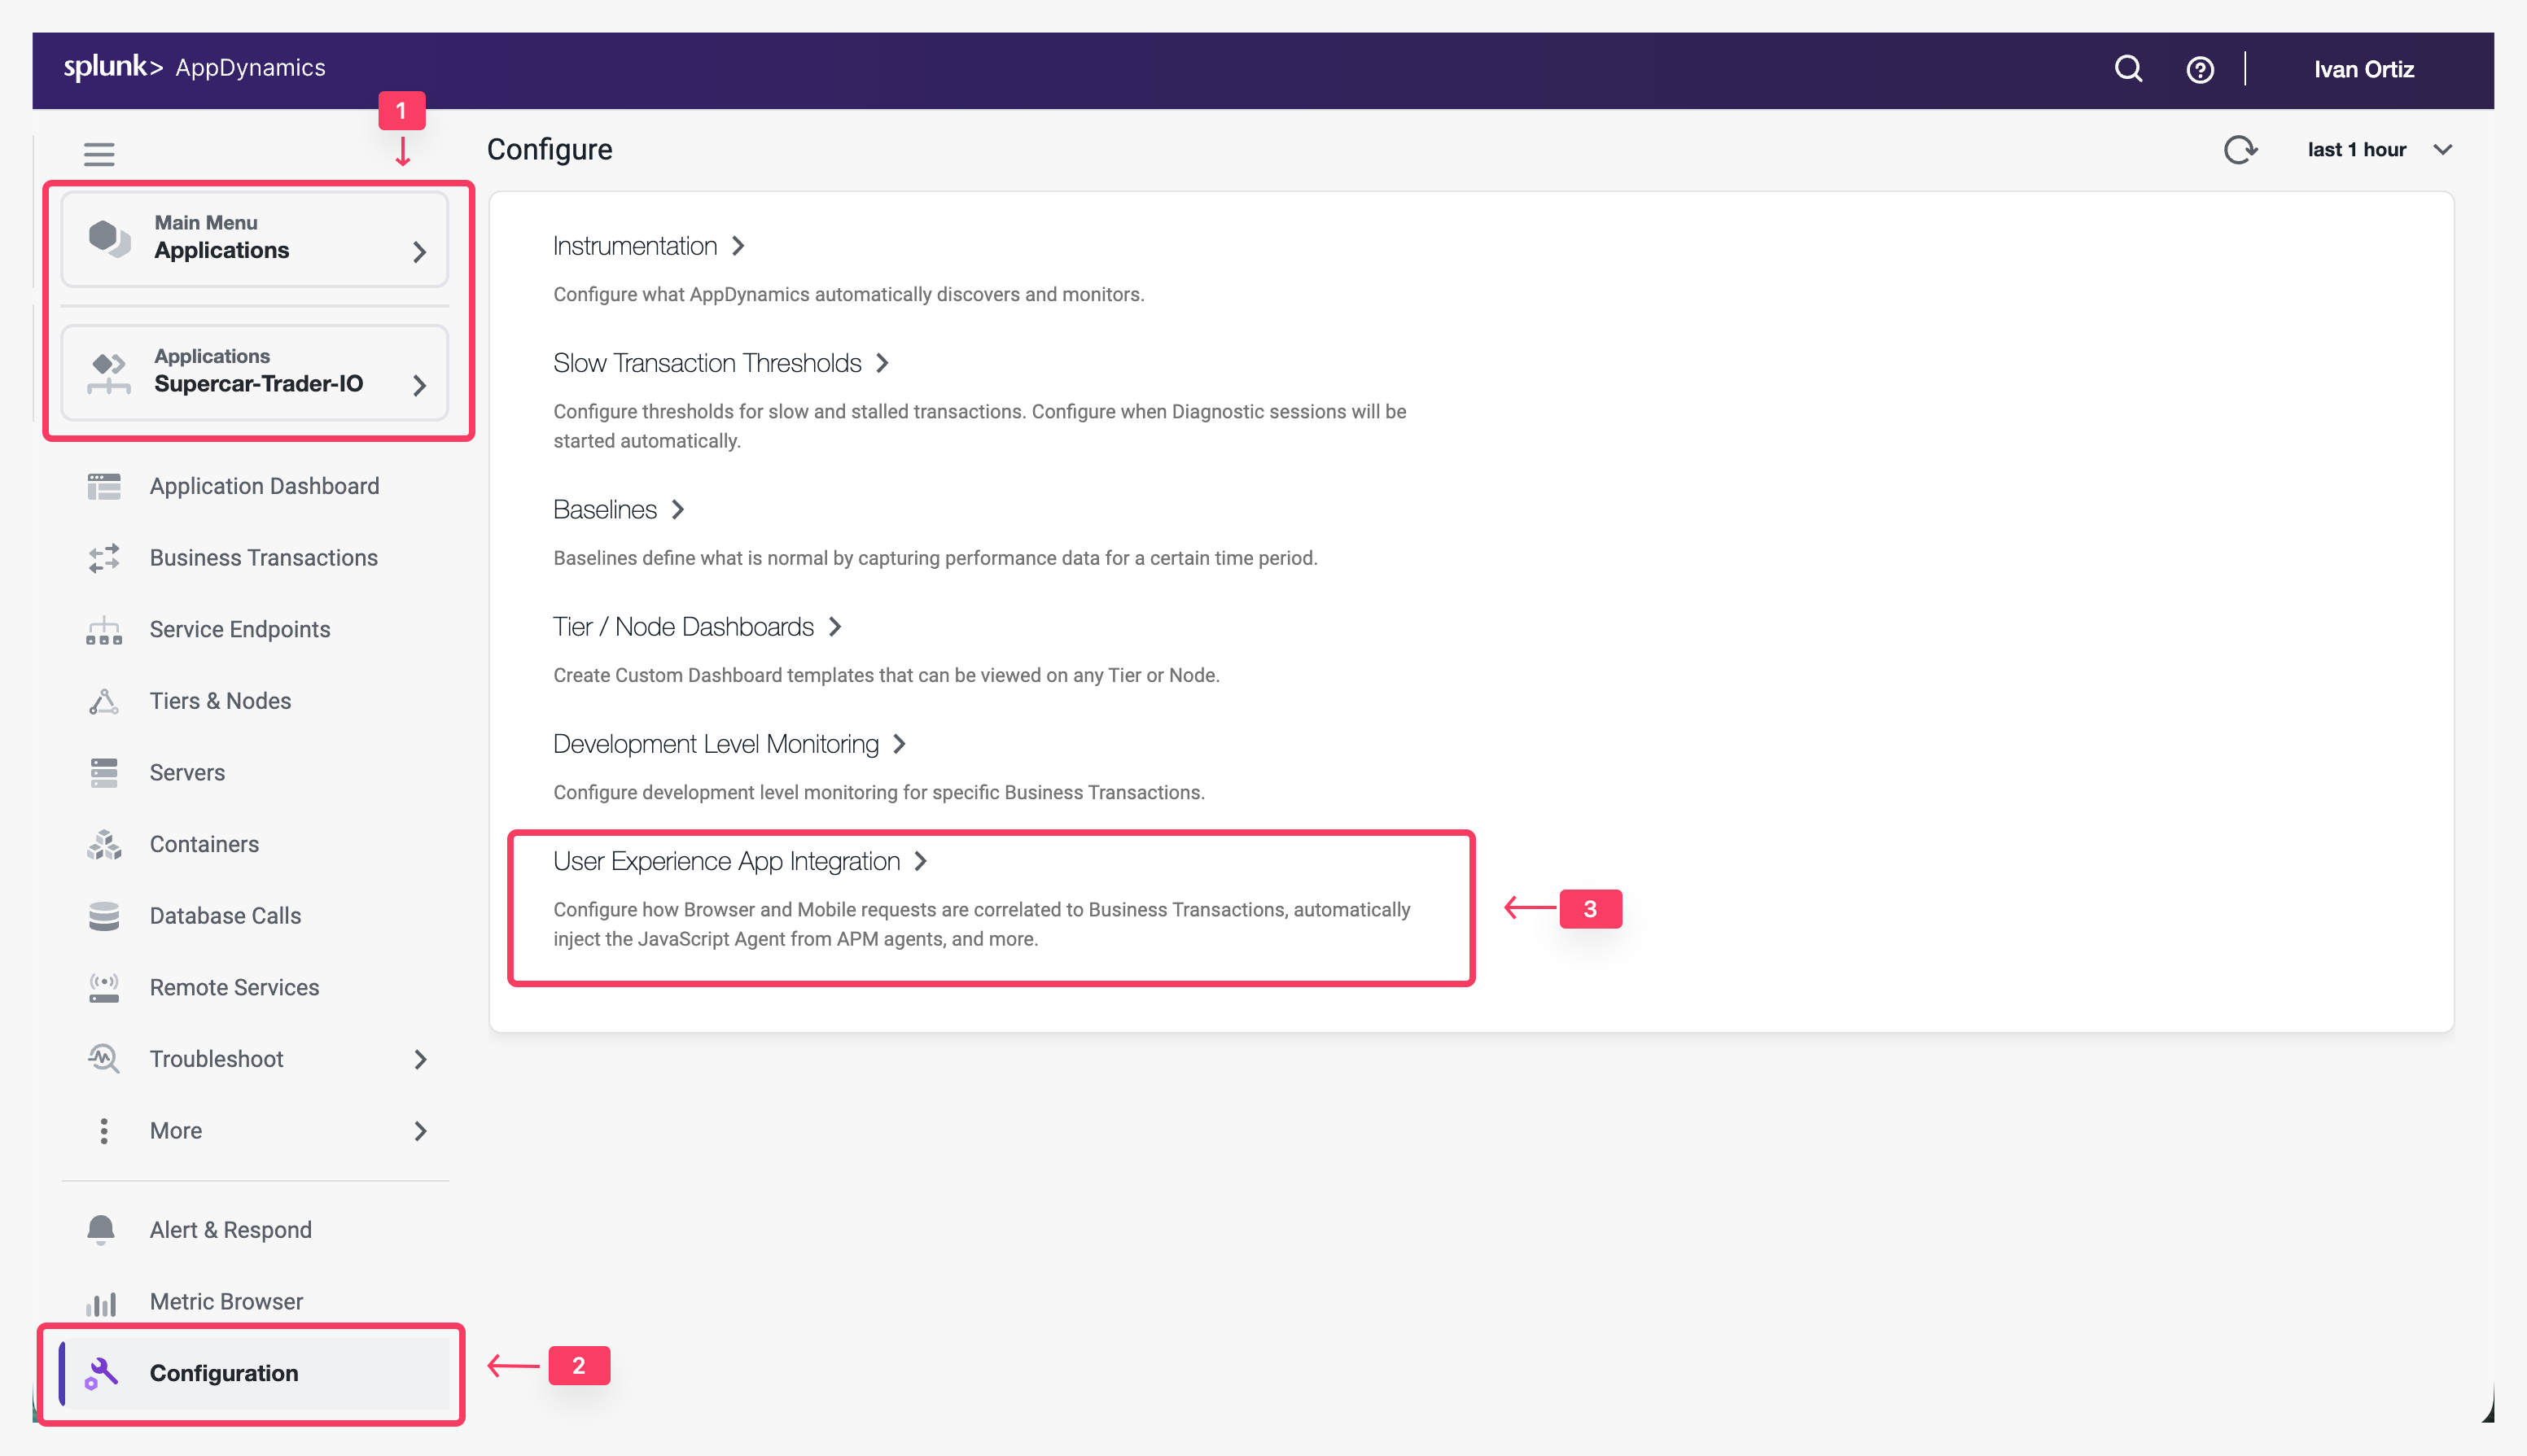
Click the Applications tab on the left menu and drill into your Supercar-Trader-## application.
Click the Configuration tab on the left menu at the bottom.
Click the User Experience App Integration option.
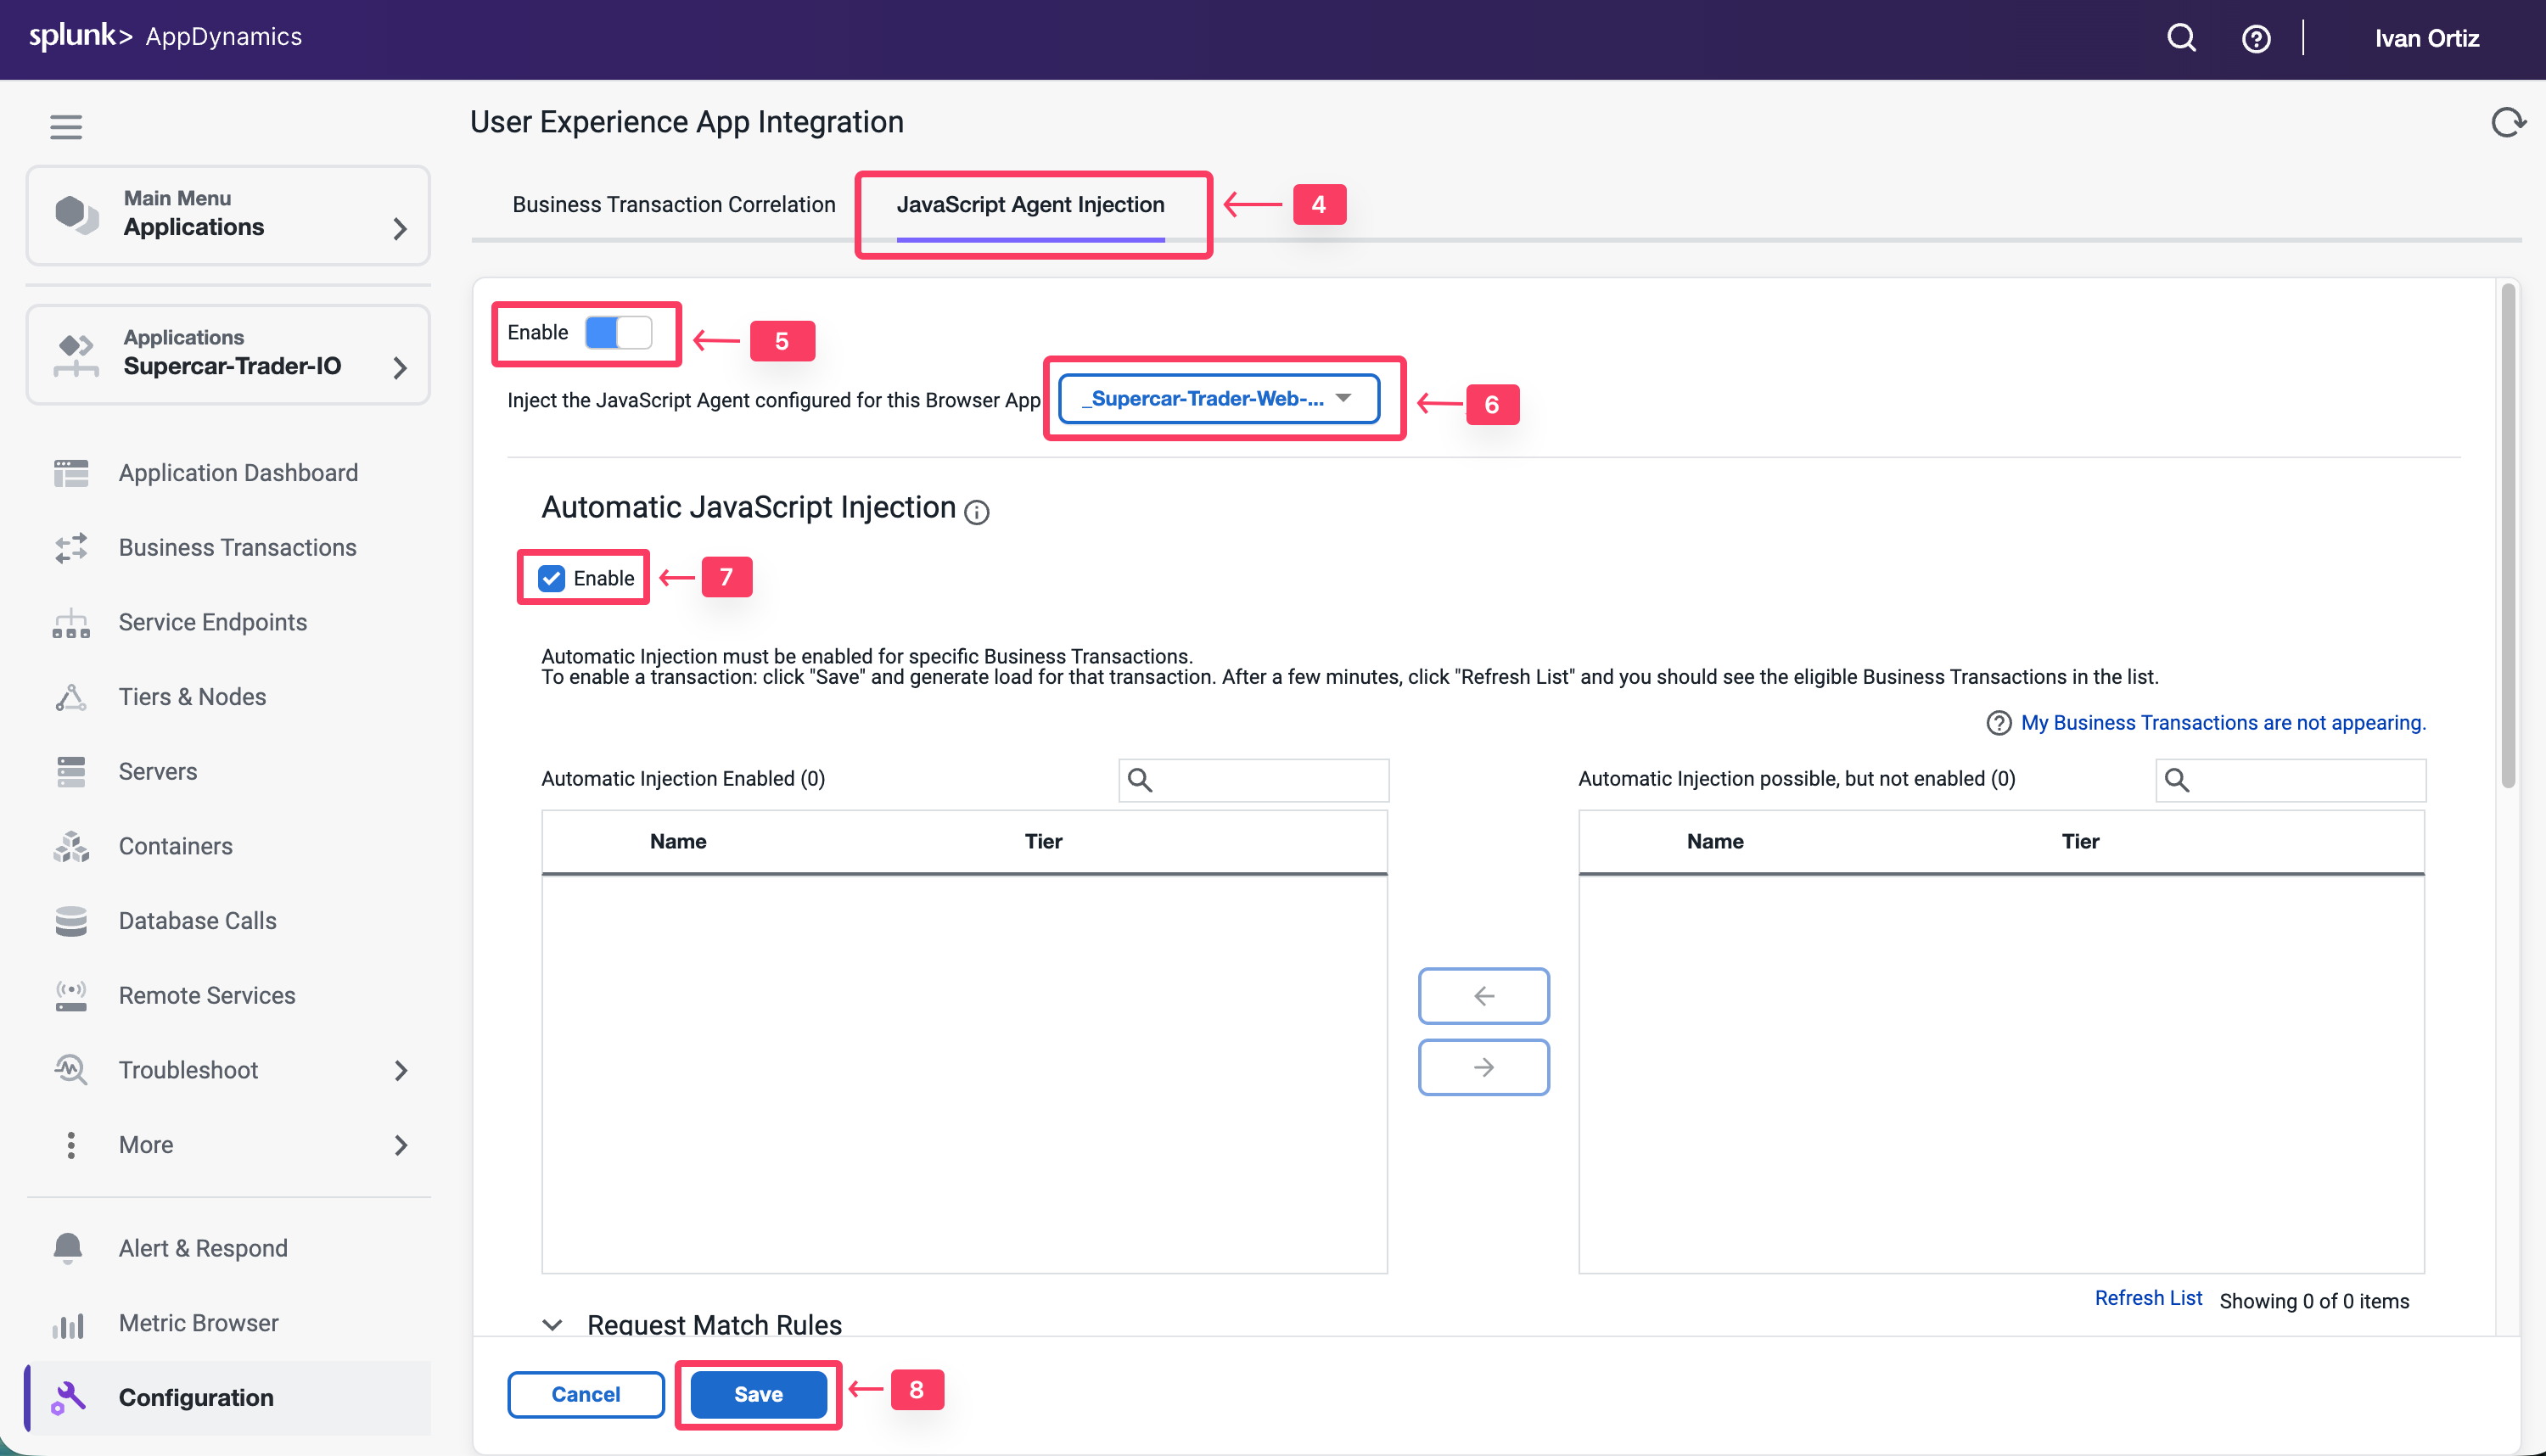
Click the JavaScript Agent Injection tab.
Click Enable so that it turns blue.
Ensure that Supercar-Trader-Web-##-#### is the selected browser app. Choose the application that you created in the previous section
Check the Enable check box under Enable JavaScript Injection
Click Save.
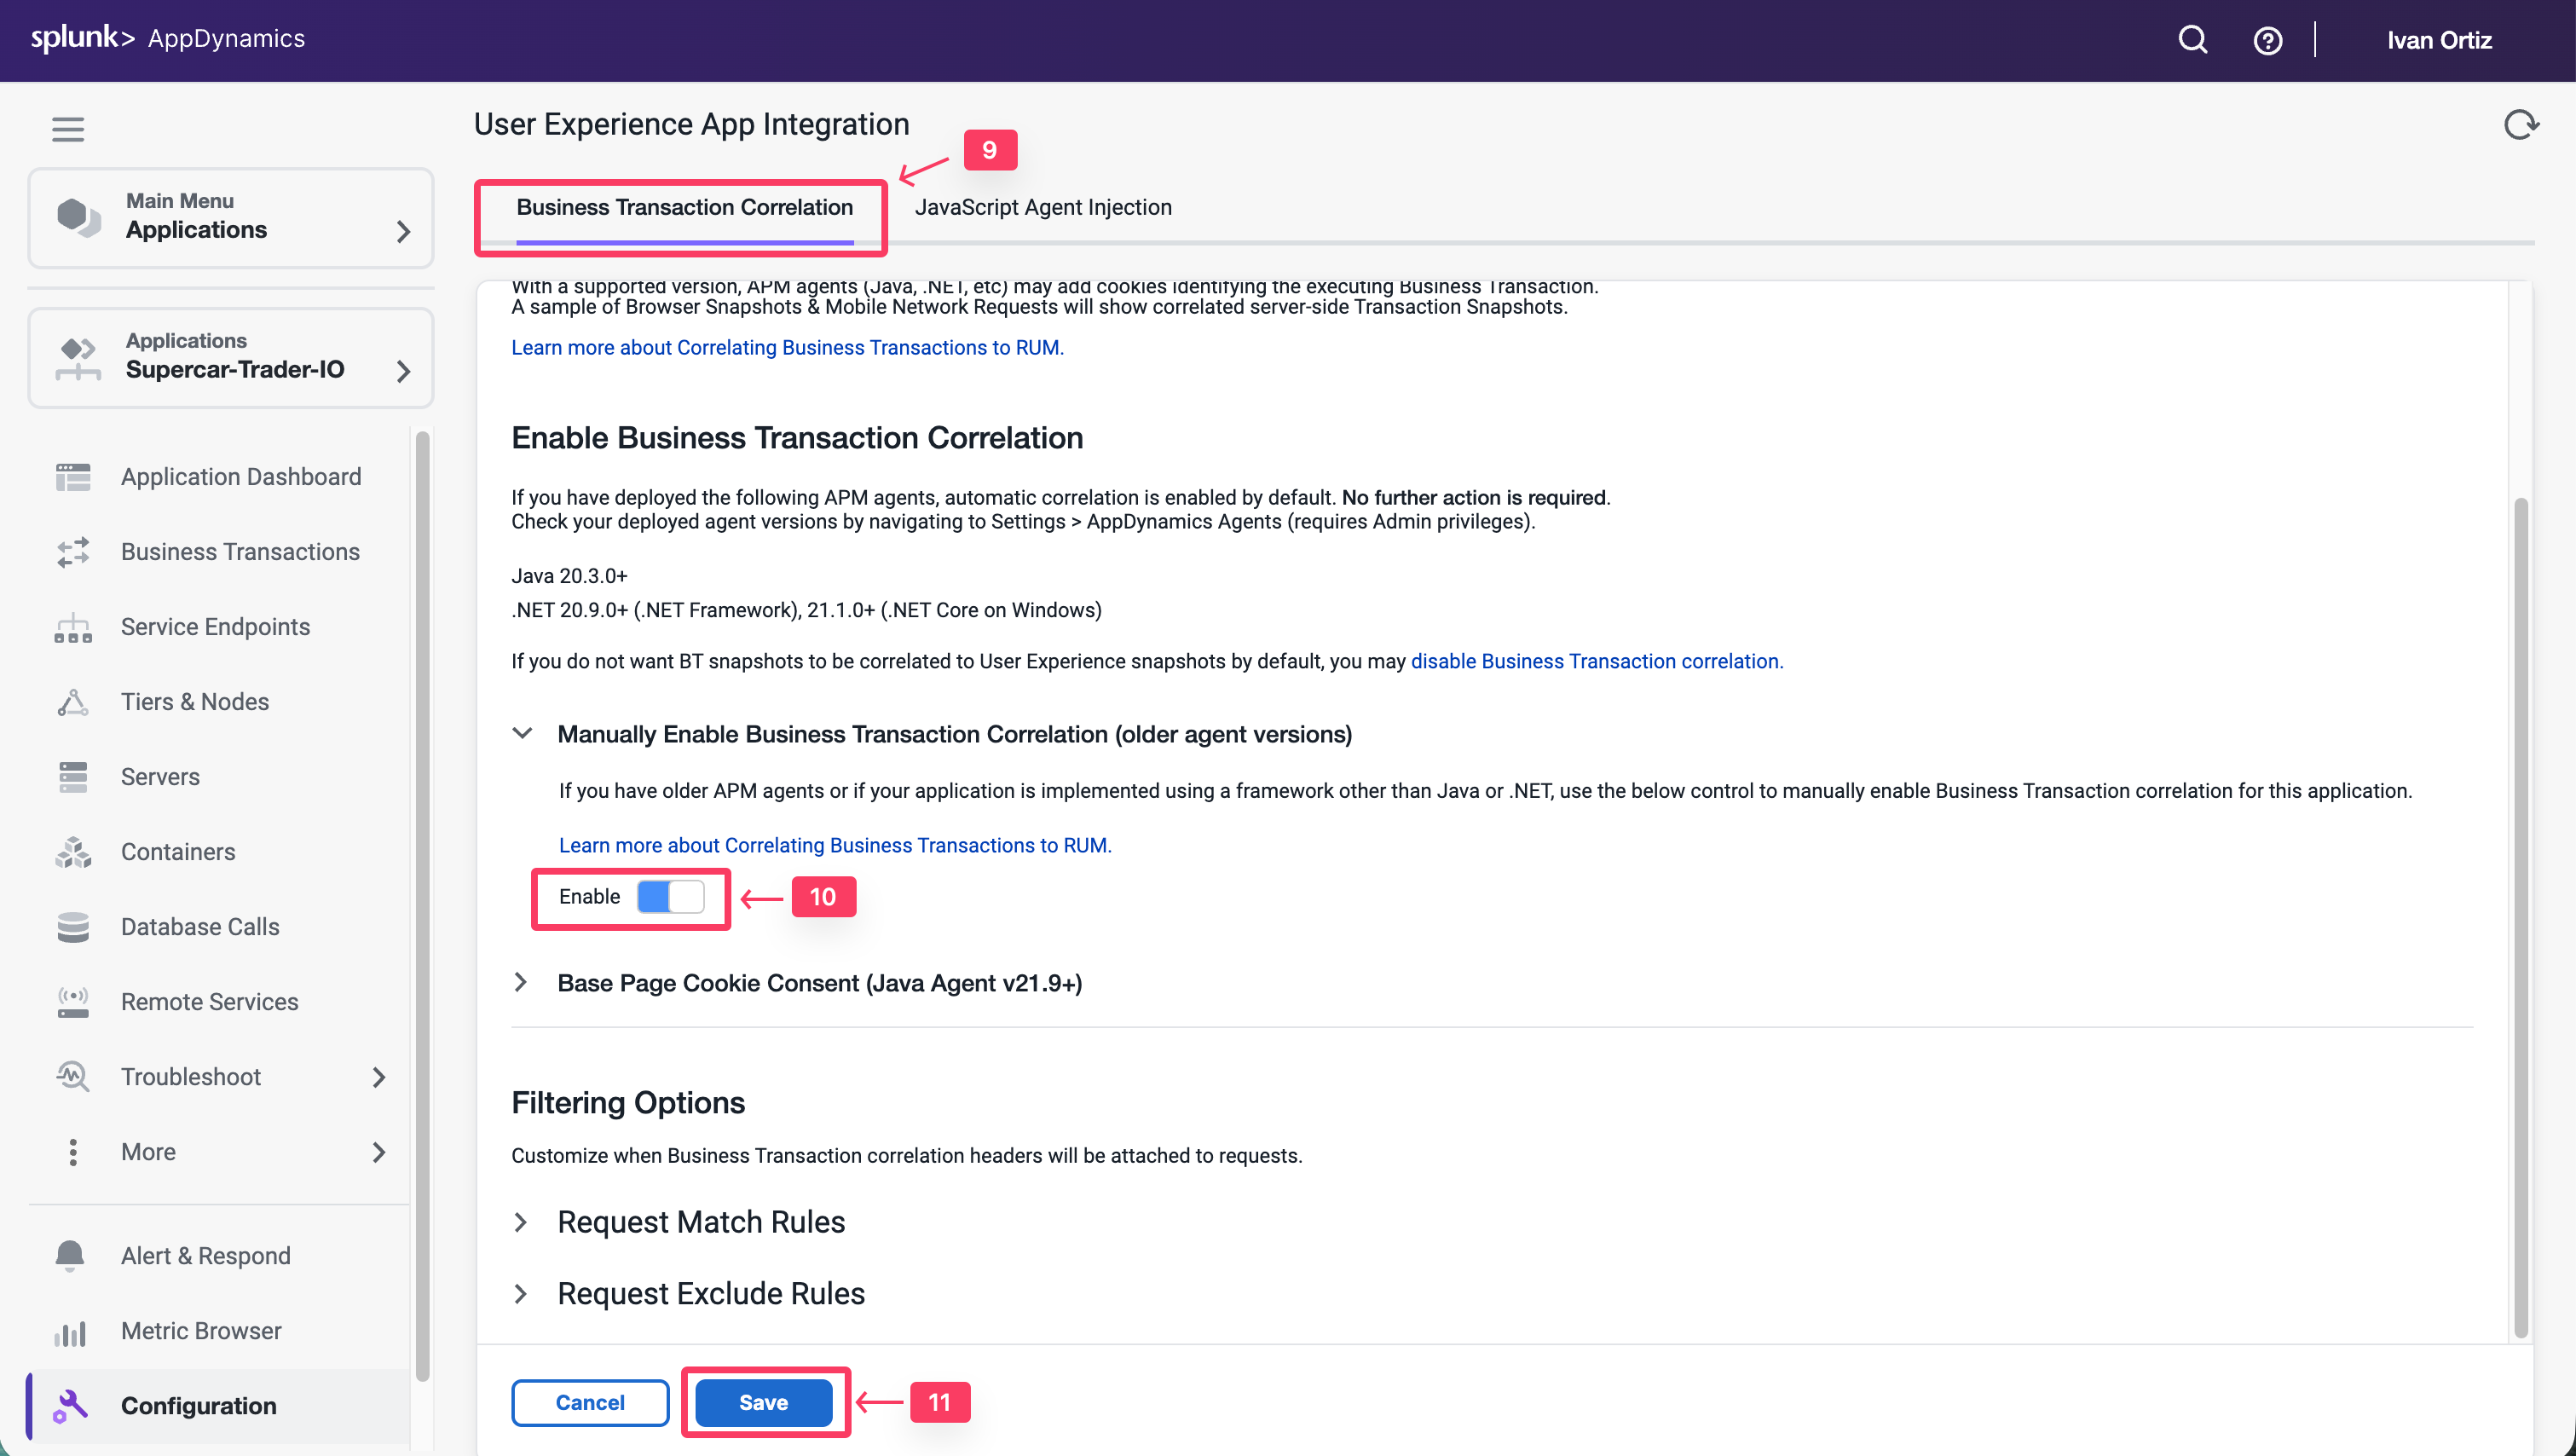
It takes a few minutes for the Auto-Injection to discover potential Business Transactions. While this is happening, use these steps to enable the Business Transaction Correlation. For newer APM agents this is done automatically
Click the Business Transaction Correlation tab.
Click the Enable button under the Manually Enable Business Transactions section.
Click Save.
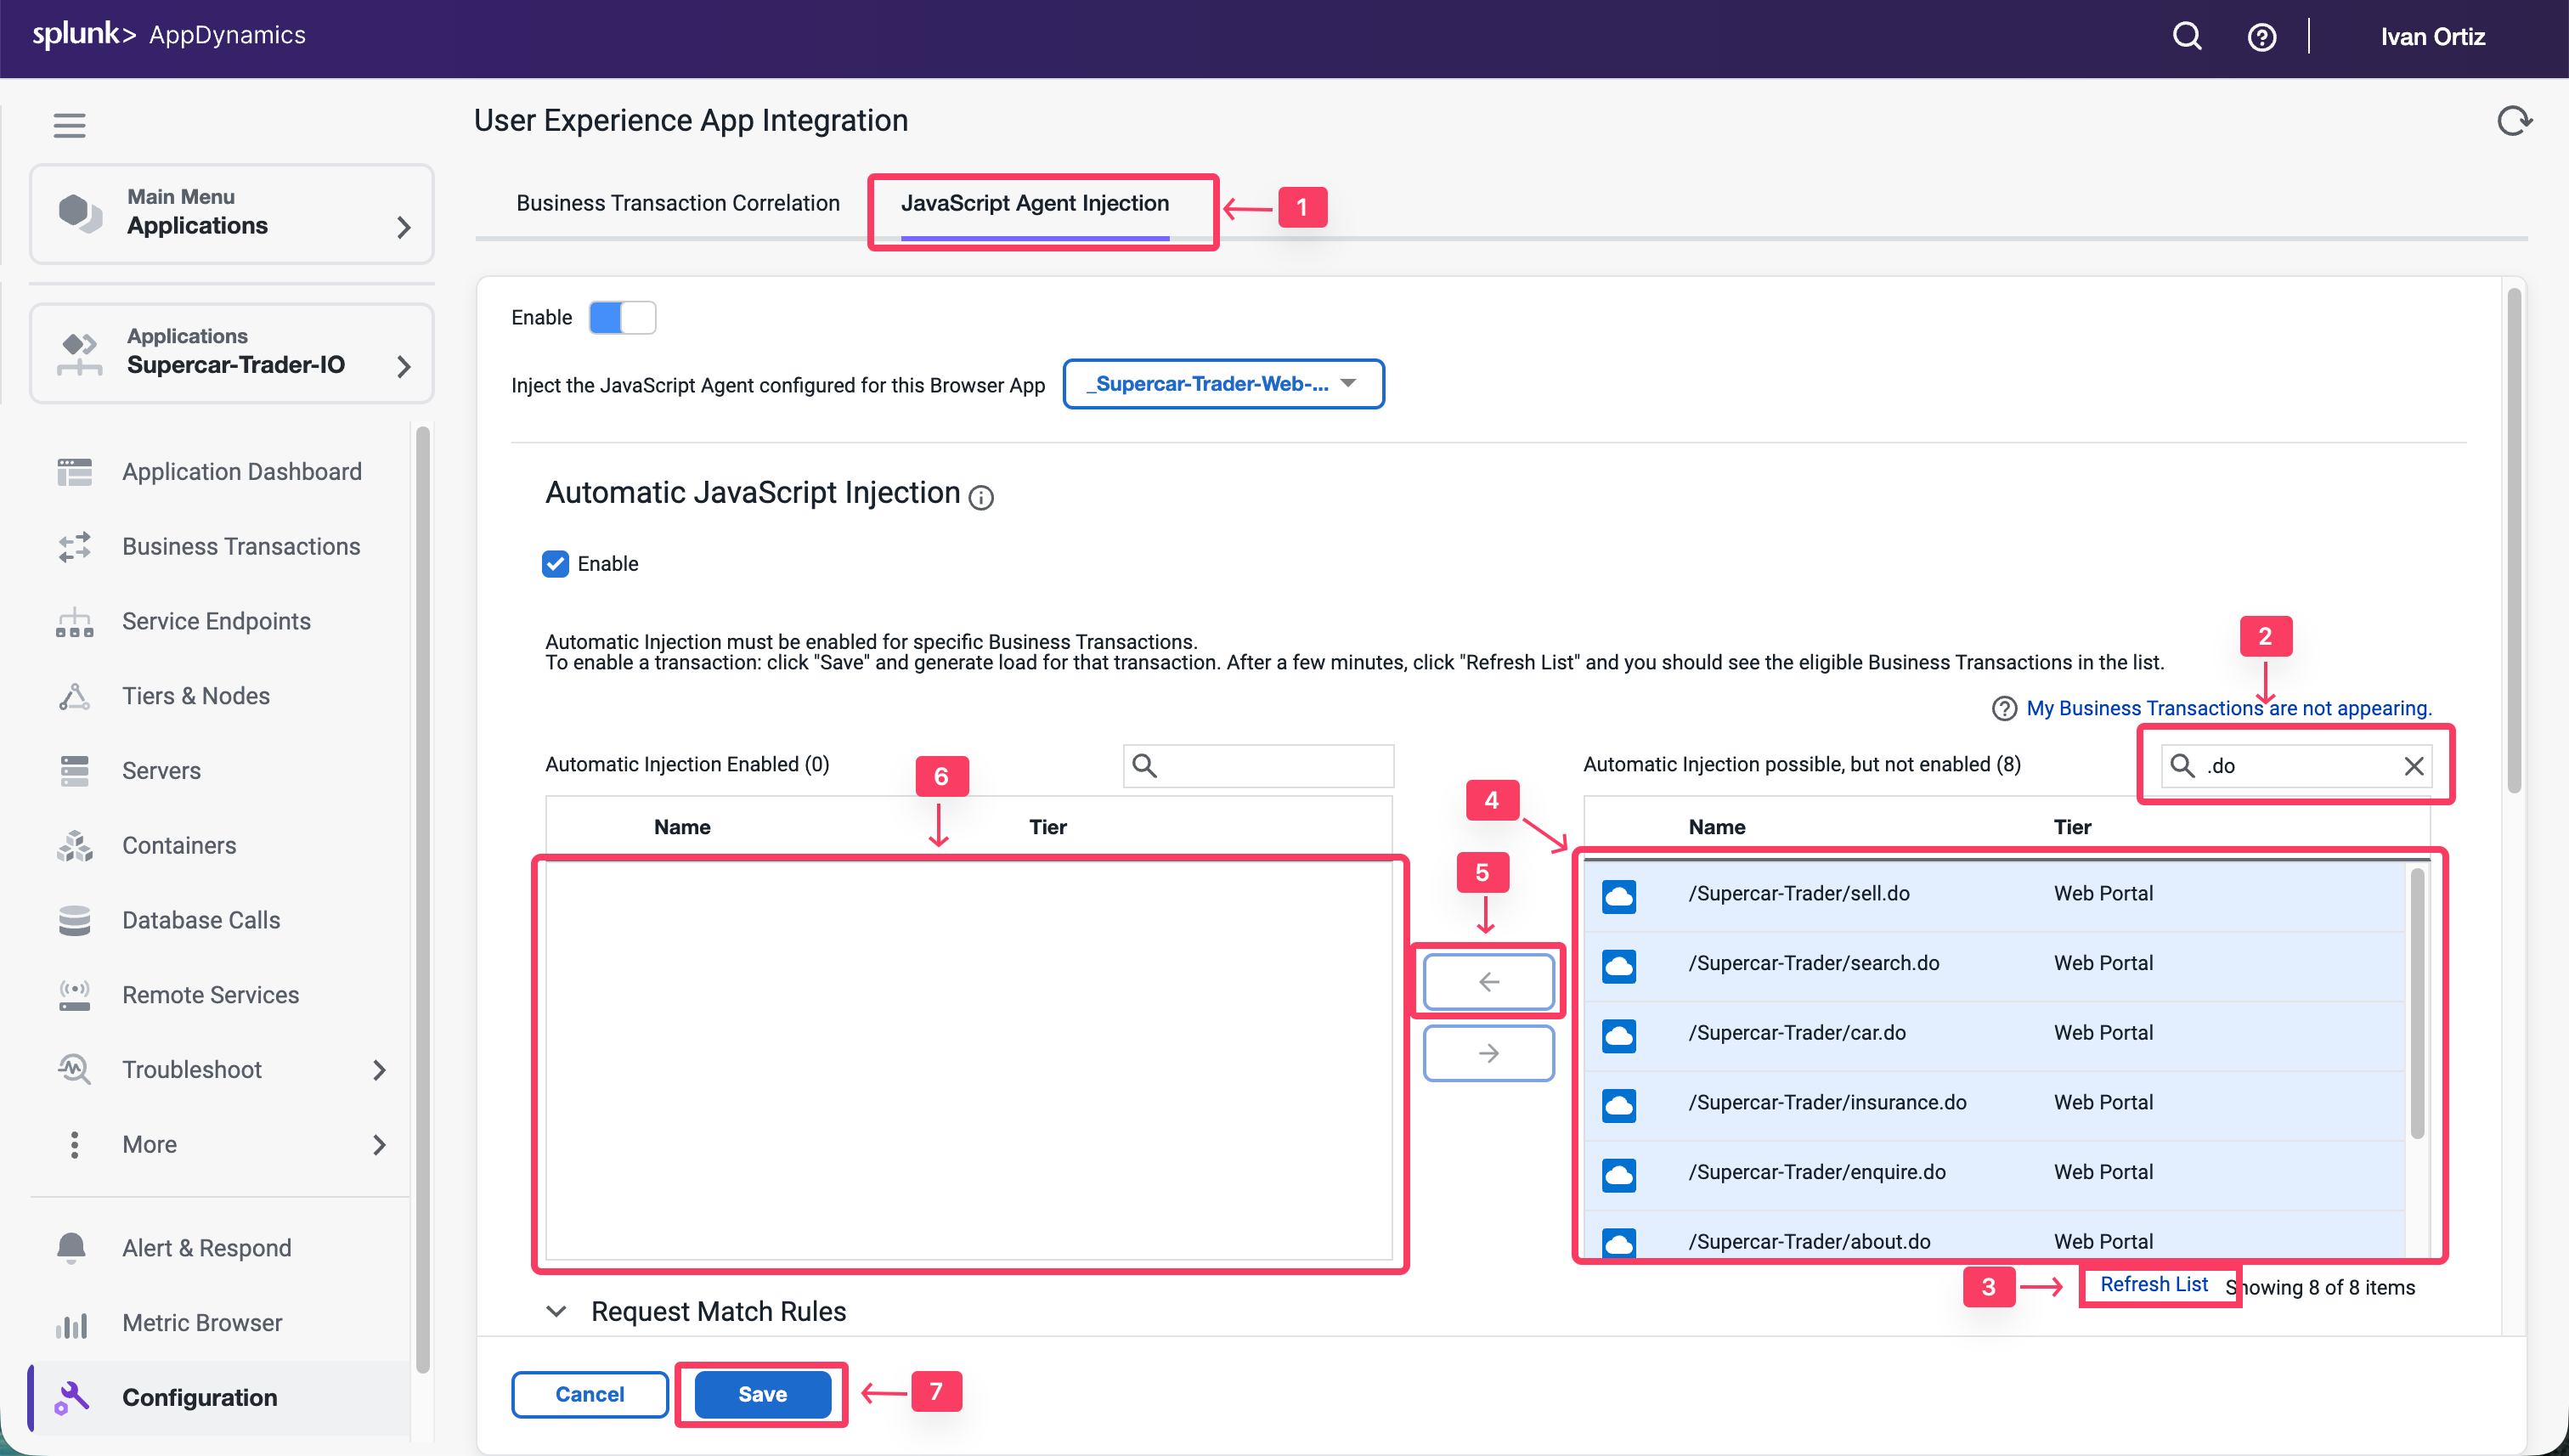
Select Business Transactions for injection
Use the following steps to select the Business Transactions for Auto-Injection.
Click the JavaScript Agent Injection tab.
Type .do in the search box.
Click the Refresh List link for the Business Transactions until all 9 BTs show up.
Select all Business Transactions from the right list box.
Click the arrow button to move them to the left list box.
Ensure that all Business Transactions are moved into the left list box.
Click Save.
You can read more about configuring Automatic Injection of the JavaScript Agent here.
Wait a few minutes for load to start showing up in your Browser Application.
Monitor and Troubleshoot - Part 1
2 minutes
In this exercise you will complete the following tasks:
Review the Browser Application Overview Dashboard
Review the Browser Application Geo Dashboard
Review the Browser Application Usage Stats Dashboard
Navigate the Supercar-Trader application web pages
Review the Browser Application Overview Dashboard
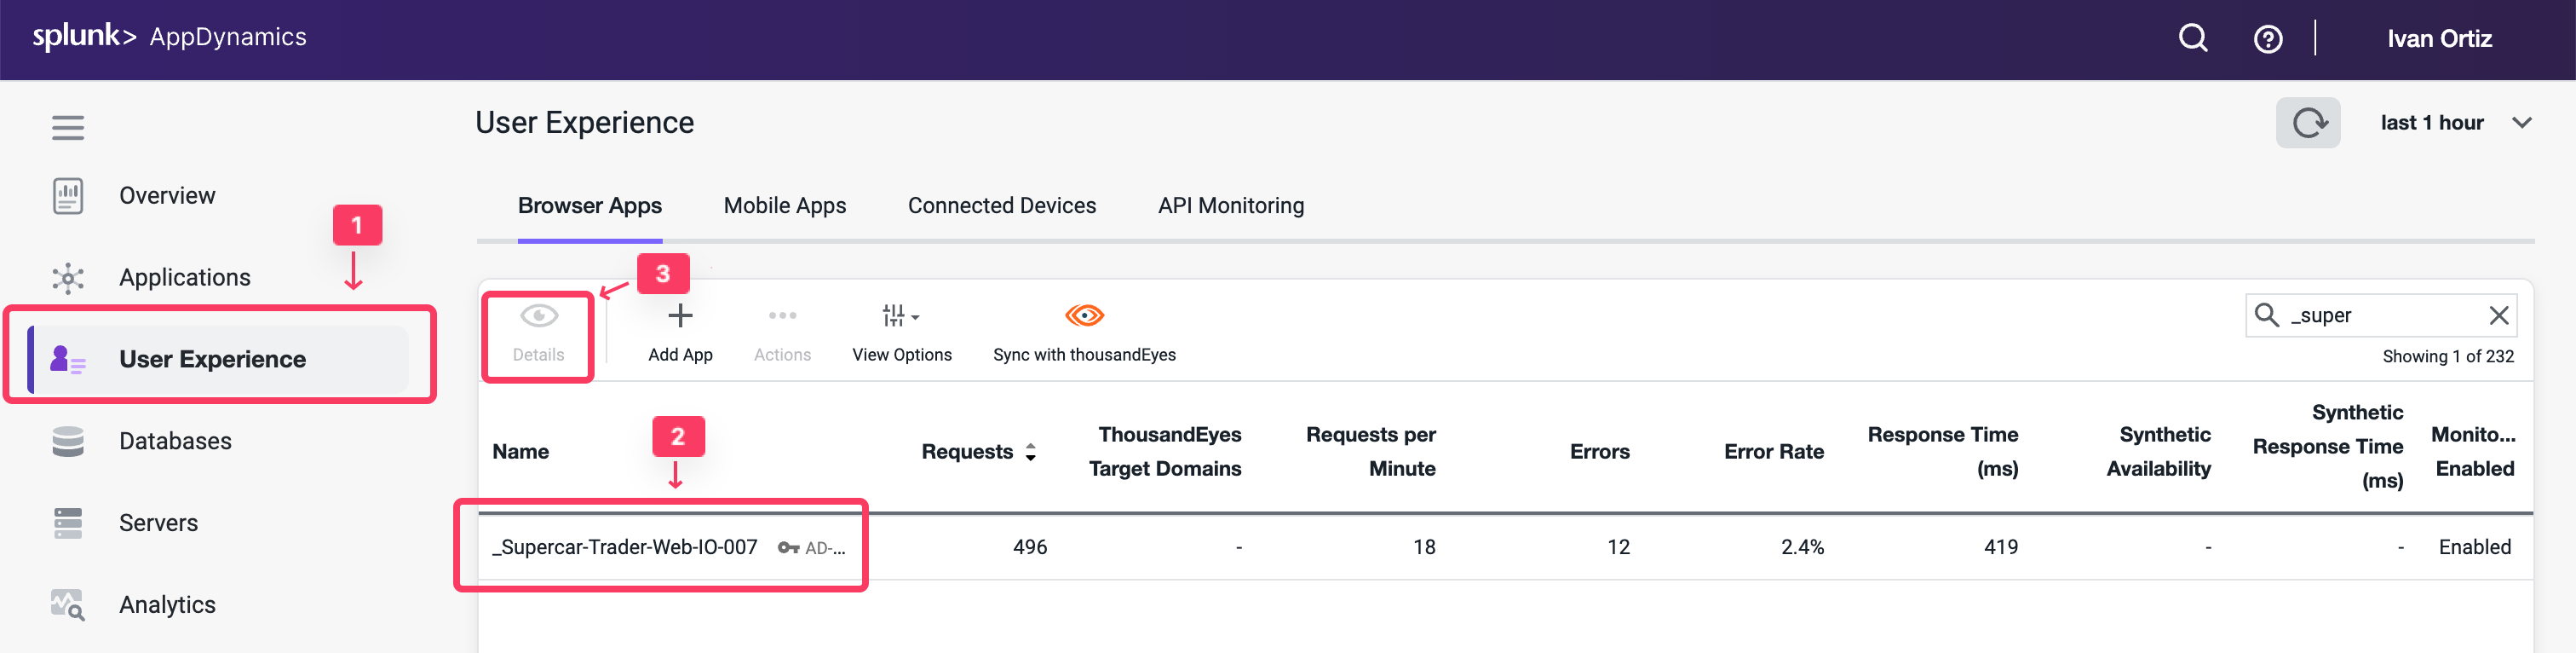
Navigate to the User Experience dashboard and drill into the browser application overview dashboard by following these steps.
Click the User Experience tab on the left menu.
Search for you Web Application Supercar-Trader-Web-##-###.
Click Details or double click on your application name
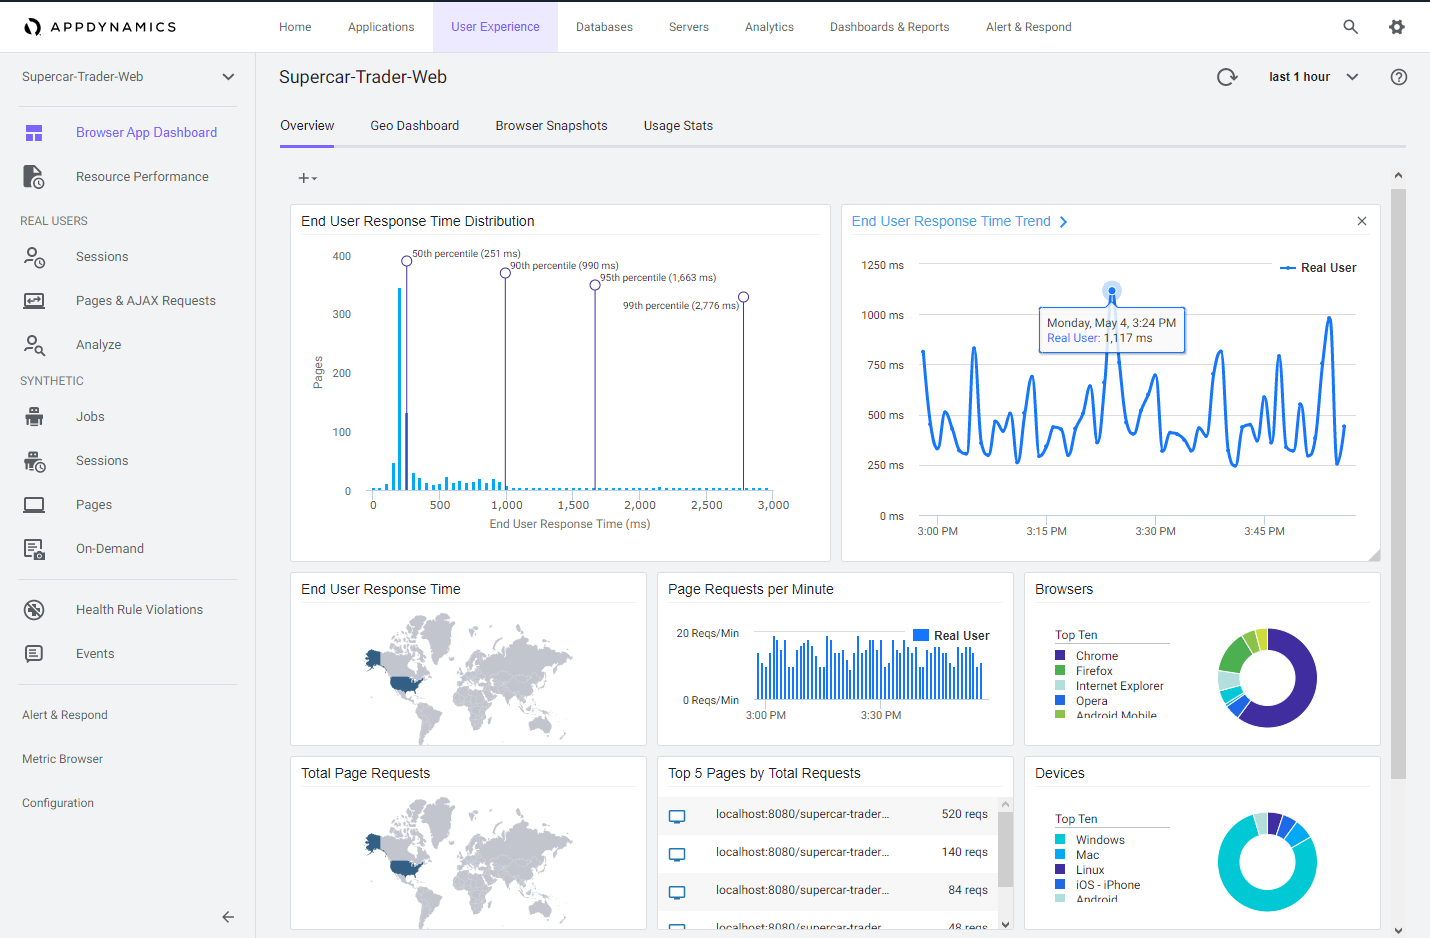
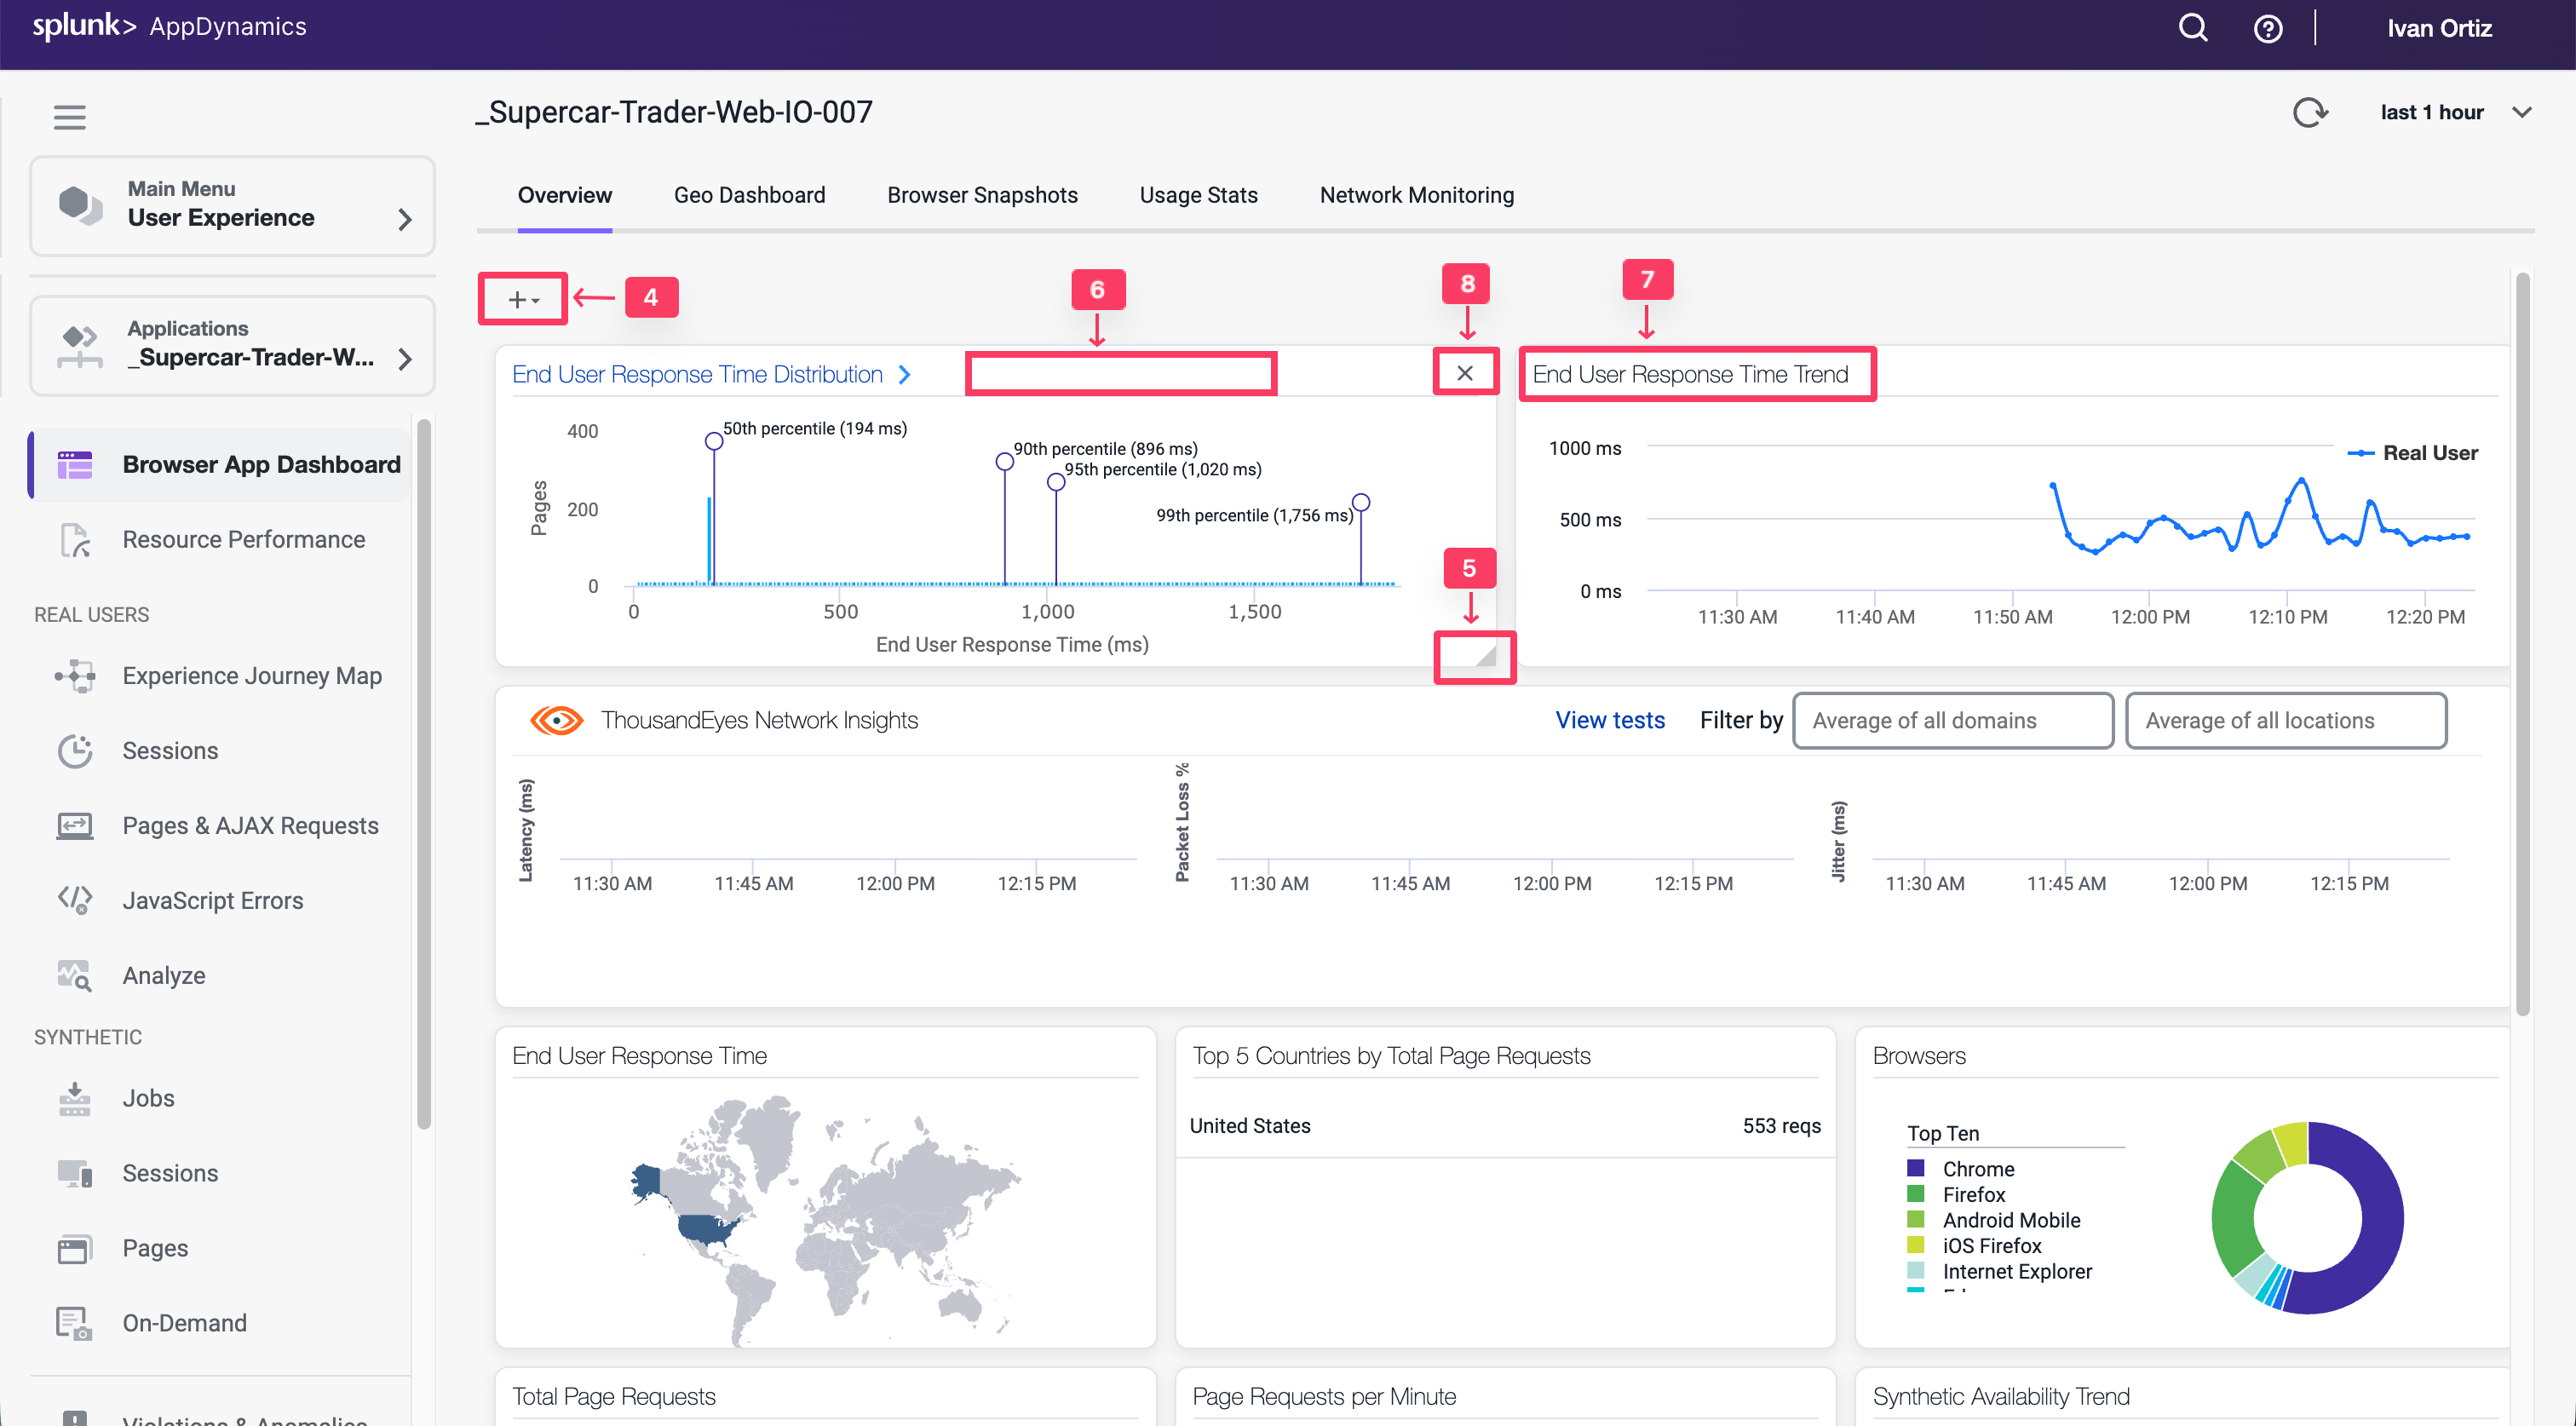
The Overview dashboard displays a set of configurable widgets. The default widgets contain multiple graphs and lists that feature common high-level indicators of application performance, including:
End User Response Time Distribution
End User Response Time Trend
Total Page Requests by Geo
End User Response Time by Geo
Top 10 Browsers
Top 10 Devices
Page Requests per Minute
Top 5 Pages by Total Requests
Top 5 Countries by Total Page Requests
Explore the features of the dashboard.
Click + to choose additional graphs and widgets to add to the dashboard.
Click and drag the bottom right corner of any widget to resize it.
Select the outlined area in any widget to move and place it on the dashboard.
Click on the title of any widget to drill into the detail dashboard.
Click X in the top right corner of any widget to remove it from the dashboard.
Any changes you make to the dashboard widget layout will automatically be saved.
You can read more about the Browser Application Overview dashboard here.
Review the Browser Application Geo Dashboard
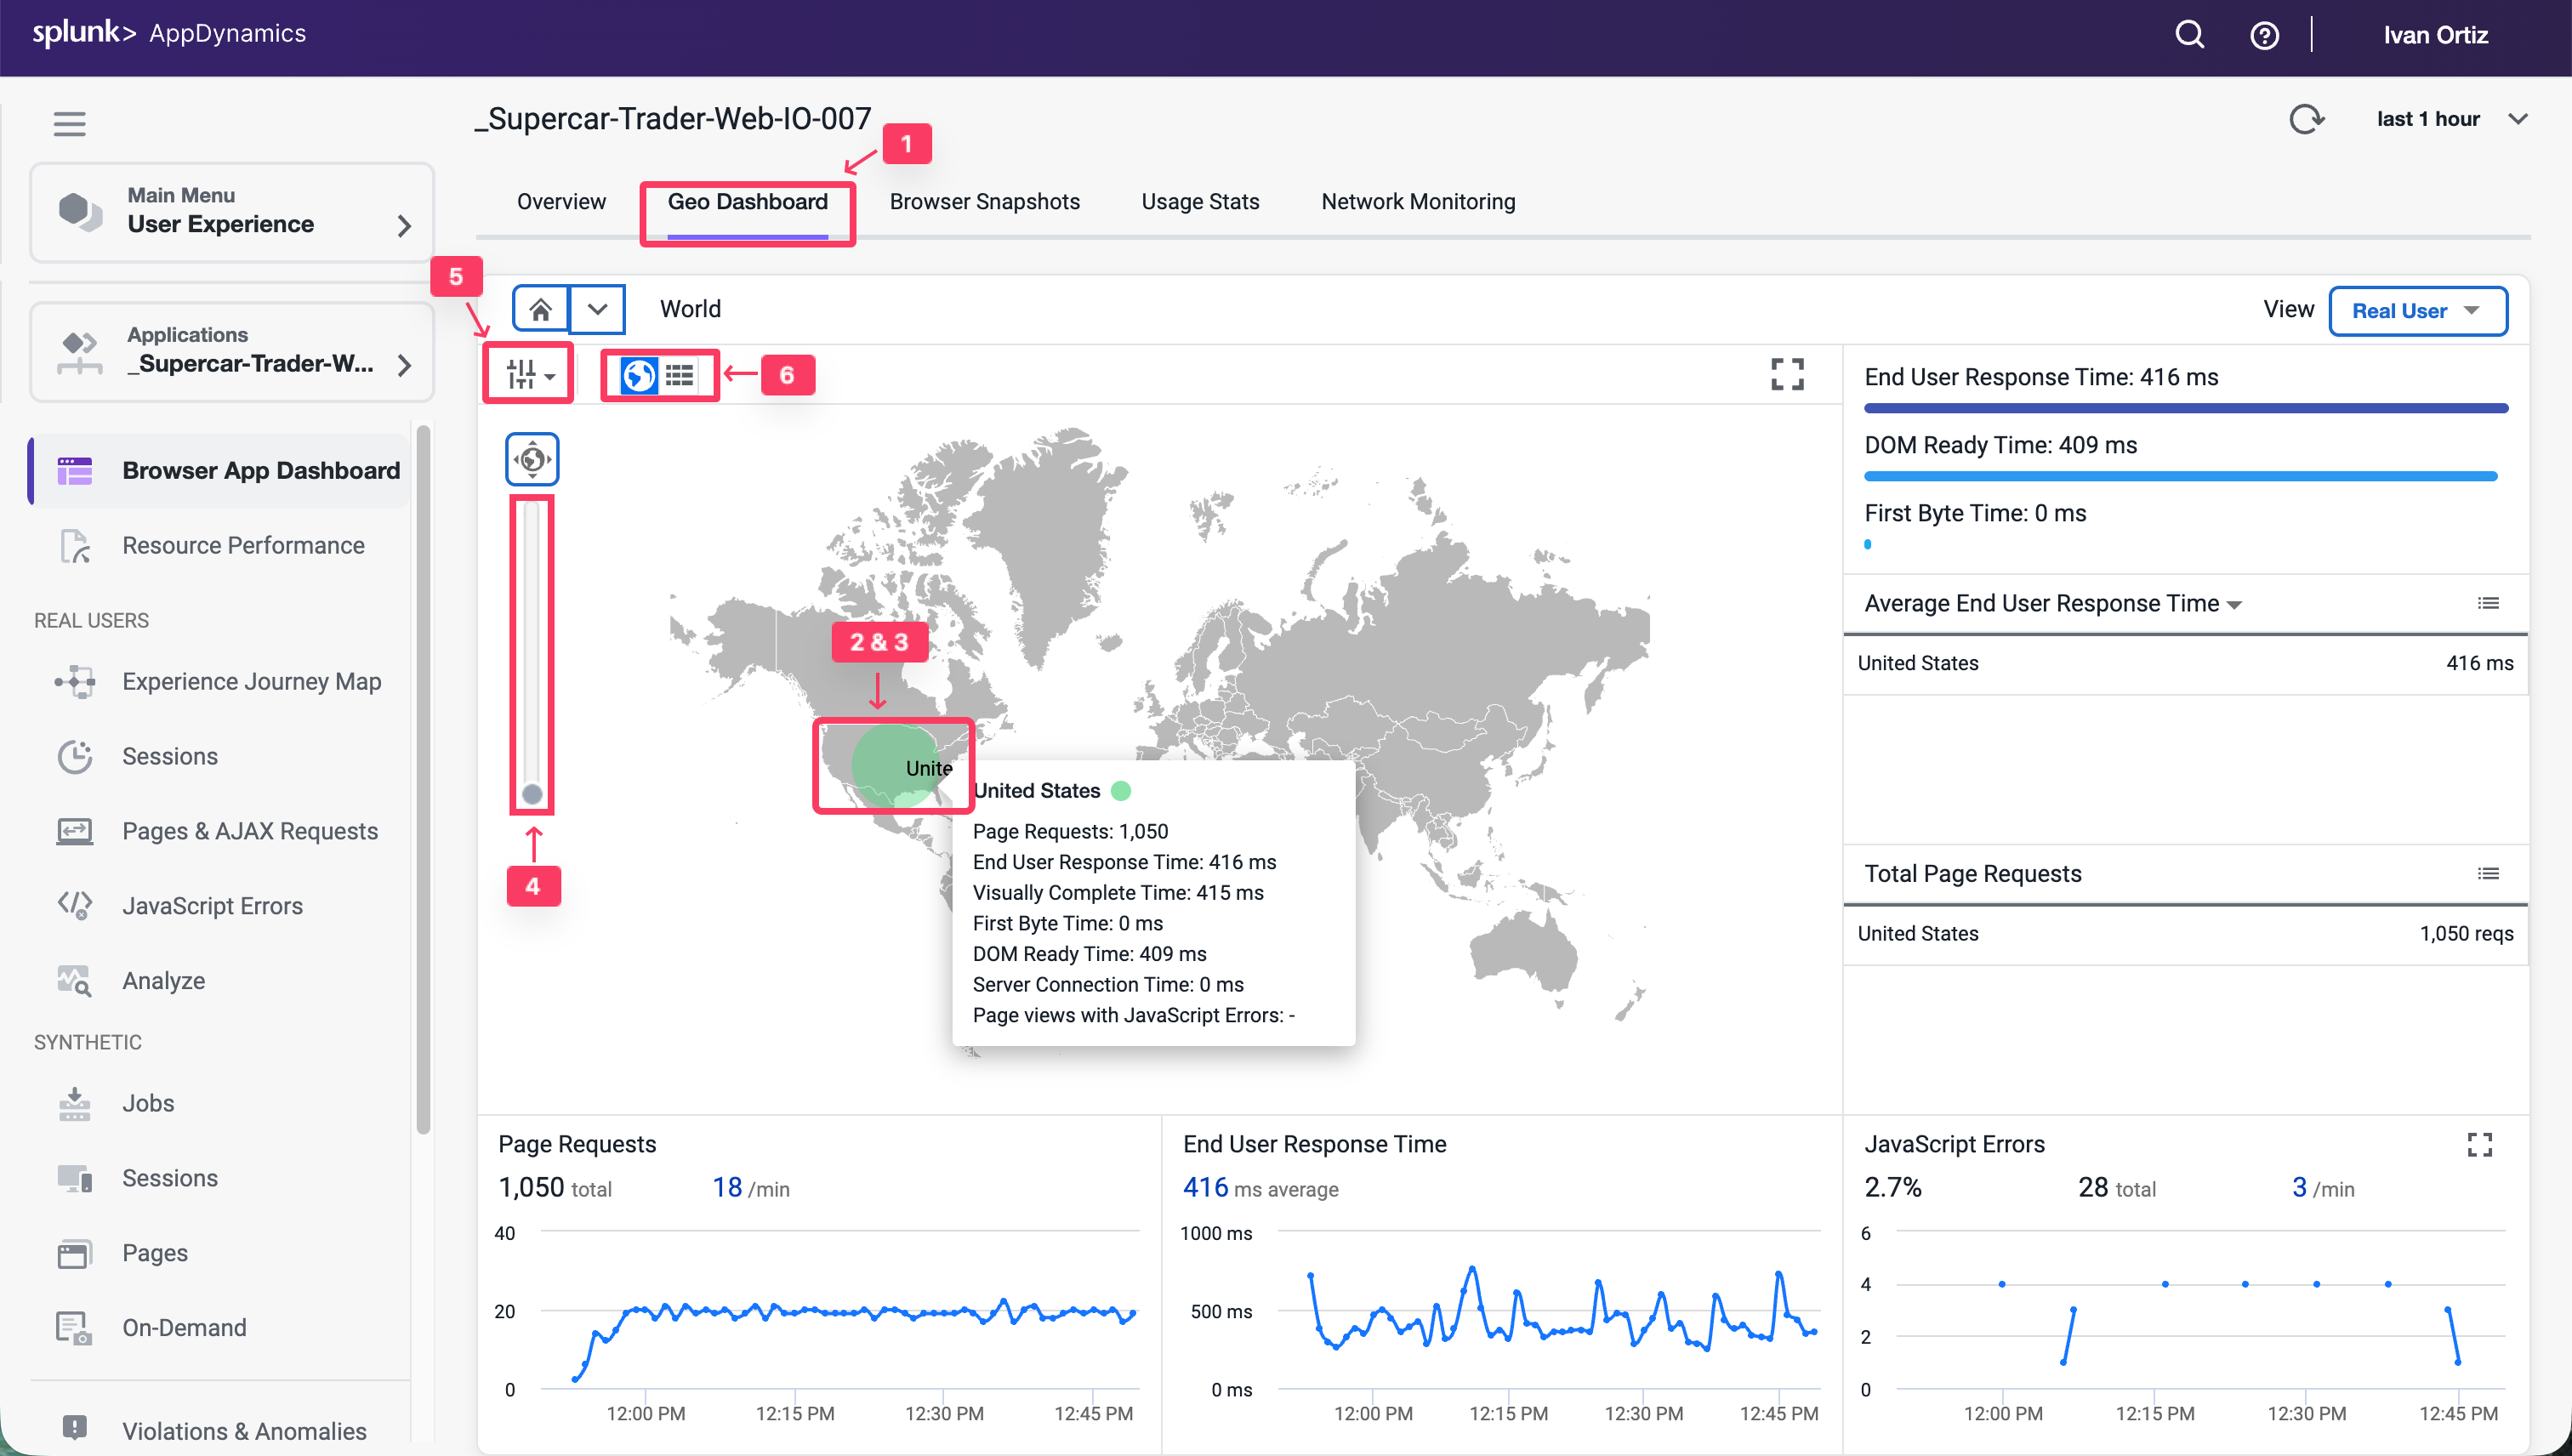
The Geo Dashboard displays key performance metrics by geographic location based on page loads. The metrics displayed throughout the dashboard are for the region currently selected on the map or in the grid. The Map view displays load circles with labels for countries that are in the key timing metrics given in the right panel. Some countries and regions, however, are only displayed in the grid view.
Navigate to the Browser Application Geo dashboard and explore the features of the dashboard described below.
Click the Geo Dashboard option.
Click on one of the load circles to drill down to the region.
Hover over one of the regions to show the region details.
Use the zoom slider to adjust the zoom level.
Click Configuration to explore the map options.
Switch between the grid view and map view.
You can read more about the Browser Application Geo dashboard here.
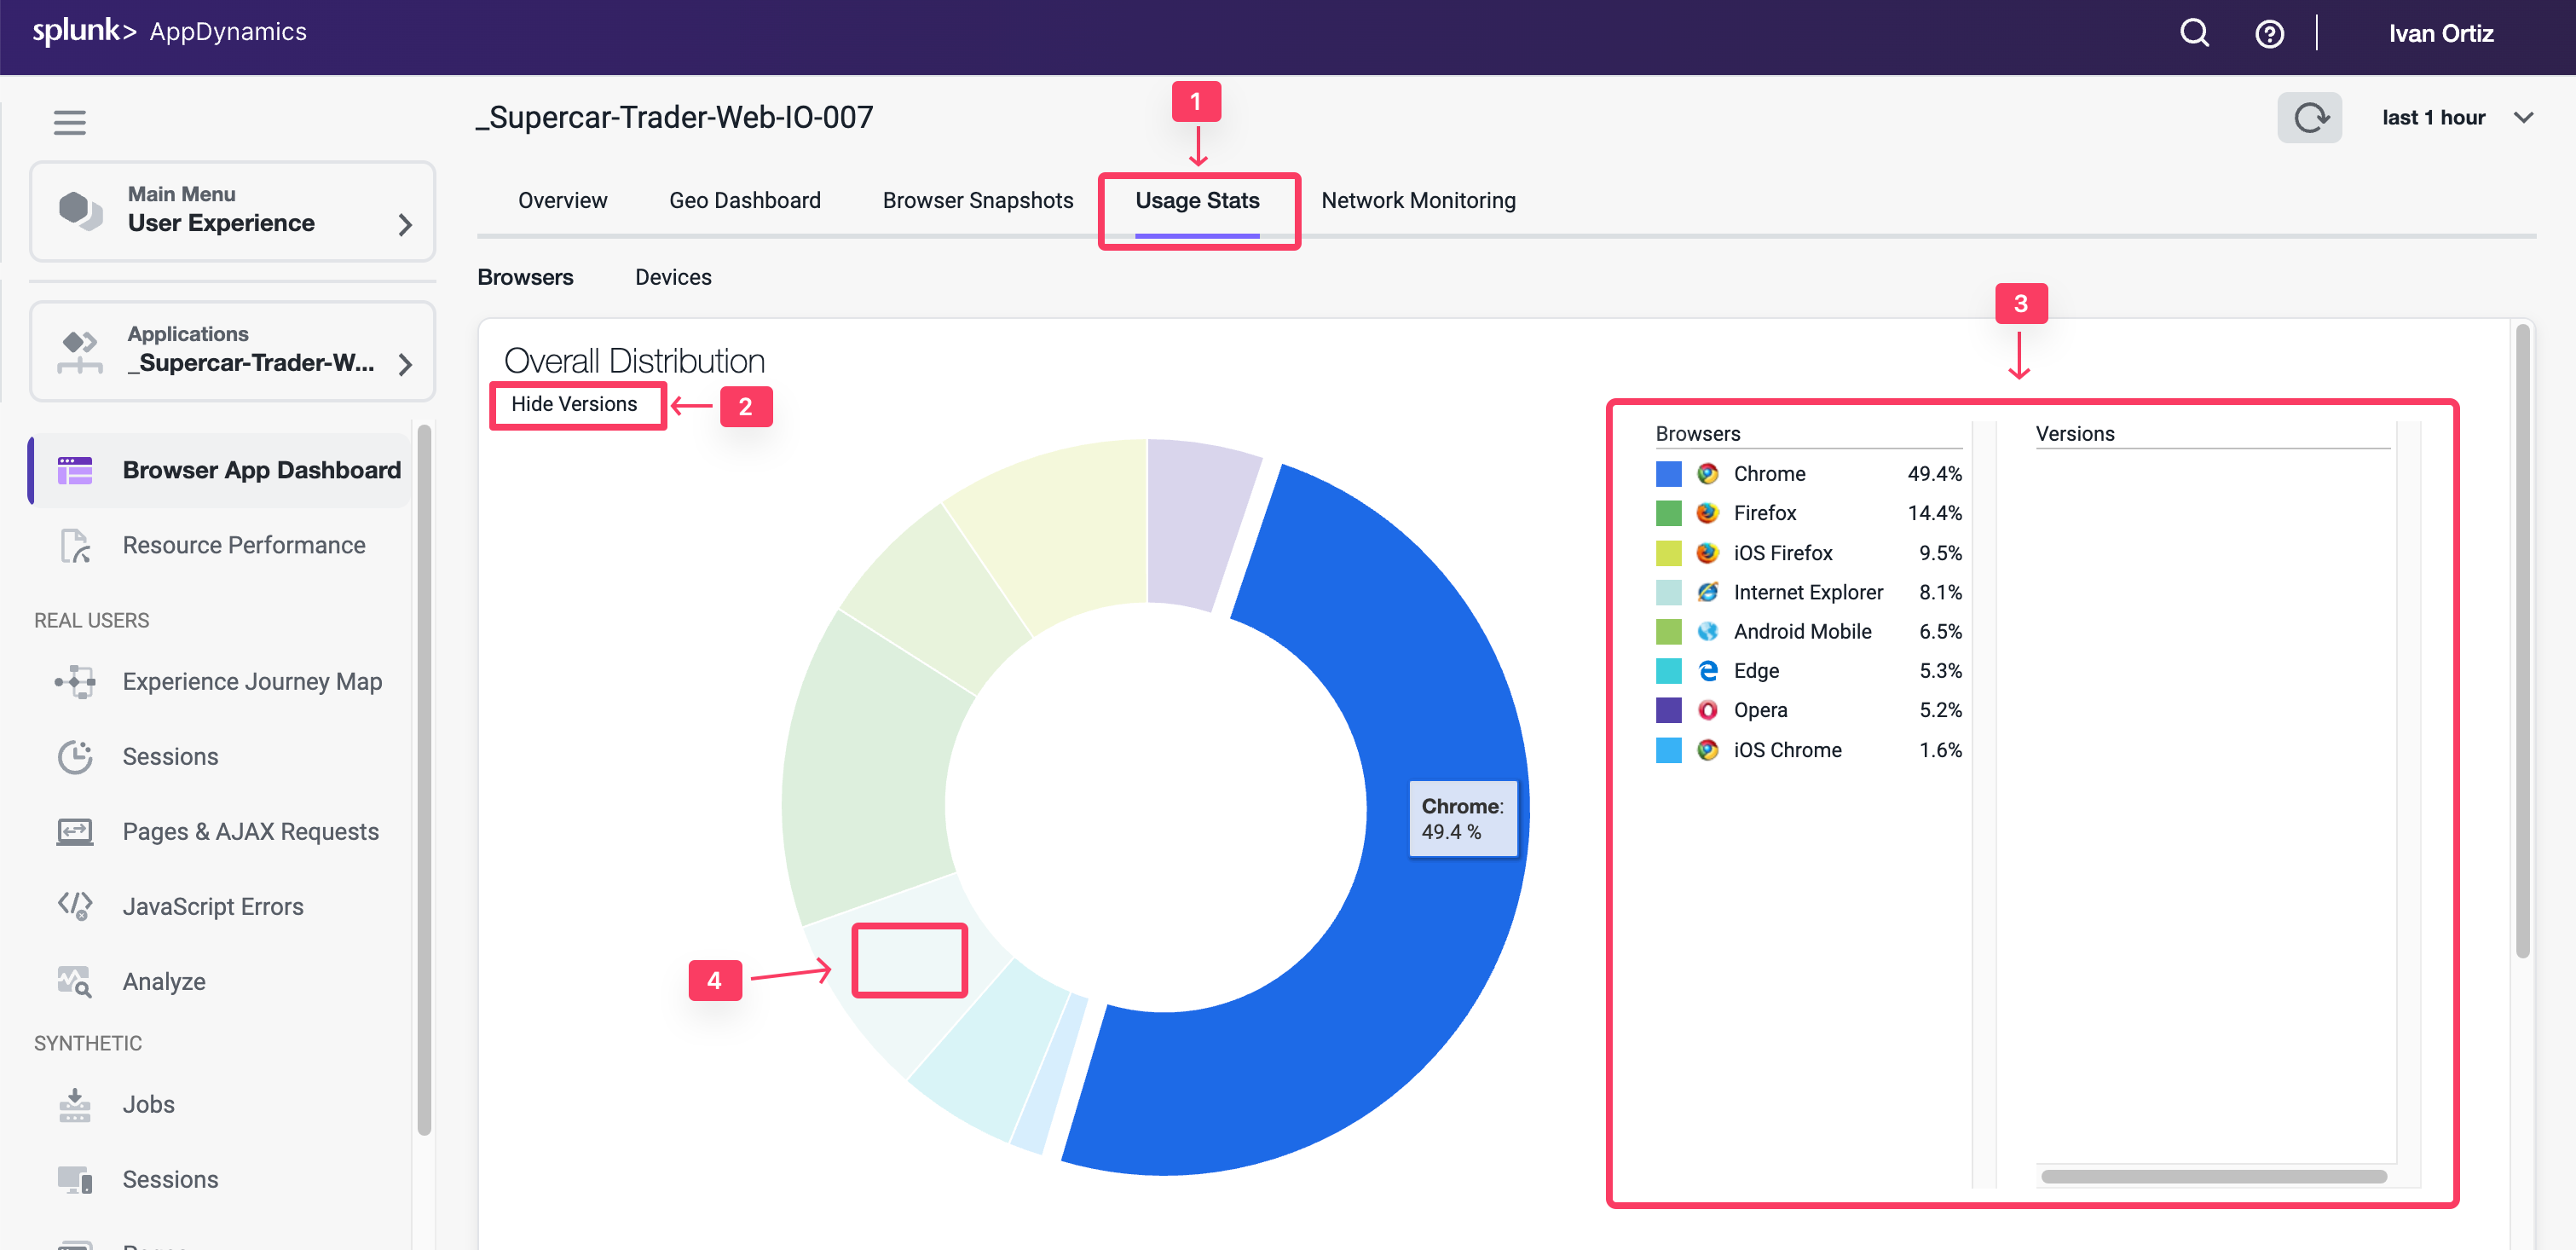
Review the Browser Application Usage Stats Dashboard
The Usage Stats dashboard presents an aggregated page-load usage data based on your users browser type and device/platform.
The Browser Application Usage Stats dashboard helps you discover:
The slowest browsers in terms of total end-user response time.
The slowest browsers to render the response page.
The browsers that most of your end users use.
The browsers that most of your end users use in a particular country or region.
Navigate to the Browser Application Usage Stats dashboard and explore the features of the dashboard described below.
Click the Usage Stats option.
Click the Show Versions option.
Look at the different browsers and versions by load.
Hover over the sections in the pie chart to see the details.
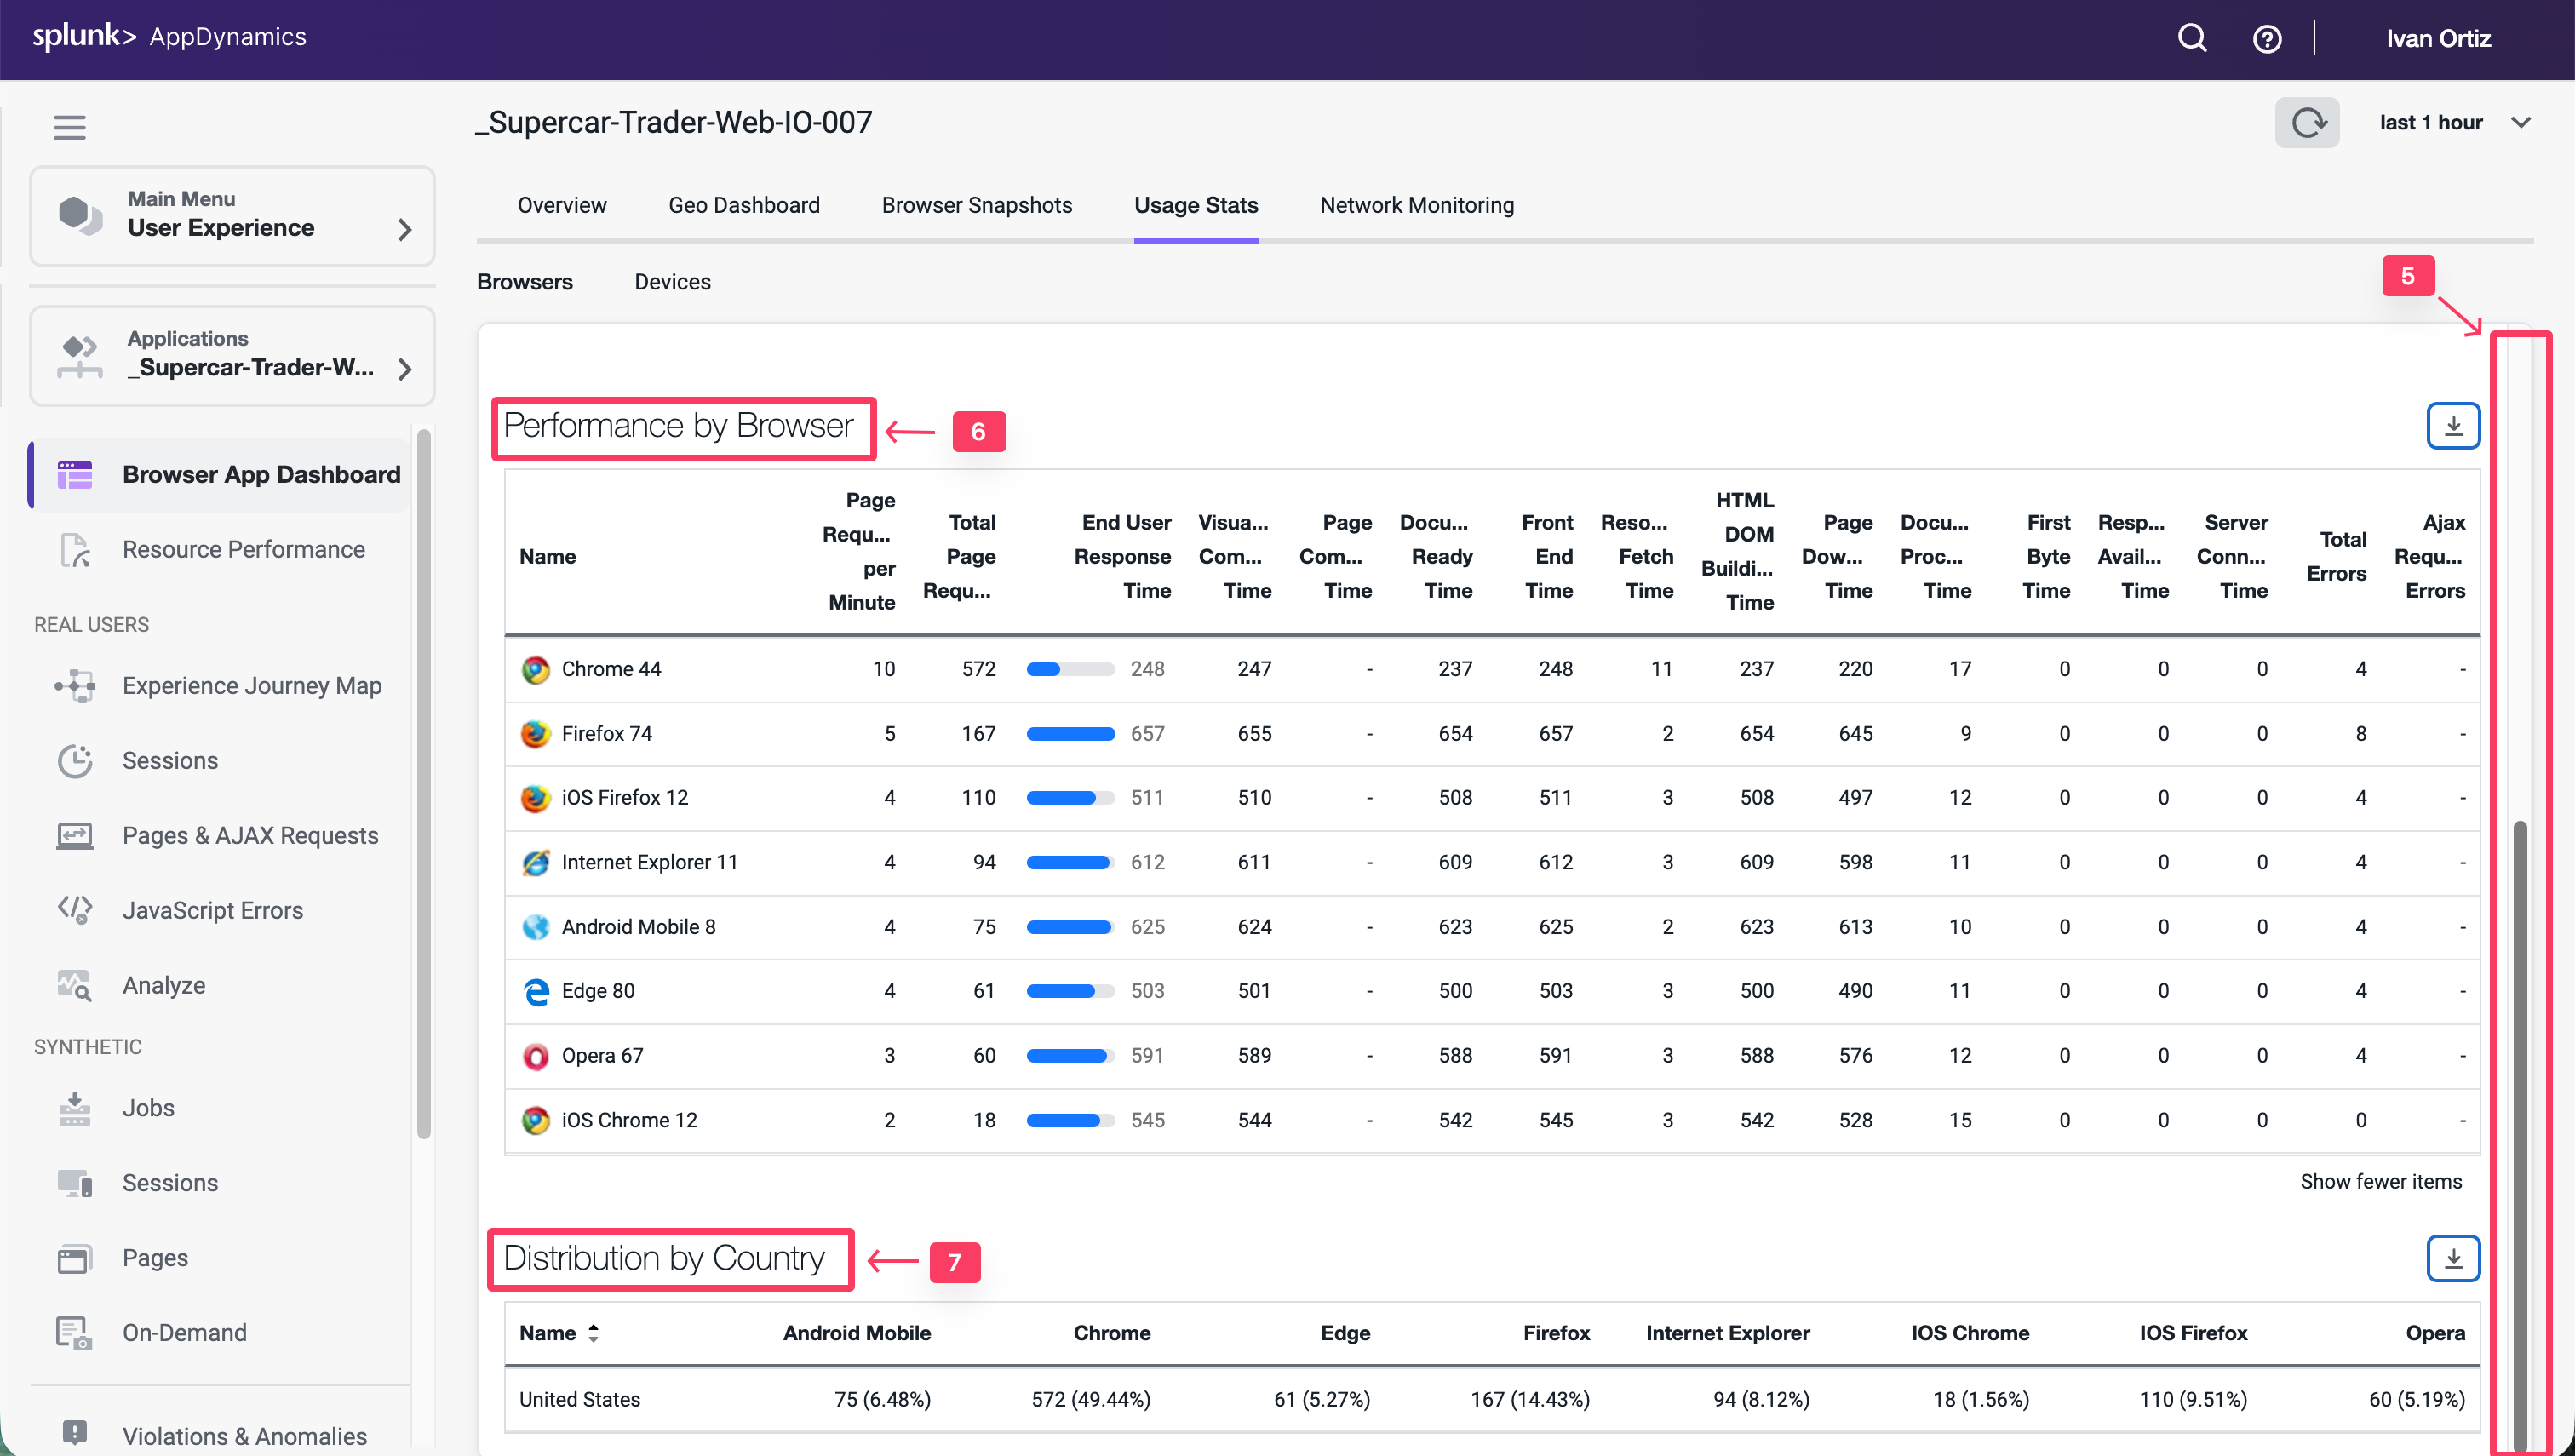
Use these steps to explore more metrics by browser and version.
Use the scroll bar on the right to scroll to the bottom of the page.
Explore the available metrics by browser and version.
Explore the available metrics by country.
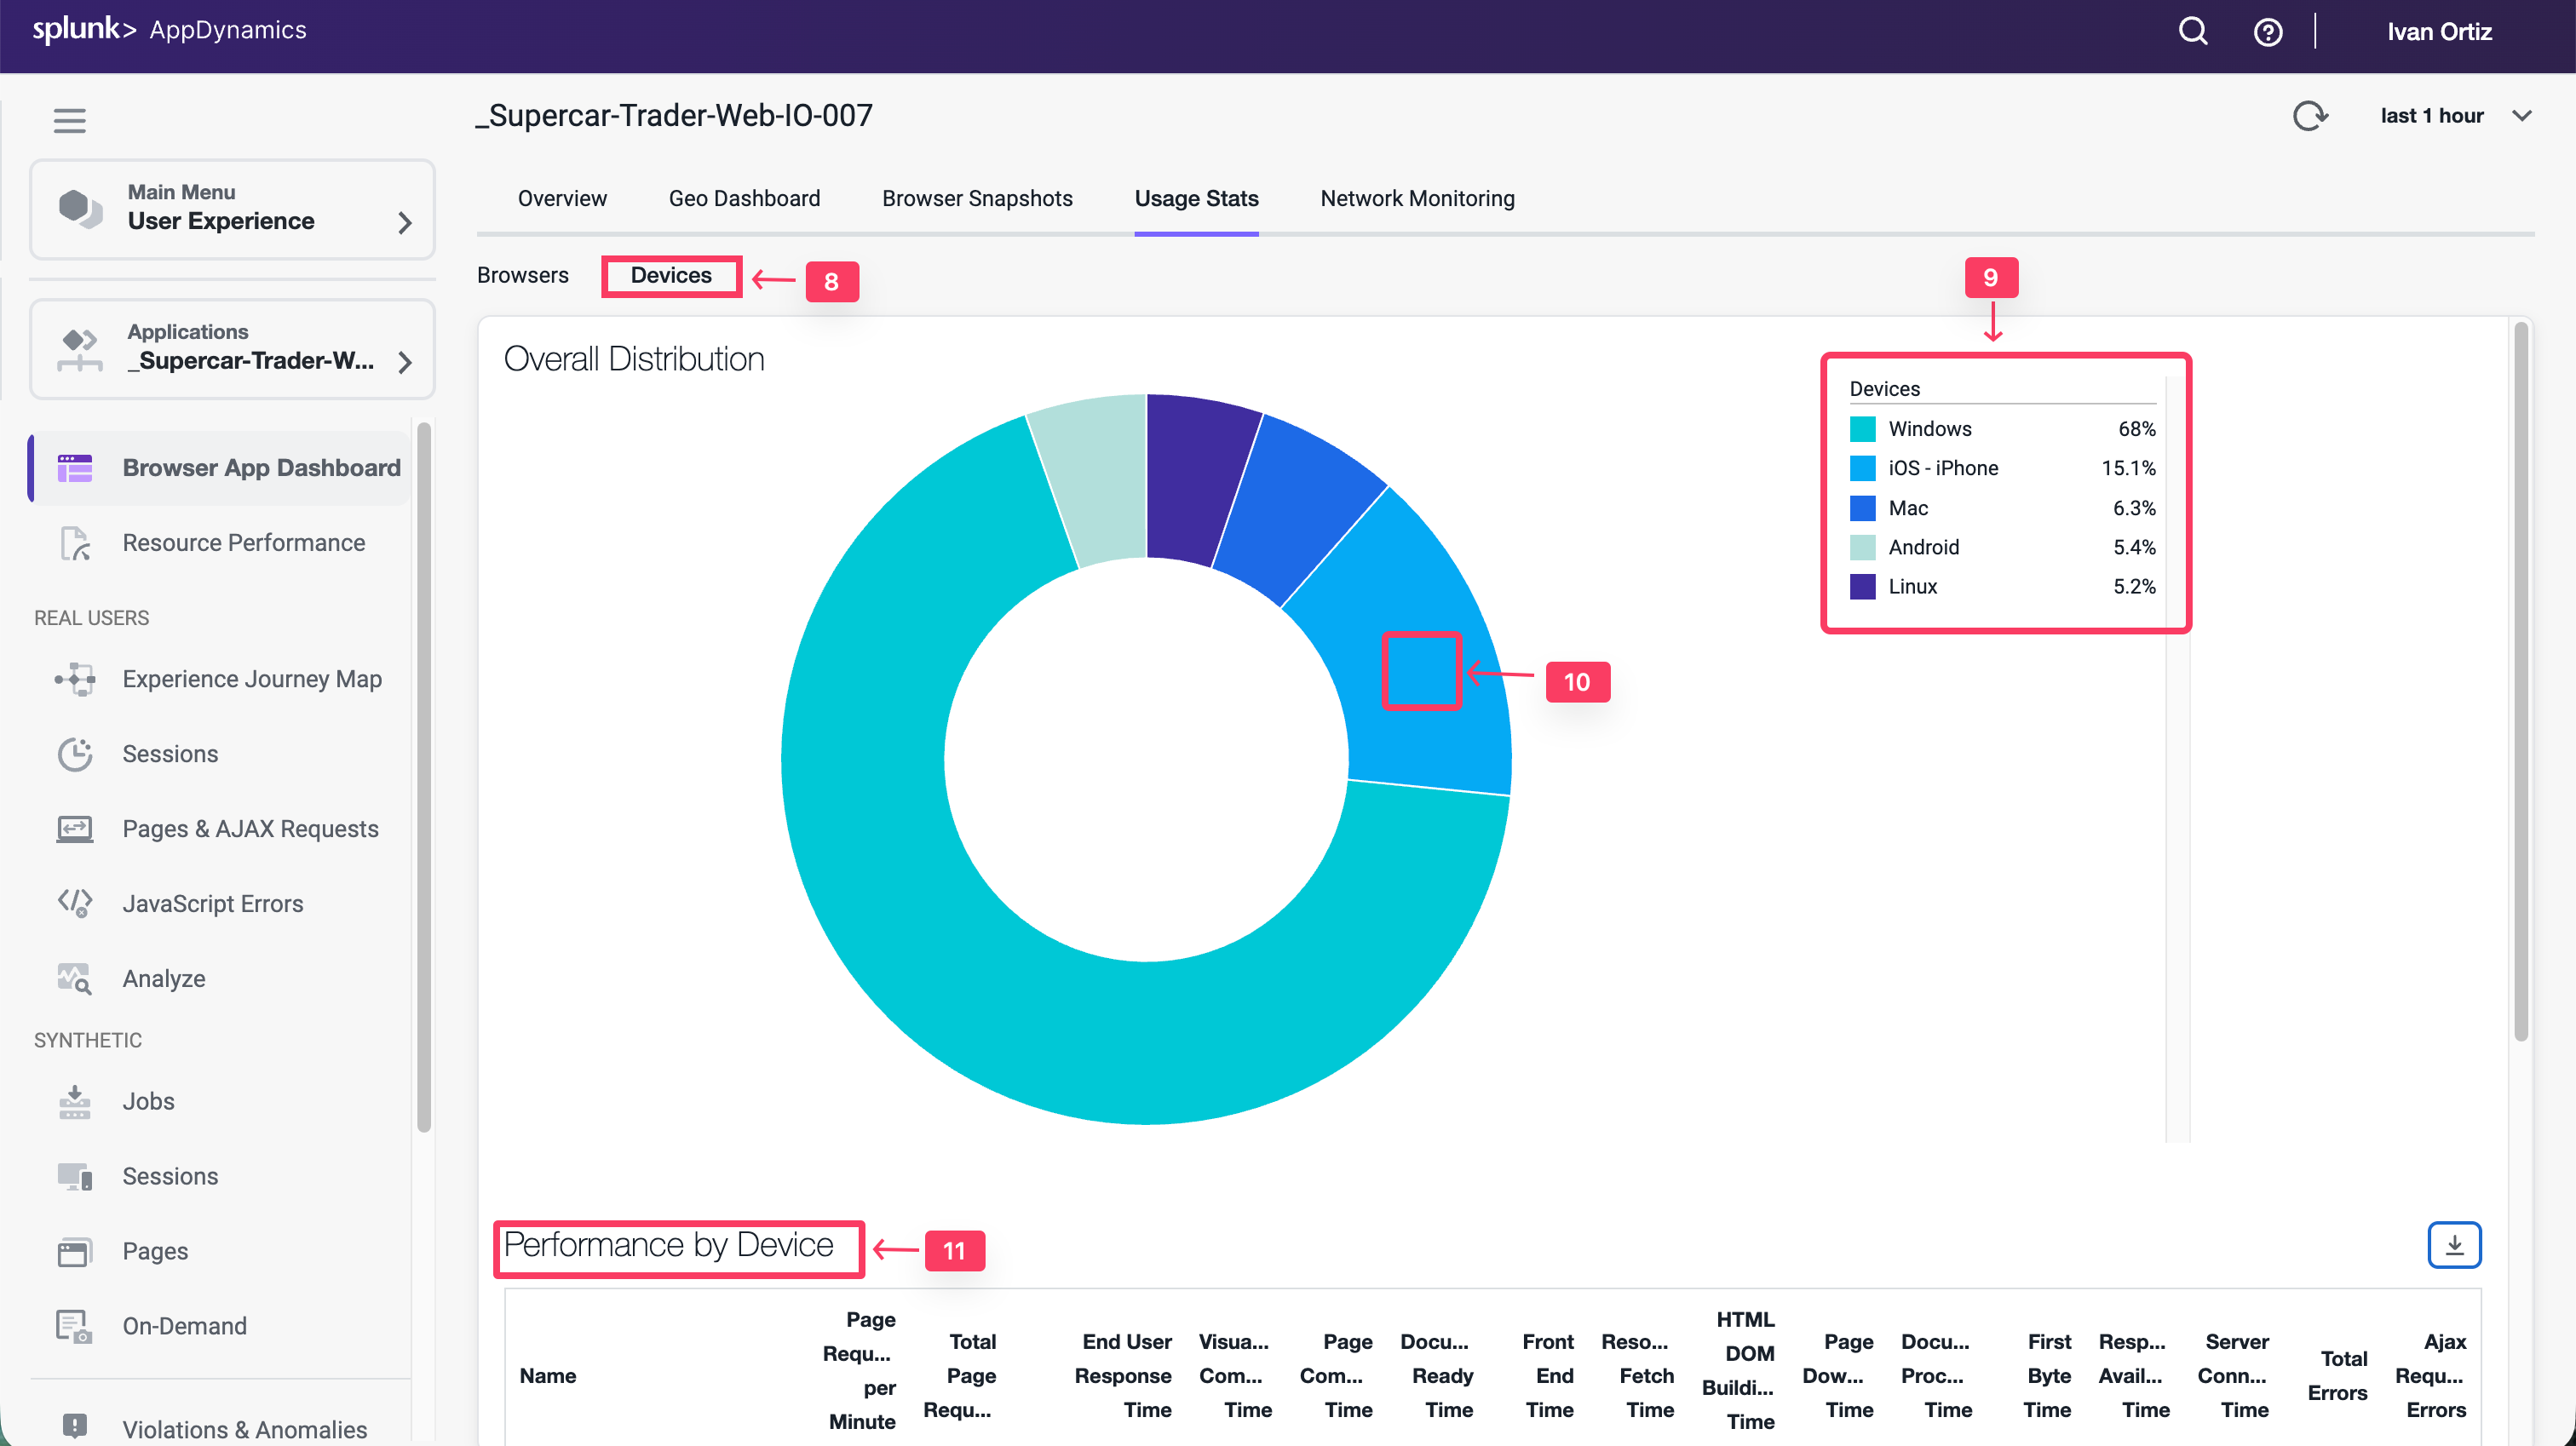
Navigate to the Devices dashboard and explore the features of the dashboard described below.
Click the Devices option.
Look at the load by device break out.
Hover over the sections in the pie chart to see the details.
Explore the available performance metrics by device.
You can read more about the Browser Application Usage Stats dashboard here.
Navigate the Supercar-Trader application web pages
Now that you have the Browser Real User Monitoring agent configured and explored the first series of features, let’s generate some additional load and record your unique browser session by navigating the web pages of the Supercar-Trader application.
Open the main page of the app with your web browser. In the example URL below, substitute the IP Address or fully qualified domain name of your Application VM.
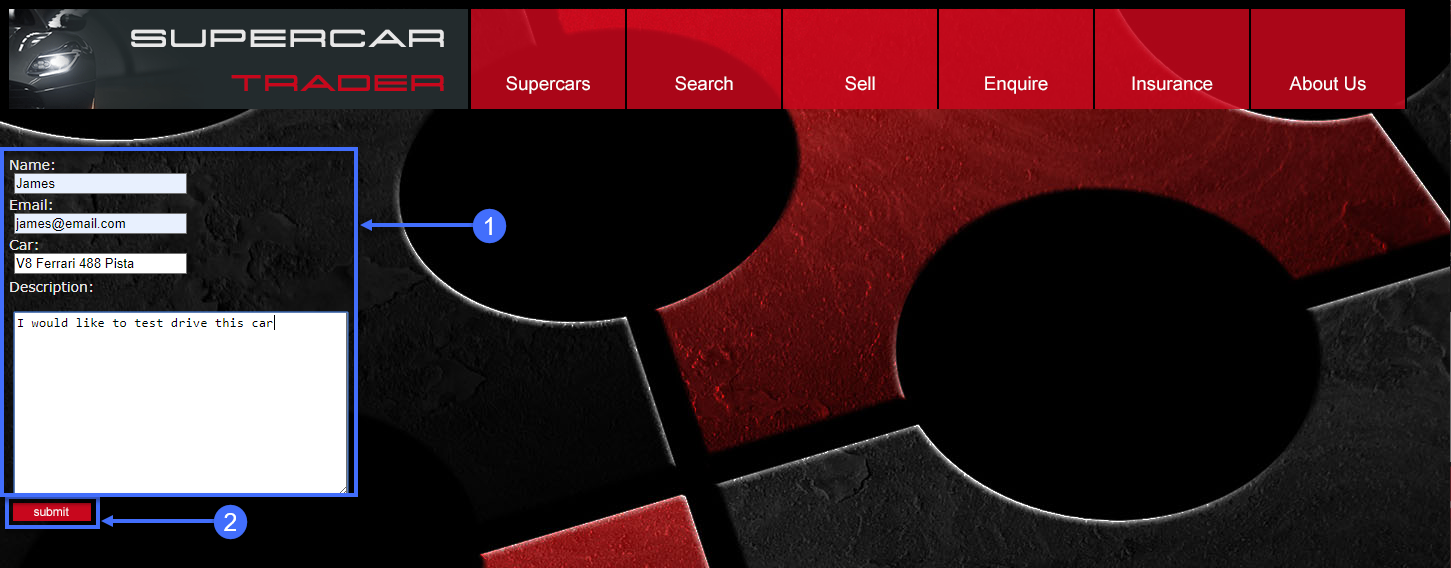
Complete the fields on the enquiry form with appropriate data.
Click Submit.
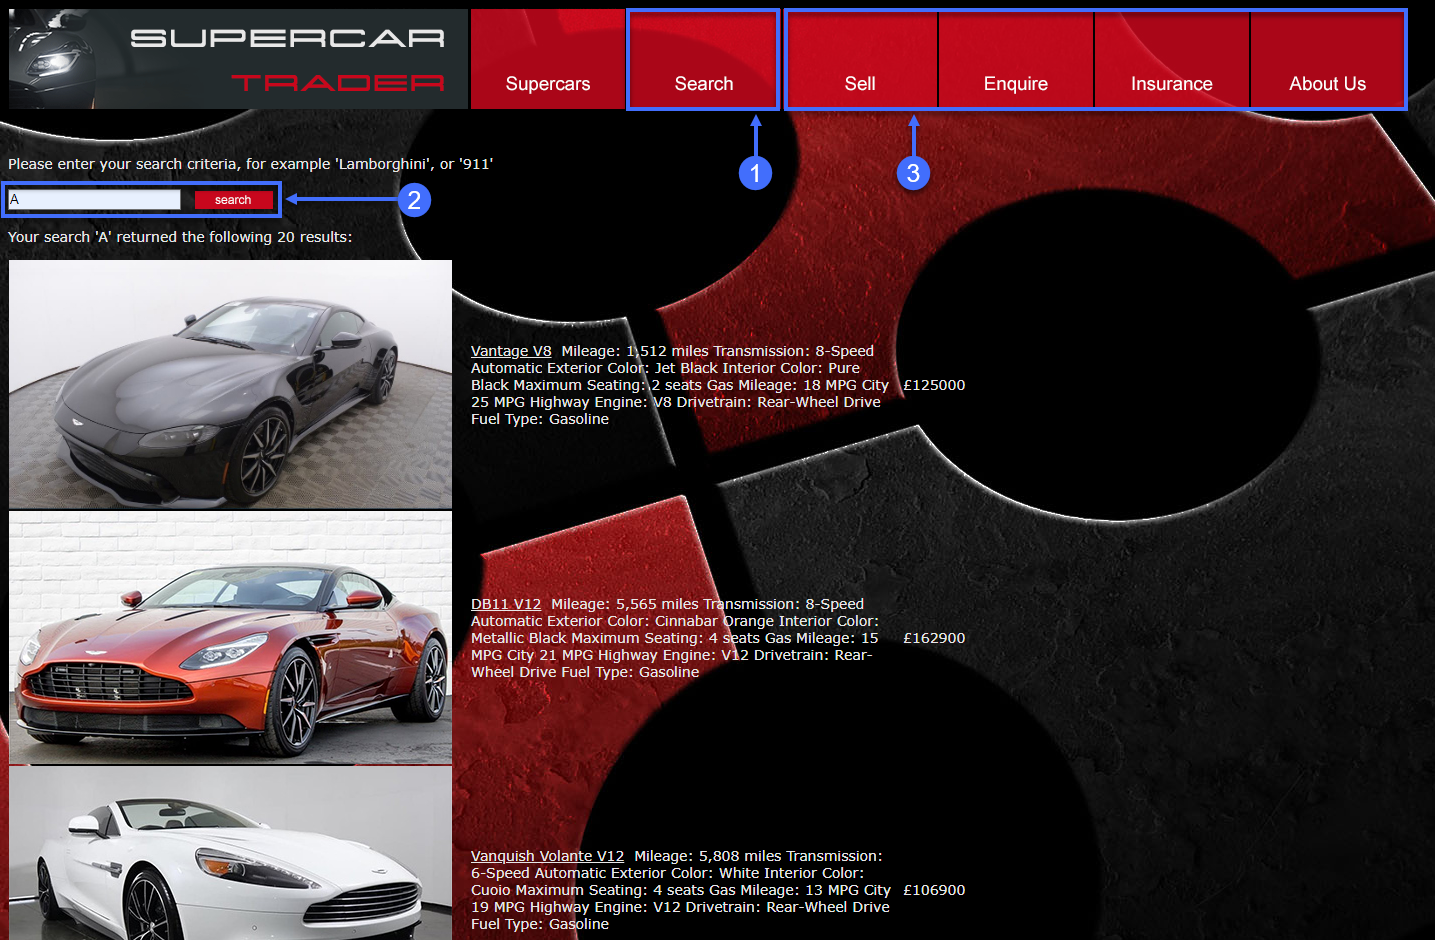
Search for cars and continue browsing the site.
Click on the Search tab on the top menu.
Type the letter A into the search box and click Search.
Click on the remaining tabs to explore the web site.
Monitor and Troubleshoot - Part 2
2 minutes
In this exercise you will complete the following tasks:
Review the Browser Session you created.
Review the Pages & AJAX Requests Dashboard.
Review the Dashboard for a specific Base Page.
Troubleshoot a Browser Snapshot.
Review the Browser Session you created
You can think of sessions as a time-based context to analyze a user’s experience interacting with an application. By examining browser sessions, you can understand how your applications are performing and how users are interacting with them. This enables you to better manage and improve your application, whether that means modifying the UI or optimizing performance on the server side.
Navigate to the Sessions dashboard and find the browser session that you created in the last exercise from navigating the pages of the web application. Follow these steps.
Note
You may need to wait ten minutes after you hit the last page in the web application to see your browser session show up in the sessions list. If you don’t see your session after ten minutes, this could be due to a problem with the Java Agent version in use.
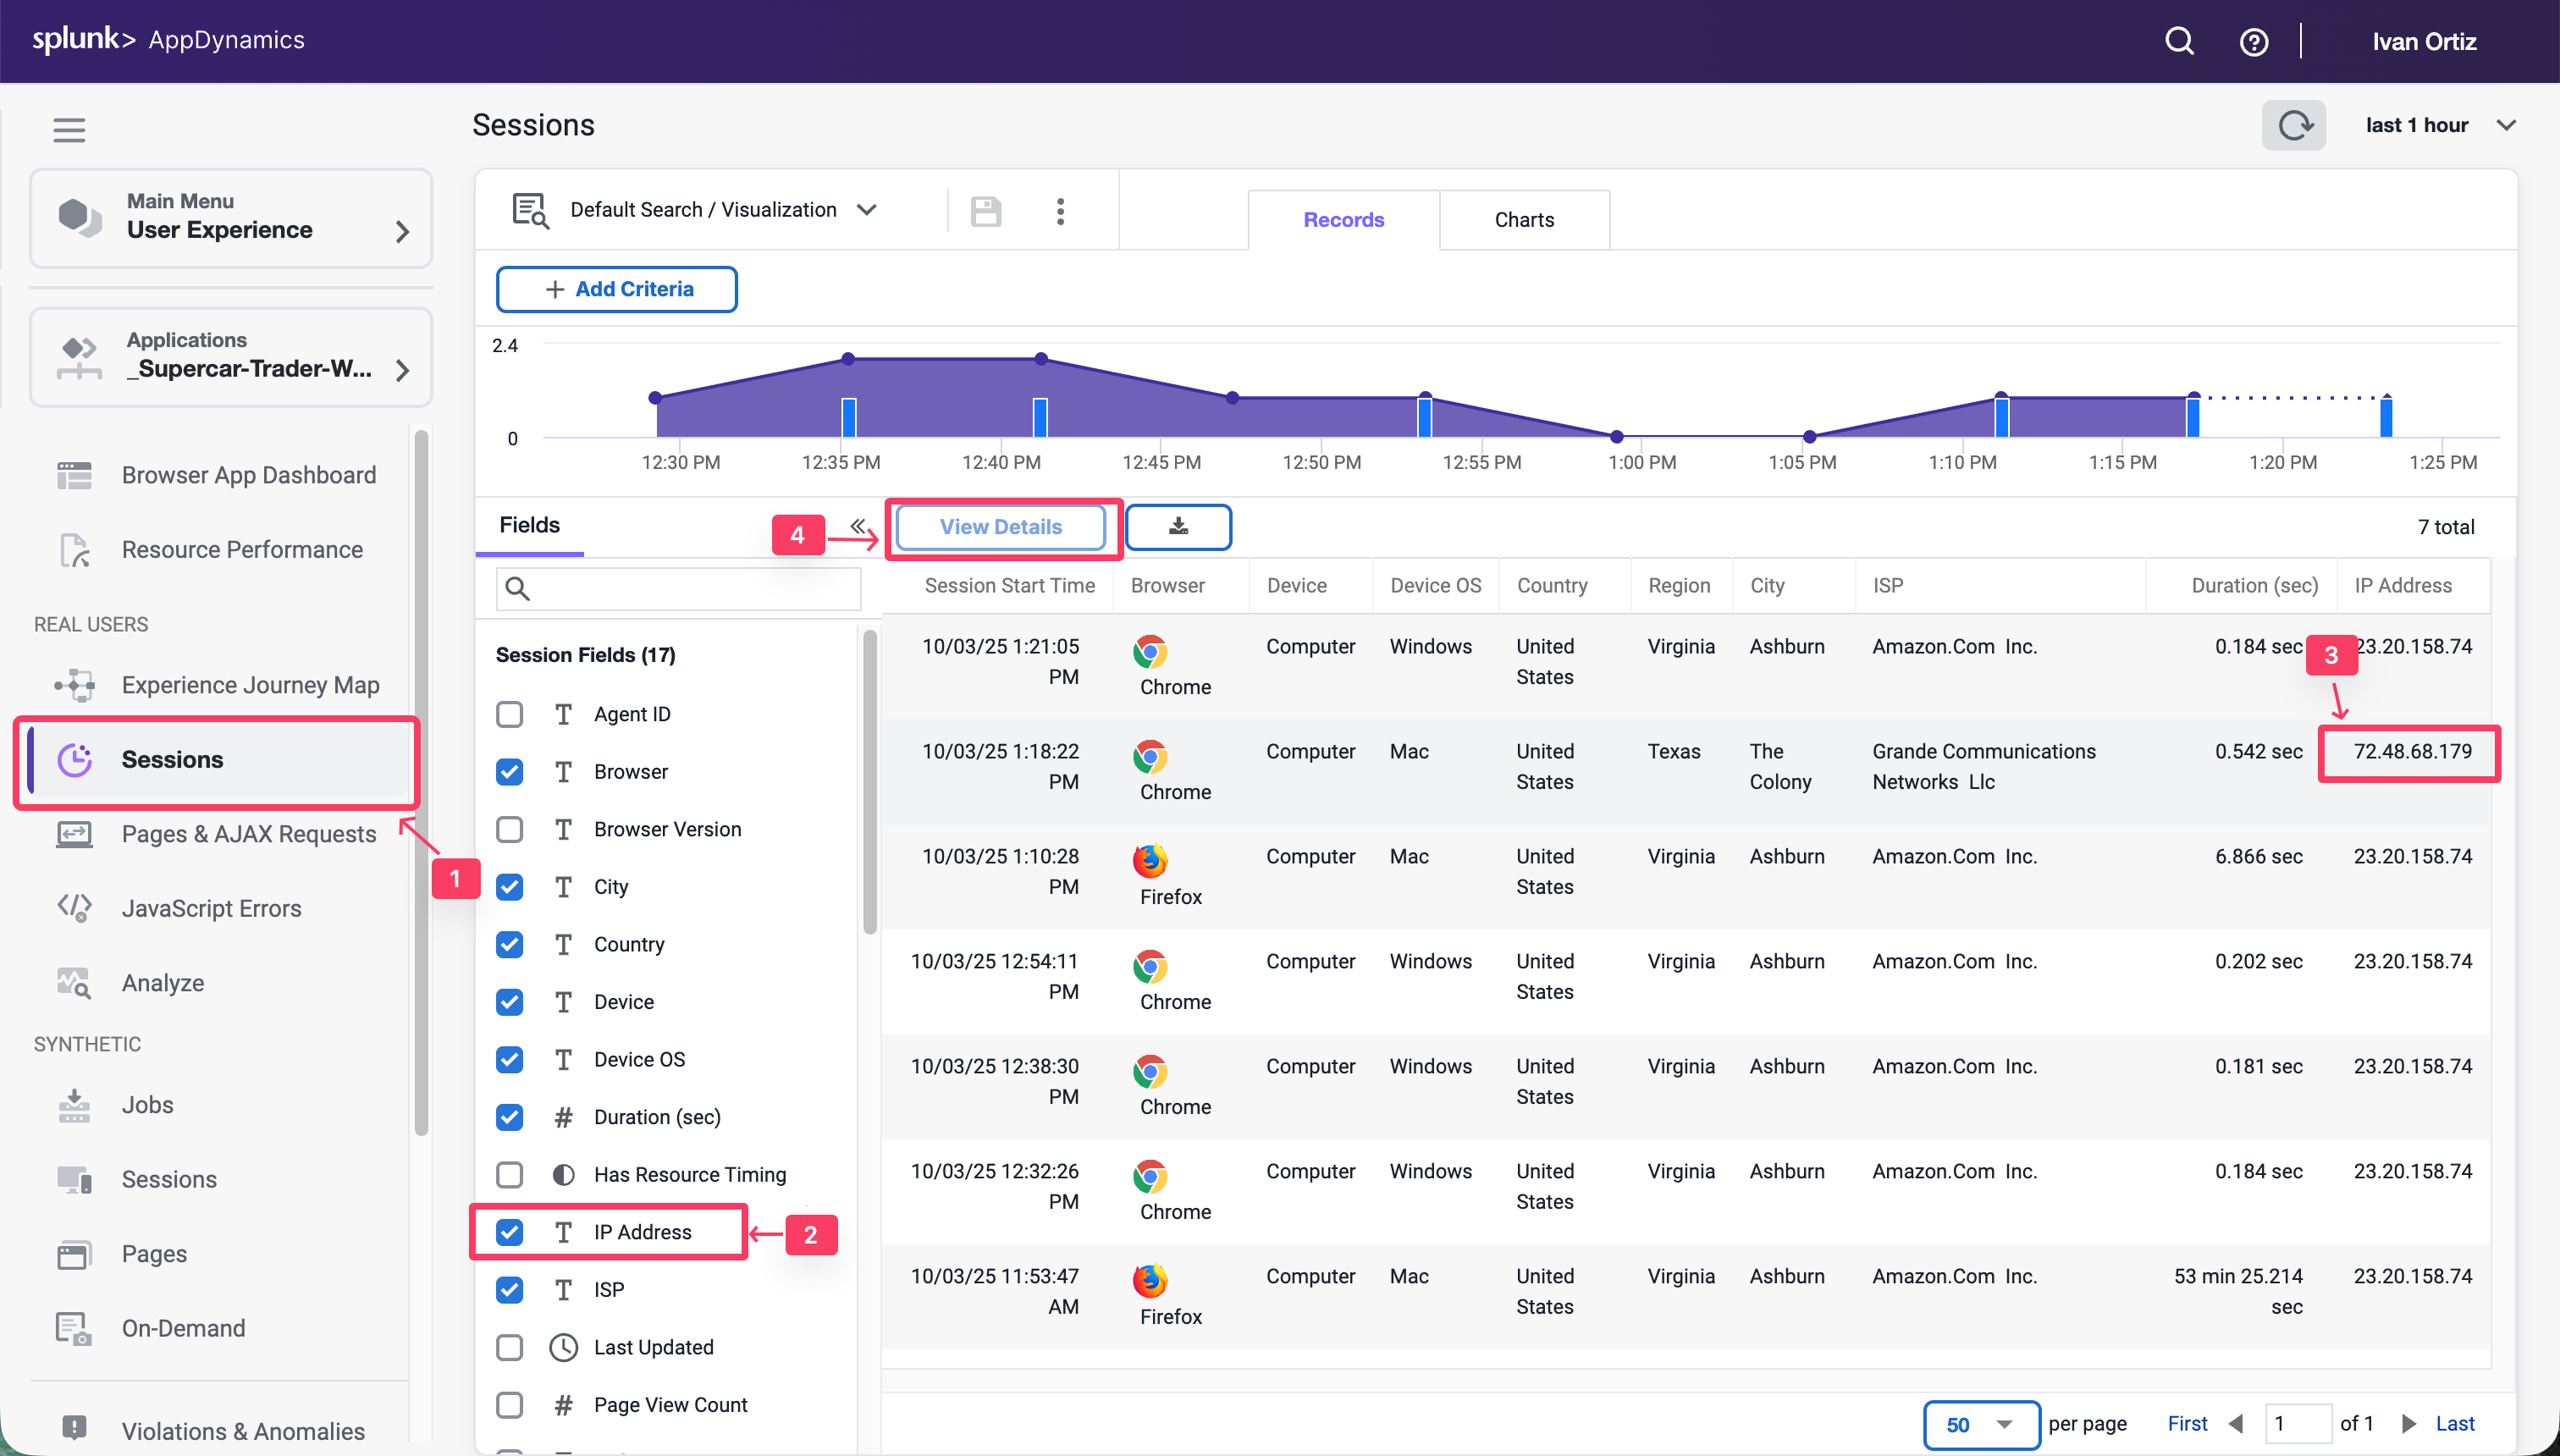
Click the Sessions tab on the left menu.
Check the IP Address in the Session Fields list.
Find the session you created by your IP Address.
Click on your session, then click View Details.
Once you find and open the session you created, follow these steps to explore the different features of the session view.
Note: Your session may not have a View Snapshot link in any of the pages (as seen in step five). You will find a session that has one to explore later in this exercise.
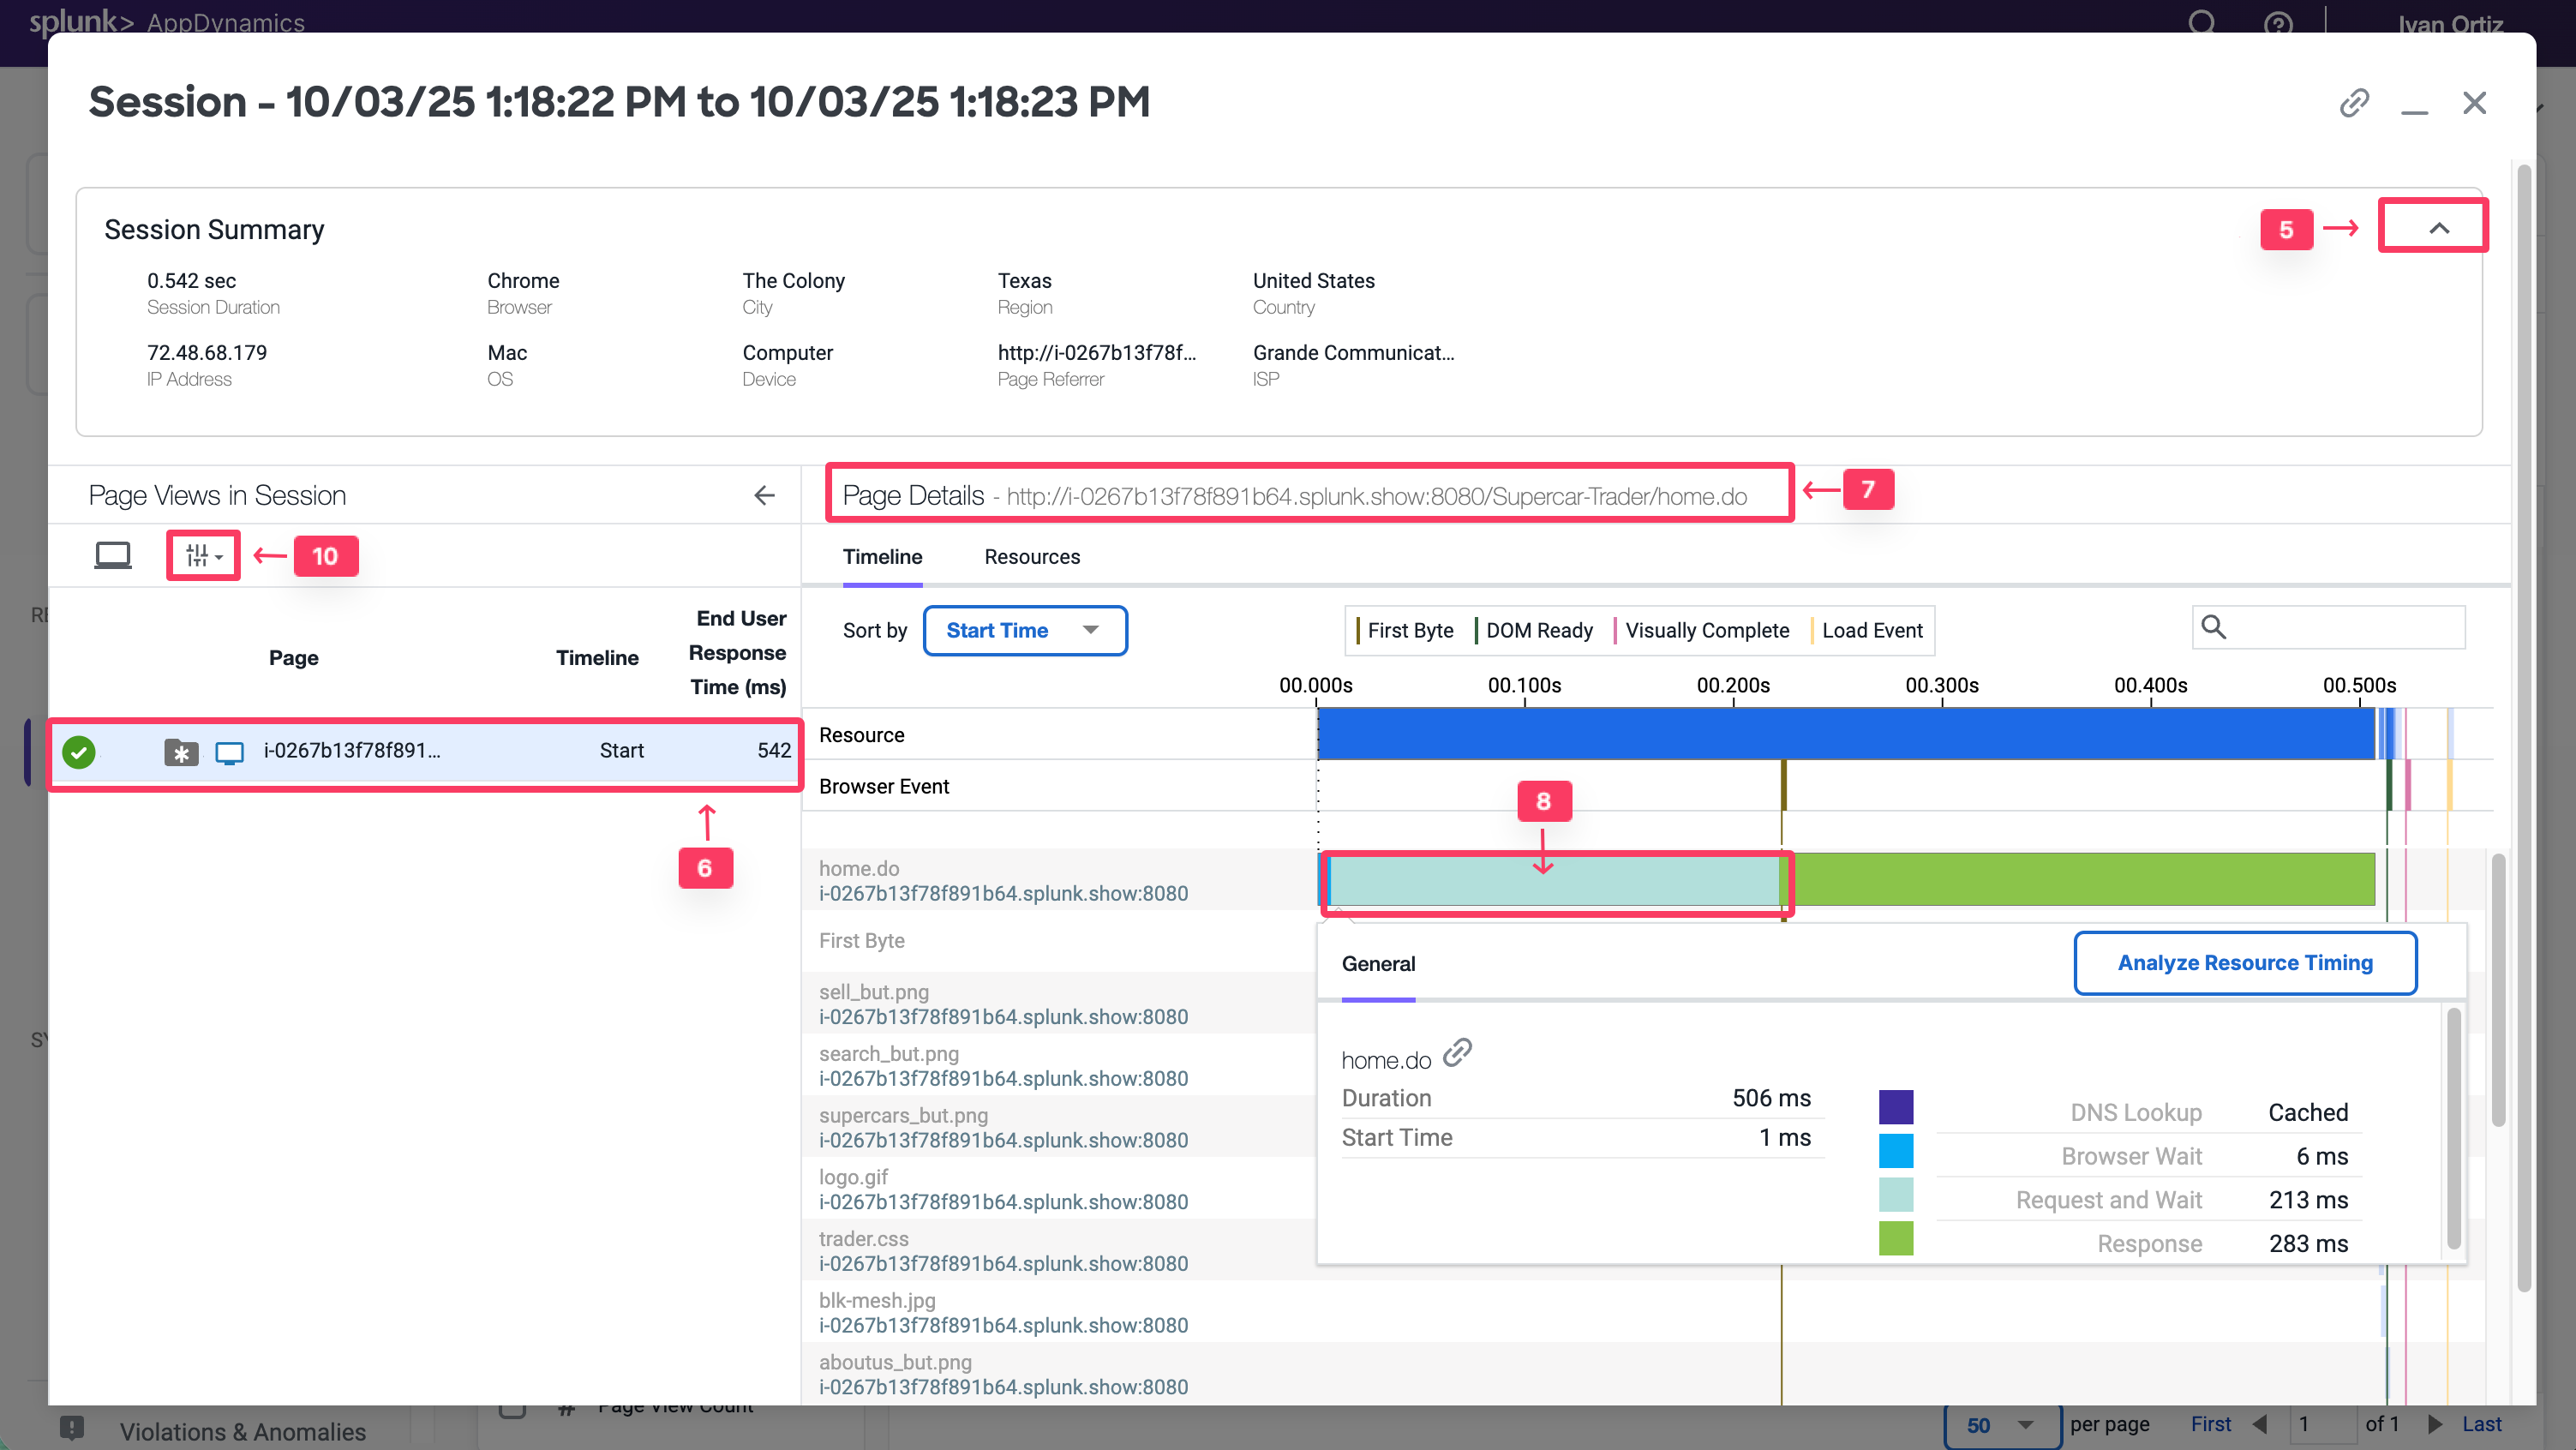
Click the Session Summary link to view the summary data.
When you click on a page listed on the left, you see the details of that page on the right.
You can always see the full name of the page you have selected in the left list.
Click on a horizontal blue bar in the waterfall view to show the details of that item.
Some pages may have a link to a correlated snapshot that was captured on the server side.
Click the configuration icon to change the columns shown in the pages list.
You can read more about the Browser RUM Sessions here.
Review the Pages & AJAX Requests Dashboard
Navigate to the Pages & AJAX Requests dashboard, review the options there, and open a specific Base Page dashboard by following these steps.
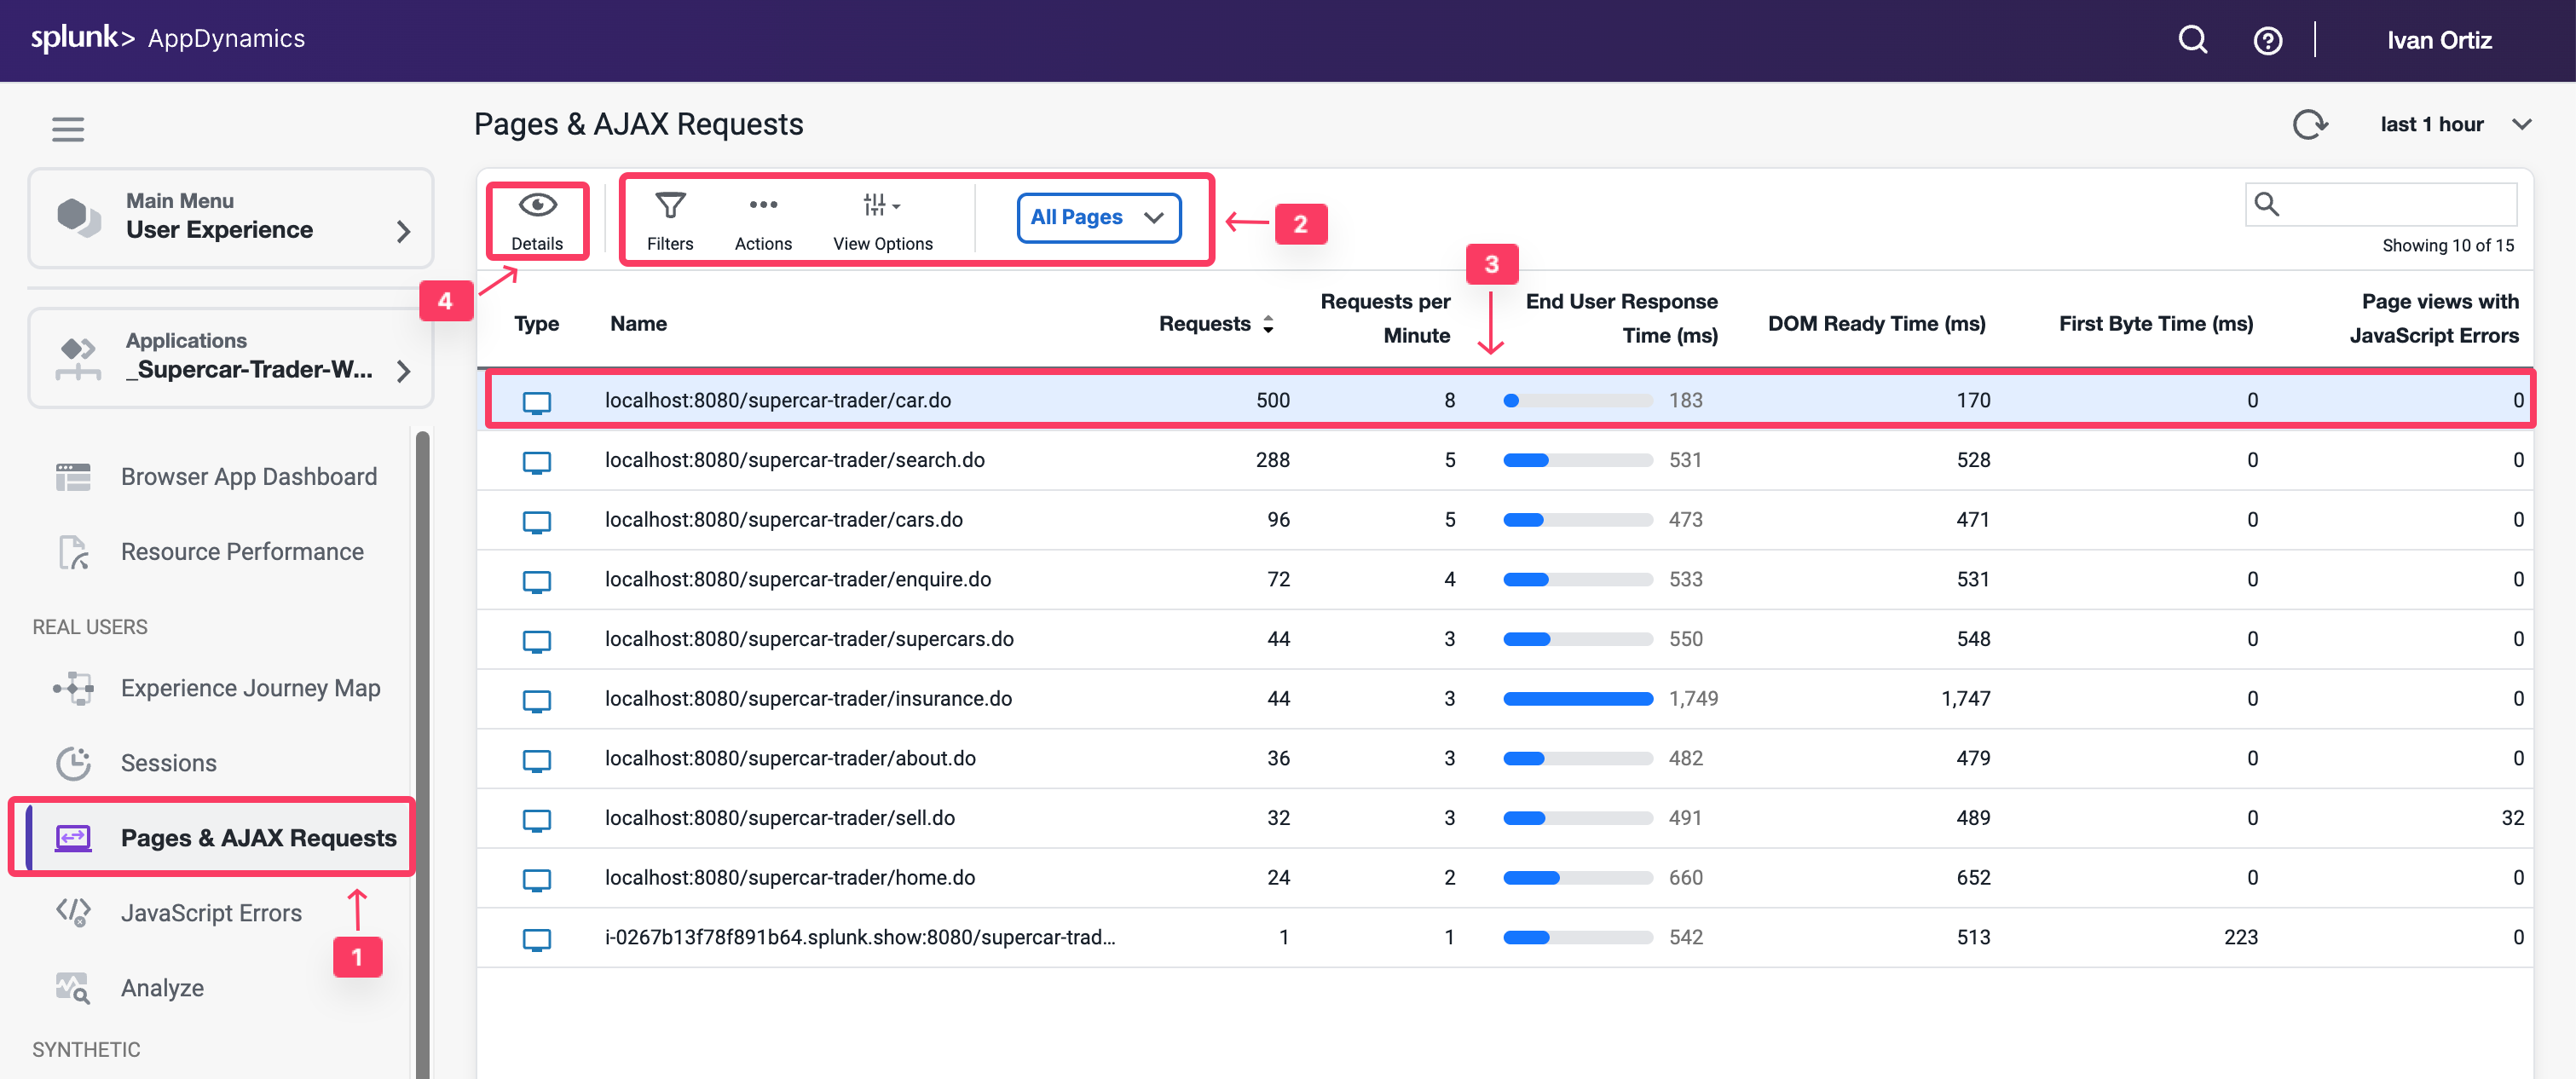
Click the Pages & AJAX Requests tab on the left menu.
Explore the options on the toolbar.
Click the localhost:8080/supercar-trader/car.do page.
Click Details to open the Base Page dashboard.
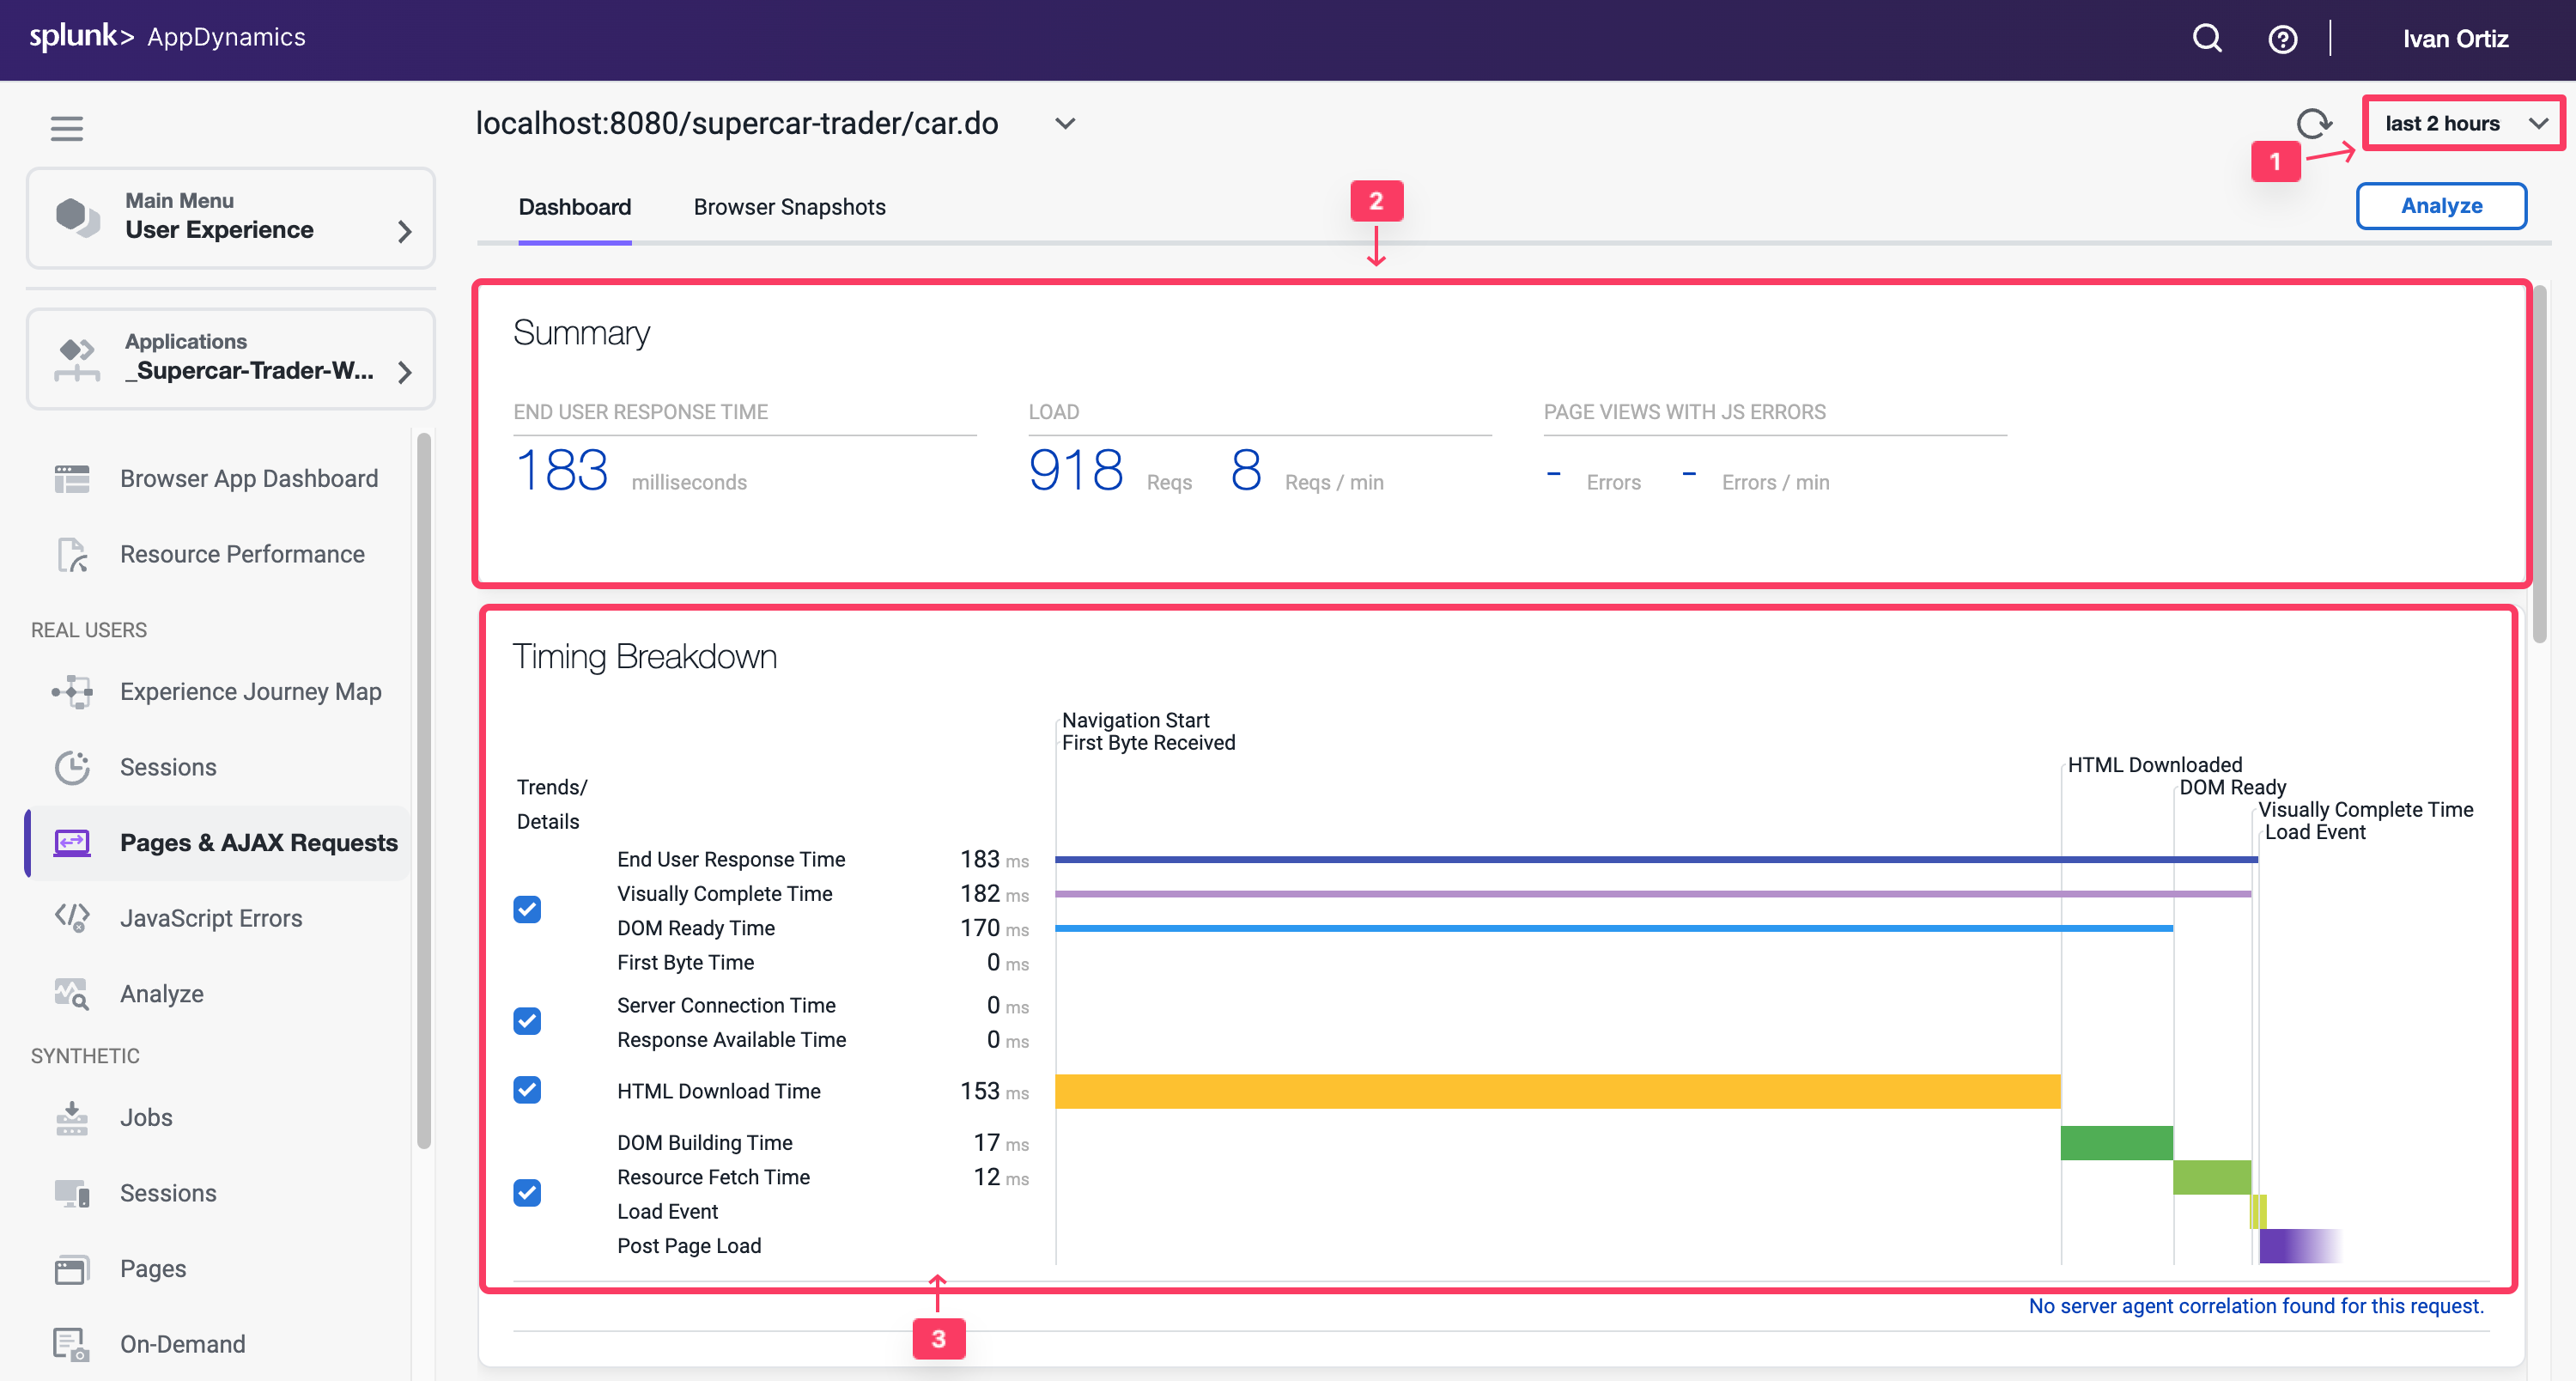
Review the Dashboard for a specific Base Page
At the top of the Base Page dashboard you will see key performance indicators, End User Response Time, Load, Cache Hits, and Page Views with JS errors across the period selected in the timeframe dropdown from the upper-right side of the Controller UI. Cache Hits indicates a resource fetched from a cache, such as a CDN, rather than from the source.
In the Timing Breakdown section you will see a waterfall graph that displays the average times needed for each aspect of the page load process. For more information on what each of the metrics measures, hover over its name on the left. A popup appears with a definition. For more detailed information, see Browser RUM Metrics.
Review the details for the localhost:8080/supercar-trader/car.do Base Page by following these steps.
Change the timeframe dropdown to last 2 hours.
Explore the key performance indicators.
Explore the metrics on the waterfall view.
Use the vertical scroll bar to move down the page.
Explore the graphs for all of the KPI Trends.
You can read more about the Base Page dashboard here.
Troubleshoot a Browser Snapshot
Note
Your application may not have any browser snapshots as such you will not be able to follow the entire workflow. You can switch to the browser application AD-Ecommerce-Browser if you would like to follow this section with a different demo application
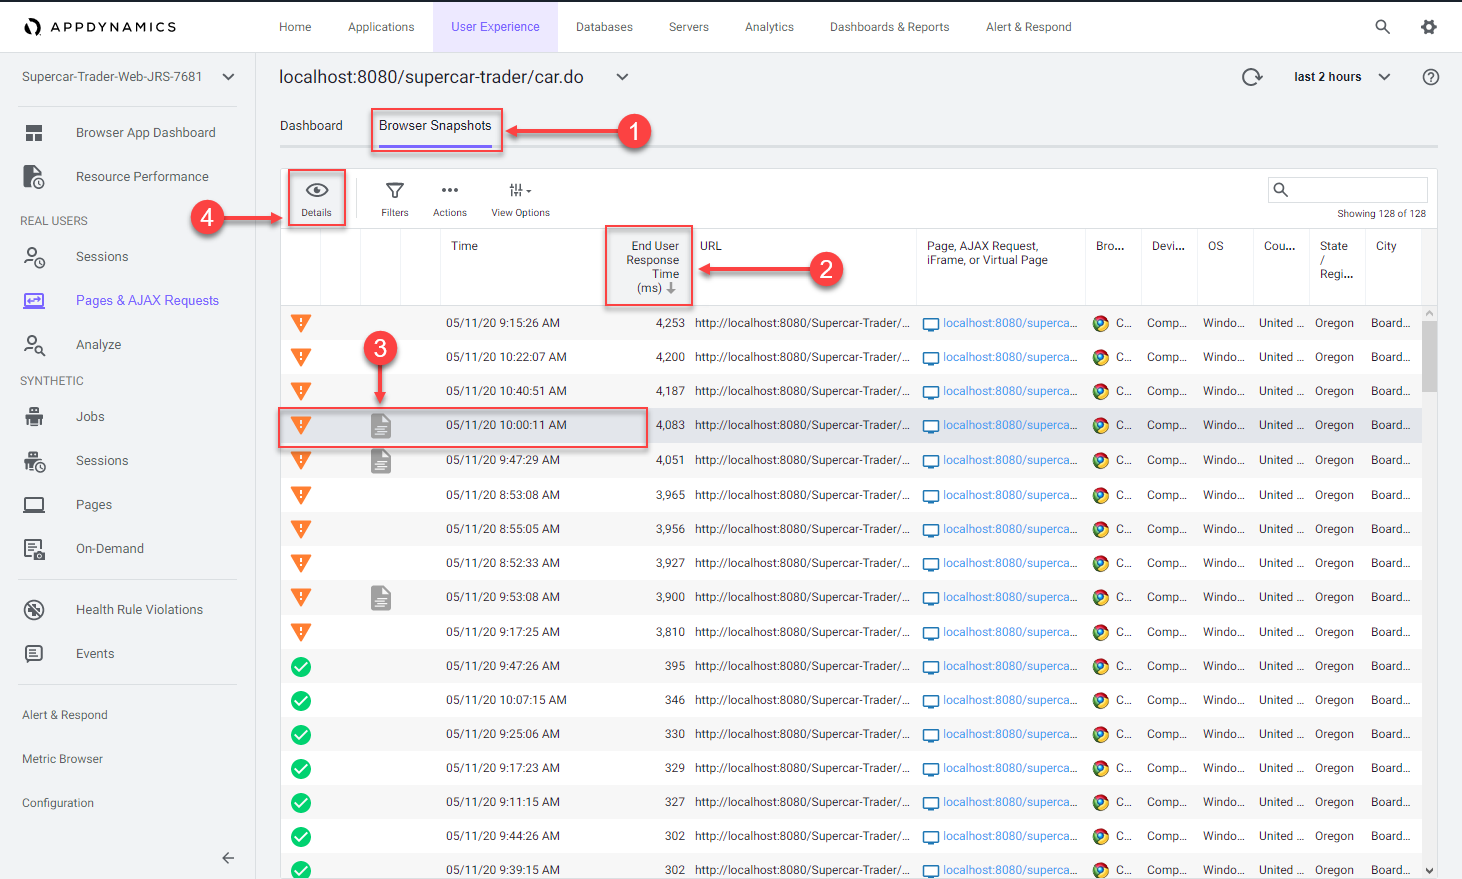
Navigate to the Browser Snapshots list dashboard and open a specific Browser Snapshot by following these steps.
Click the Browser Snapshots option.
Click the End User Response Time column header twice to show the largest response times at the top.
Click on a browser snapshot that has a gray or blue icon in the third column from the left.
Click Details to open the browser snapshot.
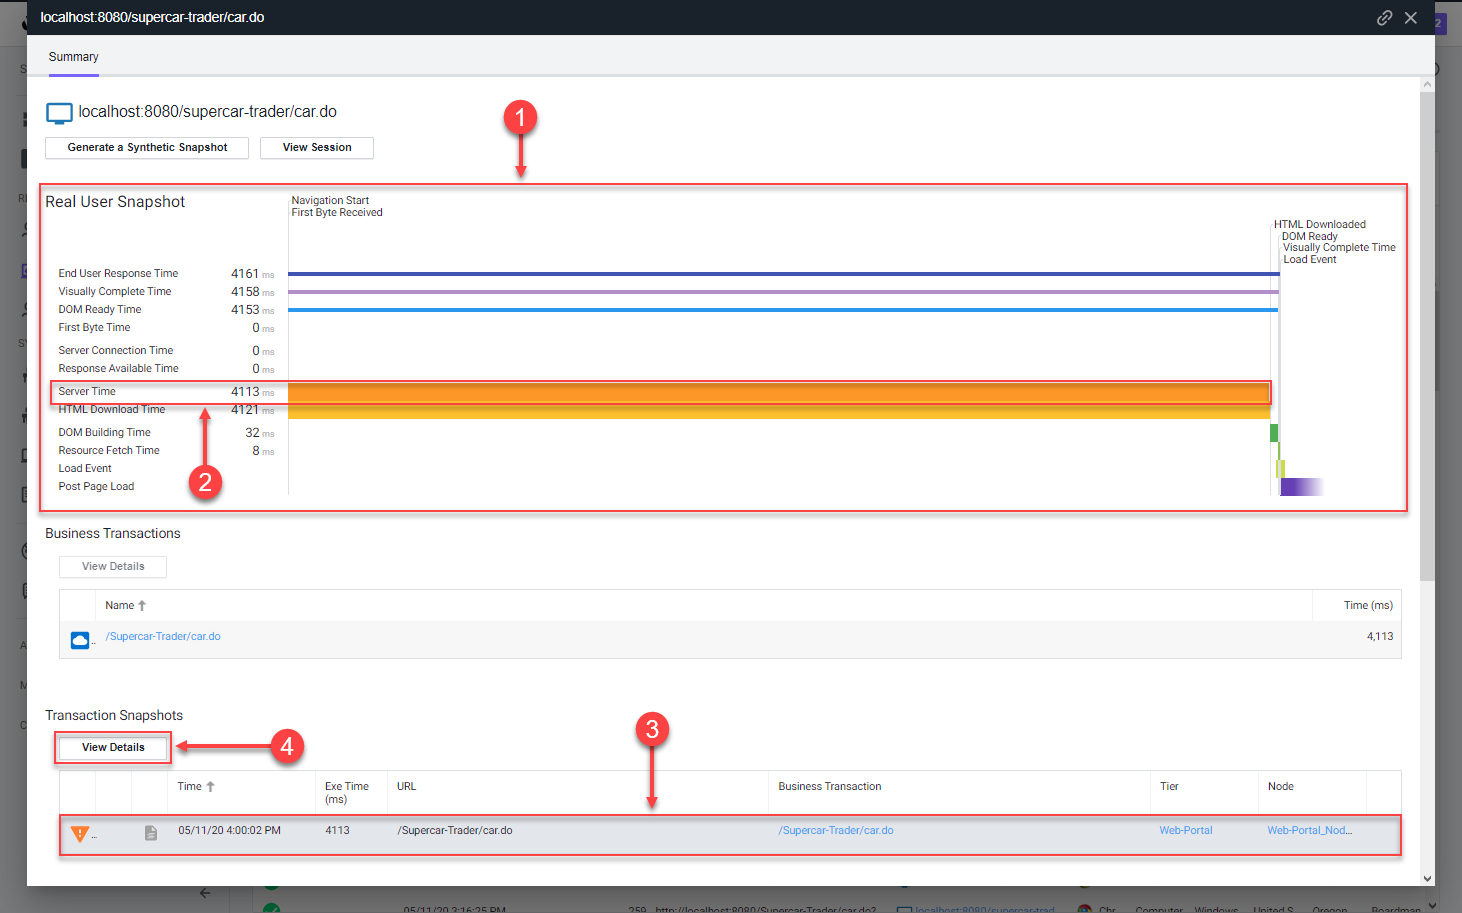
Once you open the browser snapshot, review the details and find root cause for the large response time by following these steps.
Review the waterfall view to understand where the response time was impacted.
Notice the extended Server Time metric. Hover over the label for Server Time to understand its meaning.
Click the server side transaction that was automatically captured and correlated to the browser snapshot.
Click View Details to open the associated server side snapshot.
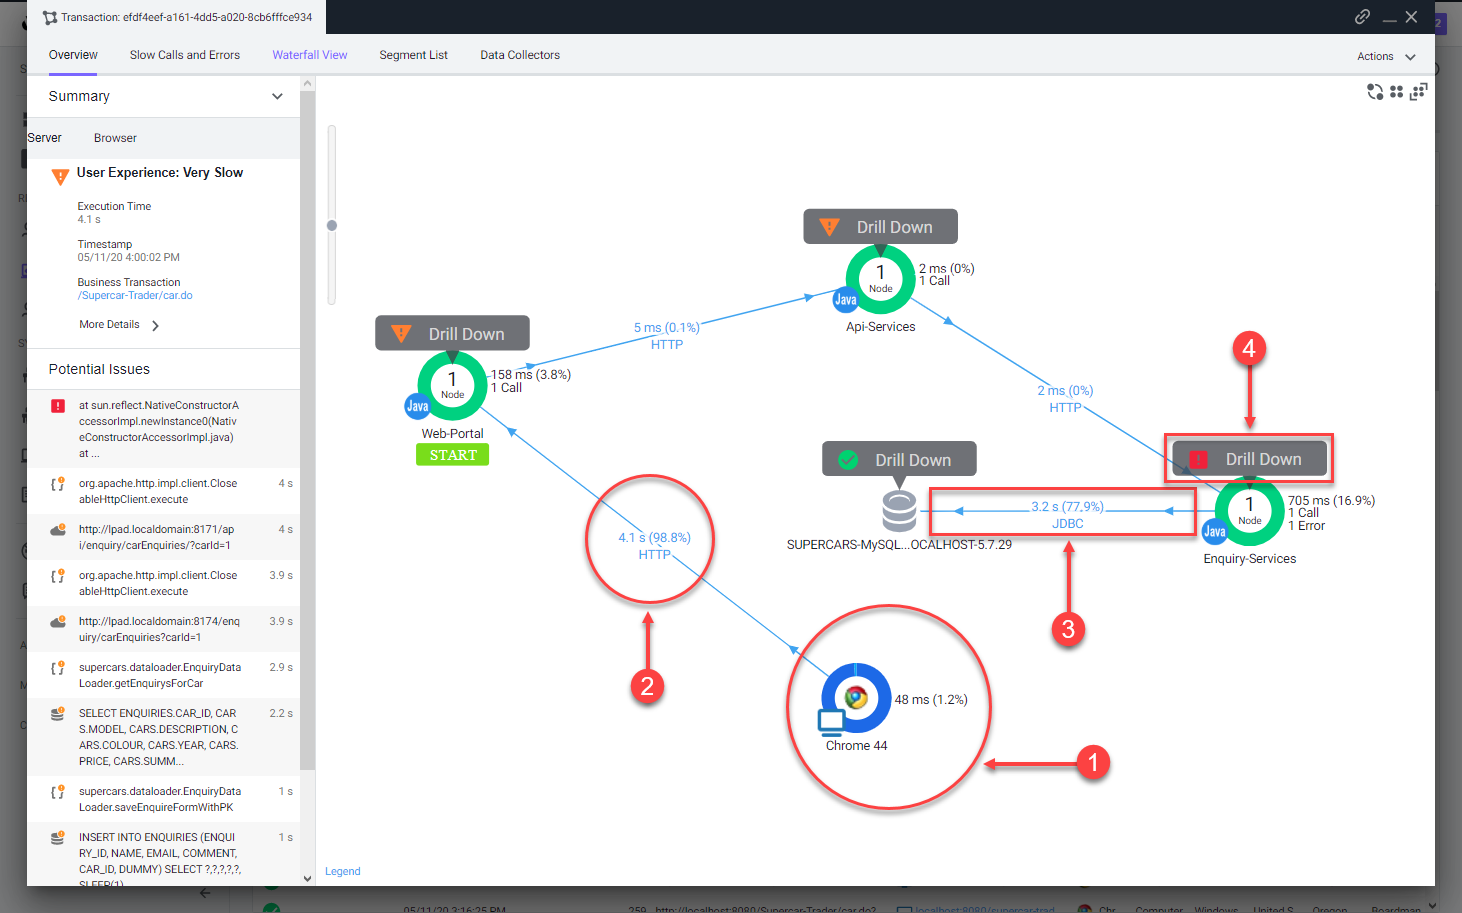
Once you open the correlated server side snapshot, use the steps below to pinpoint the root cause of the performance degredation.
You can see that the percentage of transaction time spent in the browser was minimal.
The timing between the browser and the Web-Portal Tier represents the initial connection from the browser until the full response was returned.
You will see that the JDBC call was taking the most time.
Click Drill Down to look at the code level view inside the Enquiry-Services Tier.
Once you open the snapshot segment for the Enquiry-Services Tier, you can see that there were JDBC calls to the database that caused issues with the transaction.
Click the JDBC link with the largest time to open the detail panel for the JDBC calls.
The detail panel for the JDBC exit calls shows the specific query that took most of the time.
You can see the full SQL statement along with the SQL parameter values
You can read more about the Browser Snapshots here and here.
Database Monitoring
2 minutes
Objectives
In this Lab you learn about AppDynamics Database Visibility Monitoring.
When you have completed this lab, you will be able to:
Download the AppDynamics Database Visibility Agent.
Install the AppDynamics Database Visibility Agent.
Configure a Database Collector in the Controller.
Monitor the health of your databases.
Troubleshoot database performance issues.
Workshop Environment
The lab environment has two hosts:
The first host runs the AppDynamics Controller and will be referred to from this point on as the Controller.
The second host runs the Supercar Trader application used in the labs. It will be the host where you will install the AppDynamics agents and will be referred to from this point on as the Application VM.
Verify you see the five different Tiers on the flow map.
Verify there has been consistent load over the last 1 hour.
Check the list of business transactions:
Click the Business Transactions option on the left menu.
Verify you see the eleven business transactions seen below.
Verify that they have some number of calls during the last hour.
Note: If you don’t see the Calls column, you can click the View Options toolbar button to show that column.
Check the agent status for the Nodes:
Click the Tiers & Nodes option on the left menu.
Click Grid View.
Verify that the App Agent Status for each Node is greater than 90% during the last hour.
Restart the Application and Load Generation if Needed
If any of the checks you performed in the previous steps could not be verified, SSH into your Application VM and follow these steps to restart the application and transaction load.
Use the following commands to stop the running instance of Apache Tomcat.
cd /usr/local/apache/apache-tomcat-9/bin
./shutdown.sh
Use the command below to check for remaining application JVMs still running.
ps -ef | grep Supercar-Trader
If you find any remaining application JVMs still running, kill the remaining JVMs using the command below.
sudo pkill -f Supercar-Trader
Use the following commands to stop the load generation for the application. Wait until all processes are stopped.
cd /opt/appdynamics/lab-artifacts/phantomjs
./stop_load.sh
Restart the Tomcat server:
cd /usr/local/apache/apache-tomcat-9/bin
./startup.sh
Wait for two minutes and use the following command to ensure Apache Tomcat is running on port 8080.
sudo netstat -tulpn | grep LISTEN
You should see output similar to the following image showing that port 8080 is in use by Apache Tomcat.
Use the following commands to start the load generation for the application.
cd /opt/appdynamics/lab-artifacts/phantomjs
./start_load.sh
You should see output similar to the following image.
Download Database Agent
2 minutes
In this exercise you will access your AppDynamics Controller from your web browser and download the Database Visibility agent from there.
Select the Home tab at the top left of the screen.
Select the Getting Started tab.
Click Getting Started Wizard.
Click Databases.
Download the Database Agent.
Select MySQL from the Select Database Type dropdown menu.
Accept the defaults for the Controller connection.
Click Click Here to Download.
Save the Database Visibility Agent file to your local file system.
Your browser should prompt you to save the agent file to your local file system, similar to the following image(depending on your OS).
Install Database Agent
2 minutes
The AppDynamics Database Agent is a standalone Java program that collects performance metrics about your database instances and database servers. You can deploy the Database Agent on any machine running Java 1.8 or higher. The machine must have network access to the AppDynamics Controller and the database instance that you want to be monitored.
A database agent running on a typical machine with 16 GB of memory can monitor about 25 databases. On larger machines, a database agent can monitor up to 200 databases.
In this exercise you will perform the following tasks:
Upload the Database Visibility agent file to your Application VM
Unzip the file into a specific directory on the file system
Start the Database Visibility agent
Upload Database Agent to The Application VM
By this point you should have received the information regarding the EC2 instance that you will be using for this workshop. Ensure you have the IP address of your EC2 instance, username and password required to ssh into the instance .
On your local machine, open a terminal window and change into the directory where the database agent file was downloaded to. Upload the file into the EC2 instance using the following command. This may take some time to complete. If you are in a Windows OS, you may have to use a programm such as WinSCP.
Update the IP address or public DNS for your instance.
Update the filename to match your exact version.
cd ~/Downloads
scp -P 2222 db-agent-*.zip splunk@i-0267b13f78f891b64.splunk.show:/home/splunk
Create the directory structure where you will unzip the Database agent zip file.
cd /opt/appdynamics
mkdir dbagent
Use the following commands to copy the Database agent zip file to the directory and unzip the file. The name of your Database agent file may be slightly different than the example below.
cp ~/db-agent-*.zip /opt/appdynamics/dbagent/
cd /opt/appdynamics/dbagent
unzip db-agent-*.zip
Start the Database Visibility agent
Use the following commands to start the Database agent and verify that it started.
Append your inititals to the db agent name, this will be used in the following section. example: DBMon-Lab-Agent-IO
You should see output similar to the following image.
Configure Database Collector
2 minutes
Configure Database Collector
The Database Agent Collector is the process that runs within the Database Agent to collect performance metrics about your database instances and database servers. One collector collects metrics for one database instance. Multiple collectors can run in one Database Agent. Once the Database Agent is connected to the Controller one or more collectors can be configured in the Controller.
In this exercise you will perform the following tasks:
Access your AppDynamics Controller from your web browser
Use the following steps to change the settings for the query literals and navigate to the collectors configuration.
Click the Databases tab on the left menu.
Click the Configuration tab on the bottom left.
Uncheck the checkbox for Remove literals from the queries.
Click the Collectors option.
Use the following steps to configure a new Database collector.
Click Add button.
Select MySQL for the database type.
Select DBMon-Lab-Agent for the database agent and enter the following parameters.
Collector Name: Supercar-MySQL-YOURINITIALS
Hostname or IP Address: localhost
Listener Port: 3306
Username: root
Password: Welcome1!
Select the Monitor Operating System checkbox under the Advanced Options
Select Linux as the operating system and enter the following parameters.
SSH Port: 22
Username: splunk
Password: Password Provided by Your Instructor to SSH into the EC2 Instance
Click OK to save the collector.
Confirm that the Database Collector is collecting data
Wait for ten minutes to allow the collector to run and submit data, then follow these steps to verify that the database collector is connecting to the database and collecting database metrics.
Click the Databases tab on the left menu
Search for the Collector created in the previous section: Supercar-MySQL-YOURINITIALS
Ensure the status is green and there are no errors shown.
Click the Supercar-MySQL link to drill into the database.
Note: It may take up to 18 minutes from the time you configure your collector to see the Top 10 SQL Wait States and any queries on the Queries tab.
You can read more about configuring Database Collectors here
Monitor and Troubleshoot - Part 1
2 minutes
Monitor and Troubleshoot - Part 1
In this exercise you will perform the following tasks:
Review the Overall Database and Server Performance Dashboard
Review the Main Database Dashboard
Review the Reports in the Database Activity Window
Review the Overall Database and Server Performance Dashboard
The Overall Database and Server Performance Dashboard allows you to quickly see the health of each database at a glance.
Filters: Enables you to explore the options to filter by health, load, time in database or type.
Actions: Exports the data on this window in a .csv formatted file.
View Options: Toggles the spark charts on and off.
View: Switches between the card and list view.
Sort: Displays the sorting options.
Supercar-MySQL: Drills into the main database dashboard.
Review the Main Database Dashboard
The main database dashboard shows you key insights for the database including:
The health of the server that is running the database.
The total number of calls during the specified time period.
The number of calls for any point in time.
The total time spent executing SQL statements during the specified time period.
The top ten query wait states.
The average number of connections.
The database type or vendor.
Explore the features of the dashboard.
Click the health status circle to see details of the server health:
Green: server is healthy.
Yellow: server with warning-level violations.
Red: server with critical-level violations.
The database type or vendor will always be seen here.
Observe the total time spent executing SQL statements during the specified time period.
Observe the total number of executions during the specified time period.
Hover over the time series on the chart to see the detail of the recorded metrics.
Click the orange circle at the top of the data point to view the time comparison report, which shows query run times and wait states 15 minutes before and 15 minutes after the selected time.
Left-click and hold down your mouse button while dragging from left to right to highlight a spike seen in the chart.
Click the configuration button to exclude unwanted wait states from the top ten.
Hover over the labels for each wait state to see a more detailed description.
Observe the average number of active connections actively running a query during the selected time period.
To view the OS metrics of the DB server for the time period that you have selected:
Scroll to the bottom of the dashboard using the scroll bar on the right
CPU
Memory
Disk IO
Network IO
Review the Reports in the Database Activity Window
There are up to nine different reports available in Database Visibility on the Database Activity Window. The reports available depend on the database platform being monitored. In this exercise we will review three of the most common reports.
Wait State Report
Top Activity Report
Query Wait State Report
Wait State Report
This report displays time-series data on Wait Events (states) within the database. Each distinct wait is color-coded, and the Y-axis displays time in seconds. This report also displays data in a table and highlights the time spent in each wait state for each SQL statement.
The wait states consuming the most time may point to performance bottlenecks. For example, db file sequential reads may be caused by segment header contention on indexes or by disk contention.
Top Activity Report
This report displays the top time in database SQL statements in a time-series view. This report also displays data in a table and highlights the time spent in the database for each of 10 top SQL statements.
Use this report to see which SQL statements are using the most database time. This helps to determine the impact of specific SQL statements on overall system performance allowing you to focus your tuning efforts on the statements that have the most impact on database performance.
Query Wait State Report
This report displays the wait times for the top (10, 50, 100, 200) queries. This report also displays data in a table and highlights the time each query is spending in different wait states. Use the columns to sort the queries by the different wait states.
You can read more about the Reports in the Database Activity Window here
Monitor and Troubleshoot - Part 2
Review the Queries Dashboard
The Queries window displays the SQL statements and stored procedures that consume the most time in the database. You can compare the query weights to other metrics such as SQL wait times to determine SQL that requires tuning.
Queries tab: Displays the queries window.
Top Queries dropdown: Displays the top 5, 10, 100 or 200 queries.
Filter by Wait States: Enables you to choose wait states to filter the Query list.
Group Similar: Groups together queries with the same syntax.
Click on the query that shows the largest Weight (%) used.
View Query Details: Drills into the query details.
Review the details of an expensive query
Once you have identified the statements on the Database Queries window that are spending the most amount of time in the database, you can dig down deeper for details that can help you tune those SQL statements. The database instance Query Details window displays details about the query selected on the Database Queries window.
Resource consumption over time: Displays the amount of time the query spent in the database using resources, the number of executions, and the amount of CPU time consumed.
Wait states: The activities that contribute to the time it takes the database to service the selected SQL statement. The wait states consuming the most time may point to performance bottlenecks.
Components Executing Similar Queries: Displays the Nodes that execute queries similar to this query.
Business Transactions Executing Similar Queries: Displays the Java business transactions that execute queries similar to this query.
Use the outer scroll bar on the right to scroll down.
Clients: Displays the machines that executed the selected SQL statement and the percentage of the total time required to execute the statement performed by each machine.
Sessions: Session of each database instance usage
Query Active in Database: Displays the schemas that have been accessed by this SQL.
Users: Displays the users that executed this query.
Query Hashcode: Displays the unique ID for the query that allows the database server to more quickly locate this SQL statement in the cache.
Query: Displays the entire syntax of the selected SQL statement. You can click the pencil icon in the top right corner of the Query card to edit the query name so that it is easy to identify.
Execution Plan: Displays the the query execution plan window.
Troubleshoot an expensive query
The Database Query Execution Plan window can help you to determine the most efficient execution plan for your queries. Once you’ve discovered a potentially problematic query, you can run the EXPLAIN PLAN statement to check the execution plan that the database created.
A query’s execution plan reveals whether the query is optimizing its use of indexes and executing efficiently. This information is useful for troubleshooting queries that are executing slowly.
Click on the Execution Plan tab
Notice that the join type in the Type column is ALL for each table.
Hover over one of the join types to see the description for the join type.
Examine the entries in the Extras column.
Hover over each of the entries to see the description for the entry.
Let’s investigate the indexes on the table using the Obect Browser next.
Click on the Object Browser option to view details of the schema for the tables
Click the Database option.
Click on the supercars schema to expand the list of tables.
Click on the CARS table to see the details of the table.
You can see that the CAR_ID column is defined as the primary key
Use the outer scroll bar to scroll down the page.
Notice the primary key index defined in the table.
Click on the MANUFACTURER table to view its details.
Notice the MANUFACTURER_ID column is not defined as a primary key.
Scroll down the page to see there are no indexes defined for the table.
The MANUFACTURER_ID column needs an index created for it to improve the performance of any queries on the table. If you analyzed a different query the underlying issue may be different but the most common issues shown in this lab come because the queries are either executing a join with the MANUFACTURER table or querying that table directly.
SmartAgent Deployment
2 minutes
Introduction
AppDynamics Smart Agent is a lightweight, intelligent agent that provides comprehensive monitoring capabilities for your infrastructure. This section covers four different deployment approaches, allowing you to choose the method that best fits your organization’s needs and existing tooling.
What is Smart Agent?
Smart Agent is AppDynamics’ next-generation monitoring agent that provides:
Unified Monitoring: Single agent for infrastructure, applications, and services
Lightweight Design: Minimal resource footprint
Auto-Discovery: Automatically discovers and monitors applications
Native Instrumentation: Deep visibility into application performance
Flexible Deployment: Multiple installation and management options
Deployment Approaches
This section covers four distinct approaches to deploying Smart Agent at scale:
1. Remote Installation (smartagentctl)
The most direct approach using the smartagentctl CLI tool to deploy via SSH.
Best for:
Quick deployments to a moderate number of hosts
Environments without existing CI/CD infrastructure
Testing and proof-of-concept scenarios
Direct control over deployment process
Key Features:
Direct SSH-based deployment
Simple YAML configuration
No additional tooling required
Concurrent execution support
2. Jenkins Automation
Enterprise-grade deployment using Jenkins pipelines for complete lifecycle management.
Best for:
Organizations already using Jenkins
Complex deployment workflows
Environments requiring approval gates
Integration with existing CI/CD pipelines
Key Features:
Parameterized pipelines
Batch processing for thousands of hosts
Complete lifecycle management
Centralized logging and reporting
3. GitHub Actions Automation
Modern CI/CD approach using GitHub Actions workflows with self-hosted runners.
Best for:
Teams using GitHub for version control
Cloud-native environments
GitOps workflows
Distributed teams preferring web-based management
Key Features:
11 specialized workflows
Self-hosted runner in your VPC
GitHub secrets integration
Automatic batching for scalability
4. Ansible Automation
Configuration management approach using Ansible playbooks for infrastructure as code.
Best for:
Teams using Ansible for configuration management
Declarative infrastructure definition
Consistent state management across fleets
Key Features:
Infrastructure as Code (IaC)
Idempotent playbooks
Inventory management
Role-based organization
Choosing the Right Approach
Factor
Remote Installation
Jenkins
GitHub Actions
Ansible
Setup Complexity
Low
Medium
Medium
Low
Scalability
Good (100s of hosts)
Excellent (1000s)
Excellent (1000s)
Excellent (1000s)
Prerequisites
SSH access only
Jenkins server
GitHub account
Ansible Control Node
Learning Curve
Minimal
Moderate
Moderate
Low/Moderate
Automation Level
Manual execution
Full automation
Full automation
Full automation
Best Use Case
Quick deployments
Enterprise CI/CD
Modern DevOps
Infrastructure as Code
Common Features Across All Approaches
Regardless of which deployment method you choose, all approaches provide:
Ansible Automation - Infrastructure as Code deployment
You can follow one or all approaches depending on your needs.
Tip
If you’re new to Smart Agent deployment, we recommend starting with the Remote Installation approach to understand the basics before moving to more automated solutions.
Prerequisites
Before proceeding with any deployment approach, ensure you have:
AppDynamics account with controller access
Account name and access key
Target hosts with SSH access
Network connectivity from hosts to AppDynamics Controller
Appropriate permissions on target hosts
Next Steps
Choose your preferred deployment approach and proceed to that section:
Start Simple: Begin with Remote Installation to learn the fundamentals
Scale with Jenkins: Move to Jenkins for enterprise-grade automation
Modernize with GitHub: Adopt GitHub Actions for cloud-native workflows
Automate with Ansible: Use Ansible for declarative configuration management
Each section provides complete, hands-on guidance for deploying Smart Agent at scale!
Subsections of SmartAgent Deployment
Remote Installation
2 minutes
Introduction
This workshop demonstrates how to use the smartagentctl command-line tool to install and manage AppDynamics Smart Agent on multiple remote hosts simultaneously. This approach is ideal for quickly deploying Smart Agent to a fleet of servers using SSH-based remote execution, without the need for additional automation tools like Jenkins or GitHub Actions.
What You’ll Learn
In this workshop, you’ll learn how to:
Configure remote hosts using the remote.yaml file
Configure Smart Agent settings using config.ini
Deploy Smart Agent to multiple hosts simultaneously via SSH
Start and stop agents remotely across your infrastructure
Check agent status on all remote hosts
Troubleshoot common installation and connectivity issues
Key Features
🚀 Direct SSH Deployment - No additional automation platform required
Verify that remote hosts can reach each other and the internet:
ping <remote-host-ip>
Verify Sudo Access
Ensure you have sudo privileges:
sudo -v
If all prerequisites are met, you’re ready to proceed with configuration!
2. Configuration
Smart Agent remote installation requires two key configuration files: config.ini for Smart Agent settings and remote.yaml for defining remote hosts and connection parameters.
Configuration Files Overview
Both configuration files should be located in the Smart Agent installation directory:
cd /home/ubuntu/appdsm
The two files you’ll configure:
config.ini - Smart Agent configuration deployed to all remote hosts
remote.yaml - Remote hosts and SSH connection settings
config.ini - Smart Agent Configuration
The config.ini file contains the main Smart Agent configuration that will be deployed to all remote hosts.
Review AppDynamics Documentation: Visit the AppDynamics documentation portal
Check Log Files: Always review both control node and remote host logs
Test Components Individually:
Test SSH connectivity separately
Test agent startup on a single host manually
Verify controller connectivity independently
Collect Diagnostic Information:
Control node logs
Remote host logs
Configuration files (with sensitive data redacted)
Error messages and stack traces
Common Error Messages
Error Message
Cause
Solution
“Permission denied (publickey)”
SSH key authentication failure
Verify SSH key path and permissions
“Connection refused”
SSH port not accessible
Check firewall rules and SSH daemon
“No such file or directory”
Missing configuration file
Verify config files exist and paths are correct
“YAML parse error”
Invalid YAML syntax
Validate YAML syntax with parser
“Controller unreachable”
Network connectivity issue
Test controller connectivity from remote host
“Invalid credentials”
Wrong account key or name
Verify AppDynamics credentials
Best Practices for Troubleshooting
Always use –verbose flag: Provides detailed output for debugging
Test with a single host first: Deploy to one host before scaling
Check logs immediately: Review logs right after deployment
Verify prerequisites: Ensure all requirements are met before deploying
Test connectivity separately: Verify SSH and network connectivity independently
Use manual commands: Test manual SSH and agent startup to isolate issues
Tip
When troubleshooting, start with the simplest tests first (e.g., ping, SSH connectivity) before moving to more complex issues.
Jenkins Automation
2 minutes
Introduction
This workshop demonstrates how to use Jenkins to automate the deployment and lifecycle management of AppDynamics Smart Agent across multiple EC2 instances. Whether you’re managing 10 hosts or 10,000, this guide shows you how to leverage Jenkins pipelines for scalable, secure, and repeatable Smart Agent operations.
What You’ll Learn
In this workshop, you’ll learn how to:
Deploy Smart Agent to multiple hosts simultaneously using Jenkins
Configure Jenkins credentials for secure SSH and AppDynamics access
Create parameterized pipelines for flexible deployment scenarios
Implement batch processing to scale to thousands of hosts
Manage the complete agent lifecycle - install, configure, stop, and cleanup
Handle failures gracefully with automatic error tracking and reporting
Key Features
🚀 Parallel Deployment - Deploy to multiple hosts simultaneously
The easiest way to navigate through this workshop is by using:
the left/right arrows (< | >) on the top right of this page
the left (◀️) and right (▶️) cursor keys on your keyboard
Subsections of Jenkins Automation
Architecture & Design
5 minutes
System Architecture
The Jenkins-based Smart Agent deployment system uses a hub-and-spoke architecture where a Jenkins agent in your AWS VPC orchestrates deployments to multiple target hosts via SSH.
High-Level Architecture
graph TB
    subgraph "Jenkins Infrastructure"
        JM[Jenkins Master<br/>Web UI + Orchestration]
        JA[Jenkins Agent<br/>EC2 in VPC<br/>Label: linux]
    end

    subgraph "AWS VPC - Private Network"
        subgraph "Target EC2 Instances"
            H1[Host 1<br/>172.31.1.243]
            H2[Host 2<br/>172.31.1.48]
            H3[Host 3<br/>172.31.1.5]
            HN[Host N<br/>172.31.x.x]
        end
    end

    DEV[Developer/Operator]
    APPD[AppDynamics<br/>Controller]

    DEV -->|1. Triggers Pipeline| JM
    JM -->|2. Assigns Job| JA
    JA -->|3. SSH Deploy<br/>Private IPs| H1
    JA -->|3. SSH Deploy<br/>Private IPs| H2
    JA -->|3. SSH Deploy<br/>Private IPs| H3
    JA -->|3. SSH Deploy<br/>Private IPs| HN

    H1 -.->|Metrics| APPD
    H2 -.->|Metrics| APPD
    H3 -.->|Metrics| APPD
    HN -.->|Metrics| APPD

    style JM fill:#d4e6f1
    style JA fill:#a9cce3
    style H1 fill:#aed6f1
    style H2 fill:#aed6f1
    style H3 fill:#aed6f1
    style HN fill:#aed6f1
Network Architecture
All infrastructure runs in a single AWS VPC with a shared security group. The Jenkins agent communicates with target hosts via private IPs, eliminating the need for public IP addresses on target hosts.
flowchart LR
    subgraph "Jenkins Master"
        CS[Credentials Store<br/>Encrypted at Rest]
        JM[Jenkins Master]
    end

    subgraph "Jenkins Agent"
        WS[Workspace<br/>Temp Files]
        KEY[SSH Key File<br/>600 permissions]
    end

    subgraph "Target Hosts"
        TH[EC2 Instances<br/>Authorized Keys]
    end

    CS -->|Binding| JM
    JM -->|Secure Copy| KEY
    KEY -->|SSH Auth| TH
    WS -.->|Cleanup| X[Deleted]
    KEY -.->|Cleanup| X

    style CS fill:#fdeaa8
    style KEY fill:#fadbd8
    style X fill:#e8e8e8
Batch Processing
The system uses automatic batching to support deployments at any scale. By default, hosts are processed in batches of 256, with all hosts within a batch deploying in parallel.
Symptom: “No agent available” error when running pipelines
Solution:
Check: Manage Jenkins → Nodes
Ensure agent is online
Verify agent has linux label
Test agent connectivity
SSH Connection Failures
Symptom: Cannot connect to target hosts via SSH
Solution:
# Test from Jenkins agent machinessh -i /path/to/key ubuntu@172.31.1.243 -o ConnectTimeout=10# Check security group allows SSH from agent# Verify private key matches public key on target
Credential Not Found
Symptom: “Credential not found” error
Solution:
Verify credential IDs exactly match:
ssh-private-key
deployment-hosts
account-access-key
Check credential scope is set to Global
Permission Denied on Target Hosts
Symptom: SSH succeeds but commands fail with permission denied
Solution:
# On target host, verify user is in sudoerssudo visudo
# Add line:ubuntu ALL=(ALL) NOPASSWD: ALL
Next Steps
Now that Jenkins is configured with credentials and agents, you’re ready to create the deployment pipelines!
Pipeline Creation
10 minutes
Overview
The GitHub repository contains four main pipelines for managing the Smart Agent lifecycle:
Deploy Smart Agent - Installs and starts Smart Agent service
Install Machine Agent - Installs Machine Agent via smartagentctl
Install Database Agent - Installs Database Agent via smartagentctl
Cleanup All Agents - Removes /opt/appdynamics directory
Deploy to Remote Hosts - Copies files and starts Smart Agent on each host
Verify Installation - Checks Smart Agent status on all hosts
4. Credentials Binding
withCredentials([sshUserPrivateKey(credentialsId:'ssh-private-key',...),string(credentialsId:'account-access-key',...)]){// Pipeline code with access to credentials
}
Securely loads credentials without exposing them in logs.
5. Post Actions
post{success{...}failure{...}always{...}}
Defines actions to run after pipeline completion, regardless of success or failure.
Pipeline Naming Convention
For clarity and organization, use a consistent naming convention:
4. Schedule Deployments During Maintenance Windows
For production systems:
Use Jenkins scheduled builds
Deploy during low-traffic periods
Have rollback plan ready
5. Keep Credentials Updated
Rotate SSH keys quarterly
Update host lists as infrastructure changes
Verify AppDynamics access key validity
Next Steps
Now let’s explore scaling and operational considerations for large deployments.
GitHub Actions Automation
2 minutes
Introduction
This workshop demonstrates how to use GitHub Actions with a self-hosted runner to automate the deployment and lifecycle management of AppDynamics Smart Agent across multiple EC2 instances. Whether you’re managing 10 hosts or 10,000, this guide shows you how to leverage GitHub Actions workflows for scalable, secure, and repeatable Smart Agent operations.
What You’ll Learn
In this workshop, you’ll learn how to:
Deploy Smart Agent to multiple hosts using GitHub Actions workflows
Configure GitHub secrets and variables for secure credentials management
Set up a self-hosted runner in your AWS VPC
Implement automatic batching to scale to thousands of hosts
Manage the complete agent lifecycle - install, uninstall, stop, and cleanup
Monitor workflow execution and troubleshoot issues
Key Features
🚀 Parallel Deployment - Deploy to multiple hosts simultaneously
The easiest way to navigate through this workshop is by using:
the left/right arrows (< | >) on the top right of this page
the left (◀️) and right (▶️) cursor keys on your keyboard
Subsections of GitHub Actions Automation
Architecture & Design
5 minutes
System Architecture
The GitHub Actions-based Smart Agent deployment system uses a self-hosted runner within your AWS VPC to orchestrate deployments to multiple target hosts via SSH.
High-Level Architecture
graph TB
subgraph Internet
GH[GitHub.com<br/>Repository & Actions]
User[Developer<br/>Local Machine]
end
subgraph AWS["AWS VPC (172.31.0.0/16)"]
subgraph SG["Security Group: smartagent-lab"]
Runner[Self-hosted Runner<br/>EC2 Instance<br/>172.31.1.x]
subgraph Targets["Target Hosts"]
T1[Target Host 1<br/>Ubuntu EC2<br/>172.31.1.243]
T2[Target Host 2<br/>Ubuntu EC2<br/>172.31.1.48]
T3[Target Host 3<br/>Ubuntu EC2<br/>172.31.1.5]
end
end
end
User -->|git push| GH
GH <-->|HTTPS:443<br/>Poll for jobs| Runner
Runner -->|SSH:22<br/>Private IPs| T1
Runner -->|SSH:22<br/>Private IPs| T2
Runner -->|SSH:22<br/>Private IPs| T3
style GH fill:#24292e,color:#fff
style User fill:#0366d6,color:#fff
style Runner fill:#28a745,color:#fff
style T1 fill:#ffd33d,color:#000
style T2 fill:#ffd33d,color:#000
style T3 fill:#ffd33d,color:#000
Network Architecture
All infrastructure runs in a single AWS VPC with a shared security group. The self-hosted runner communicates with target hosts via private IPs.
# Option 1: Fork the repository via GitHub UI# Go to https://github.com/chambear2809/github-actions-lab# Click "Fork" button# Option 2: Clone directly (for testing)git clone https://github.com/chambear2809/github-actions-lab.git
cd github-actions-lab
Configure Self-hosted Runner
Your self-hosted runner must be deployed in the same AWS VPC as your target EC2 instances.
Install Runner on EC2 Instance
Launch EC2 instance in your VPC (Ubuntu or Amazon Linux 2)
Navigate to runner settings in your forked repository:
Settings → Actions → Runners → New self-hosted runner
SSH into the runner instance and execute installation commands:
These variables are optional and used for Smart Agent service user/group configuration:
SMARTAGENT_USER
Click “New repository variable”
Name: SMARTAGENT_USER
Value: e.g., appdynamics
Click “Add variable”
SMARTAGENT_GROUP
Click “New repository variable”
Name: SMARTAGENT_GROUP
Value: e.g., appdynamics
Click “Add variable”
Network Configuration
For the lab setup with all EC2 instances in the same VPC and security group:
Security Group Rules
Inbound Rules:
SSH (port 22) from same security group (source: same SG)
Outbound Rules:
HTTPS (port 443) to 0.0.0.0/0 (for GitHub API access)
SSH (port 22) to same security group (for target access)
Network Best Practices
✅ Use private IP addresses (172.31.x.x) for DEPLOYMENT_HOSTS
✅ Runner and targets in same security group
✅ No public IPs needed on target hosts
✅ Runner communicates via private network
✅ Outbound HTTPS required for GitHub polling
Verify Configuration
Before running workflows, verify your setup:
1. Check Runner Status
Go to Settings → Actions → Runners
Verify runner shows as “Idle” (green)
Check “Last seen” timestamp is recent
2. Test SSH Connectivity
SSH from your runner instance to a target host:
# On runner instancessh -i ~/.ssh/your-key.pem ubuntu@172.31.1.243
If successful, you should get a shell prompt on the target host.
3. Verify Secrets and Variables
Go to Settings → Secrets and variables → Actions
Confirm secrets tab shows: SSH_PRIVATE_KEY
Confirm variables tab shows: DEPLOYMENT_HOSTS
4. Check Repository Access
Ensure the runner can access the repository:
# On runner instance, as the runner usercd ~/actions-runner
./run.sh # Test run (Ctrl+C to stop)
You should see: “Listening for Jobs”
Troubleshooting Common Issues
Runner Not Picking Up Jobs
Symptom: Workflows stay in “queued” state
Solution:
Check runner status: sudo systemctl status actions.runner.*
Restart runner: sudo ./svc.sh restart
Verify outbound HTTPS (443) connectivity to GitHub
SSH Connection Failures
Symptom: Workflows fail with “Permission denied” or “Connection refused”
Solution:
# Test from runnerssh -i ~/.ssh/test-key.pem ubuntu@172.31.1.243 -o ConnectTimeout=10# Check security group allows SSH from runner# Verify private key matches public key on targets
Symptom: Error: “Secret SSH_PRIVATE_KEY not found”
Solution:
Verify secret name exactly matches: SSH_PRIVATE_KEY
Check secret is in repository secrets (not environment secrets)
Ensure you have repository admin access
Security Best Practices
Follow these best practices for secure operations:
✅ Use GitHub Secrets for all private keys
✅ Rotate SSH keys regularly
✅ Keep runner in private VPC subnet
✅ Restrict runner security group to minimal access
✅ Update runner software regularly
✅ Enable branch protection rules
✅ Use separate keys for different environments
✅ Enable audit logging for repository access
Next Steps
With GitHub configured and the runner set up, you’re ready to explore the available workflows and execute your first deployment!
Understanding Workflows
10 minutes
Available Workflows
The GitHub Actions lab includes 11 workflows for complete Smart Agent lifecycle management. All workflow files are available in the repository at .github/workflows/.
Purpose: Installs Smart Agent and starts the service
Features:
Automatic batching (default: 256 hosts per batch)
Configurable batch size
Parallel deployment within each batch
Sequential batch processing
Inputs:
batch_size: Number of hosts per batch (default: 256)
Trigger: Manual only (workflow_dispatch)
2. Agent Installation (4 workflows)
All installation workflows use smartagentctl to install specific agent types:
Install Node Agent (Batched)
File: install-node-batched.yml
Command: smartagentctl install node
Batched: Yes (configurable)
Install Machine Agent (Batched)
File: install-machine-batched.yml
Command: smartagentctl install machine
Batched: Yes (configurable)
Install DB Agent (Batched)
File: install-db-batched.yml
Command: smartagentctl install db
Batched: Yes (configurable)
Install Java Agent (Batched)
File: install-java-batched.yml
Command: smartagentctl install java
Batched: Yes (configurable)
3. Agent Uninstallation (4 workflows)
All uninstallation workflows use smartagentctl to remove specific agent types:
Uninstall Node Agent (Batched)
File: uninstall-node-batched.yml
Command: smartagentctl uninstall node
Batched: Yes (configurable)
Uninstall Machine Agent (Batched)
File: uninstall-machine-batched.yml
Command: smartagentctl uninstall machine
Batched: Yes (configurable)
Uninstall DB Agent (Batched)
File: uninstall-db-batched.yml
Command: smartagentctl uninstall db
Batched: Yes (configurable)
Uninstall Java Agent (Batched)
File: uninstall-java-batched.yml
Command: smartagentctl uninstall java
Batched: Yes (configurable)
4. Smart Agent Management (2 workflows)
Stop and Clean Smart Agent (Batched)
File: stop-clean-smartagent-batched.yml
Commands:
smartagentctl stop
smartagentctl clean
Purpose: Stops the Smart Agent service and purges all data
Batched: Yes (configurable)
Cleanup All Agents (Batched)
File: cleanup-appdynamics.yml
Command: sudo rm -rf /opt/appdynamics
Purpose: Completely removes the /opt/appdynamics directory
Batched: Yes (configurable)
Warning: This permanently deletes all AppDynamics components
Details
The “Cleanup All Agents” workflow permanently deletes /opt/appdynamics. This action cannot be undone. Use with caution!
Workflow Structure
All batched workflows follow a consistent two-job structure:
Job 1: Prepare
prepare:runs-on:self-hostedoutputs:batches:${{ steps.create-batches.outputs.batches }}steps:- name:Load hosts and create batchesrun:| # Load DEPLOYMENT_HOSTS variable
# Split into batches of N hosts
# Output as JSON array
Purpose: Loads target hosts from GitHub variables and creates batch matrix
Job 2: Deploy/Install/Uninstall
deploy:needs:prepareruns-on:self-hostedstrategy:matrix:batch:${{ fromJson(needs.prepare.outputs.batches) }}steps:- name:Setup SSH key- name:Execute operation on all hosts in batch (parallel)
Purpose: Runs in parallel for each batch, executing the specific operation on all hosts within the batch
Batching Behavior
How It Works
Prepare Job loads DEPLOYMENT_HOSTS and splits into batches
Deploy Job creates one matrix entry per batch
Batches process sequentially to avoid overwhelming the runner
Within each batch, all hosts deploy in parallel using background processes
Configurable Batch Size
All workflows accept a batch_size input (default: 256):
# Via GitHub CLIgh workflow run "Deploy Smart Agent" -f batch_size=128# Via GitHub UIActions → Select workflow → Run workflow → Set batch_size
# Deploy Smart Agent (default batch size)gh workflow run "Deploy Smart Agent" --repo YOUR_USERNAME/github-actions-lab
# Deploy with custom batch sizegh workflow run "Deploy Smart Agent"\
--repo YOUR_USERNAME/github-actions-lab \
-f batch_size=128# Install agentsgh workflow run "Install Node Agent (Batched for Large Scale)"\
--repo YOUR_USERNAME/github-actions-lab
gh workflow run "Install Machine Agent (Batched for Large Scale)"\
--repo YOUR_USERNAME/github-actions-lab
# Uninstall agentsgh workflow run "Uninstall Node Agent (Batched for Large Scale)"\
--repo YOUR_USERNAME/github-actions-lab
# Stop and cleangh workflow run "Stop and Clean Smart Agent (Batched for Large Scale)"\
--repo YOUR_USERNAME/github-actions-lab
# Complete cleanupgh workflow run "Cleanup All Agents"\
--repo YOUR_USERNAME/github-actions-lab
Monitor Workflows
# List recent workflow runsgh run list --repo YOUR_USERNAME/github-actions-lab
# View specific rungh run view RUN_ID --repo YOUR_USERNAME/github-actions-lab
# Watch run in progressgh run watch RUN_ID --repo YOUR_USERNAME/github-actions-lab
# View failed logsgh run view RUN_ID --log-failed --repo YOUR_USERNAME/github-actions-lab
First Deployment Walkthrough
Let’s walk through a complete first-time deployment:
Step 1: Verify Setup
Before running any workflows, ensure:
✅ Self-hosted runner shows “Idle” (green)
✅ SSH_PRIVATE_KEY secret is configured
✅ DEPLOYMENT_HOSTS variable contains your target IPs
✅ Network connectivity verified
Step 2: Deploy Smart Agent
Via GitHub UI:
Go to Actions tab
Select “Deploy Smart Agent”
Click “Run workflow”
Accept default batch_size (256)
Click “Run workflow”
Via GitHub CLI:
gh workflow run "Deploy Smart Agent" --repo YOUR_USERNAME/github-actions-lab
Step 3: Monitor Execution
The workflow will show:
Prepare job - Creating batch matrix
Deploy job (one per batch) - Deploying to hosts
Click on each job to view detailed logs.
Step 4: Verify Installation
SSH into a target host and check:
# SSH to targetssh ubuntu@172.31.1.243
# Check Smart Agent statuscd /opt/appdynamics/appdsmartagent
sudo ./smartagentctl status
Expected output:
Smart Agent is running (PID: 12345)
Service: appdsmartagent.service
Status: active (running)
Step 5: Install Additional Agents (Optional)
If needed, install specific agent types:
# Install Machine Agentgh workflow run "Install Machine Agent (Batched for Large Scale)"\
--repo YOUR_USERNAME/github-actions-lab
# Install DB Agentgh workflow run "Install DB Agent (Batched for Large Scale)"\
--repo YOUR_USERNAME/github-actions-lab
# 1. Deploy Smart Agentgh workflow run "Deploy Smart Agent"# 2. Verify deployment# SSH to a host and check status# 3. Install agents as neededgh workflow run "Install Machine Agent (Batched for Large Scale)"gh workflow run "Install DB Agent (Batched for Large Scale)"
Scenario 2: Update Smart Agent
# 1. Stop and clean current installationgh workflow run "Stop and Clean Smart Agent (Batched for Large Scale)"# 2. Update Smart Agent ZIP in repository# (Push new version to repository)# 3. Deploy new versiongh workflow run "Deploy Smart Agent"# 4. Reinstall agentsgh workflow run "Install Machine Agent (Batched for Large Scale)"
Scenario 3: Add New Hosts
# 1. Update DEPLOYMENT_HOSTS variable in GitHub# Add new IPs# 2. Deploy to all hosts (will skip existing ones with idempotent logic)gh workflow run "Deploy Smart Agent"
Scenario 4: Complete Removal
# 1. Stop and cleangh workflow run "Stop and Clean Smart Agent (Batched for Large Scale)"# 2. Complete removalgh workflow run "Cleanup All Agents"
Details
“Cleanup All Agents” permanently deletes /opt/appdynamics. This cannot be undone!
Troubleshooting Workflow Failures
Workflow Stays in “Queued”
Symptom: Workflow doesn’t start
Cause: Runner not available or offline
Solution:
Check runner status: Settings → Actions → Runners
Verify runner shows “Idle” (green)
Restart runner if needed: sudo ./svc.sh restart
SSH Connection Failures
Symptom: “Permission denied” or “Connection refused” errors
Solutions:
Test SSH manually:
# From runner instancessh -i ~/.ssh/test-key.pem ubuntu@172.31.1.243
gh workflow run "Deploy Smart Agent" -f batch_size=128
Larger batches (more resources, faster):
gh workflow run "Deploy Smart Agent" -f batch_size=256
Runner Resource Recommendations
Hosts
CPU
Memory
Batch Size
1-100
2 cores
4 GB
256
100-500
4 cores
8 GB
256
500-2000
8 cores
16 GB
256
2000+
16 cores
32 GB
256
Best Practices
Test on single host first
Create a test variable with 1 IP
Run workflow to verify
Then deploy to full list
Monitor workflow execution
Watch logs in real-time
Check for errors immediately
Verify on sample hosts
Use appropriate batch sizes
Default (256) works for most cases
Reduce if runner struggles
Monitor runner resource usage
Keep workflows up to date
Pull latest changes from repository
Test updates on non-production first
Document any customizations
Maintain runner health
Keep runner online and idle
Update runner software regularly
Monitor disk space and resources
Next Steps
Congratulations! You’ve successfully learned how to automate AppDynamics Smart Agent deployment using GitHub Actions. For more information, visit the complete repository.
Monitoring as Code with Smart Agent and Ansible
10 minutes
Introduction
This guide details how to deploy the Cisco AppDynamics Smart Agent across multiple hosts using Ansible. By leveraging automation, you can ensure your monitoring infrastructure is consistent, robust, and easily scalable.
Architecture Overview
The deployment architecture leverages an Ansible Control Node to orchestrate the installation and configuration of the Smart Agent on target hosts.
graph TD
    CN[Ansible Control Node<br/>(macOS/Linux)] -->|SSH| H1[Target Host 1<br/>(Debian/RedHat)]
    CN -->|SSH| H2[Target Host 2<br/>(Debian/RedHat)]
    CN -->|SSH| H3[Target Host N<br/>(Debian/RedHat)]

    subgraph "Target Host Configuration"
        SA[Smart Agent Service]
        Config[config.ini]
        Package[Installer .deb/.rpm]
    end

    H1 --> SA
    H2 --> SA
    H3 --> SA
Key Components
Ansible Control Node: The machine where you run the playbooks (e.g., your laptop or a jump host).
Target Hosts: The servers where the Smart Agent will be installed.
Inventory: A list of target hosts and their connection details.
Playbook: The YAML file defining the deployment tasks.
Prerequisites
Before beginning, ensure you have:
Access to the target hosts via SSH.
Sudo privileges on the target hosts.
The Smart Agent installation packages (.deb or .rpm) downloaded.
Account details for your AppDynamics Controller (Access Key, Account Name, URL).
Step 1: Install Ansible on macOS
To start, we need to install Ansible on your control node.
Action: Update the ansible_host IPs and credentials with your actual lab environment details.
2. Variables File (variables.yaml)
This file contains the configuration details for the Smart Agent.
smart_agent:controller_url:'CONTROLLER URL HERE, JUST THE BASE URL'# o11y.saas.appdynamics.comaccount_name:'Account Name Here'account_access_key:'YOUR ACCESS KEY HERE'fm_service_port:'443'# Use 443 or 8080 depending on your environment.ssl:truesmart_agent_package_debian:'appdsmartagent_64_linux_24.6.0.2143.deb'# or the appropriate package namesmart_agent_package_redhat:'appdsmartagent_64_linux_24.6.0.2143.rpm'# or the appropriate package name
Action: Update the smart_agent section with your specific controller URL, account name, and access key.
3. Playbook (smartagent.yaml)
The playbook orchestrates the deployment of the Cisco AppDynamics Distribution of OpenTelemetry Collector. Here is a concise summary of its tasks:
Prerequisites: Installs necessary packages (yum-utils for RedHat, curl/apt-transport-https for Debian).
Directory Setup: Ensures the /opt/appdynamics/appdsmartagent directory exists.
Configuration:
Checks if config.ini exists.
Creates a default config.ini using values from variables.yaml if missing.
Updates configuration keys (AccountAccessKey, ControllerURL, etc.) using lineinfile to ensure settings are correct.
Package Management:
Determines the correct package path based on OS family (Debian/RedHat).
Fails if the package is missing locally.
Copies the package to the target host’s /tmp directory.
Installs the package using dpkg or yum.
Service Management: Restarts the smartagent service.
Cleanup: Removes the temporary package file.
The playbook uses when: ansible_os_family == ... conditionals to handle both RedHat and Debian systems within the same workflow.
Deployment
5 minutes
Step 4: Execute the Playbook
To deploy the Smart Agent, run the following command from your project directory: