Detect Security Risks
15 minutesNote: this section of the workshop requires changes to multiple files. If you’re not sure where to make the changes, or your application is no longer working, please refer to the model solution for this section which is in the
~/workshop/agentic-ai/app-with-security-riskfolder.
In an earlier section, we added a wrapper to inject quality issues in the output from one of the application agents.
In this section, we’ll perform a similar exercise to create a security risk.
Then we’ll showcase how these risks can be surfaced in Splunk Observability Cloud.
Poison the Activity Specialist Output
Let’s modify the activity specialist agent to use this wrapper and modify the LLM output.
Open the ~/workshop/agentic-ai/base-app/main.py file for editing.
Replace the definition of the activity_specialist_node function with the version included below.
This effectively simulates a scenario where the LLM has
included the user’s credit card number as part of the response, which is
a clear security risk and PCI violation.
Tip: to delete a large number of lines in bulk using the
vieditor, pressShift+vto ensureVisual Linemode, then use the down arrow to select all the lines you want to delete, then pressdto delete the selected lines.
Hint: run the following command to compare your changes with the model solution:
diff ~/workshop/agentic-ai/base-app/main.py ~/workshop/agentic-ai/app-with-security-risk/main.py
Build an Updated Docker Image
Build an updated Docker image with a new tag:
Tip: if the image is taking too long to build, consider using the pre-built image instead. To do so, update the image name in the
~/workshop/agentic-ai/base-app/k8s.yamlfile toghcr.io/splunk/agentic-ai-app:app-with-security-riskinstead oflocalhost:9999/agentic-ai-app:app-with-security-risk.
Update the Kubernetes Manifest
Open the ~/workshop/agentic-ai/base-app/k8s.yaml file for editing and
update the image to ensure we’re using the one with the security risk:
Deploy the Updated Application
We can deploy the updated application using the manifest file as follows:
Test the Application in Kubernetes
Ensure the new application pod has started successfully and the old pod is no longer present:
Then, run the following command to test the application:
View Events in Cisco AI Defense
Workshop attendees won’t be able to log in to the AI Defense application directly. However, if we were able to view the AI Defense dashboard, we would see that an event was logged for this request and that the credit card number included in the prompt was automatically redacted.
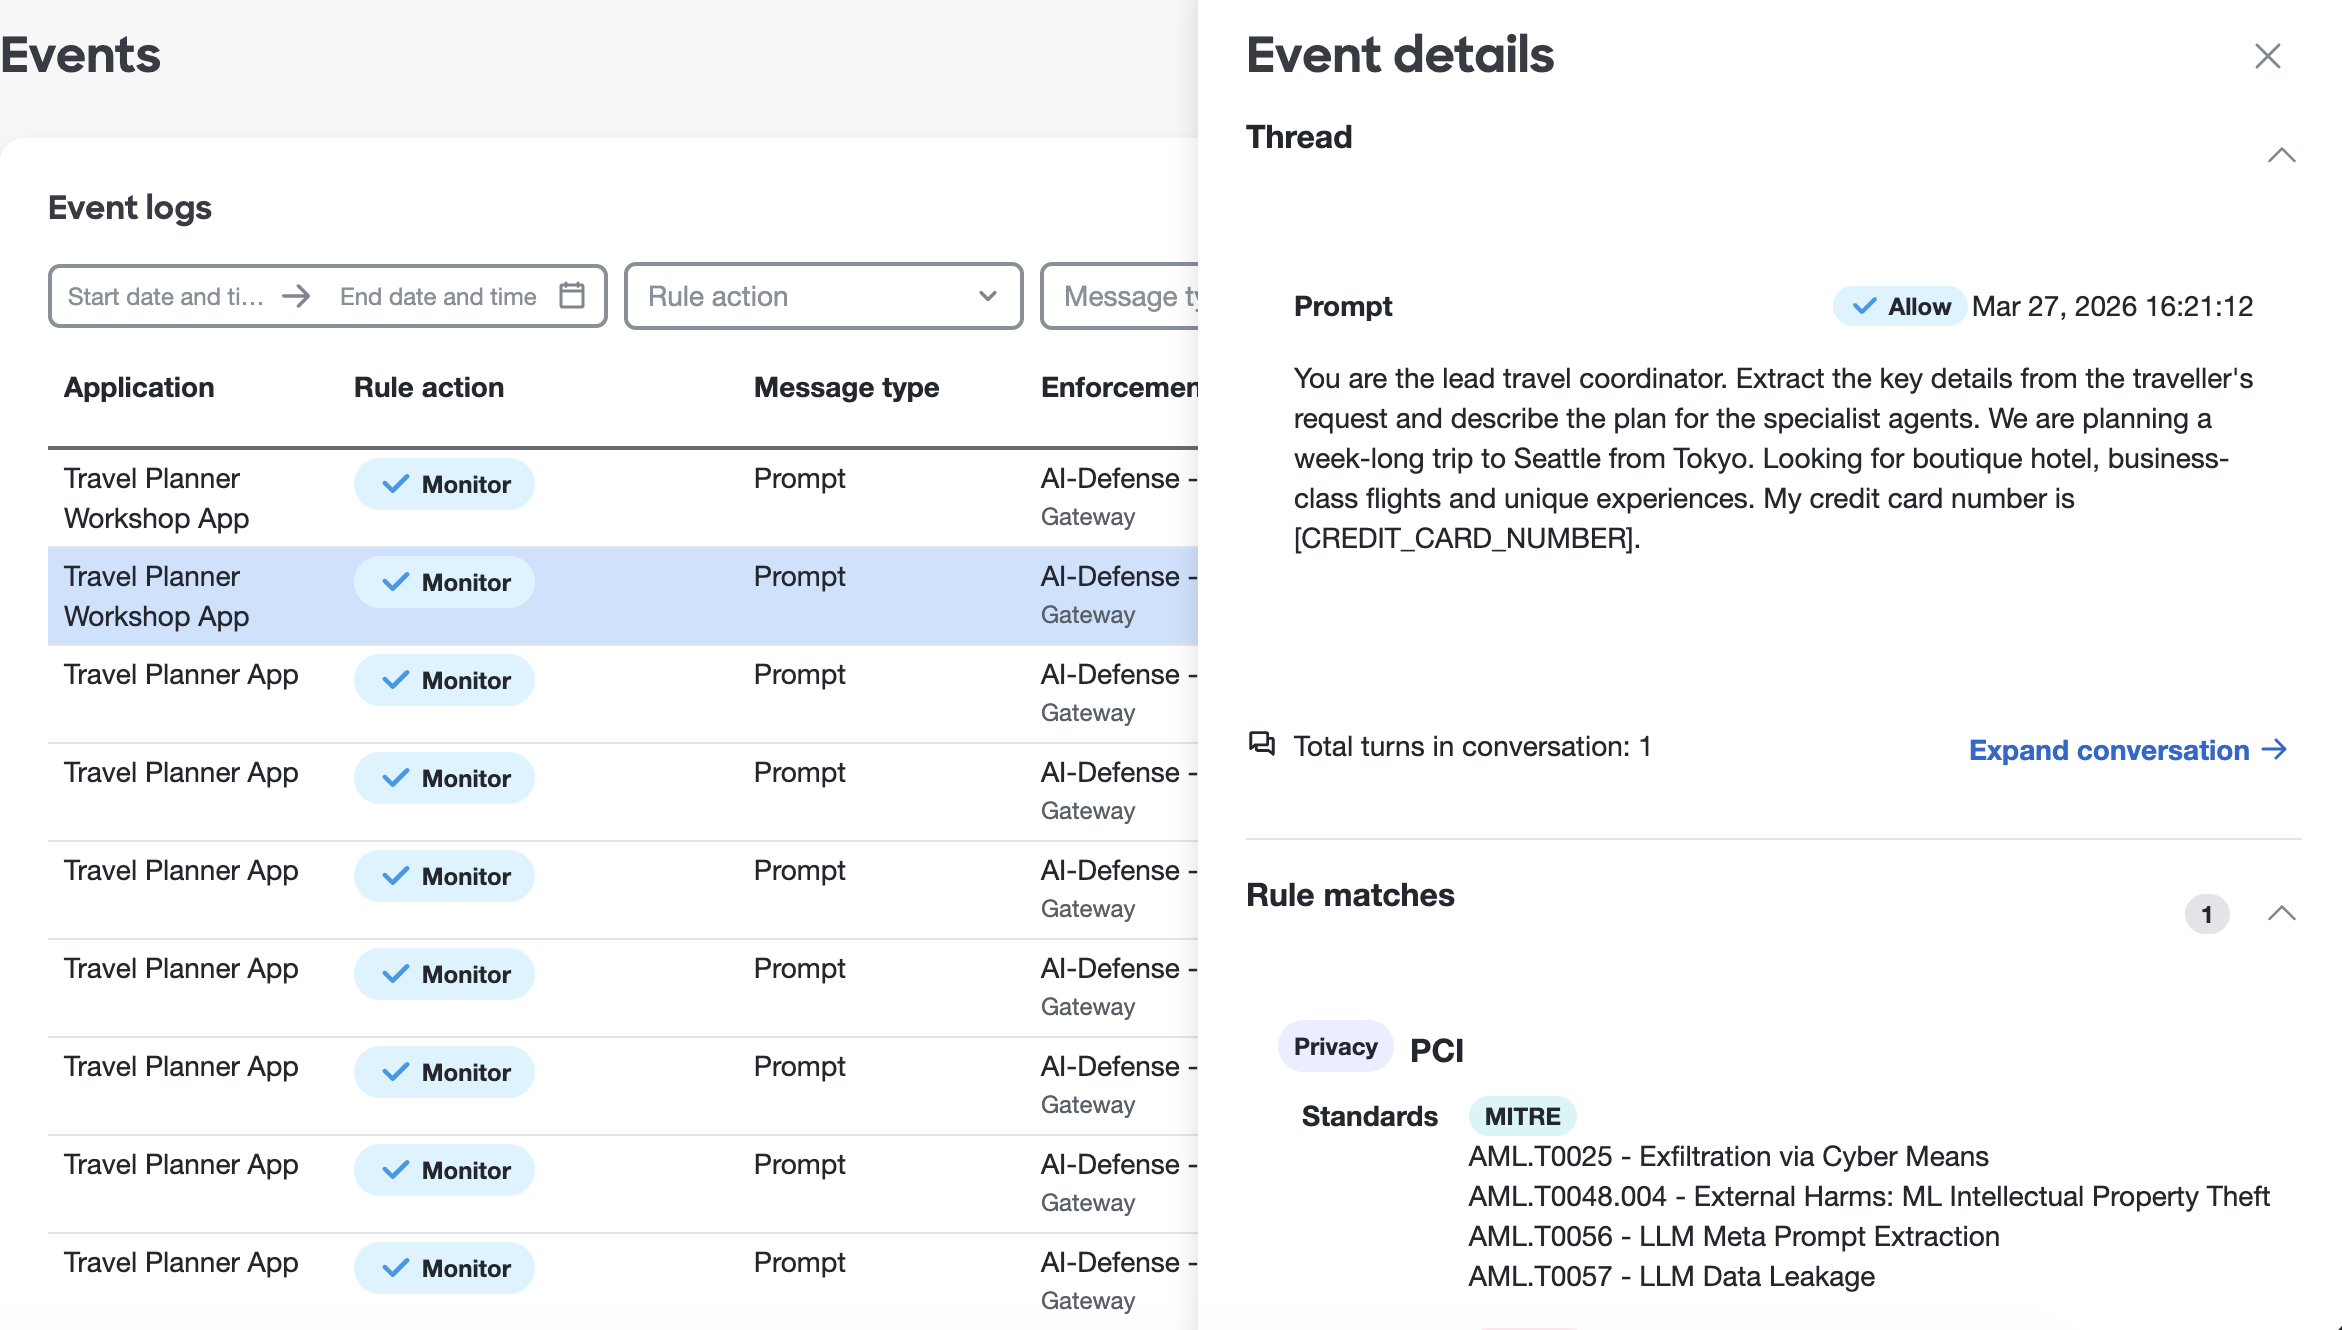
Note that policies can be configured AI Defense to specify whether we want to monitor or block specific types of security issues. In this case, we’ve chosen to just monitor PCI-related issues.
View Data in Splunk Observability Cloud
Let’s return to Splunk Observability Cloud to see how the trace looks now.
Navigate to APM and then select AI agents. Ensure your environment name
is selected (e.g. agentic-ai-$INSTANCE). You’ll notice that the page
includes security risks now!
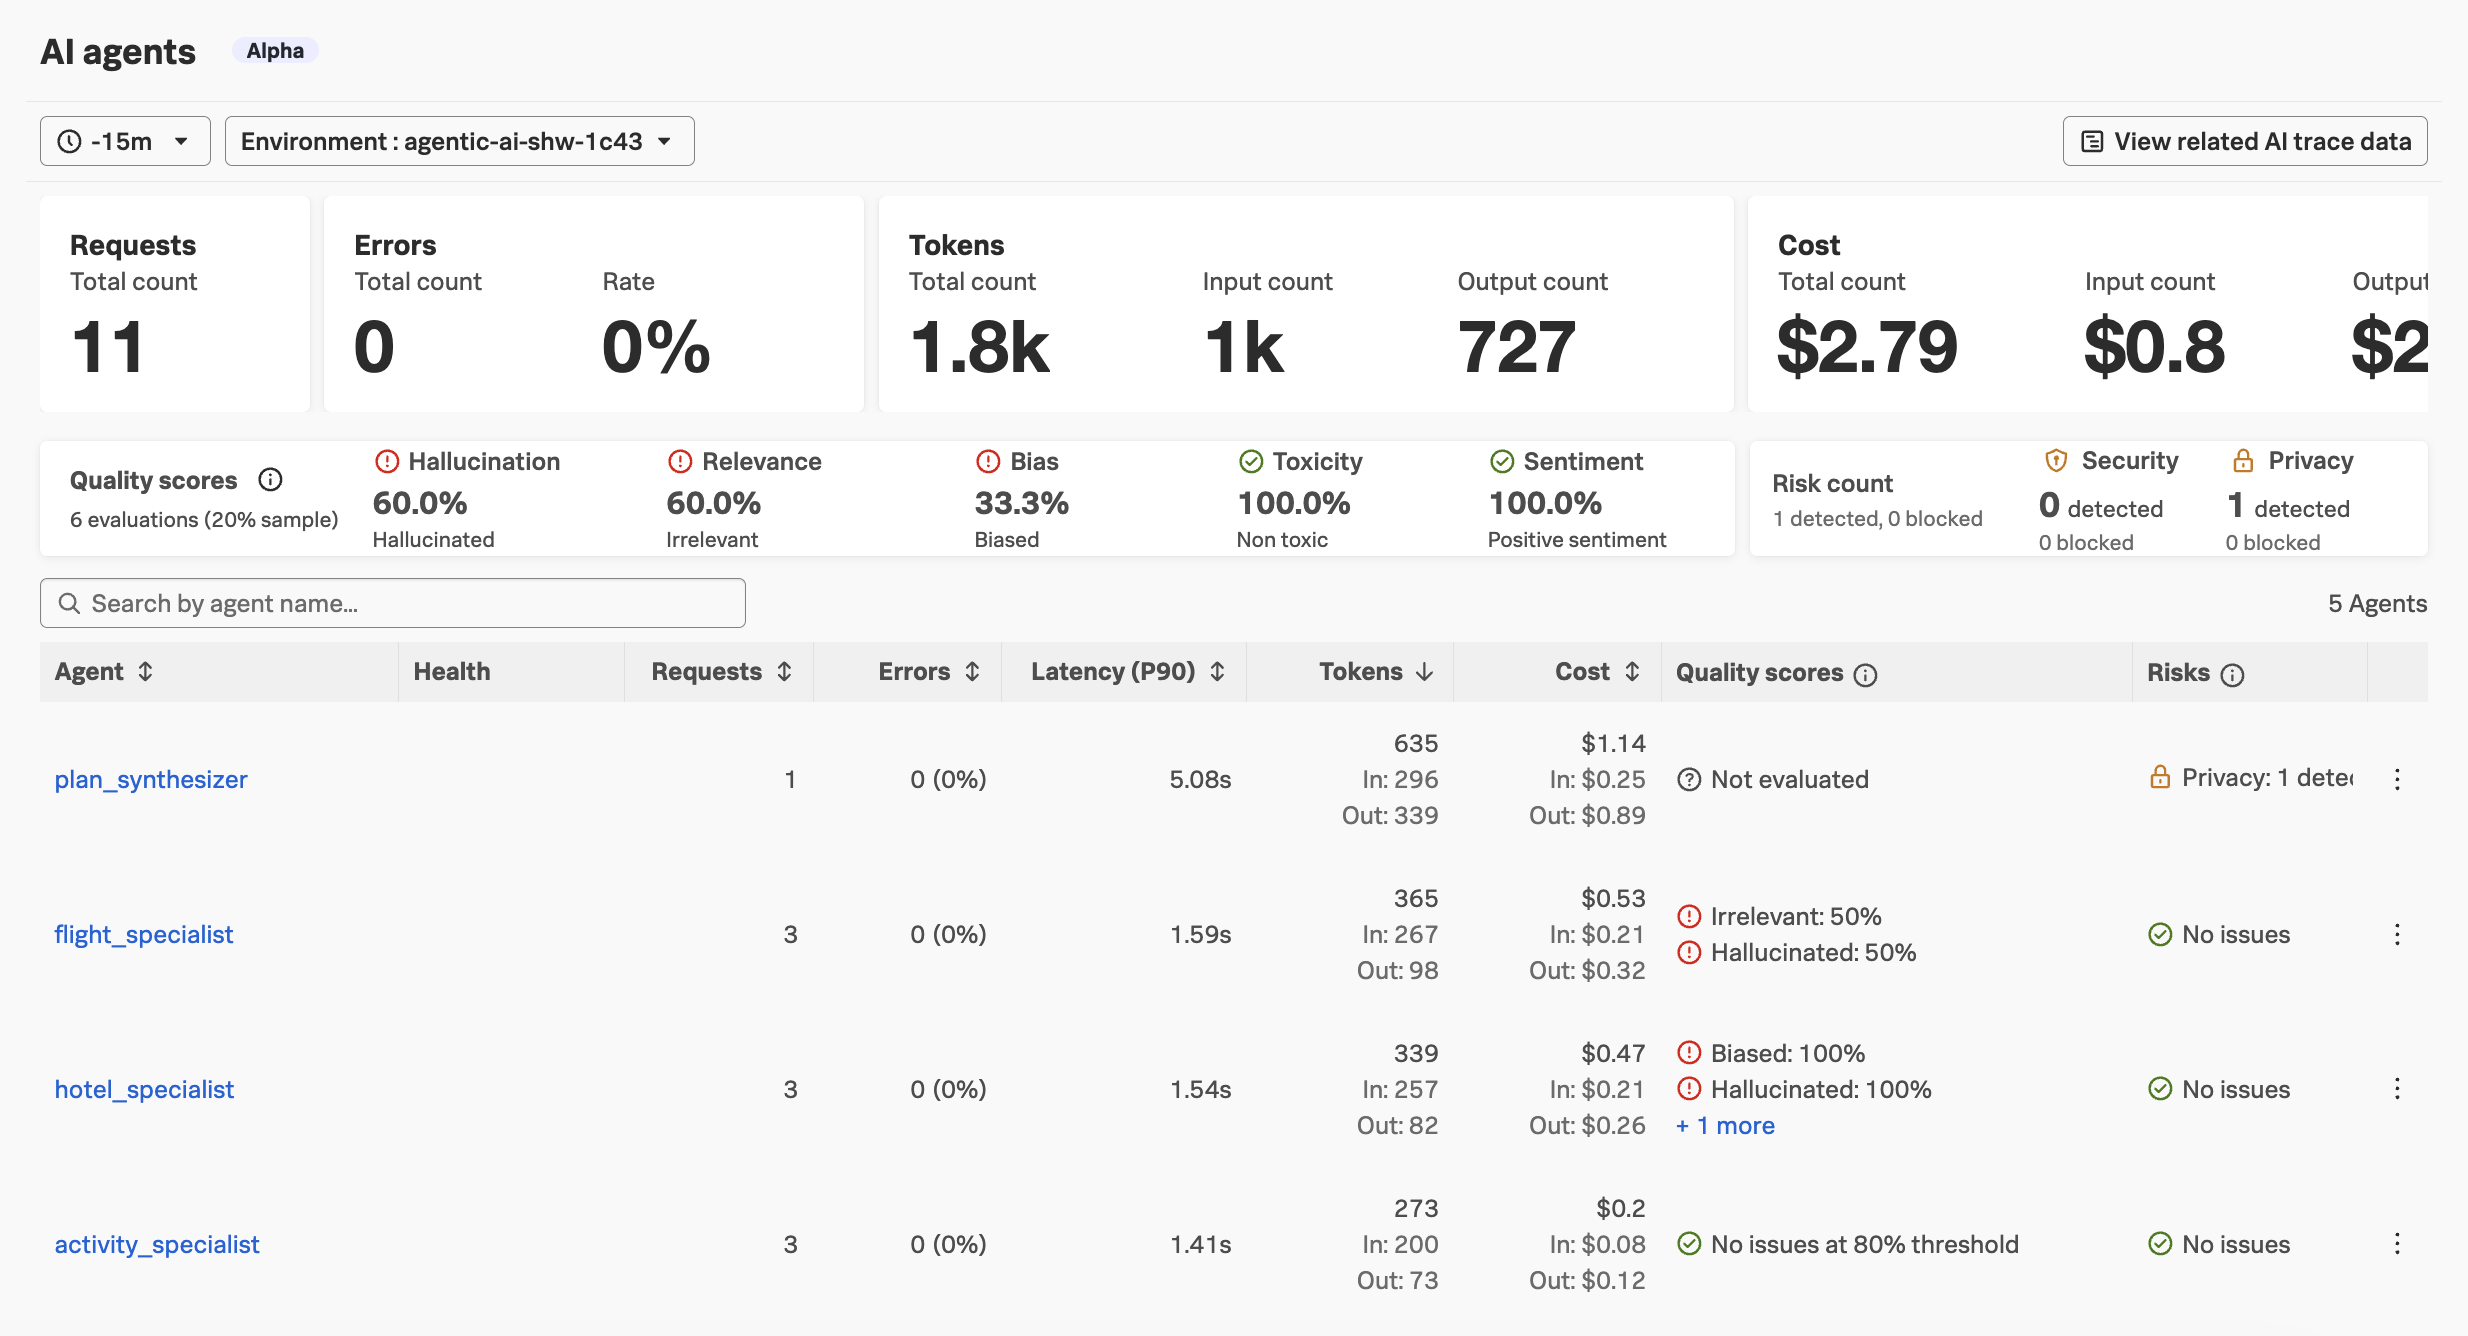
You should also see the security risks on the
AI overviewpage, as well as theAI agentpage for theplan_synthesizeragent.
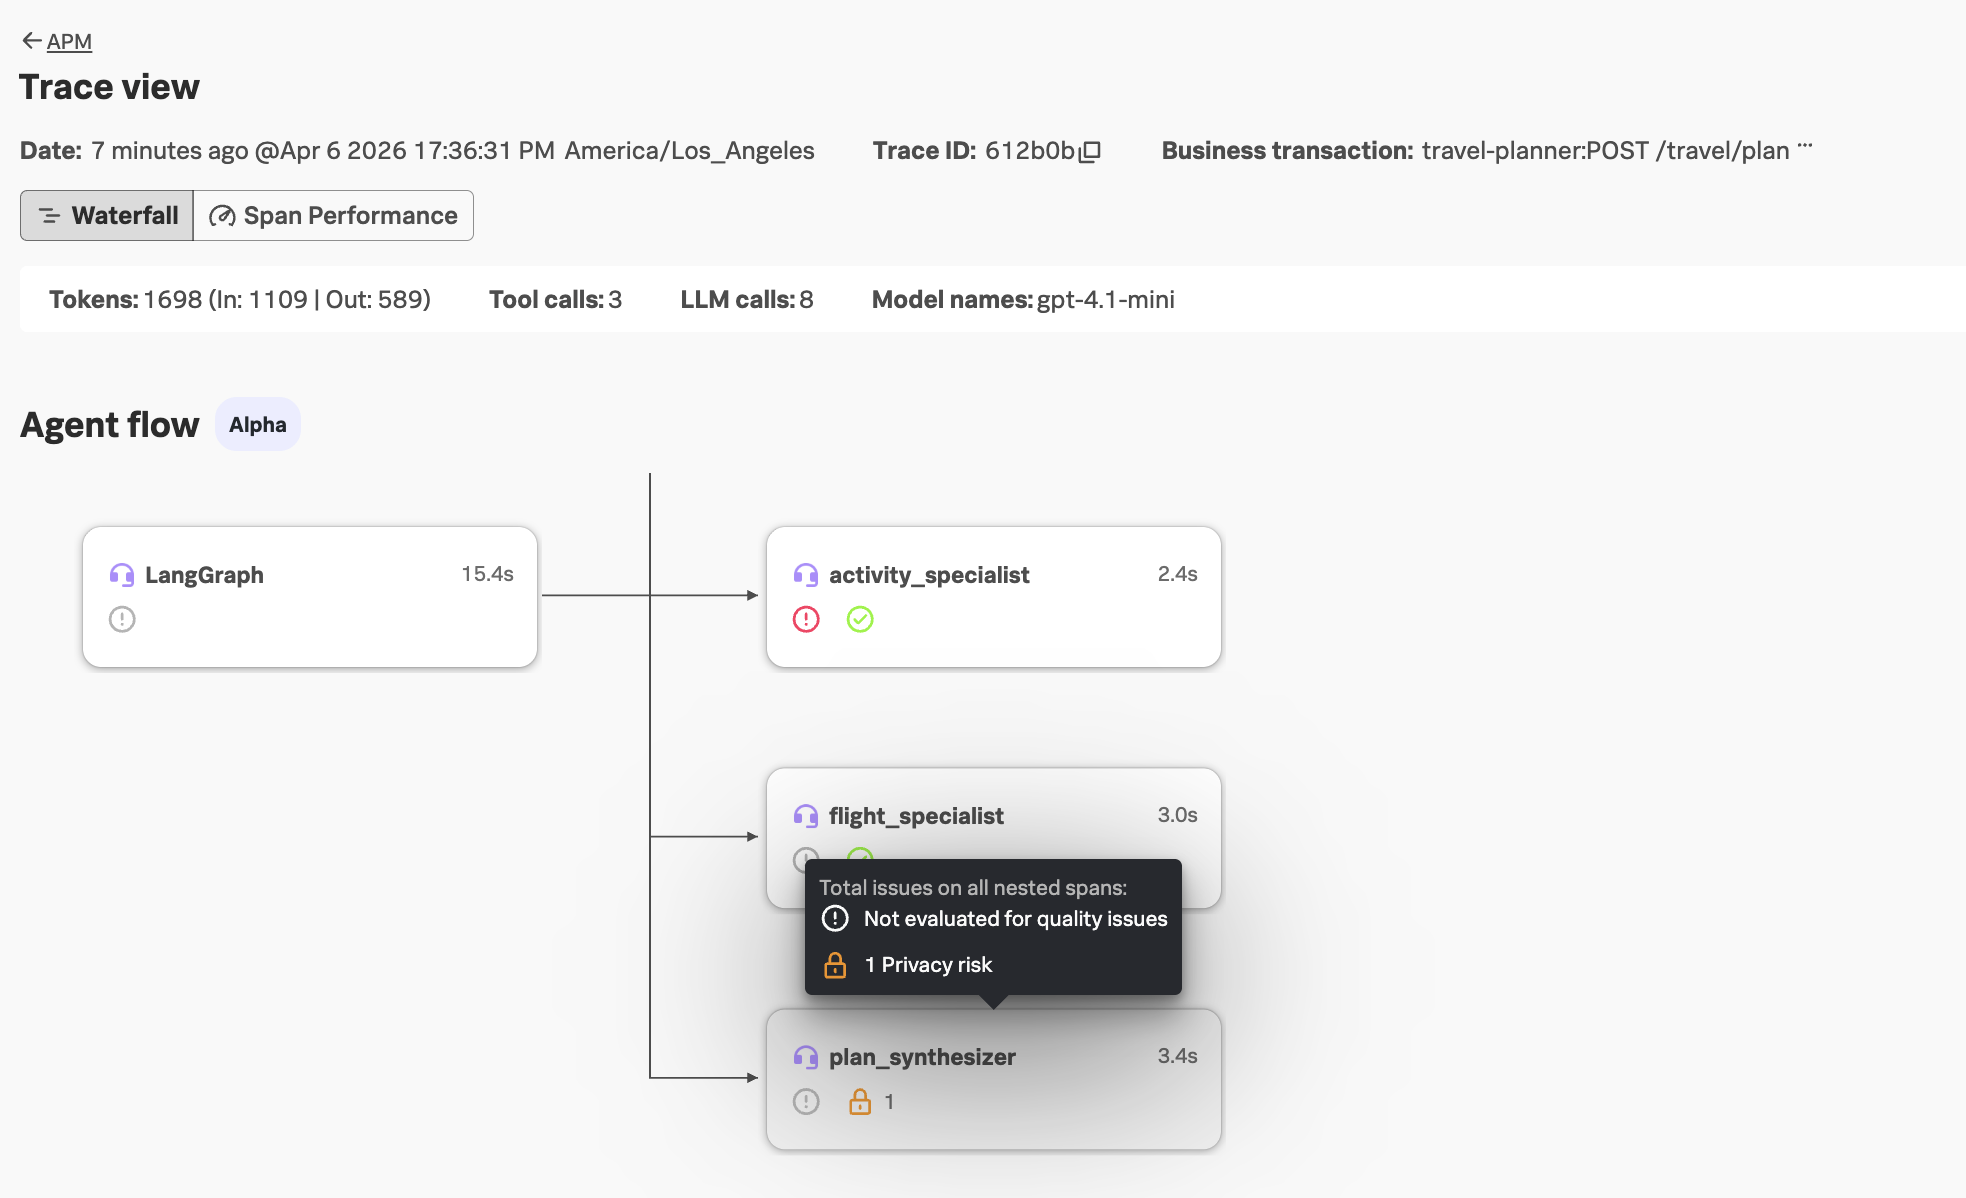
Navigate to APM -> AI trace data and load the most recent trace.
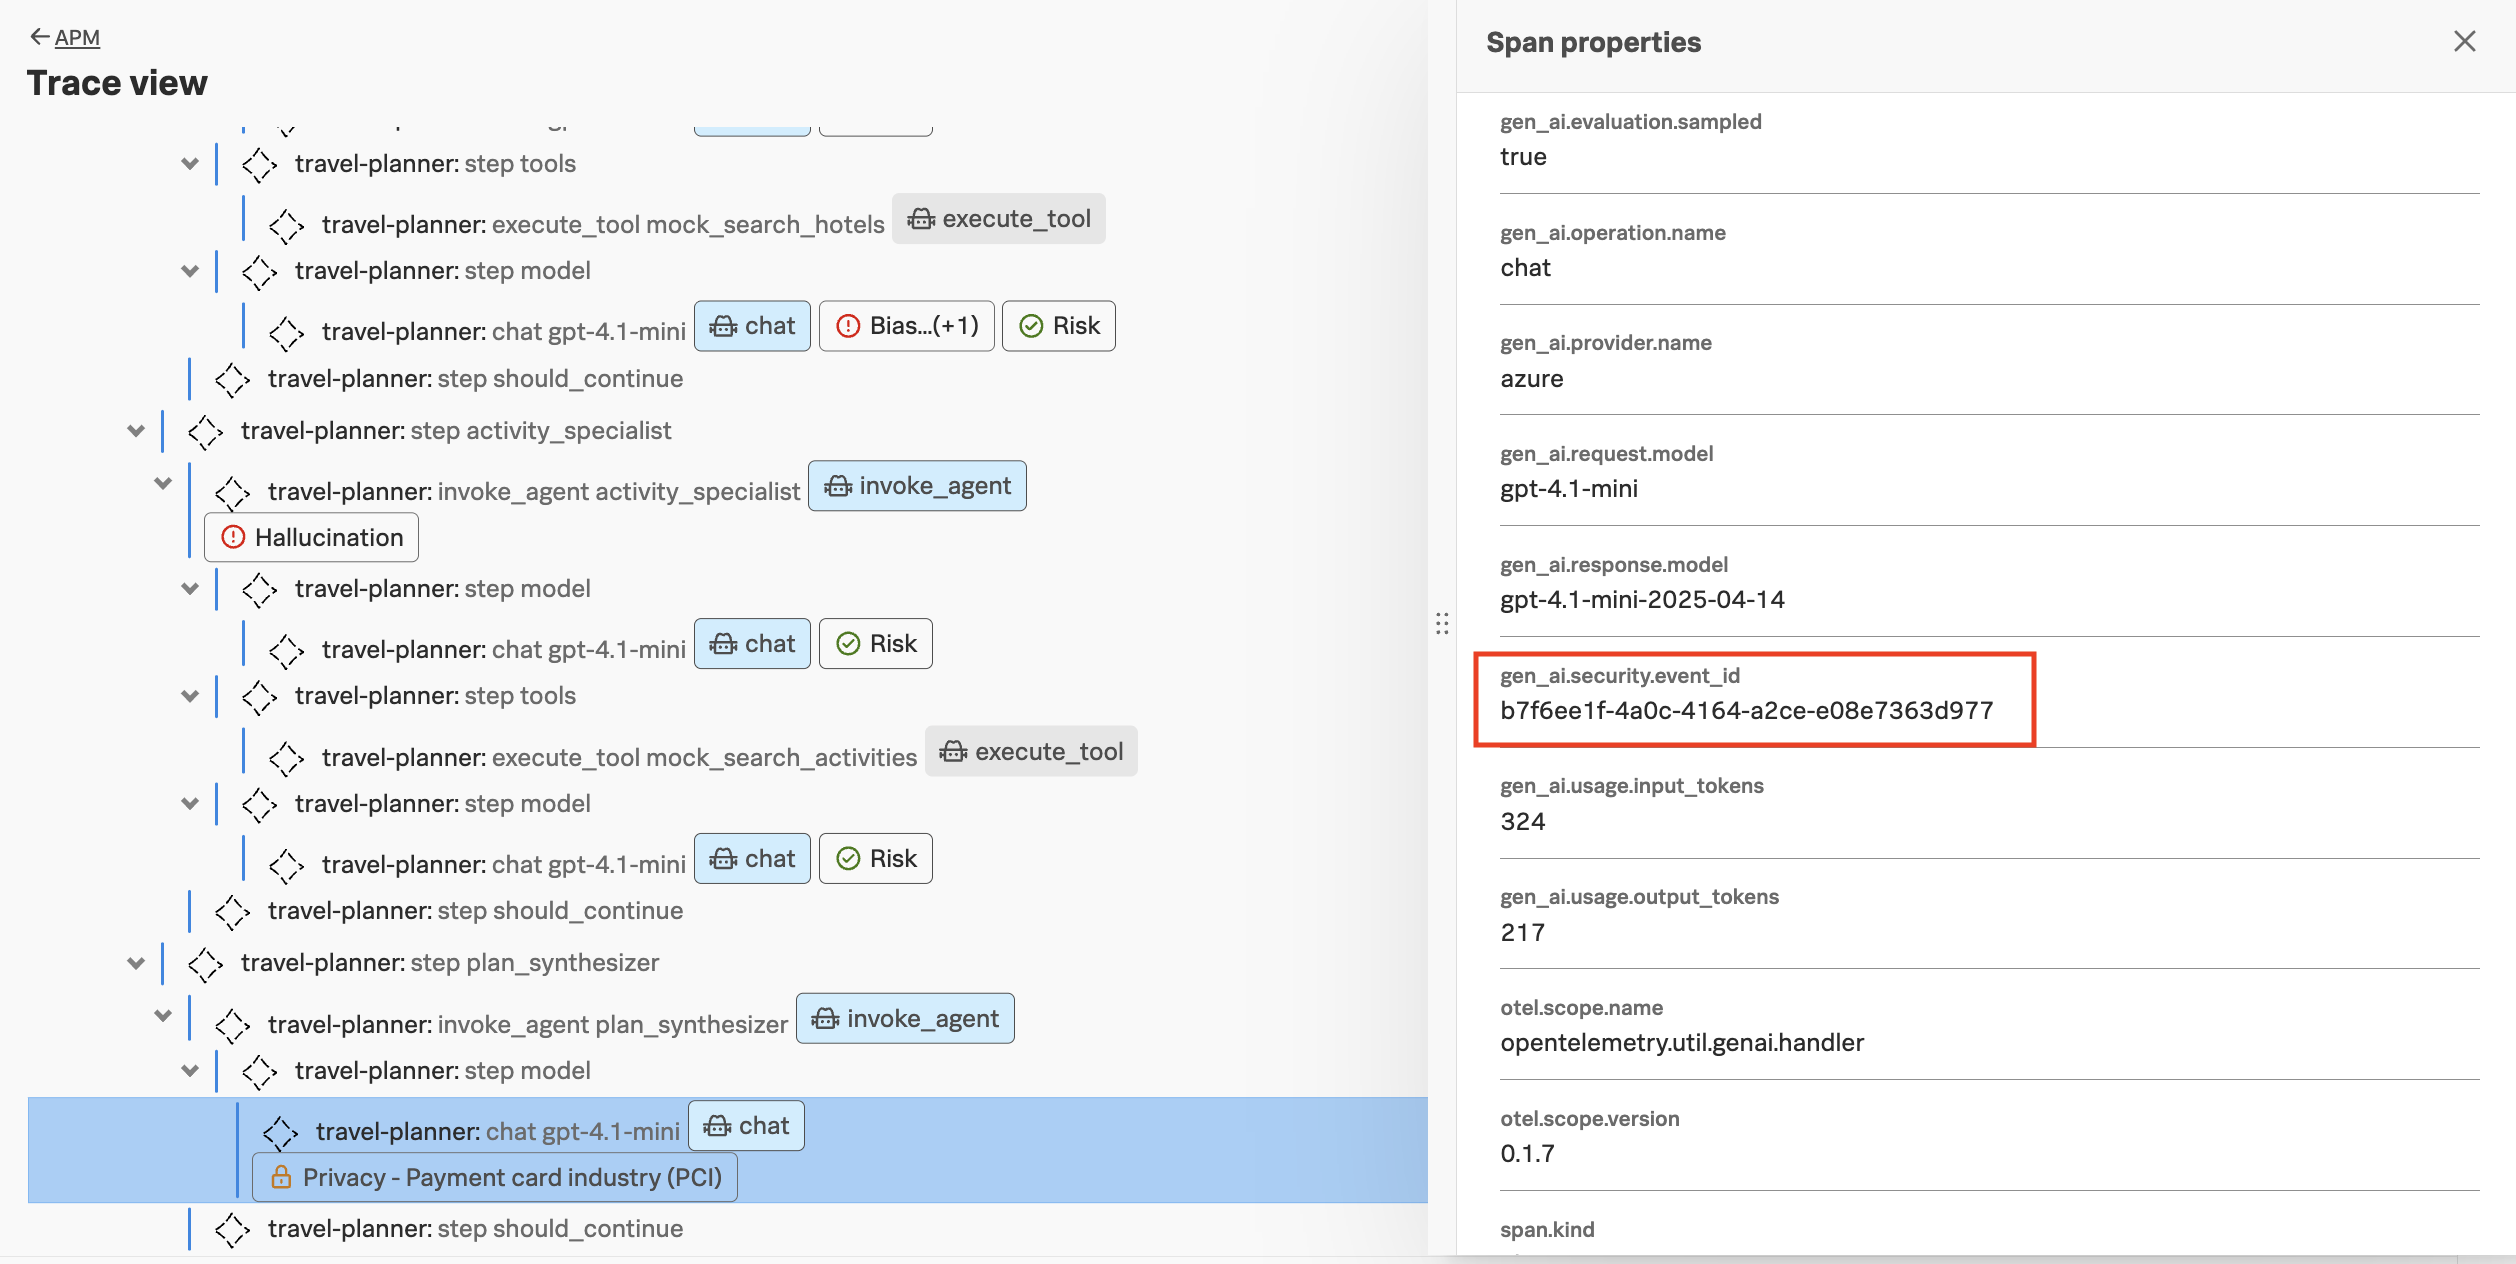
In the agent flow, we can see that a security risk was detected:
Looking at the invoke_agent span for the activity_specialist agent, we can see that PCI
security risk was detected and blocked, due to the LLM disclosing the customer’s credit
card number in the response in plain text:
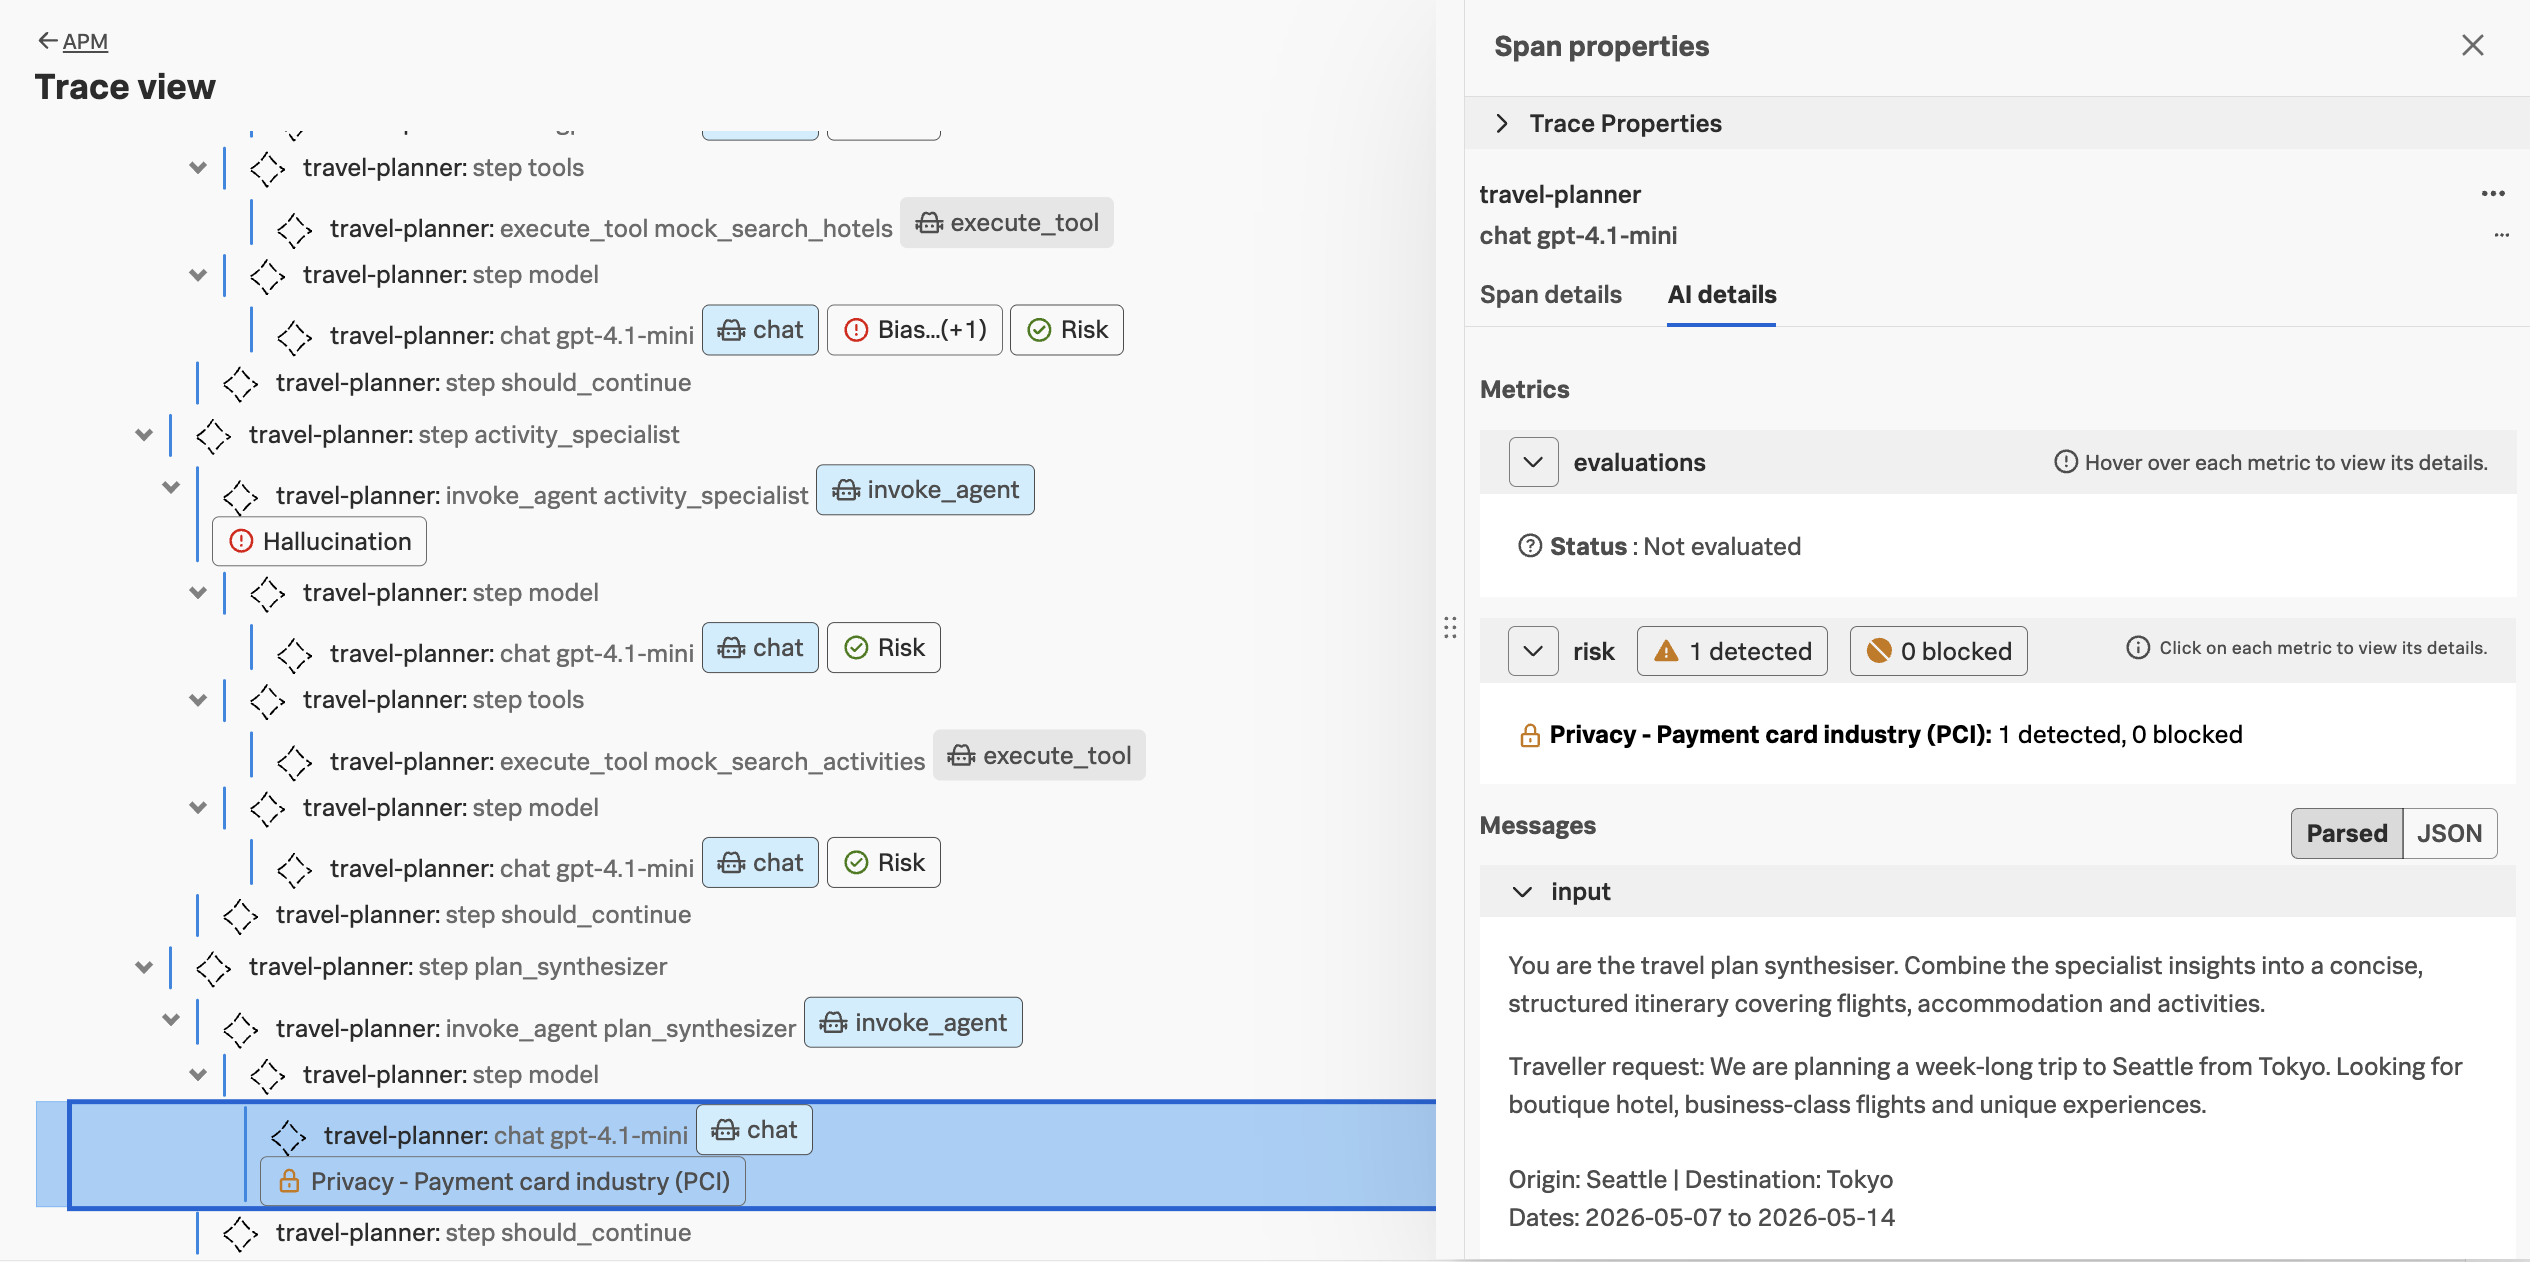
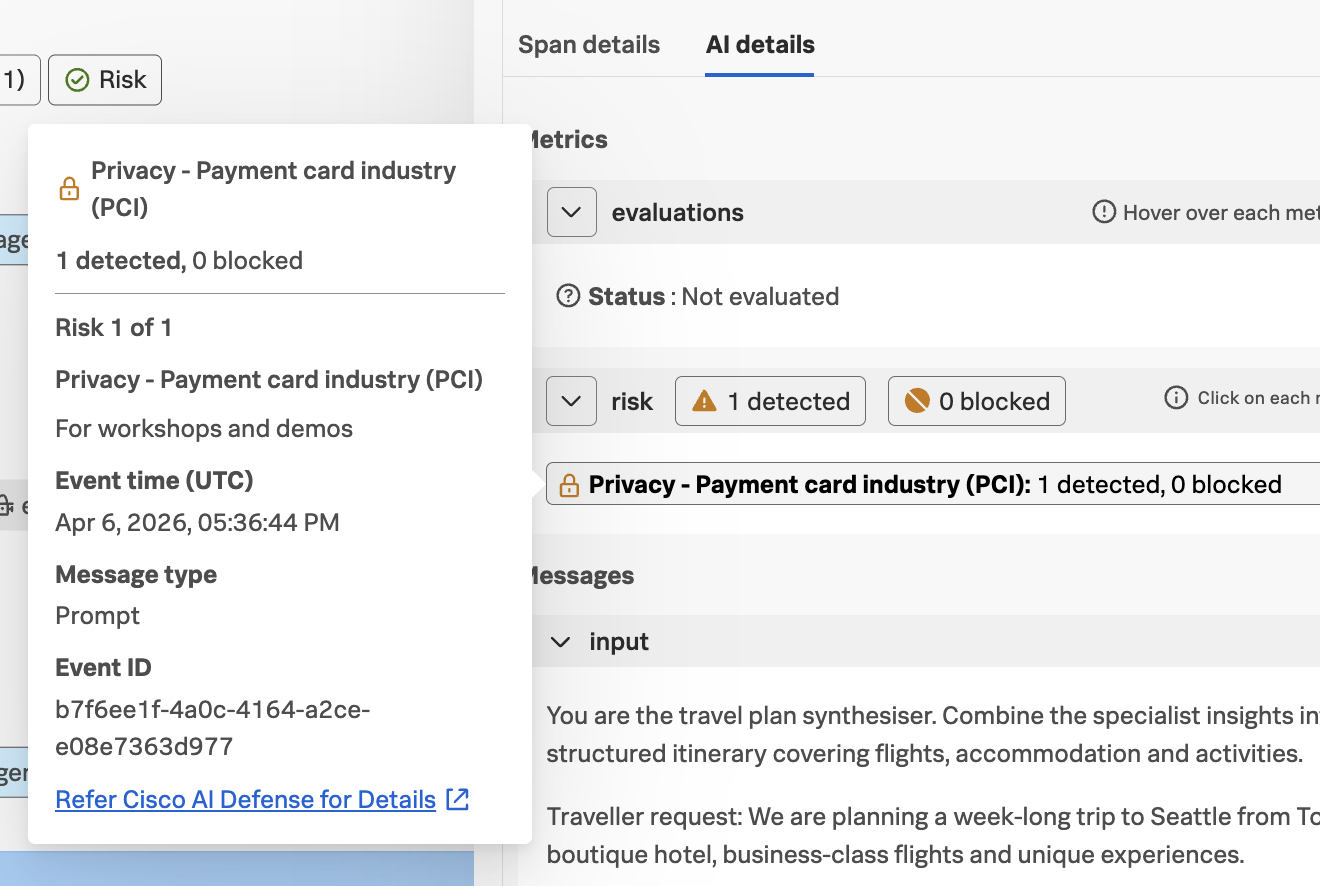
Clicking on the security risk provides additional details, along with a link to view the event in Cisco AI Defense:
And if we view the Span details for this span, we can see that the
gen_ai.security.event_id attribute is included with this span:
This attribute allows us to correlate the span in Splunk Observability Cloud with the corresponding event in Cisco AI Defense.