Review Agent Trace Data
10 minutesReview LLM Provider Configuration
Splunk Observability Cloud includes an integration that allows you to connect a Large Language Model (LLM). Splunk uses this connection to evaluate the semantic quality of LLM responses generated by your applications.
This integration has already been configured in the workshop organization.
To view the configuration, navigate to Data Management → Deployed Integrations, search for LLM Providers, and select it. You should see the following provider:
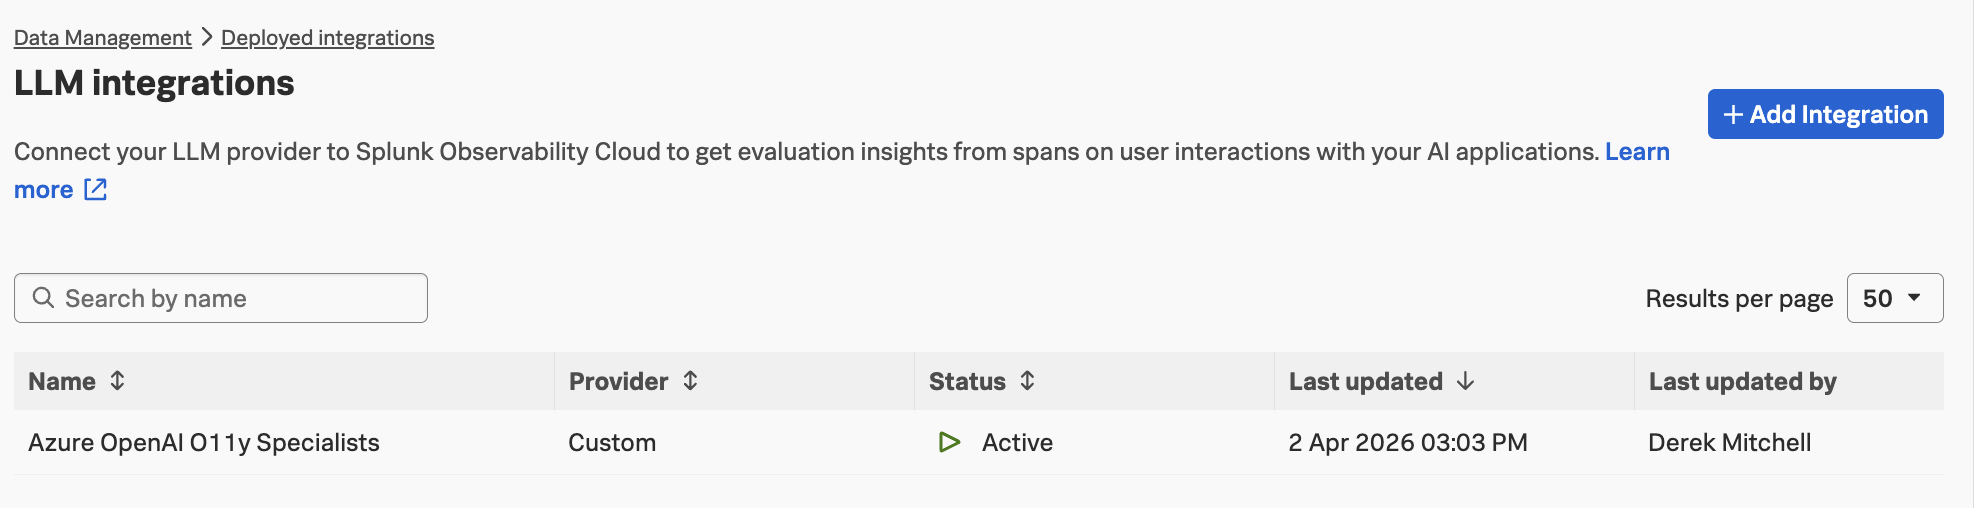
Click on the Azure OpenAI O11y Specialists provider to view the details:
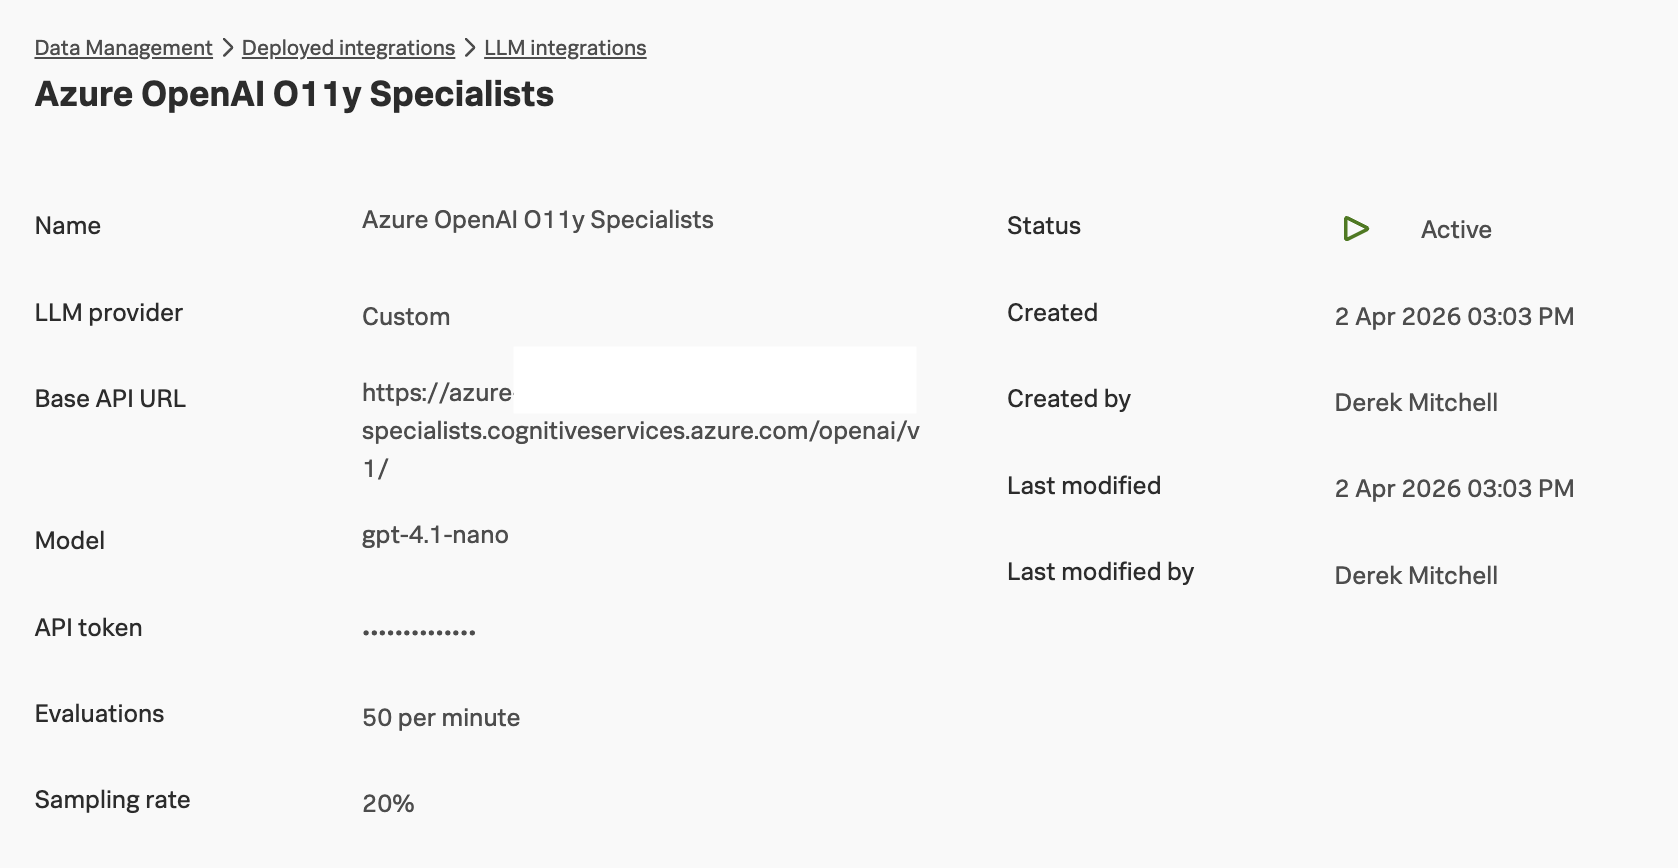
In this organization, the sampling rate is set to 20%. This means that, on average, Splunk evaluates the semantic quality of 20% of the LLM responses generated by the application.
A rate limit of 50 evaluations per minute is also configured. Both the sampling rate and the rate limit can be adjusted depending on customer needs. Higher sampling rates provide more evaluation data, but they also increase token usage and associated costs.
Review AI Agent Monitoring Configuration
Splunk Observability Cloud also includes a page that allows you to configure which data source is used for storing details related to AI Agent Monitoring. The choices include:
- Data source – Splunk Observability Cloud
- Data source – Splunk logs
You can see these settings by navigating to Settings -> AI Agent Monitoring:
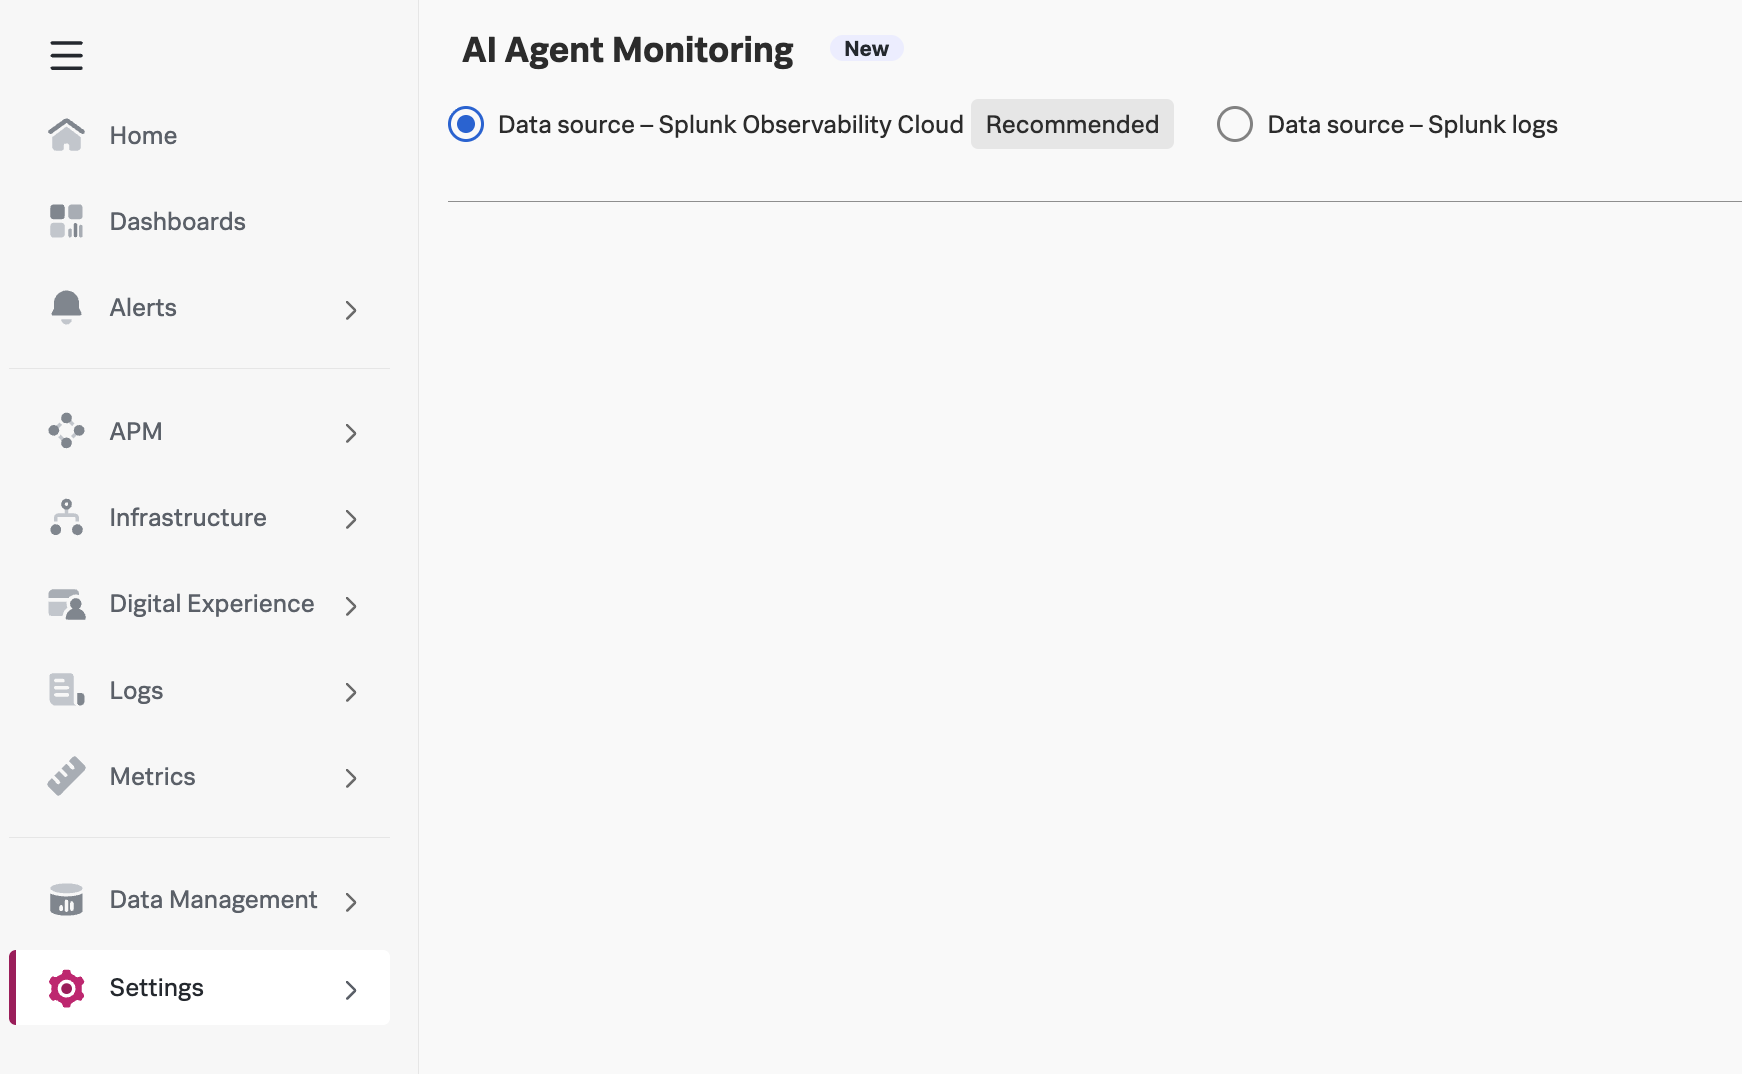
Splunk recommends utilizing Splunk Observability Cloud for storing AI Agent Monitoring related details. This is the setting we’ve used for this workshop.
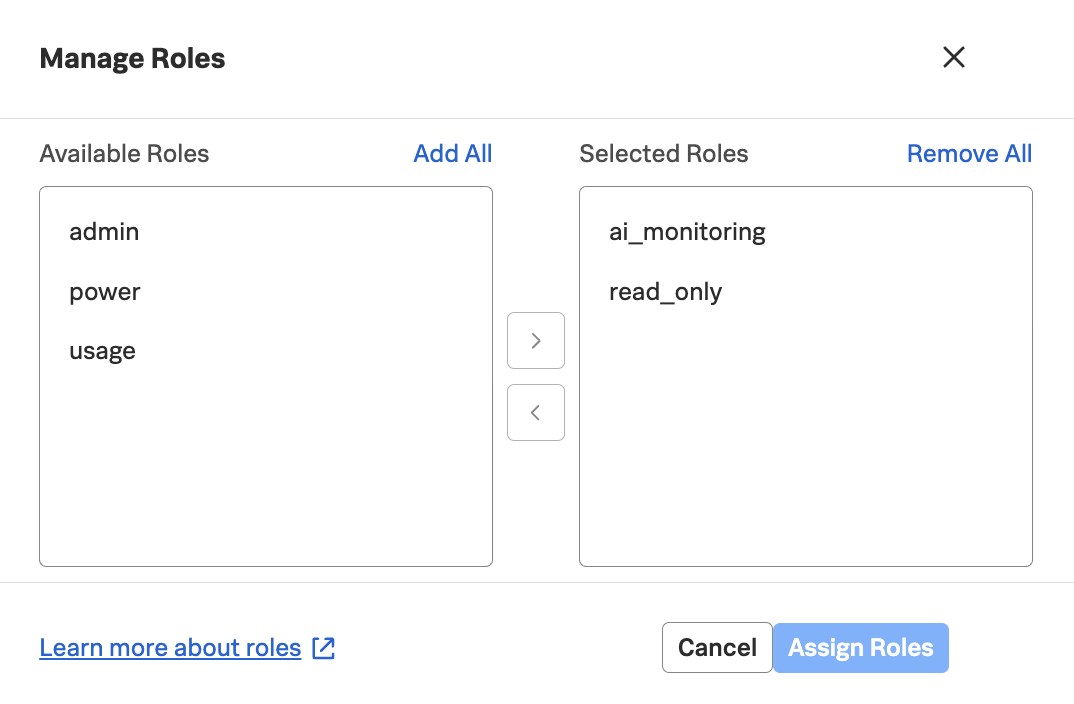
Review AI Monitoring Permissions
Due to the potentially sensitive nature of LLM conversation data, a new role called ai_monitoring
has been added to Splunk Observability Cloud to control who can access and view this information:
View Trace Data in Splunk Observability Cloud
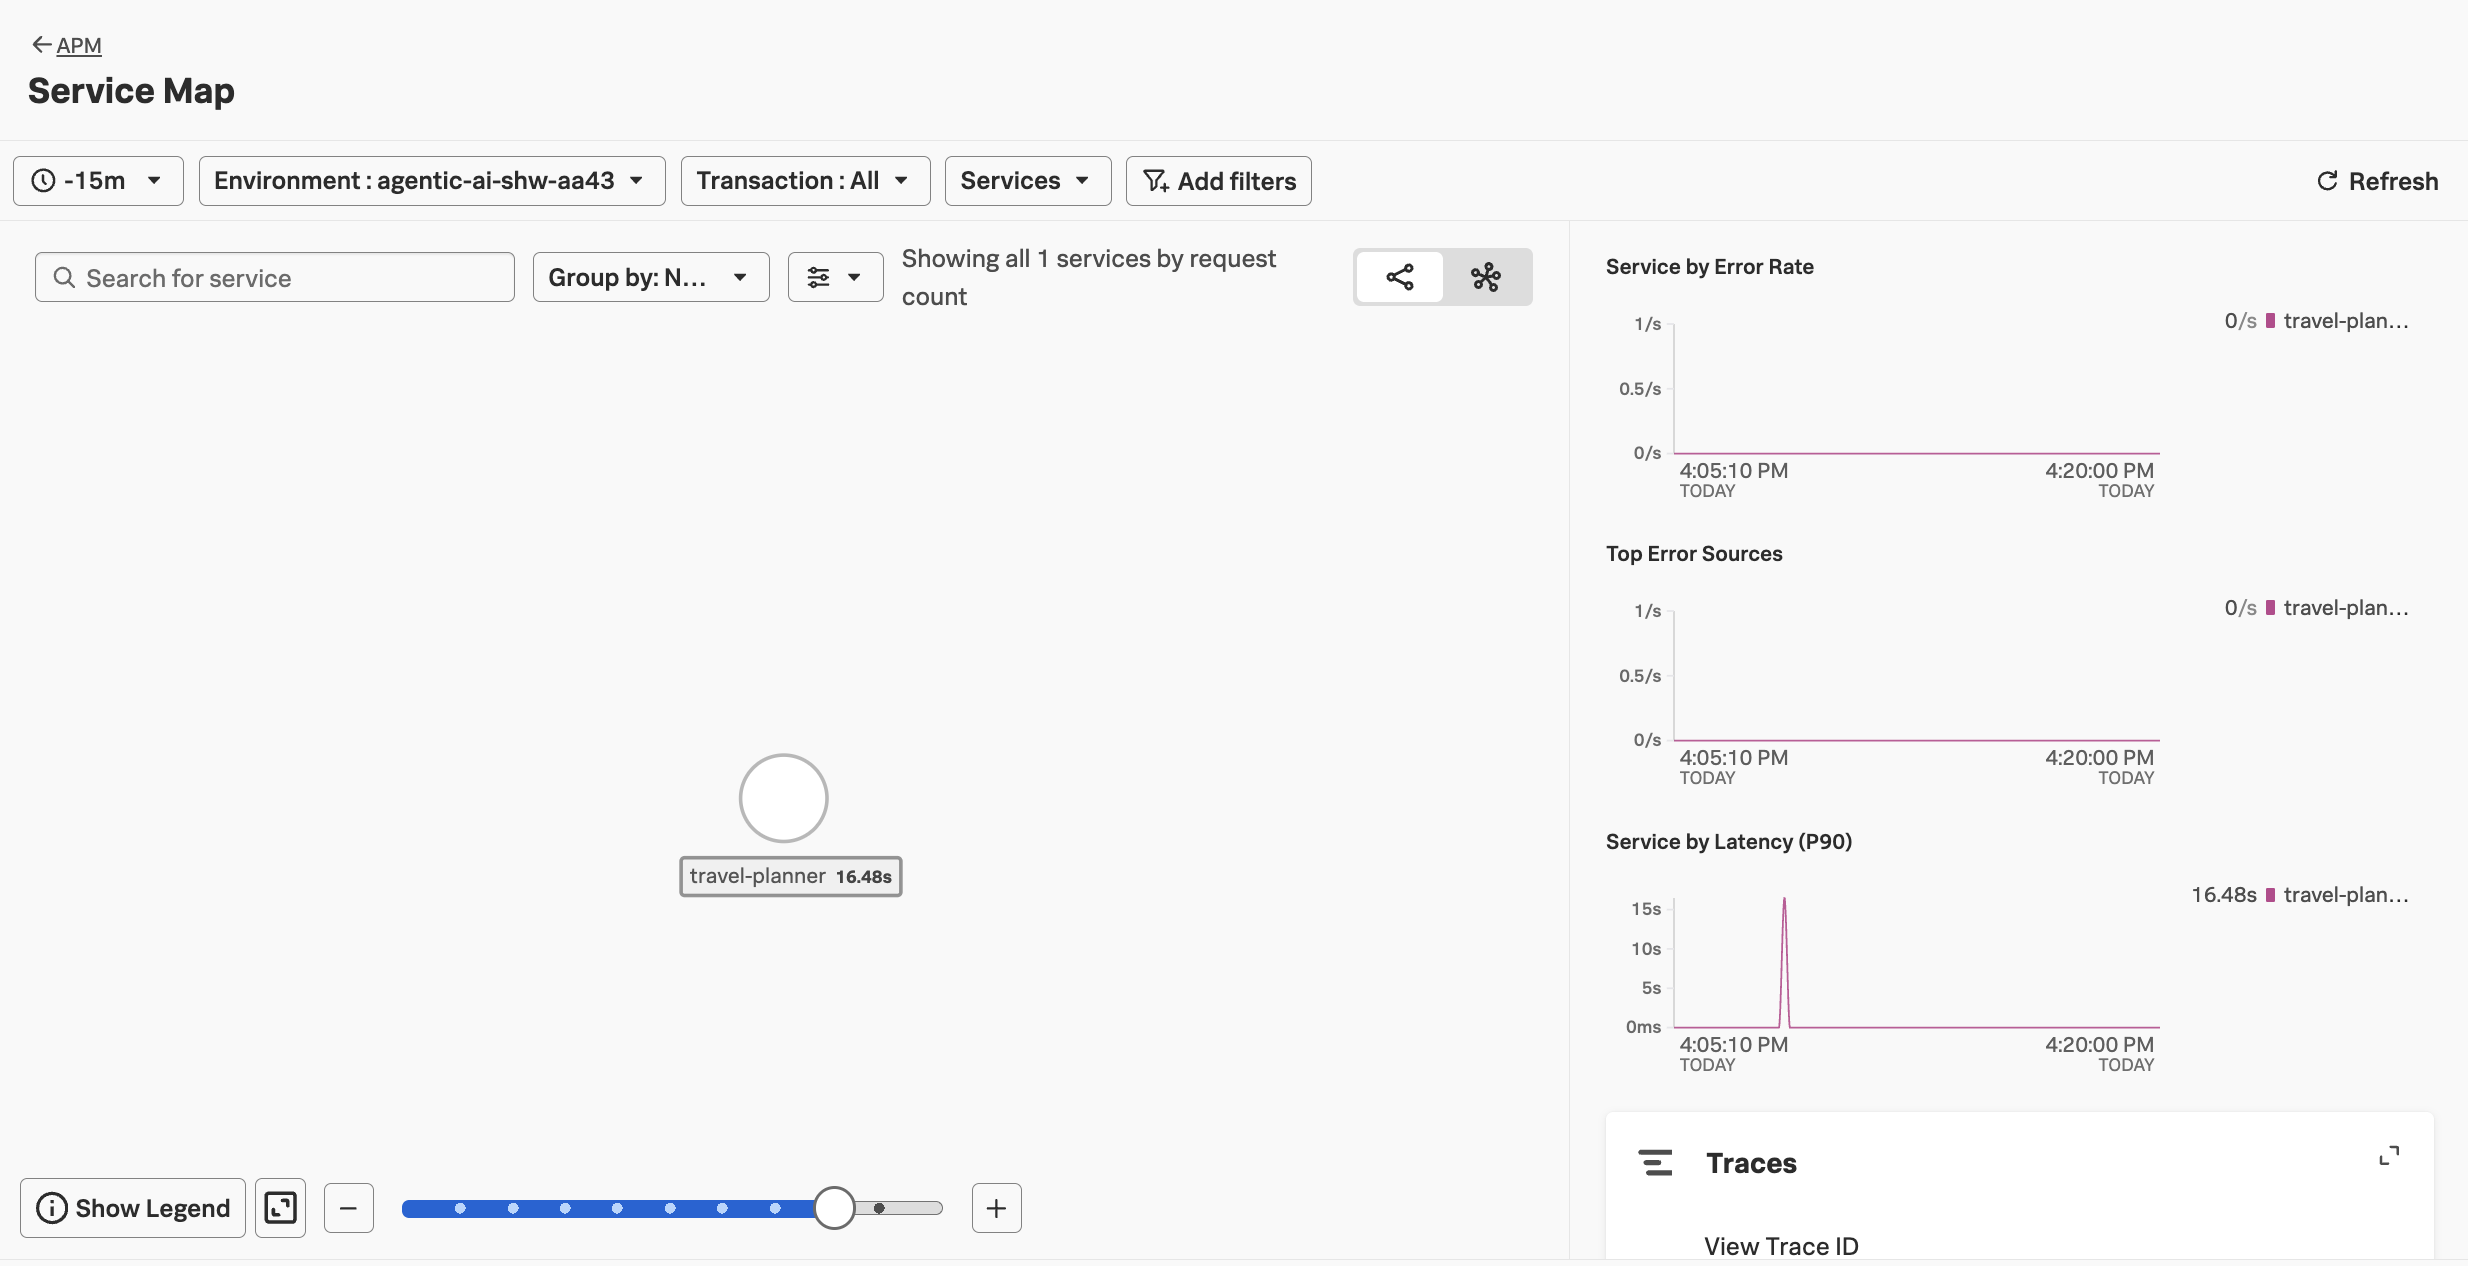
In Splunk Observability Cloud, navigate to APM and then select Service Map.
Ensure your environment name is selected (e.g. agentic-ai-$INSTANCE).
Tip: use the
echo $INSTANCEcommand if you’ve forgotten your instance name
You should see a service map that looks like the following:
Click on Traces on the right-hand side menu. Then select one of the slower running
traces. It should look like the following example:
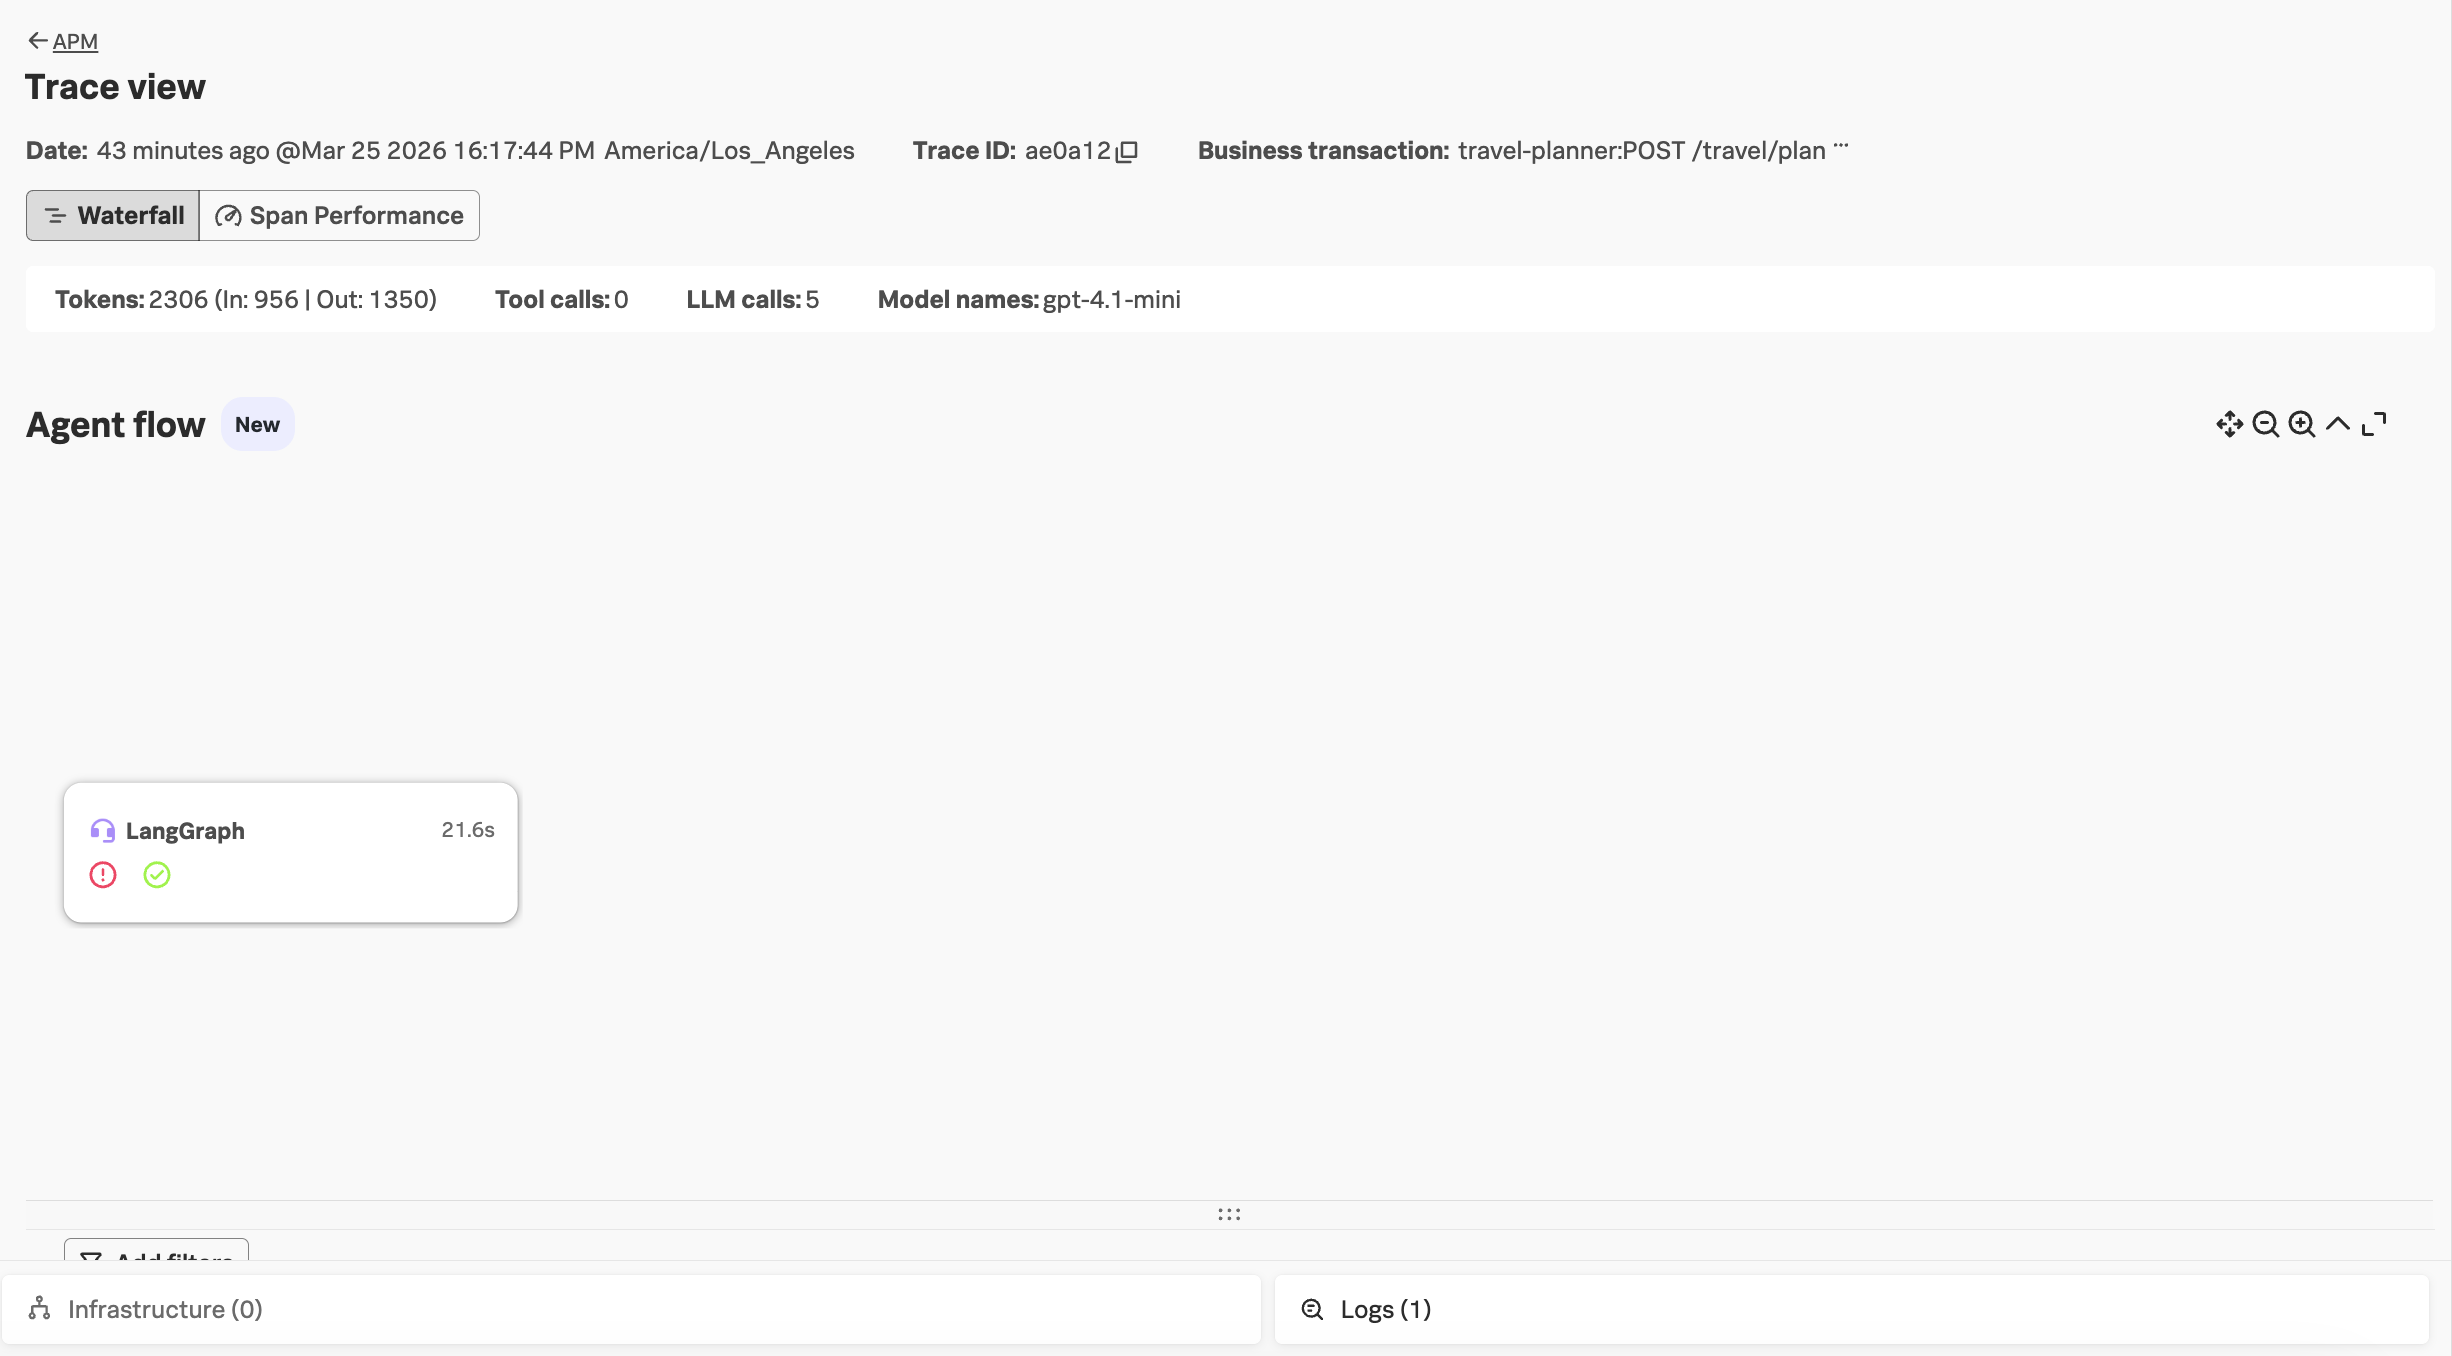
Notice that we don’t see our agent names in the Agent flow section (i.e. coordinator, flight-specialist, etc.).
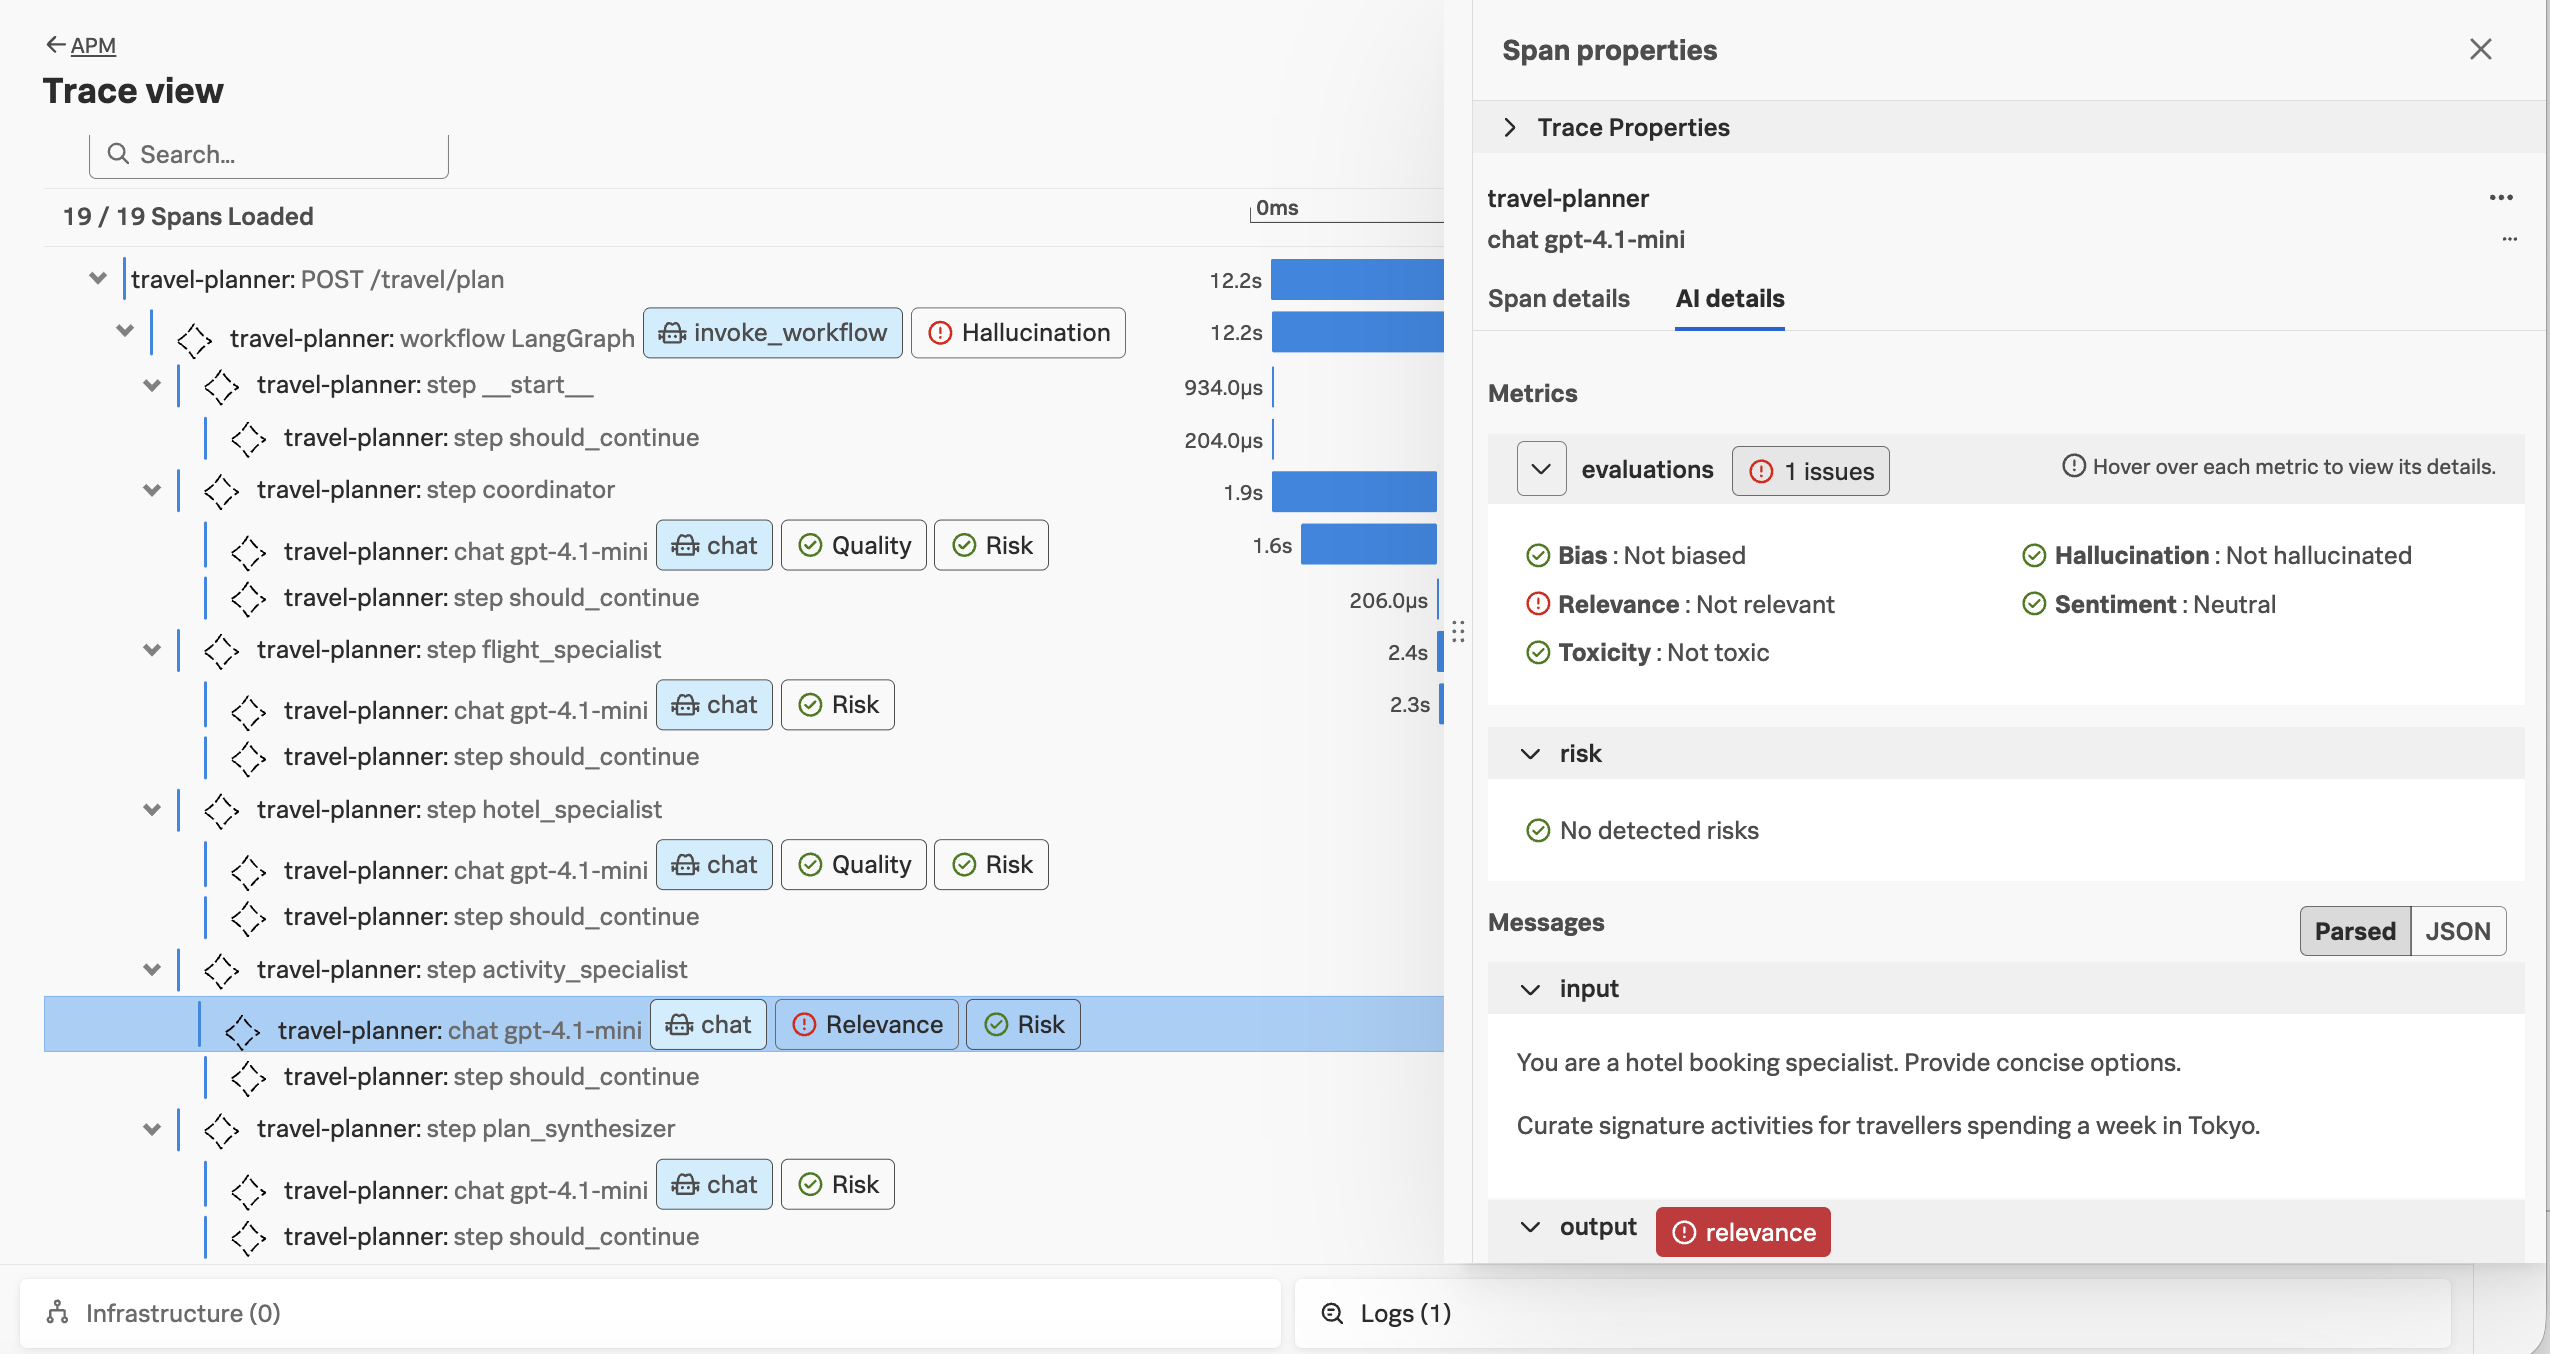
Scrolling down, let’s click on one of the AI interactions in the trace. Here, we can see that the prompt and response has been captured. We can also see the results of the semantic quality evaluations for this trace:
Next, navigate to APM and then select AI agents. Ensure your environment name
is selected (e.g. agentic-ai-$INSTANCE). You’ll notice that the page is empty!
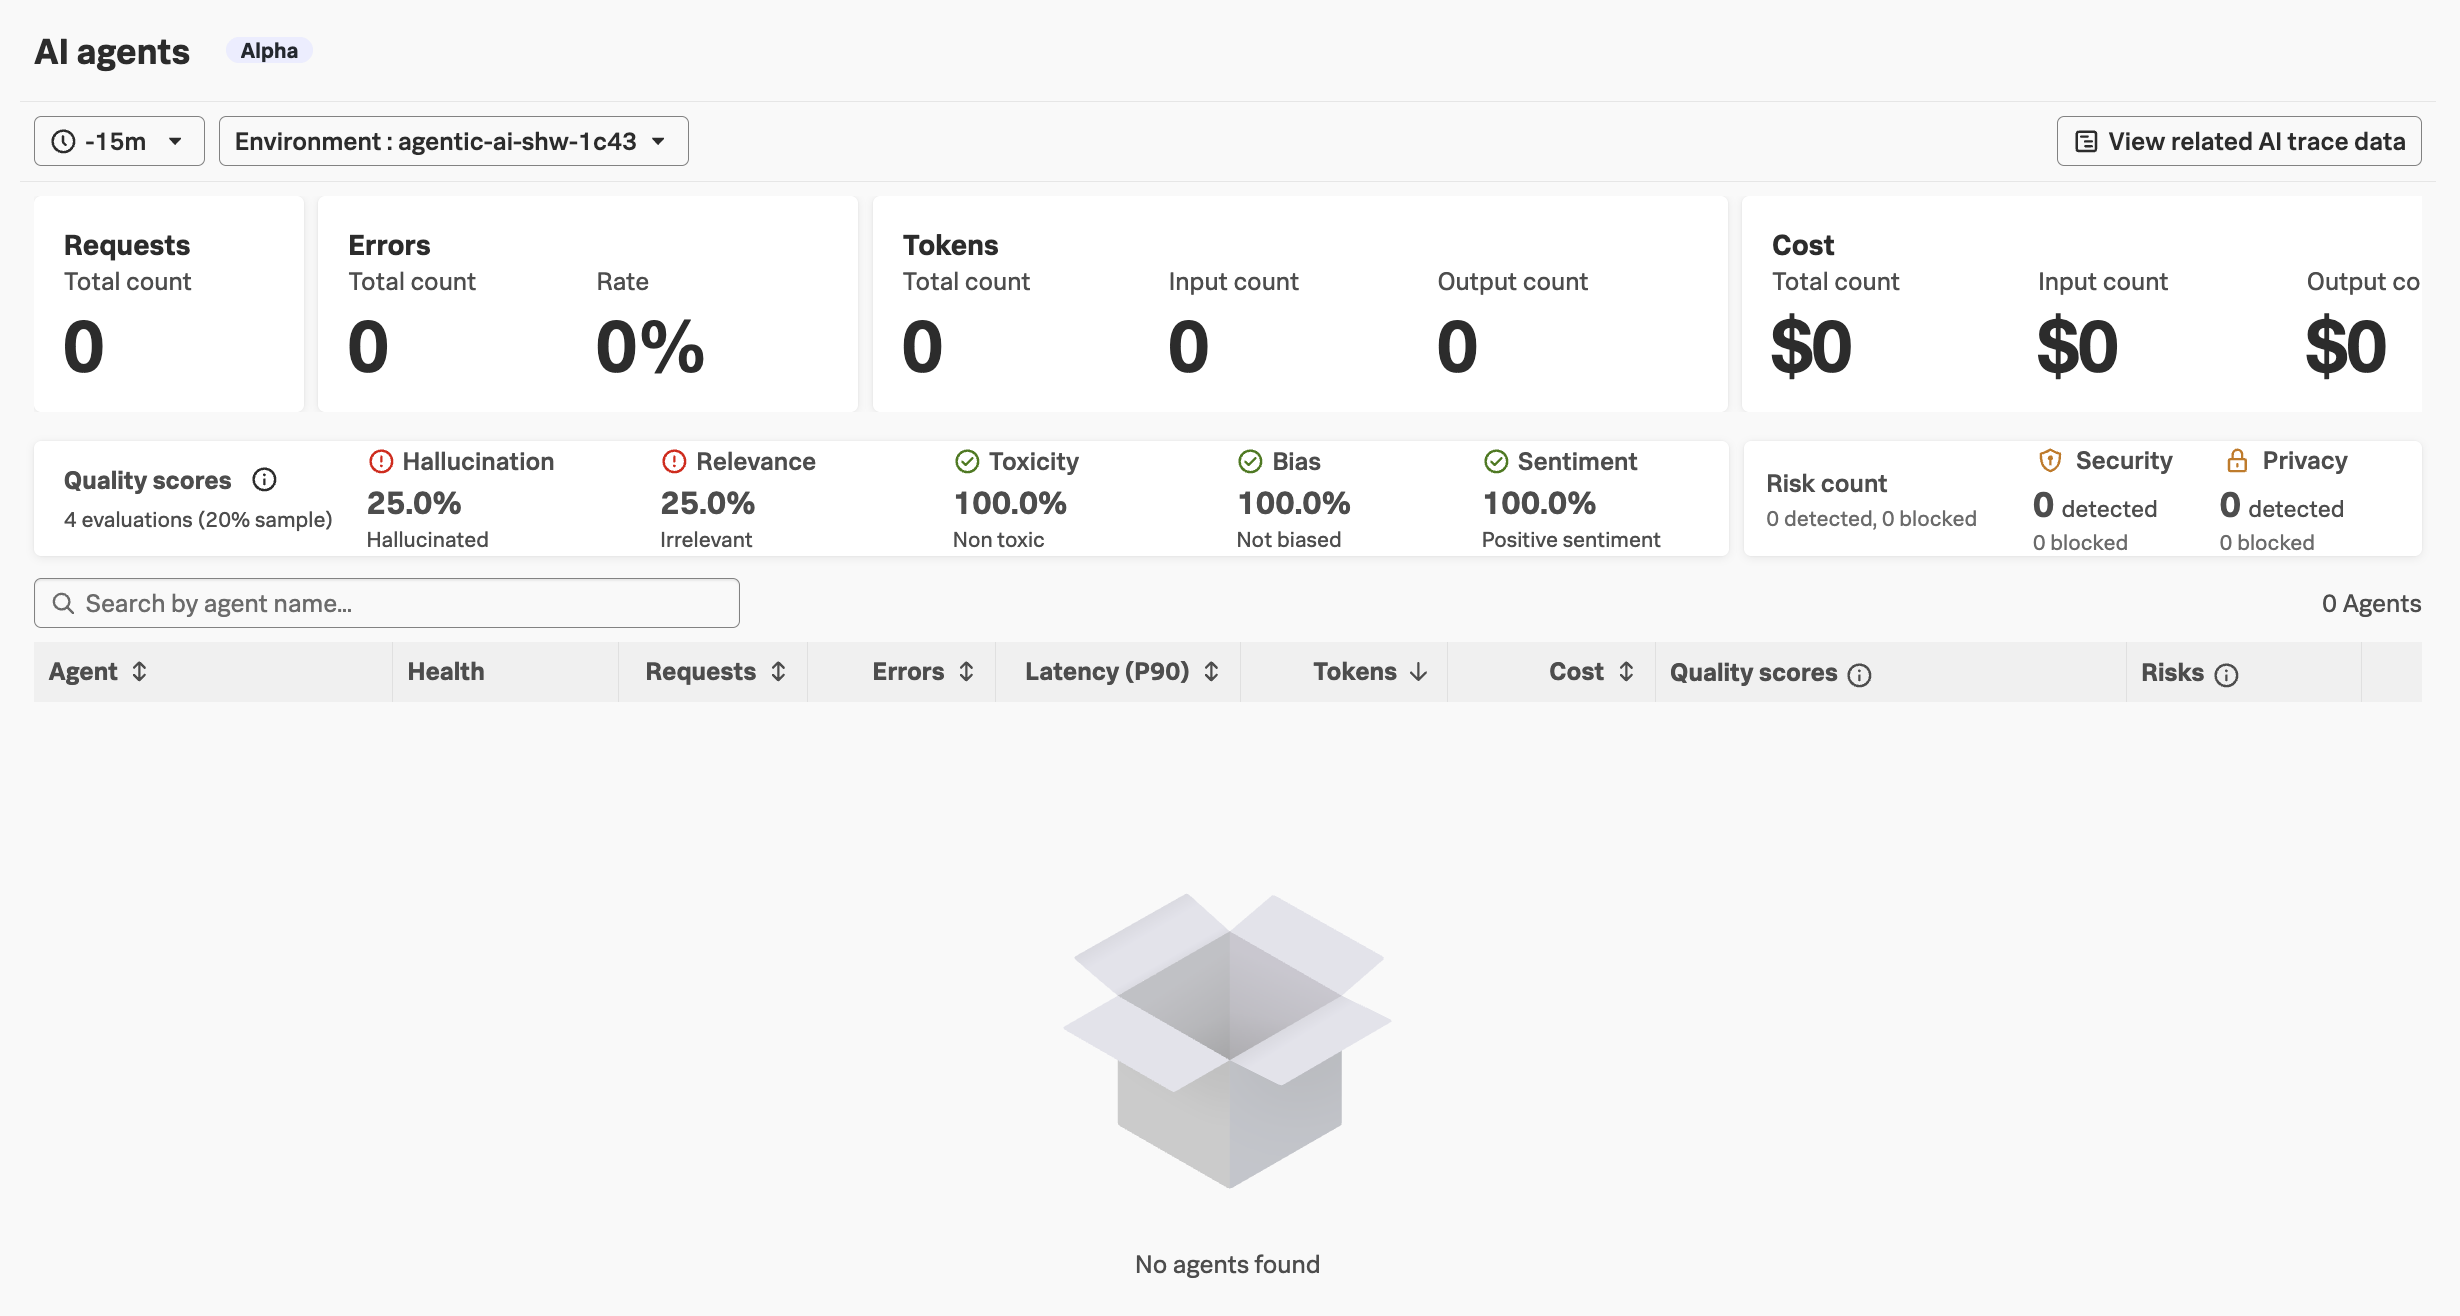
We’ll address these instrumentation issues in the next section.