OpenTelemetry Collector Service
OTLP HTTP Exporter
In the Exporters section of the workshop, we configured the otlphttp exporter to send metrics to Splunk Observability Cloud. We now need to enable this under the metrics pipeline.
Update the exporters section to include otlphttp/splunk under the metrics pipeline:
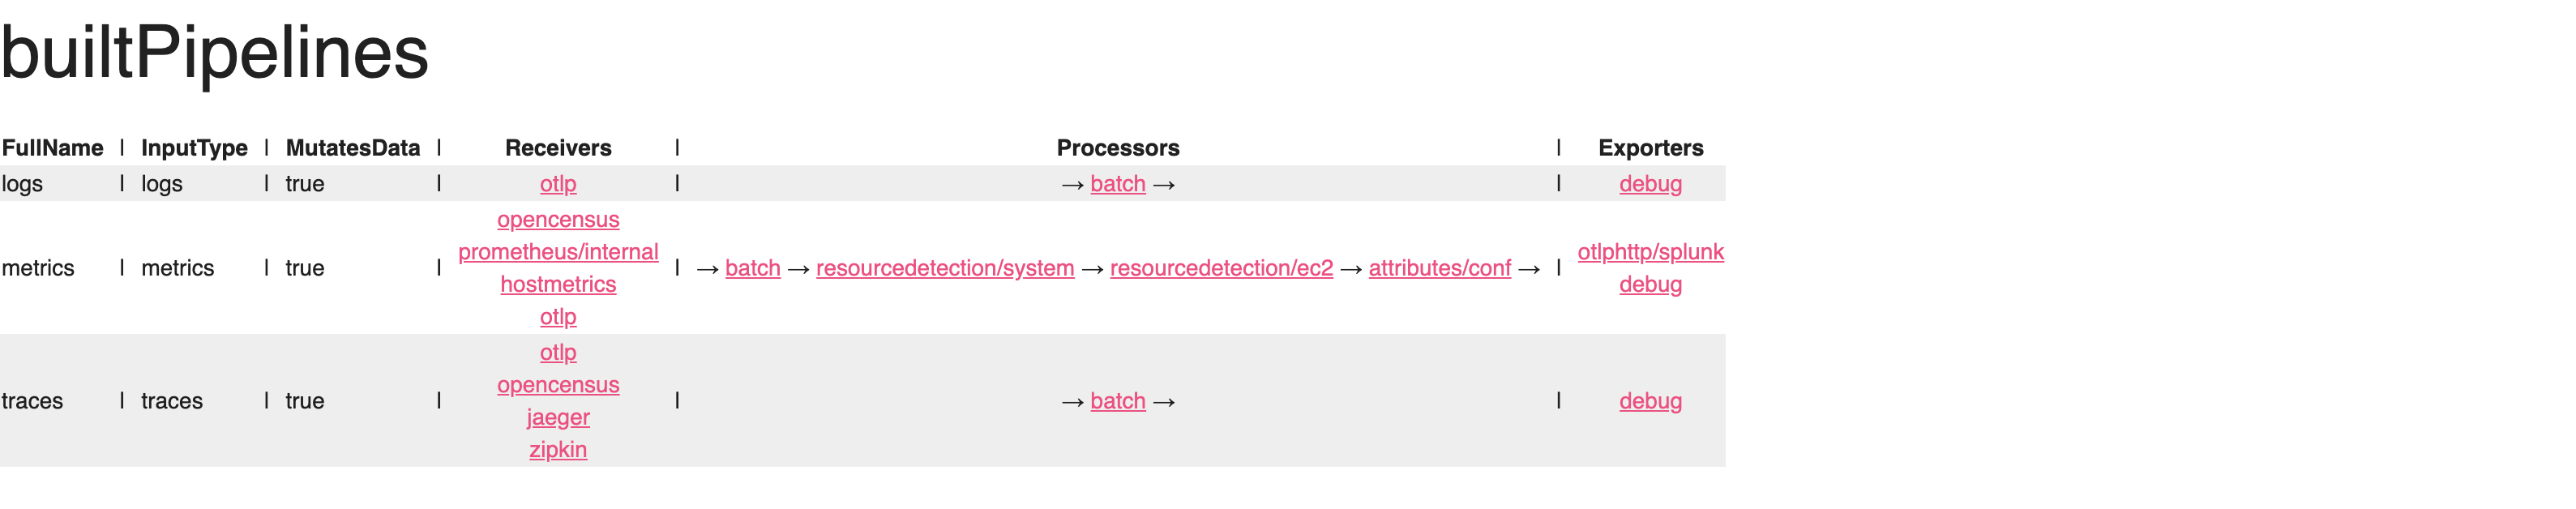
service:

  pipelines:

    traces:
      receivers: [otlp, opencensus, jaeger, zipkin]
      processors: [batch]
      exporters: [debug]

    metrics:
      receivers: [hostmetrics, otlp, opencensus, prometheus/internal]
      processors: [batch, resourcedetection/system, resourcedetection/ec2, attributes/conf]
      exporters: [debug, otlphttp/splunk]
Ninja: Observing the collector internals
The collector captures internal signals about its behavior this also includes additional signals from running components. The reason for this is that components that make decisions about the flow of data need a way to surface that information as metrics or traces.
Why monitor the collector?
This is somewhat of a chicken and egg problem of, “Who is watching the watcher?”, but it is important that we can surface this information. Another interesting part of the collector’s history is that it existed before the Go metrics’ SDK was considered stable so the collector exposes a Prometheus endpoint to provide this functionality for the time being.
Considerations
Monitoring the internal usage of each running collector in your organization can contribute a significant amount of new Metric Time Series (MTS). The Splunk distribution has curated these metrics for you and would be able to help forecast the expected increases.
The Ninja Zone
To expose the internal observability of the collector, some additional settings can be adjusted:
service:
  telemetry:
    logs:
      level: <info|warn|error>
      development: <true|false>
      encoding: <console|json>
      disable_caller: <true|false>
      disable_stacktrace: <true|false>
      output_paths: [<stdout|stderr>, paths...]
      error_output_paths: [<stdout|stderr>, paths...]
      initial_fields:
        key: value
    metrics:
      level: <none|basic|normal|detailed>
      # Address binds the promethues endpoint to scrape
address: <hostname:port>service:
telemetry:
logs:
level: info
encoding: json
disable_stacktrace: true
initial_fields:
instance.name: ${env:INSTANCE}
metrics:
address: localhost:8888 References
Final configuration
Check-inReview your final configuration
| |
Tip
It is recommended that you validate your configuration file before restarting the collector. You can do this by pasting the contents of your config.yaml file into otelbin.io.
ScreenshotOTelBin
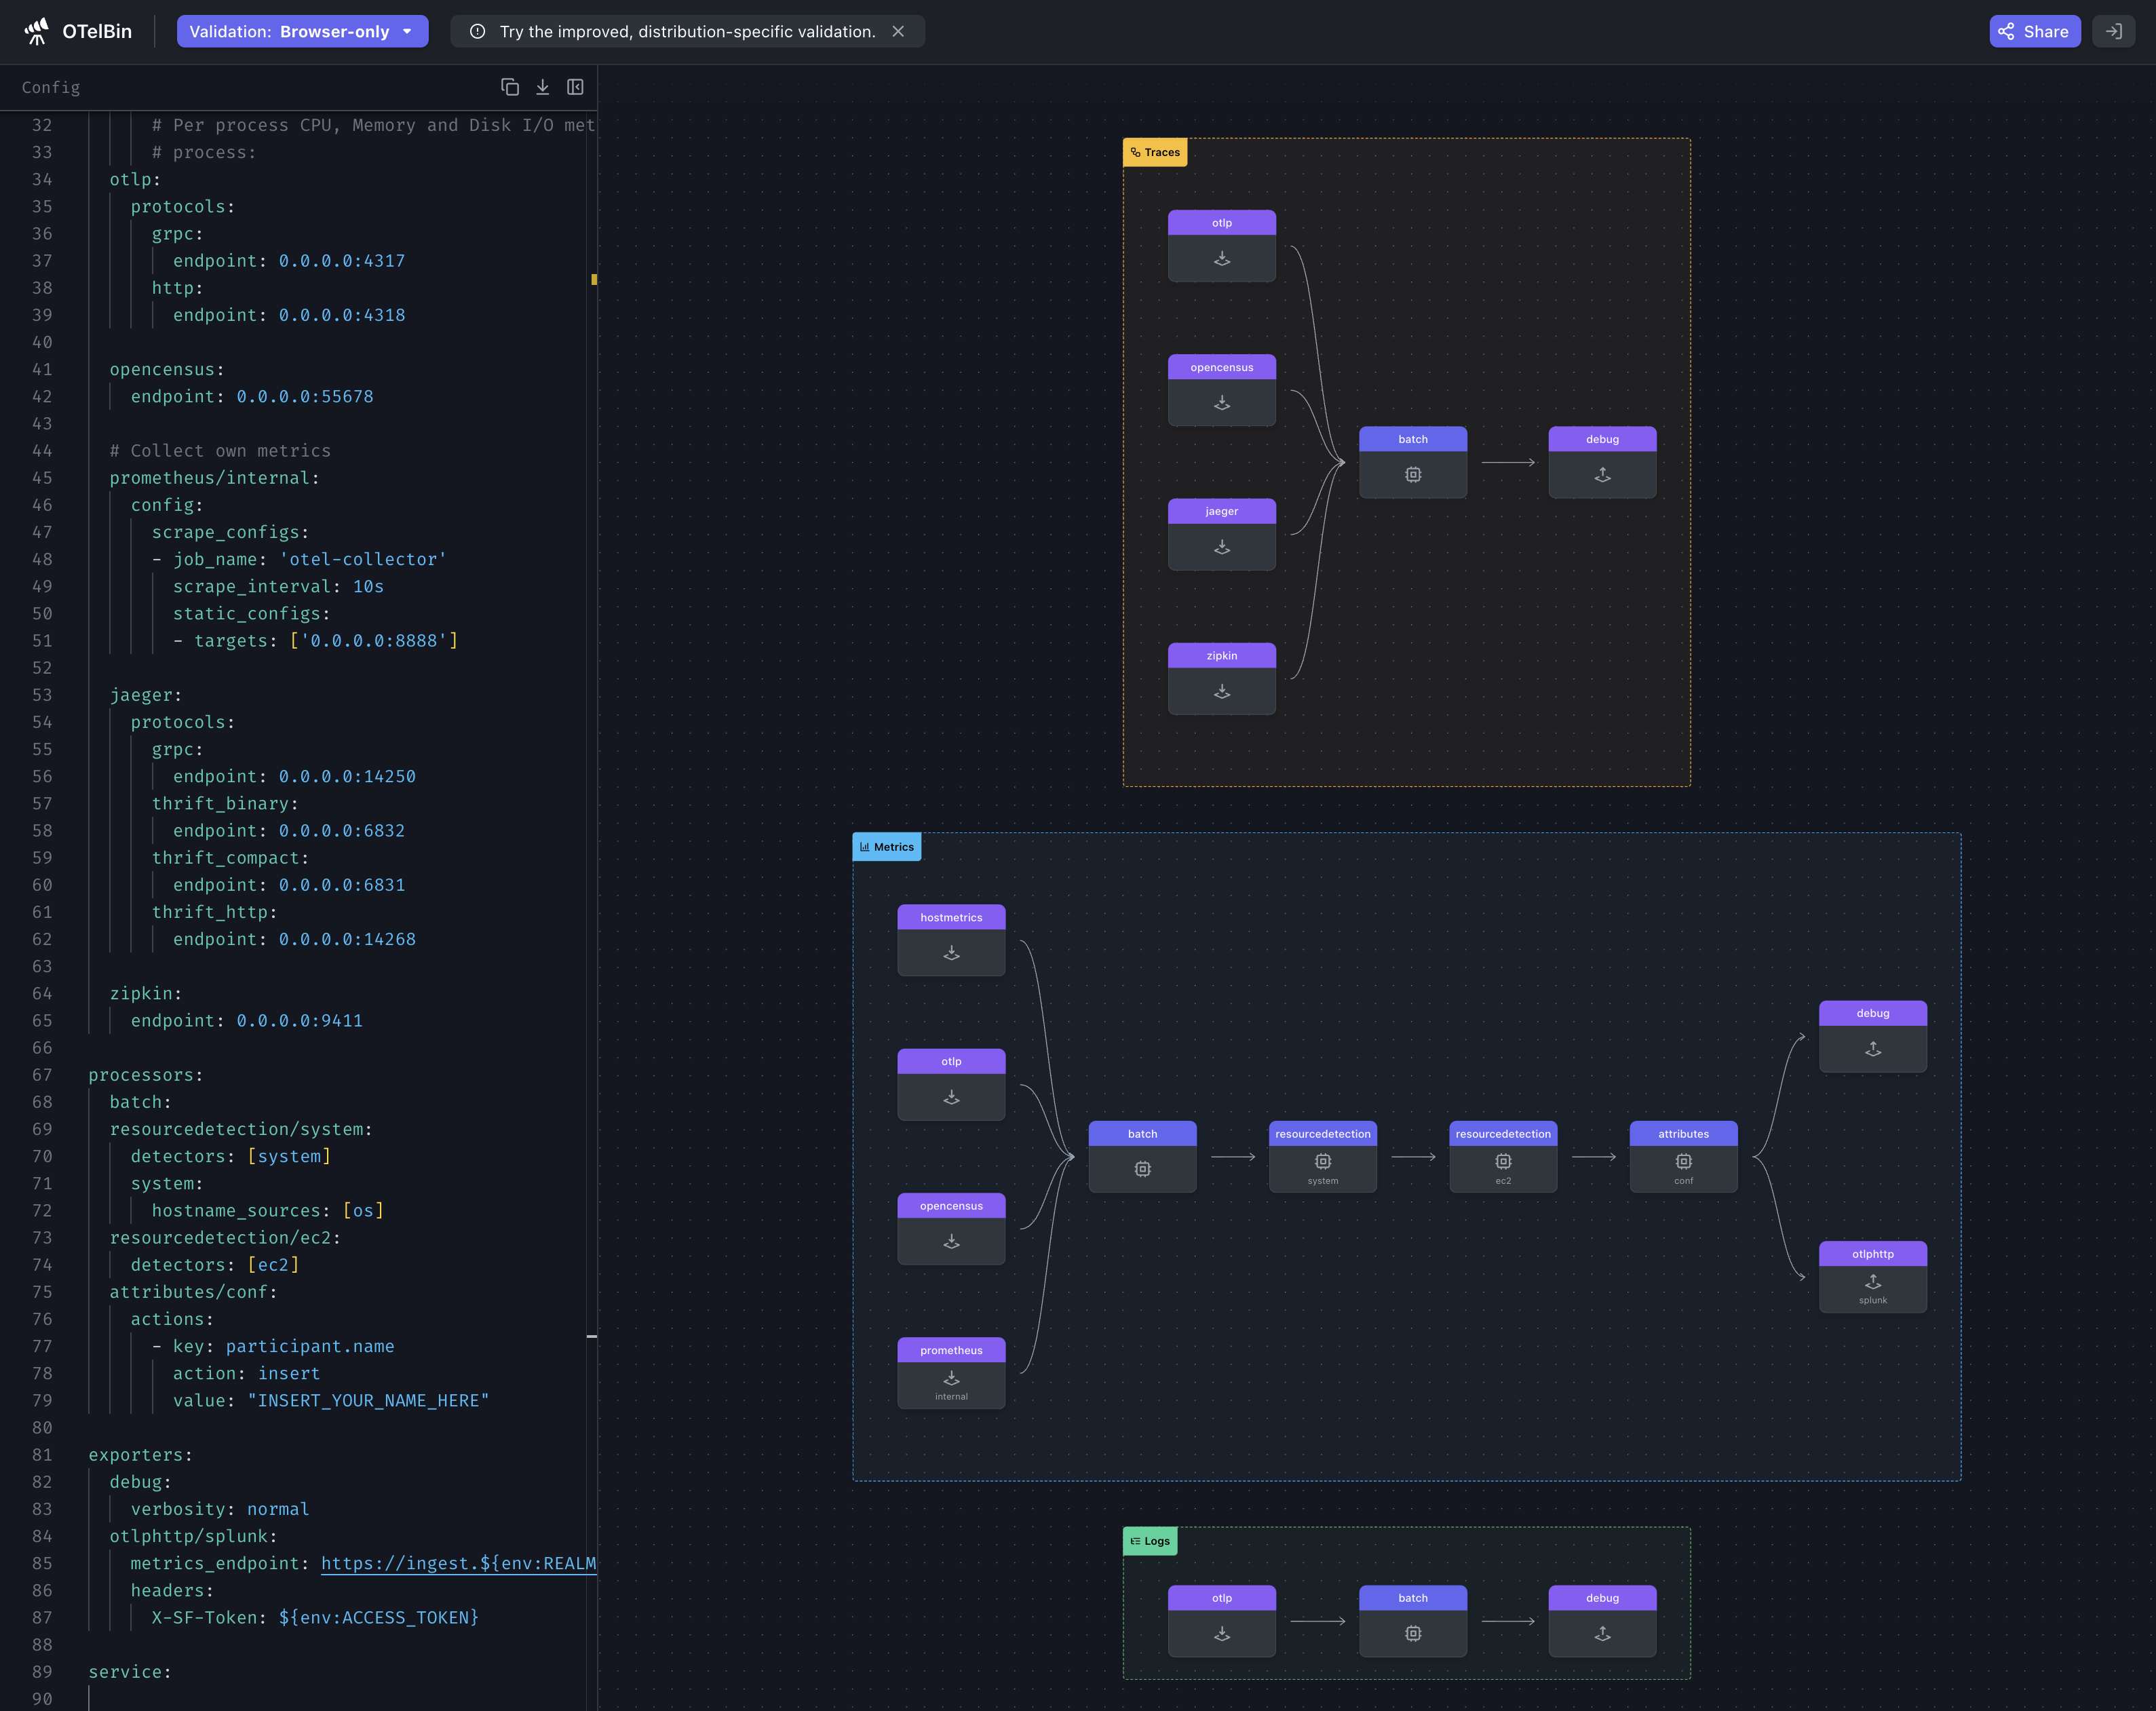
Now that we have a working configuration, let’s start the collector and then check to see what zPages is reporting.
otelcol-contrib --config=file:/etc/otelcol-contrib/config.yamlOpen up zPages in your browser: http://localhost:55679/debug/pipelinez (change localhost to reflect your own environment).