Troubleshoot OpenTelemetry Collector Issues
20 minutesIn the previous section, we added the debug exporter to the collector configuration, and made it part of the pipeline for traces and logs. We see the debug output written to the agent collector logs as expected.
However, traces are no longer sent to o11y cloud. Let’s figure out why and fix it.
Review the Collector Config
Whenever a change to the collector config is made via a values.yaml file, it’s helpful
to review the actual configuration applied to the collector by looking at the config map:
Let’s review the pipelines for logs and traces in the agent collector config. They should look like this:
Do you see the problem? Only the debug exporter is included in the traces and logs pipelines.
The otlp_http and signalfx exporters that were present in the traces pipeline configuration previously are gone.
This is why we no longer see traces in o11y cloud. And for the logs pipeline, the splunk_hec/platform_logs
exporter has been removed.
How did we know what specific exporters were included before? To find out, we could have reverted our earlier customizations and then checked the config map to see what was in the traces pipeline originally. Alternatively, we can refer to the examples in the GitHub repo for splunk-otel-collector-chart which shows us what default agent config is used by the Helm chart.
How did these exporters get removed?
Let’s review the customizations we added to the values.yaml file:
When we applied the values.yaml file to the collector using helm upgrade, the
custom configuration got merged with the previous collector configuration.
When this happens, the sections of the yaml configuration that contain lists,
such as the list of exporters in the pipeline section, get replaced with what we
included in the values.yaml file (which was only the debug exporter).
Let’s Fix the Issue
So when customizing an existing pipeline, we need to fully redefine that part of the configuration.
Our values.yaml file should thus be updated as follows:
Let’s apply the changes:
And then check the agent config map:
This time, we should see a fully defined exporters pipeline for both logs and traces:
Reviewing the Log Output
The Splunk Distribution of OpenTelemetry .NET automatically exports logs enriched with tracing context
from applications that use Microsoft.Extensions.Logging for logging (which our sample app does).
Application logs are enriched with tracing metadata and then exported to a local instance of the OpenTelemetry Collector in OTLP format.
Let’s take a closer look at the logs that were captured by the debug exporter to see if that’s happening.
To tail the collector logs, we can use the following command:
Once we’re tailing the logs, we can use curl to generate some more traffic. Then we should see something like the following:
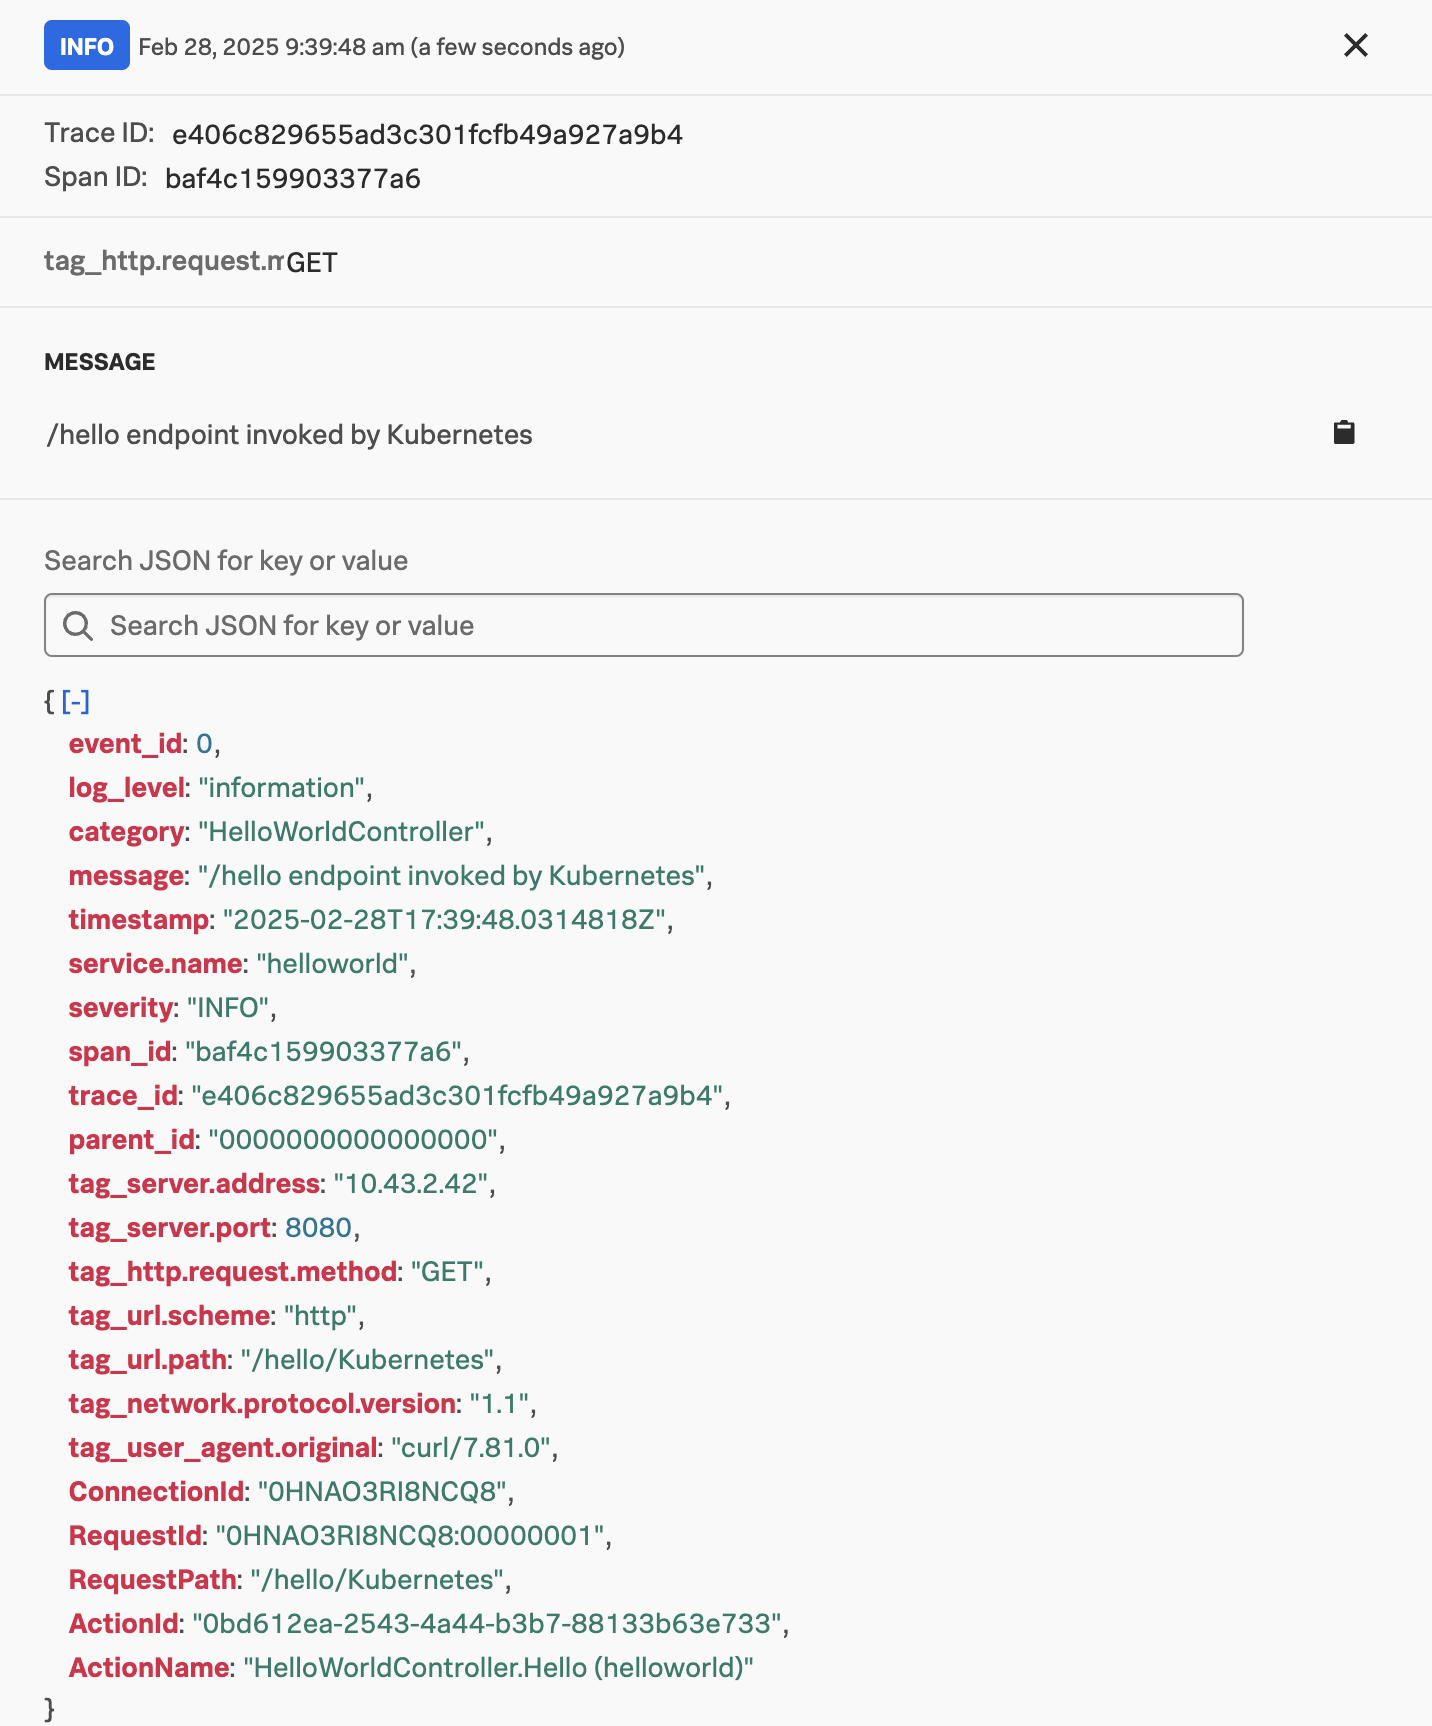
In this example, we can see that the Trace ID and Span ID were automatically written to the log output by the OpenTelemetry .NET instrumentation. This allows us to correlate logs with traces in Splunk Observability Cloud.
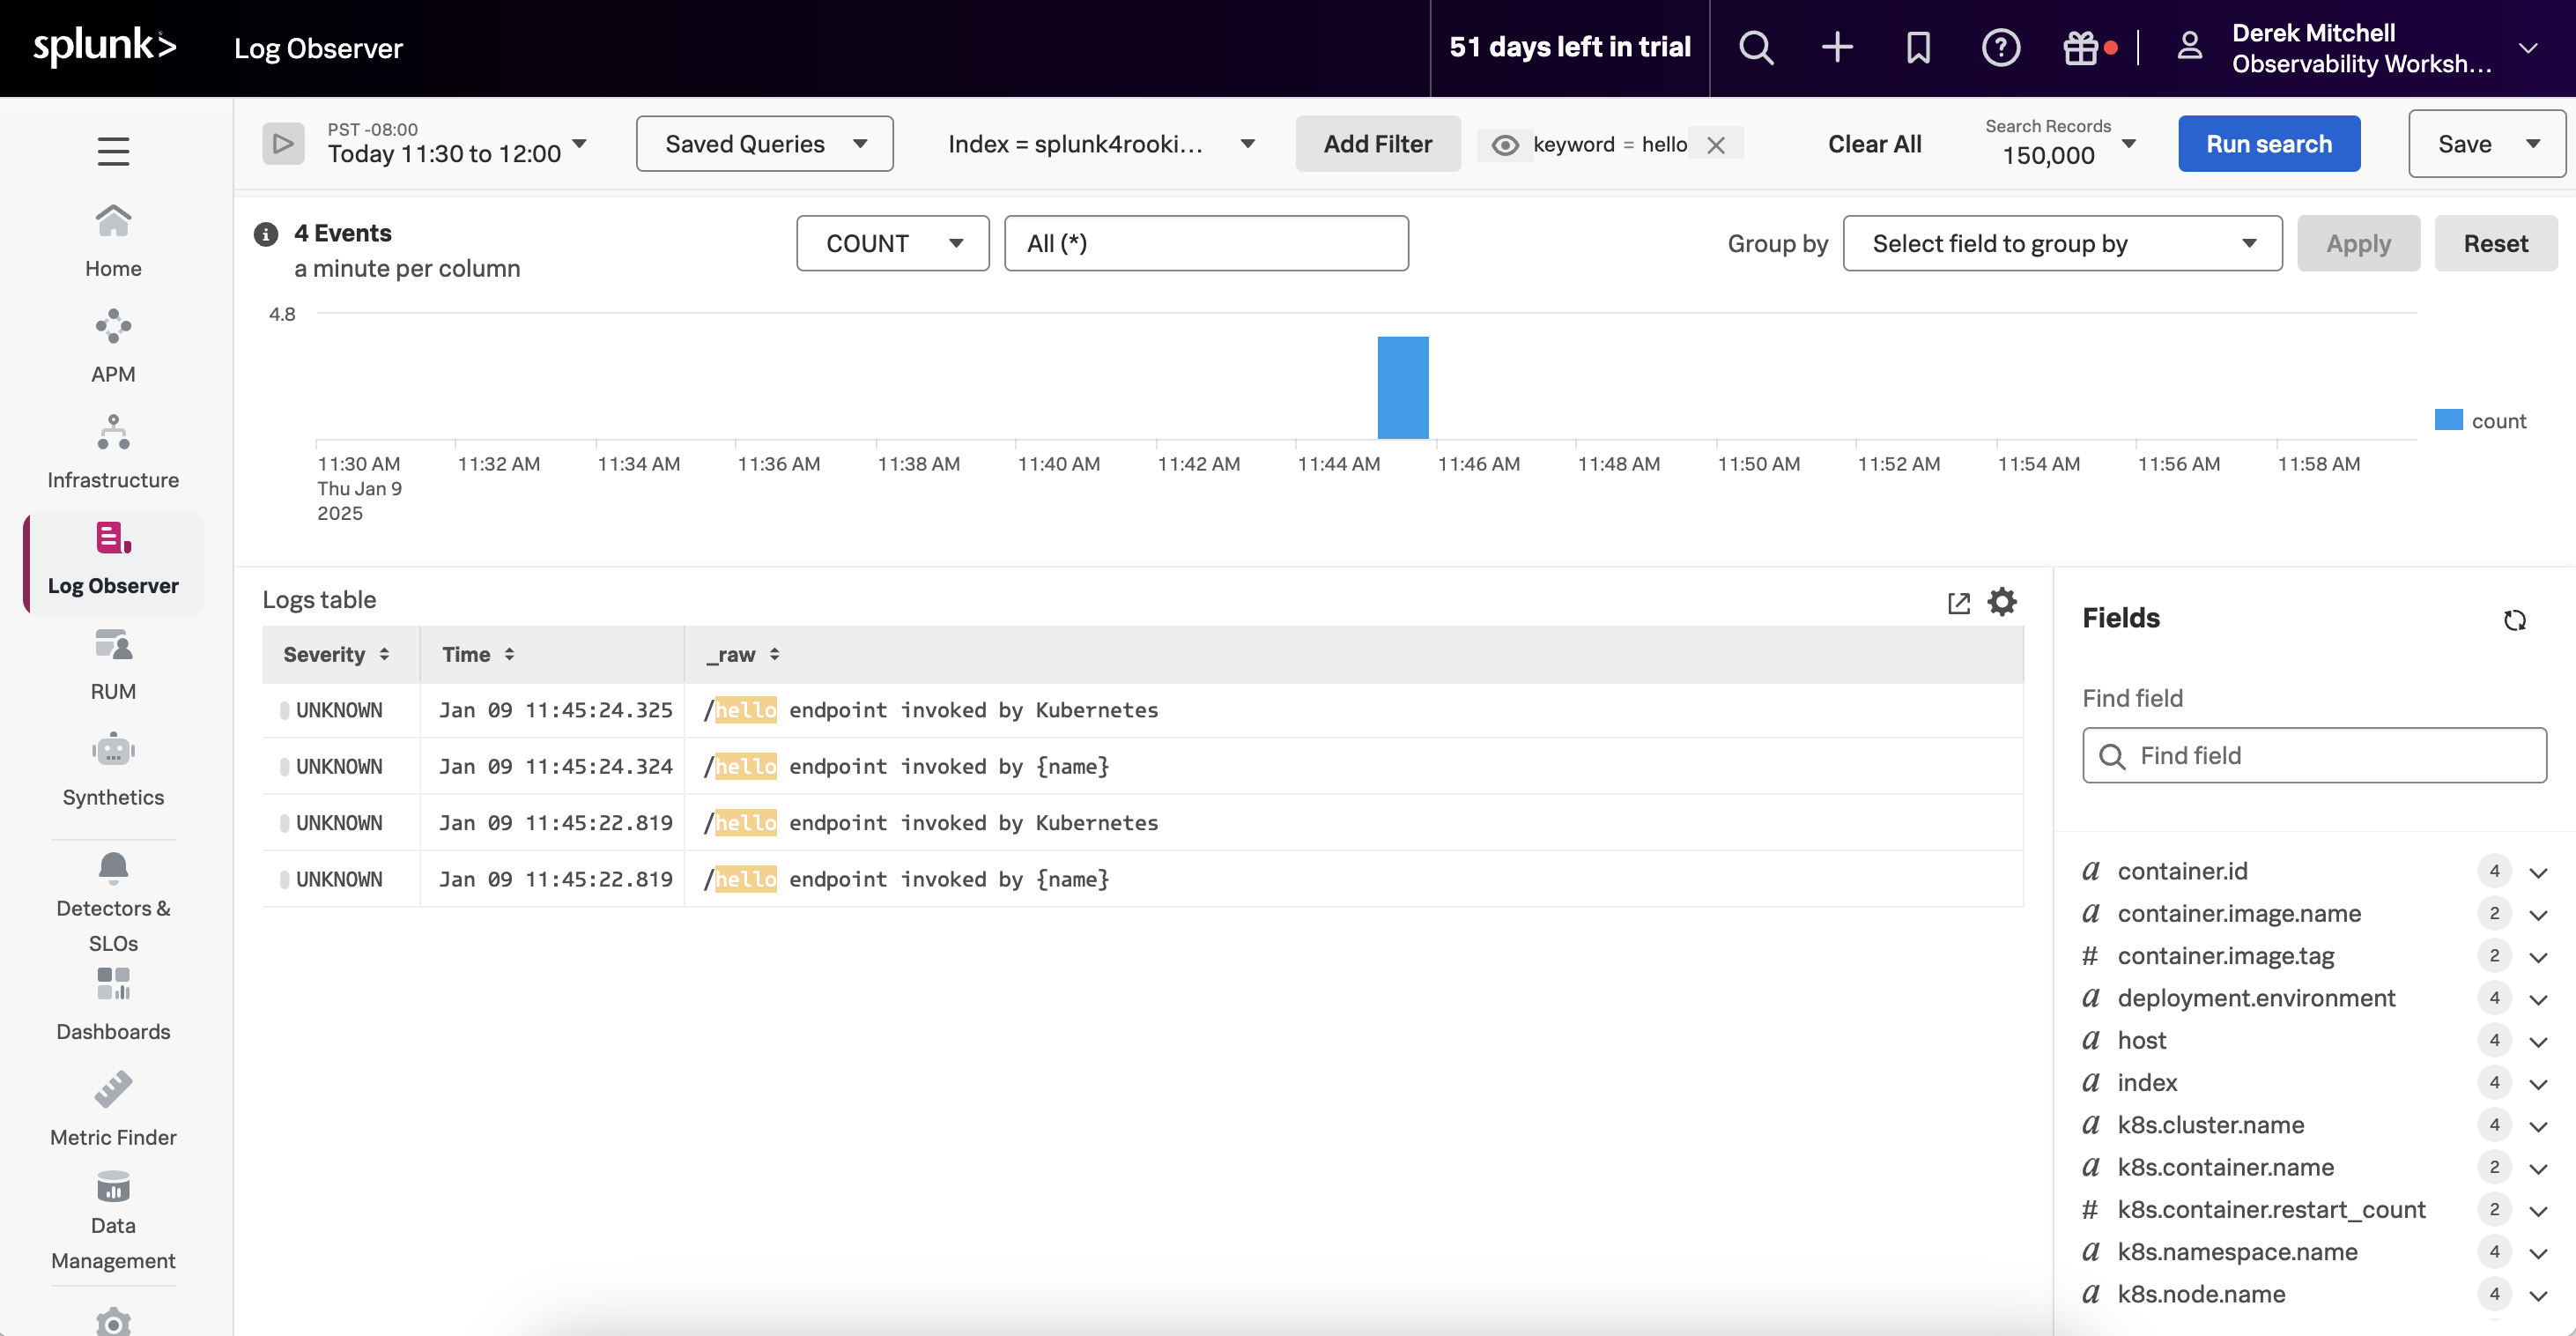
You might remember though that if we deploy the OpenTelemetry collector in a K8s cluster using Helm, and we include the log collection option, then the OpenTelemetry collector will use the File Log receiver to automatically capture any container logs.
This would result in duplicate logs being captured for our application. For example, in the following screenshot we can see two log entries for each request made to our service:
How do we avoid this?
Avoiding Duplicate Logs in K8s
To avoid capturing duplicate logs, we can set the OTEL_LOGS_EXPORTER environment variable to none,
to tell the Splunk Distribution of OpenTelemetry .NET to avoid exporting logs to the collector using OTLP.
We can do this by adding the OTEL_LOGS_EXPORTER environment variabl to the deployment.yaml file:
And then running:
Setting the OTEL_LOGS_EXPORTER environment variable to none is straightforward. However, the Trace ID
and Span ID are not written to the stdout logs generated by the application,
which would prevent us from correlating logs with traces.
To resolve this, we will need to define a custom logger, such as the example defined in/home/splunk/workshop/docker-k8s-otel/helloworld/SplunkTelemetryConfigurator.cs.
We could include this in our application by updating the Program.cs file as follows:
Then we’ll build a new Docker image that includes the custom logging configuration:
And then we’ll import the updated image into our local container repository:
Finally, we’ll need to update the `deployment.yaml’ file to use the 1.3 version of the container image:
And then apply the changes:
Now we can see that the duplicate log entries have been eliminated. And the remaining log entries have been formatted as JSON, and include the span and trace IDs: