Instrument a .NET Application with OpenTelemetry
20 minutesDownload the Splunk Distribution of OpenTelemetry
For this workshop, we’ll install the Splunk Distribution of OpenTelemetry manually rather than using the NuGet packages.
We’ll start by downloading the latest splunk-otel-dotnet-install.sh file,
which we’ll use to instrument our .NET application:
Refer to Install the Splunk Distribution of OpenTelemetry .NET manually for further details on the installation process.
Install the Distribution
In the terminal, install the distribution as follows
Note: we may need to include the ARCHITECTURE environment when running the command above:
Activate the Instrumentation
Next, we can activate the OpenTelemetry instrumentation:
Set the Deployment Environment
Let’s set the deployment environment, to ensure our data flows into its own environment within Splunk Observability Cloud:
Run the Application with Instrumentation
We can run the application as follows:
A Challenge For You
How can we see what traces are being exported by the .NET application from our Linux instance?
Click here to see the answer
There are two ways we can do this:
- We could add
OTEL_TRACES_EXPORTER=otlp,consoleat the start of thedotnet runcommand, which ensures that traces are both written to collector via OTLP as well as the console.
- Alternatively, we could add the debug exporter to the collector configuration, and add it to the traces pipeline, which ensures the traces are written to the collector logs.
Access the Application
Once the application is running, use a second SSH terminal and access it using curl:
As before, it should return Hello, World!.
If you enabled trace logging, you should see a trace written the console or collector logs such as the following:
View your application in Splunk Observability Cloud
Now that the setup is complete, let’s confirm that traces are sent to Splunk Observability Cloud. Note that when the application is deployed for the first time, it may take a few minutes for the data to appear.
Navigate to APM, then use the Environment dropdown to select your environment (i.e. otel-instancename).
If everything was deployed correctly, you should see helloworld displayed in the list of services:
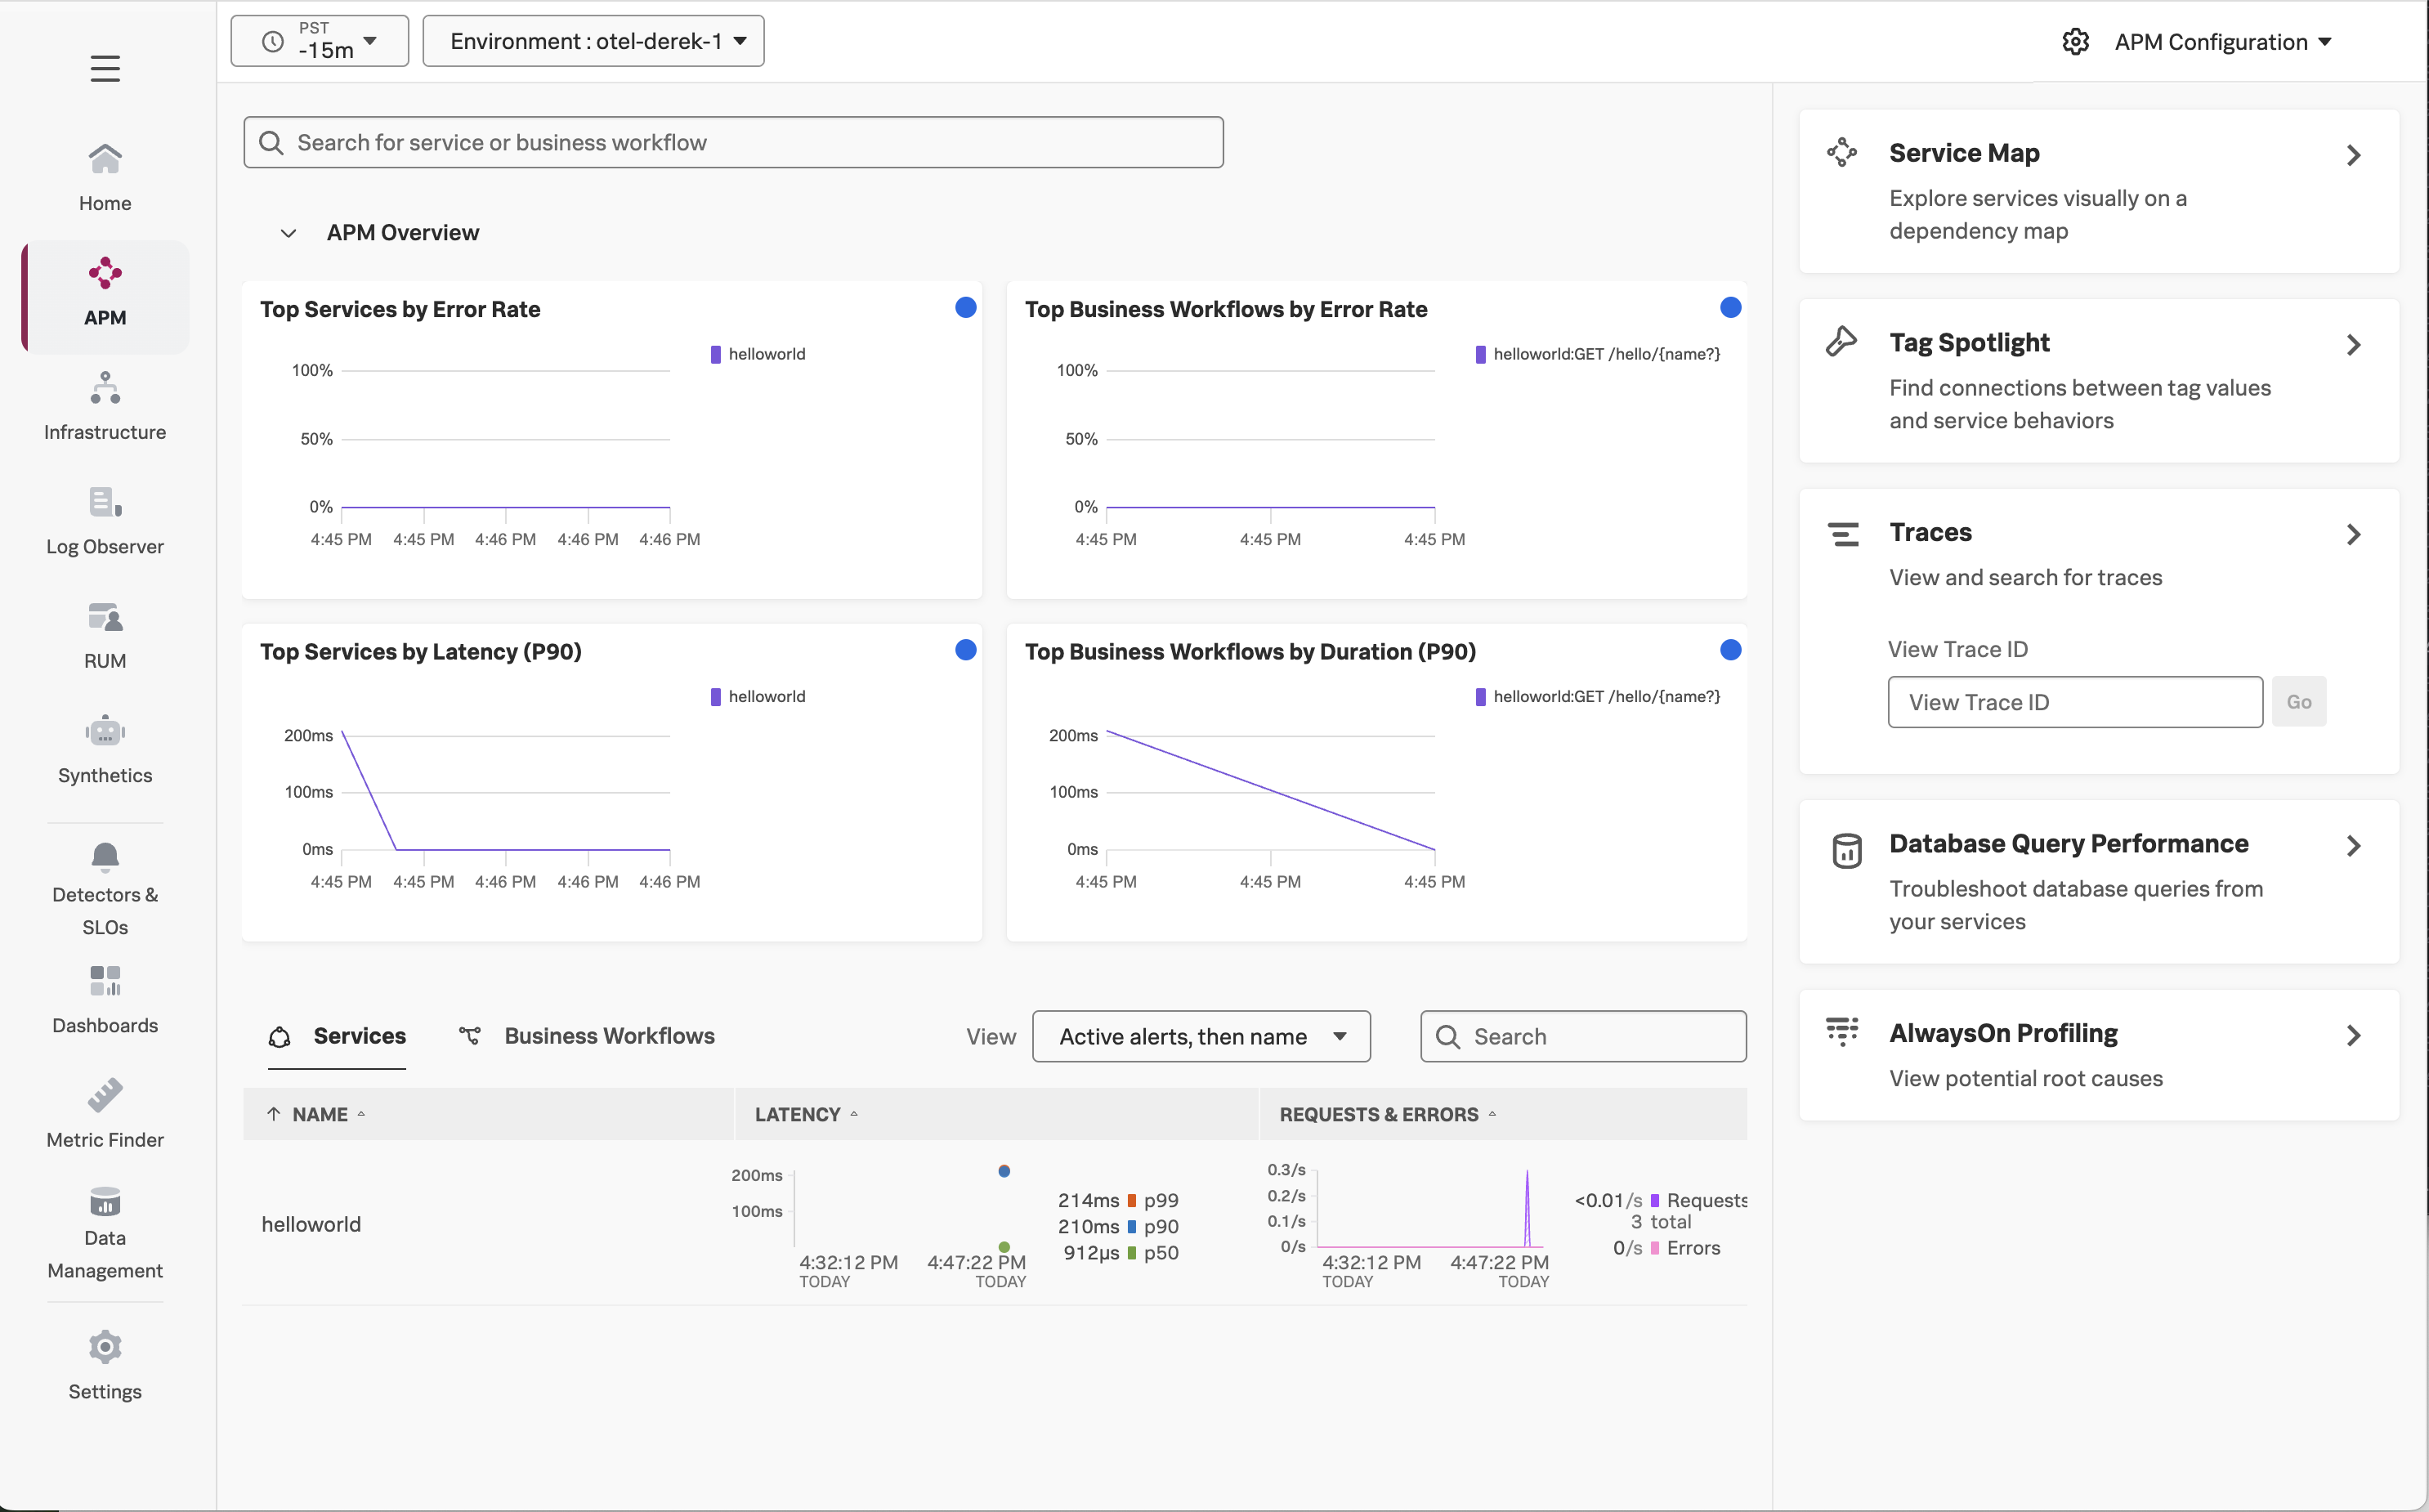
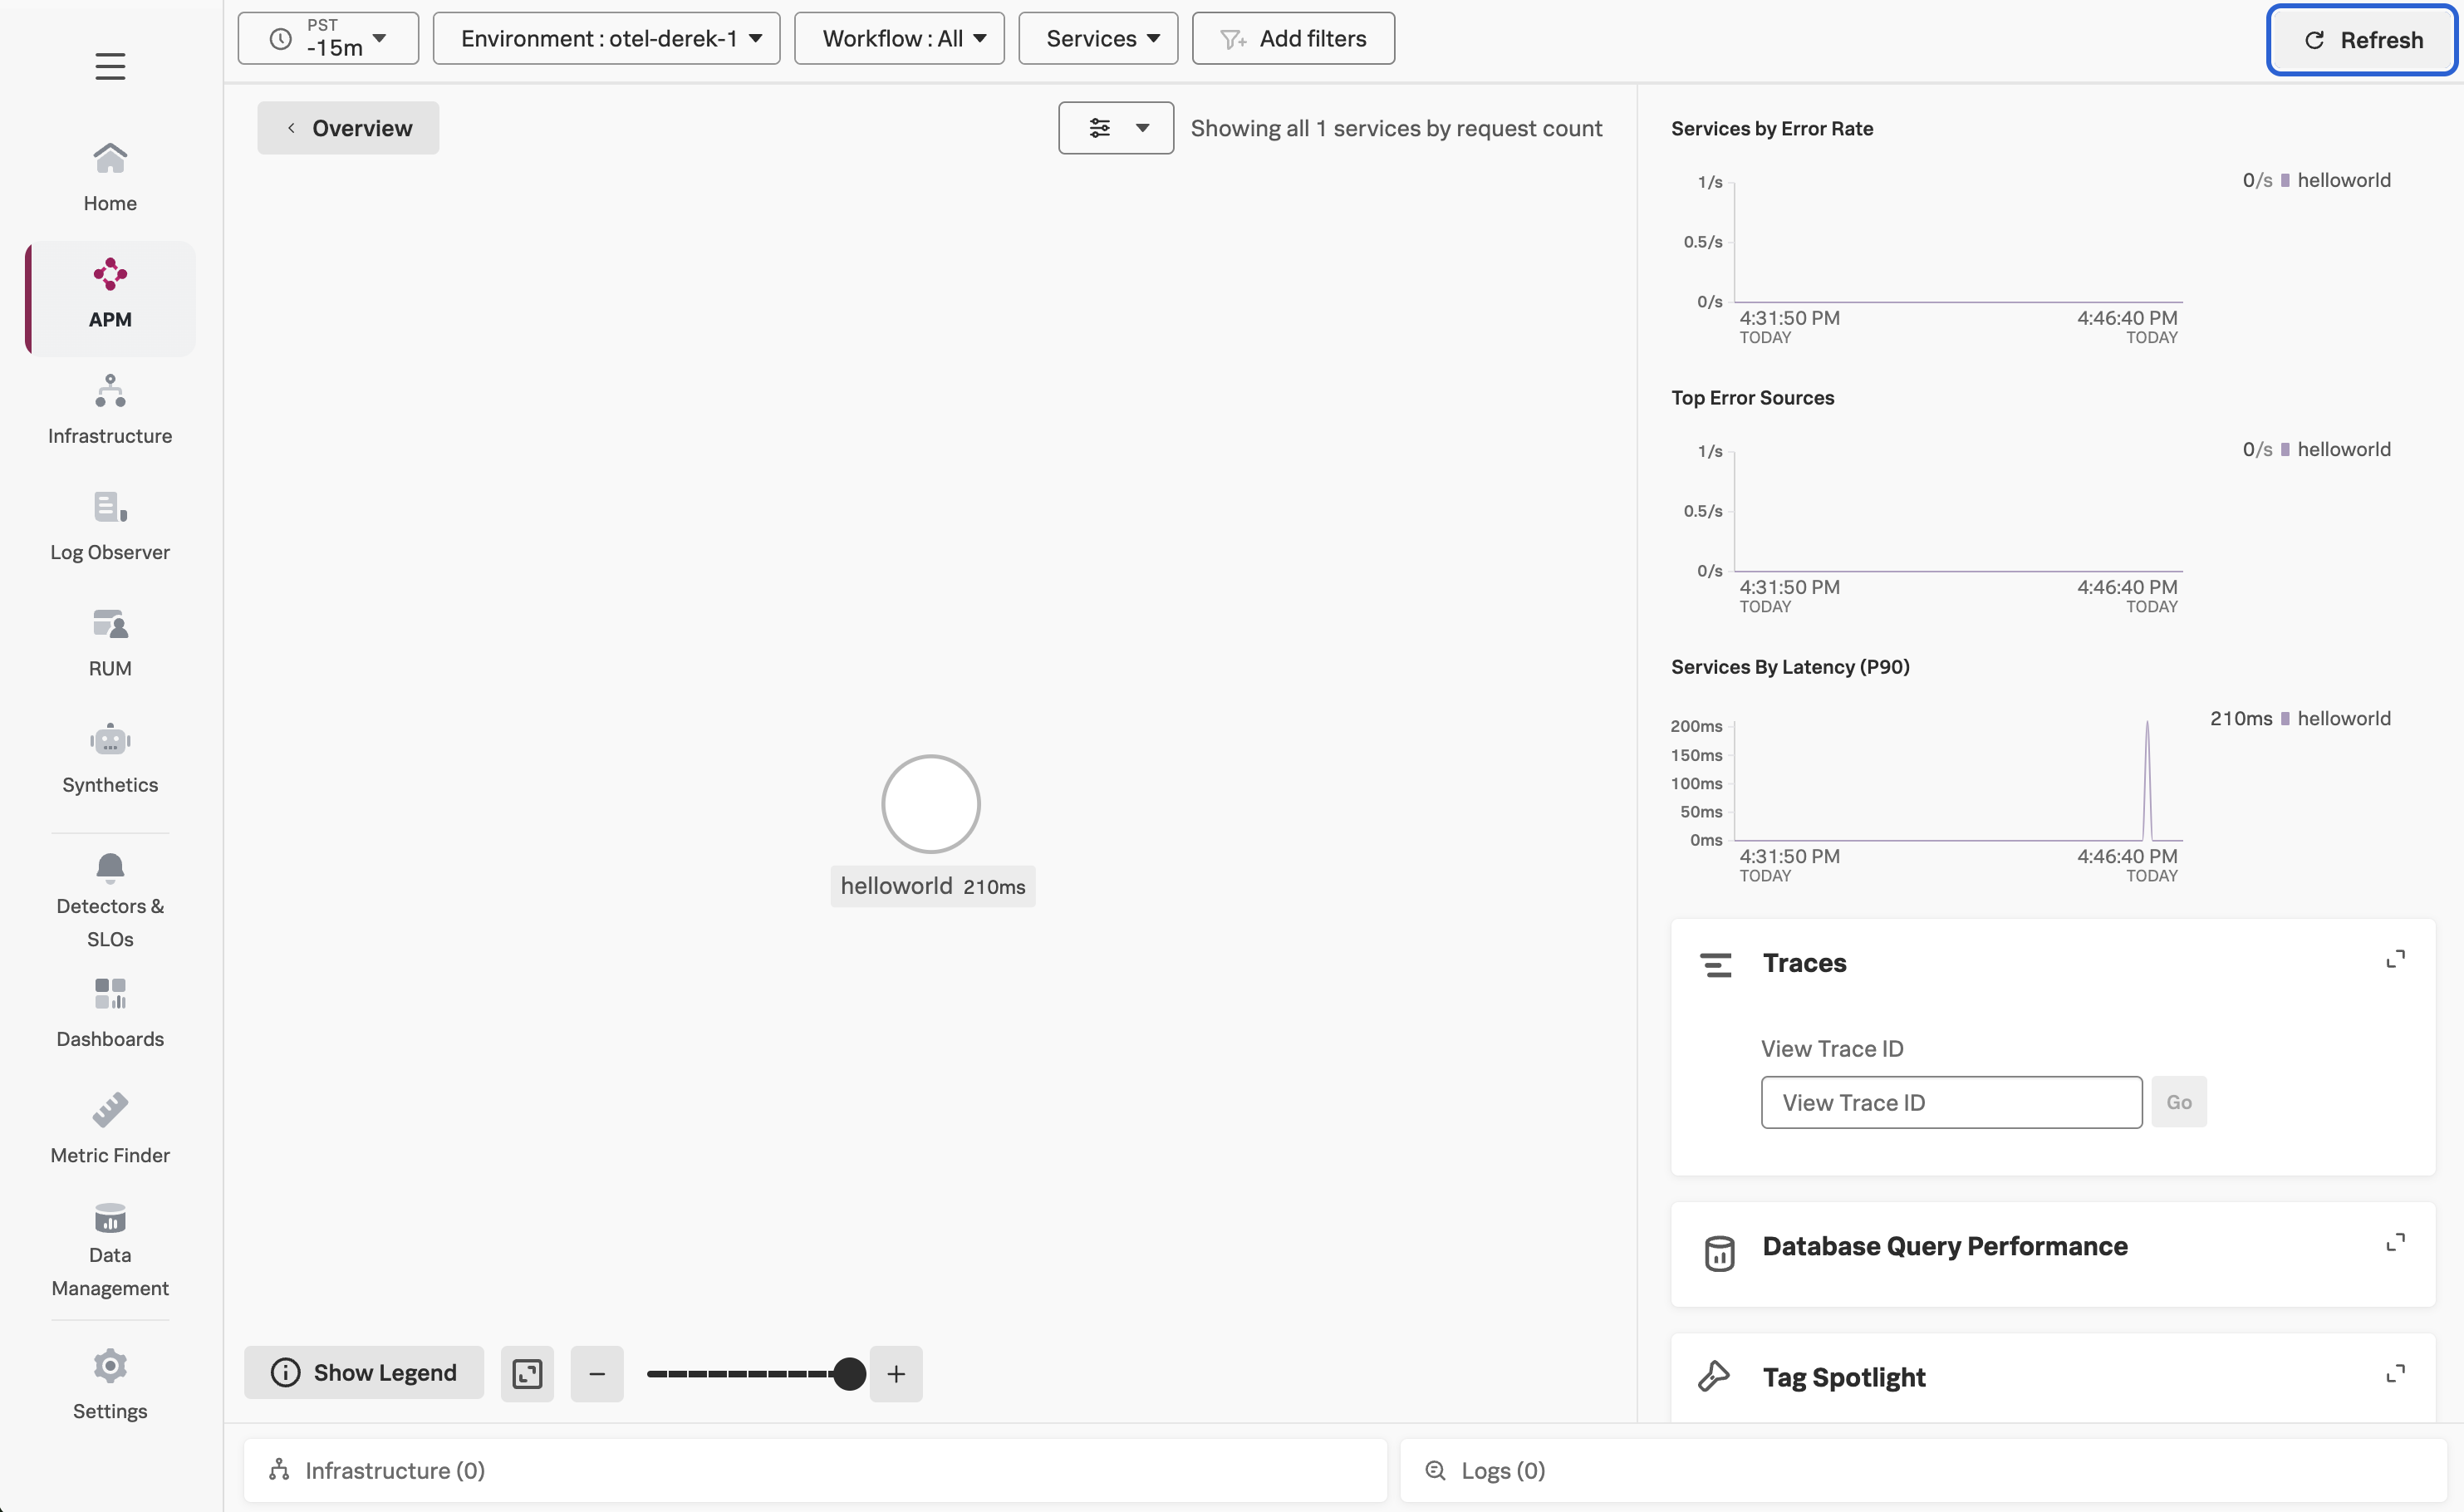
Click on Service Map on the right-hand side to view the service map.
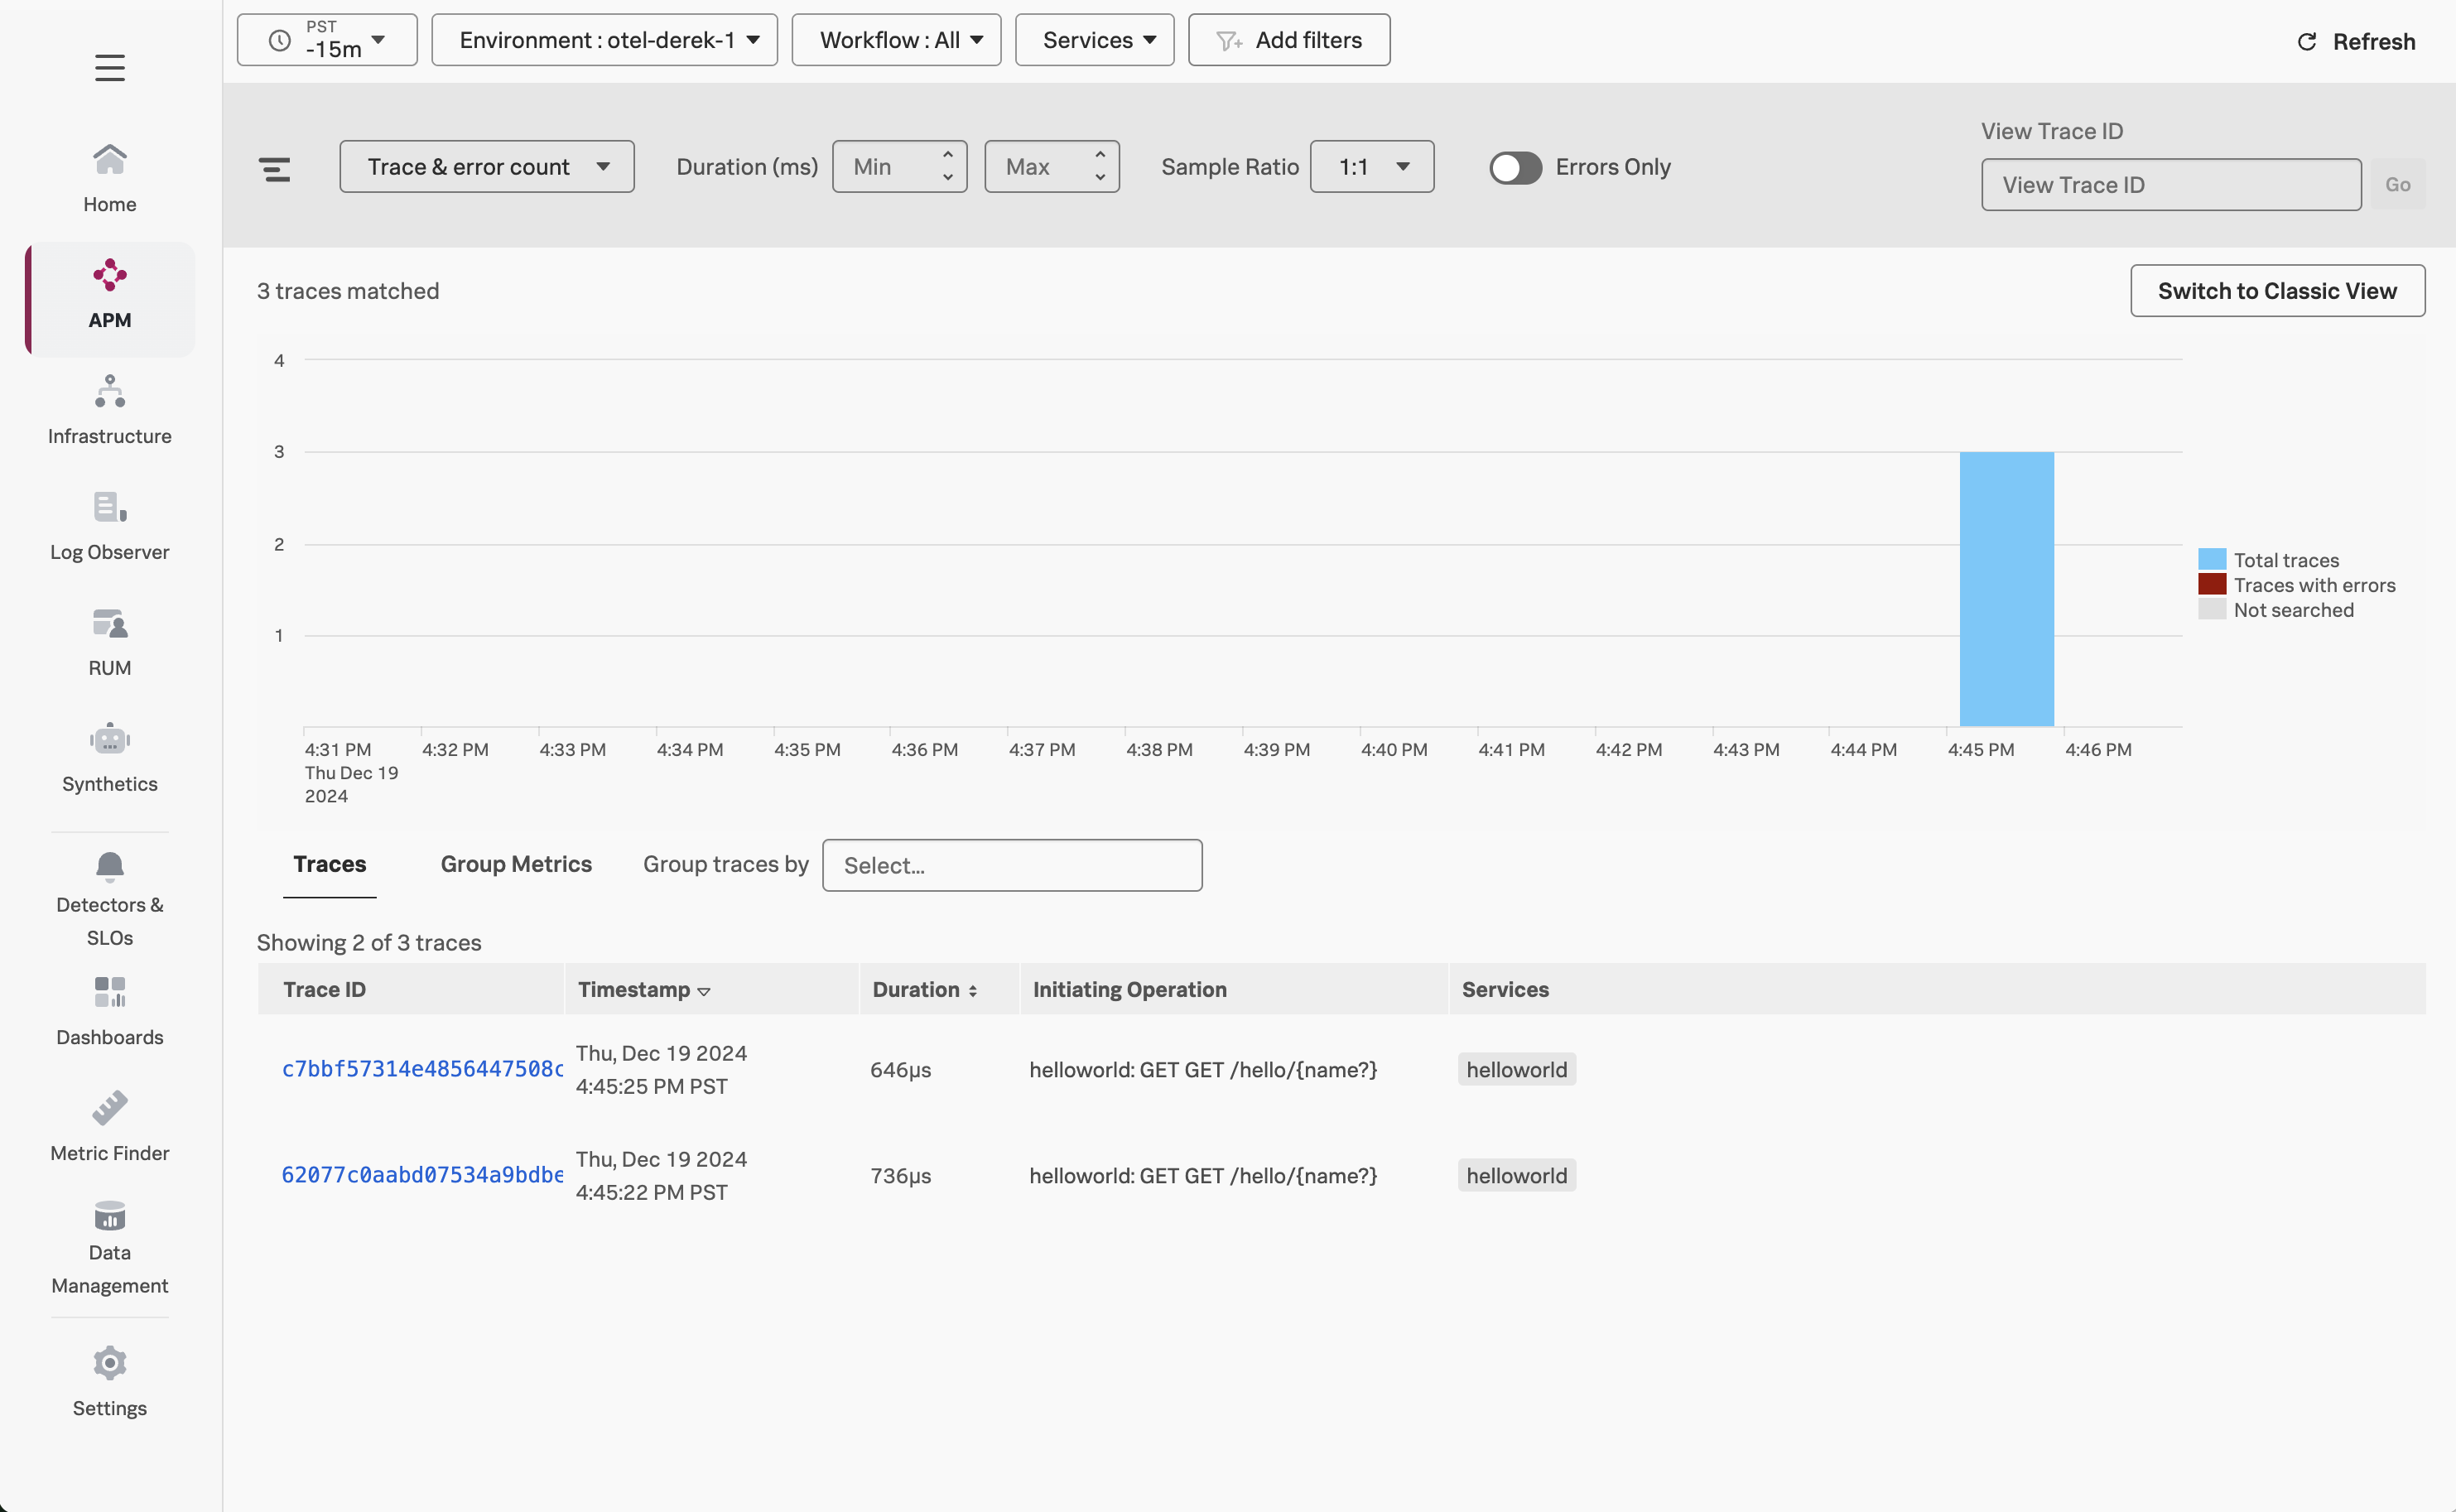
Next, click on Traces on the right-hand side to see the traces captured for this application.
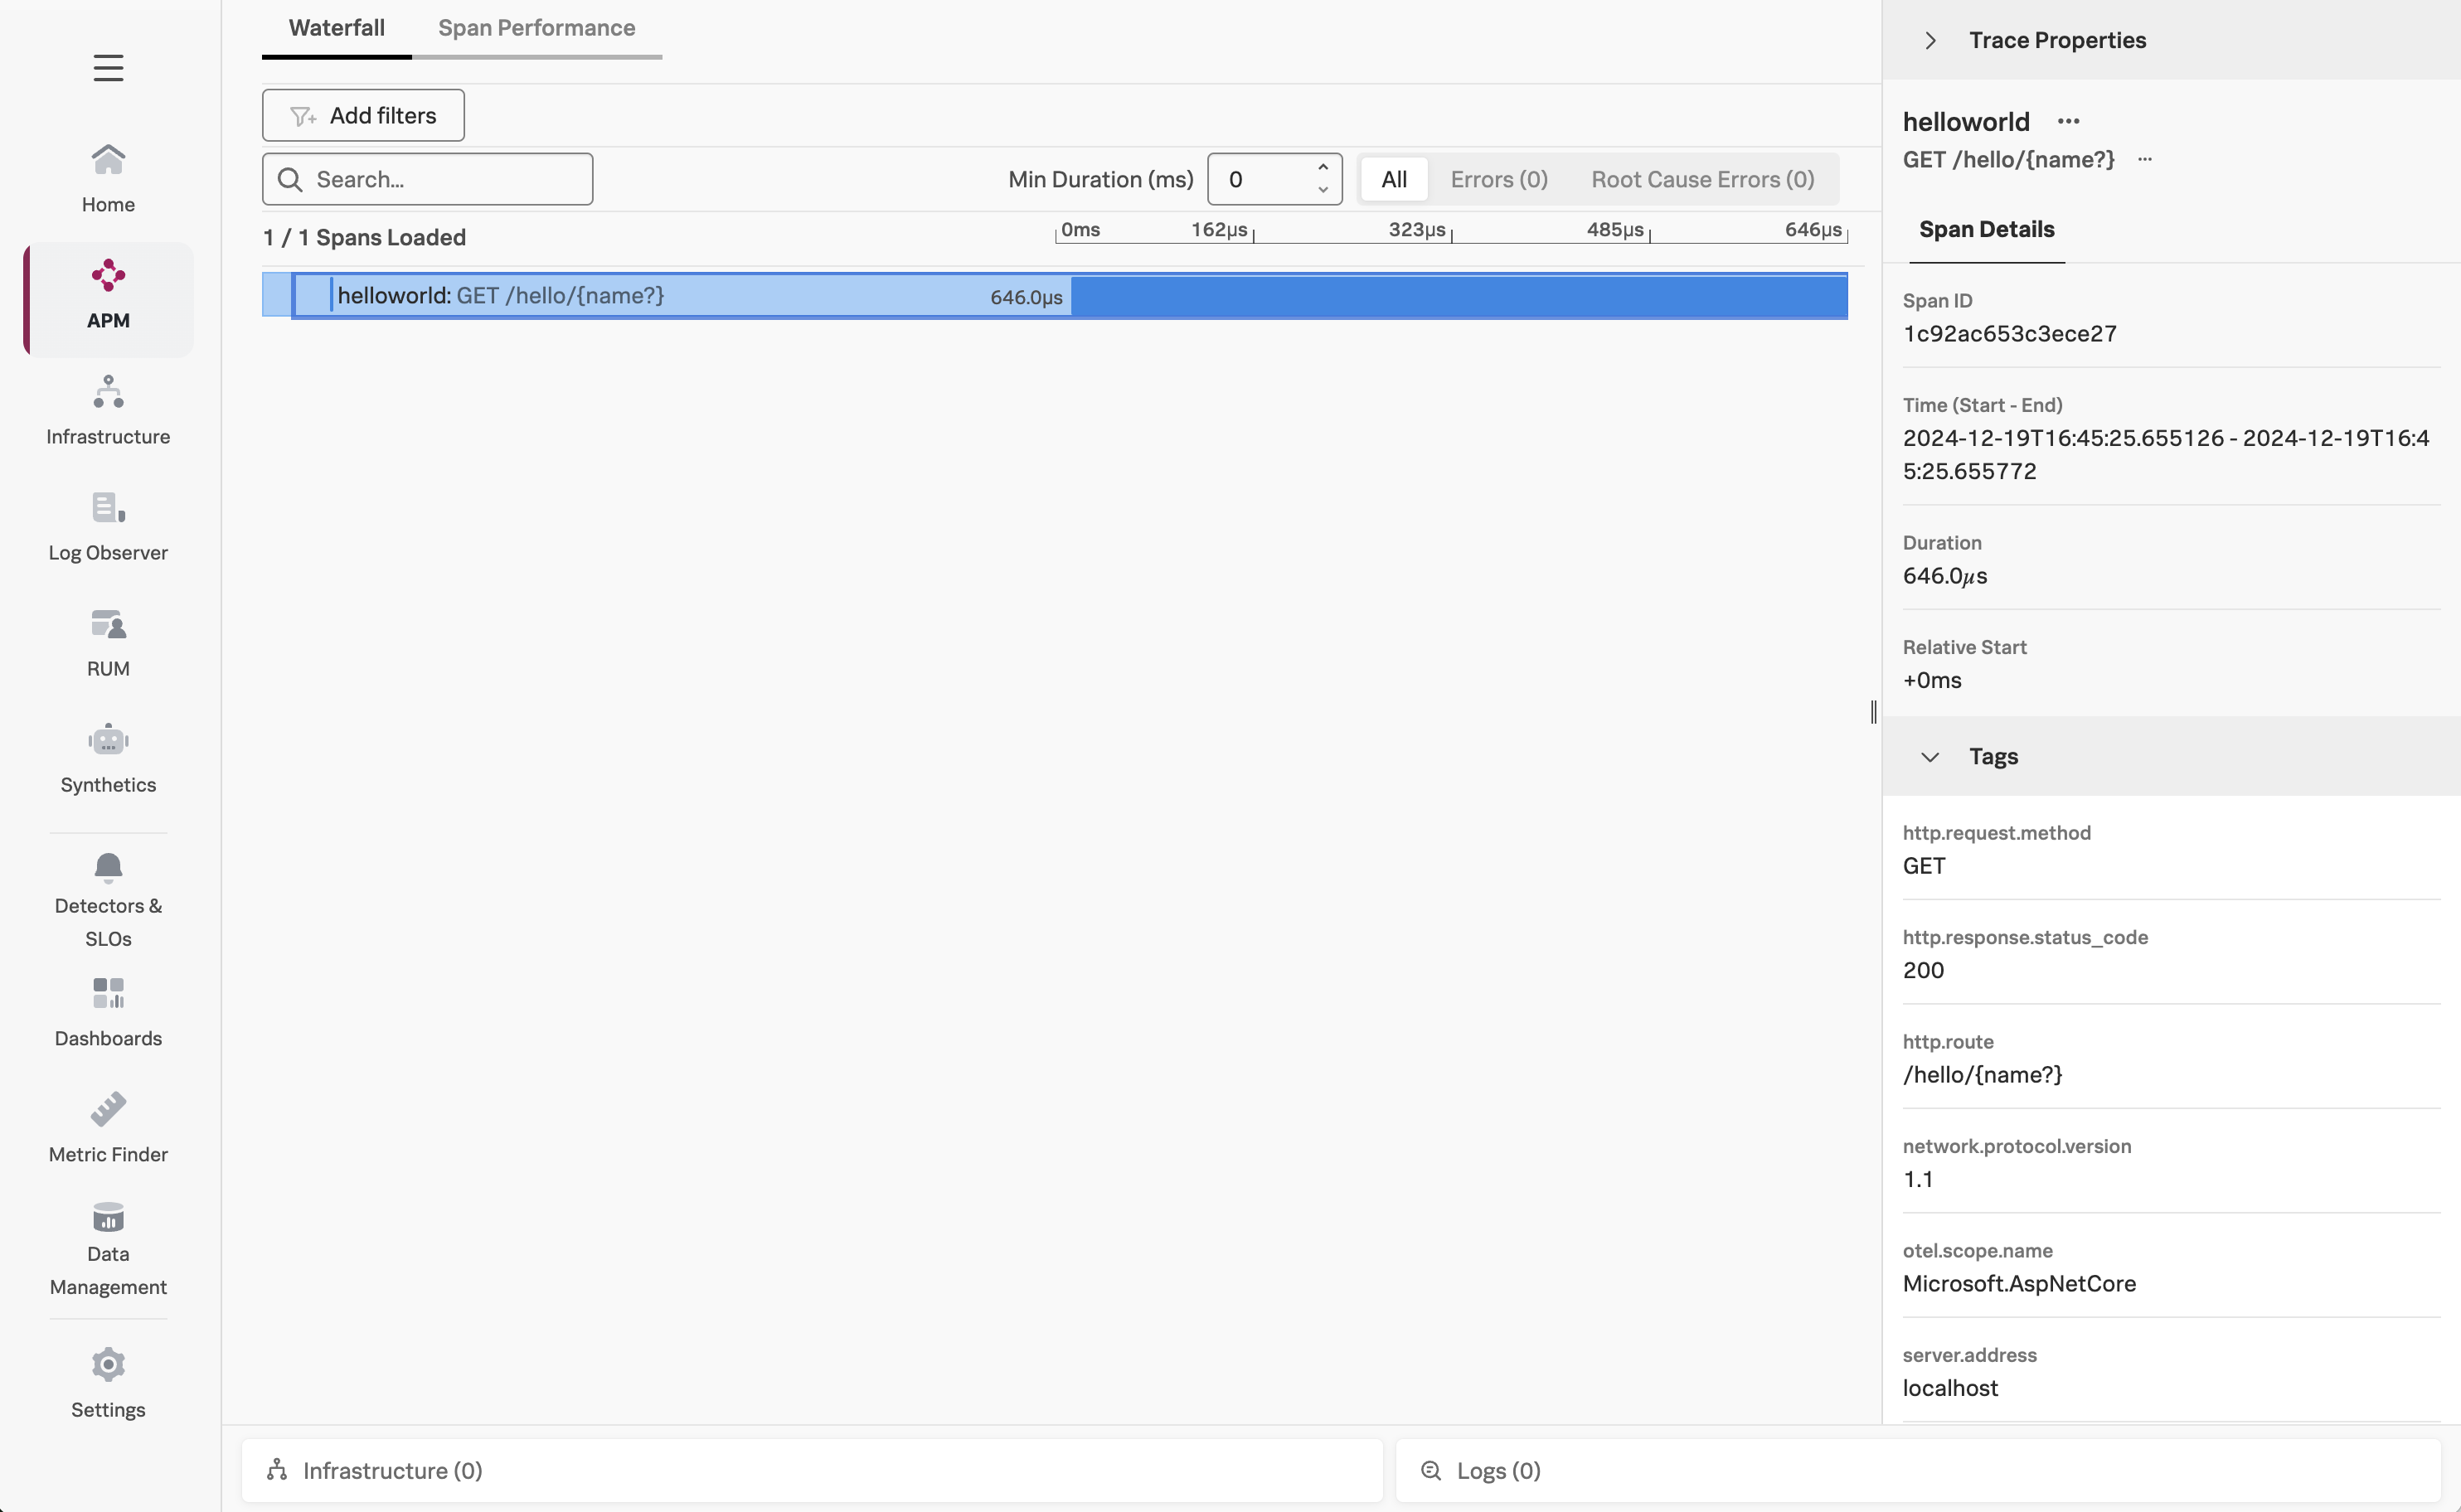
An individual trace should look like the following:
Press Ctrl + C to quit your Helloworld app before moving to the next step.