Troubleshoot a Problem Using Tag Spotlight
15 minutesExplore APM Data
Let’s explore some of the APM data we’ve captured to see how our application is performing.
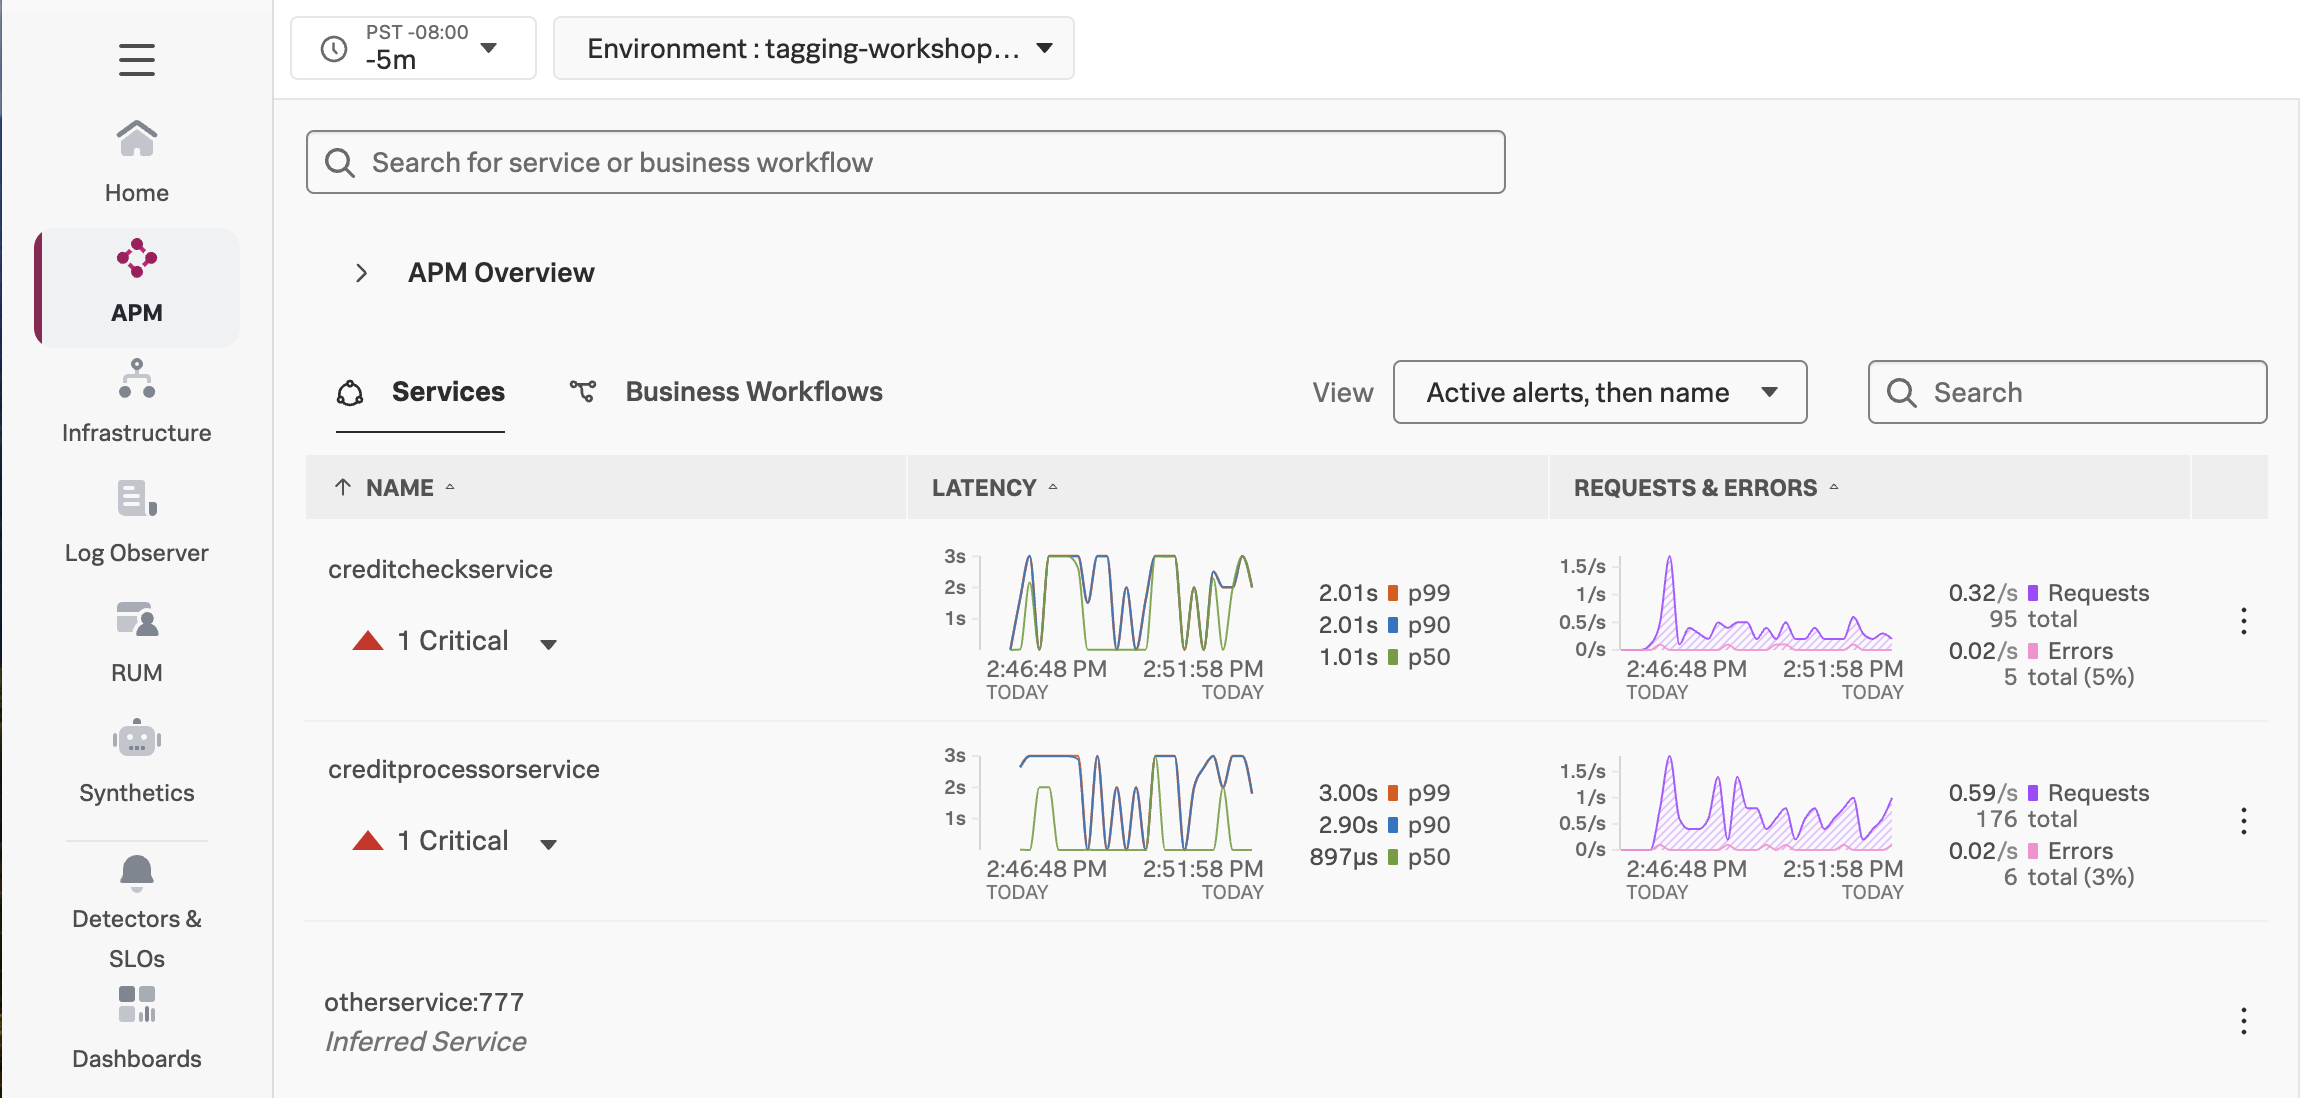
Navigate to APM, then use the Environment dropdown to select your environment (i.e. tagging-workshop-instancename).
You should see creditprocessorservice and creditcheckservice displayed in the list of services:
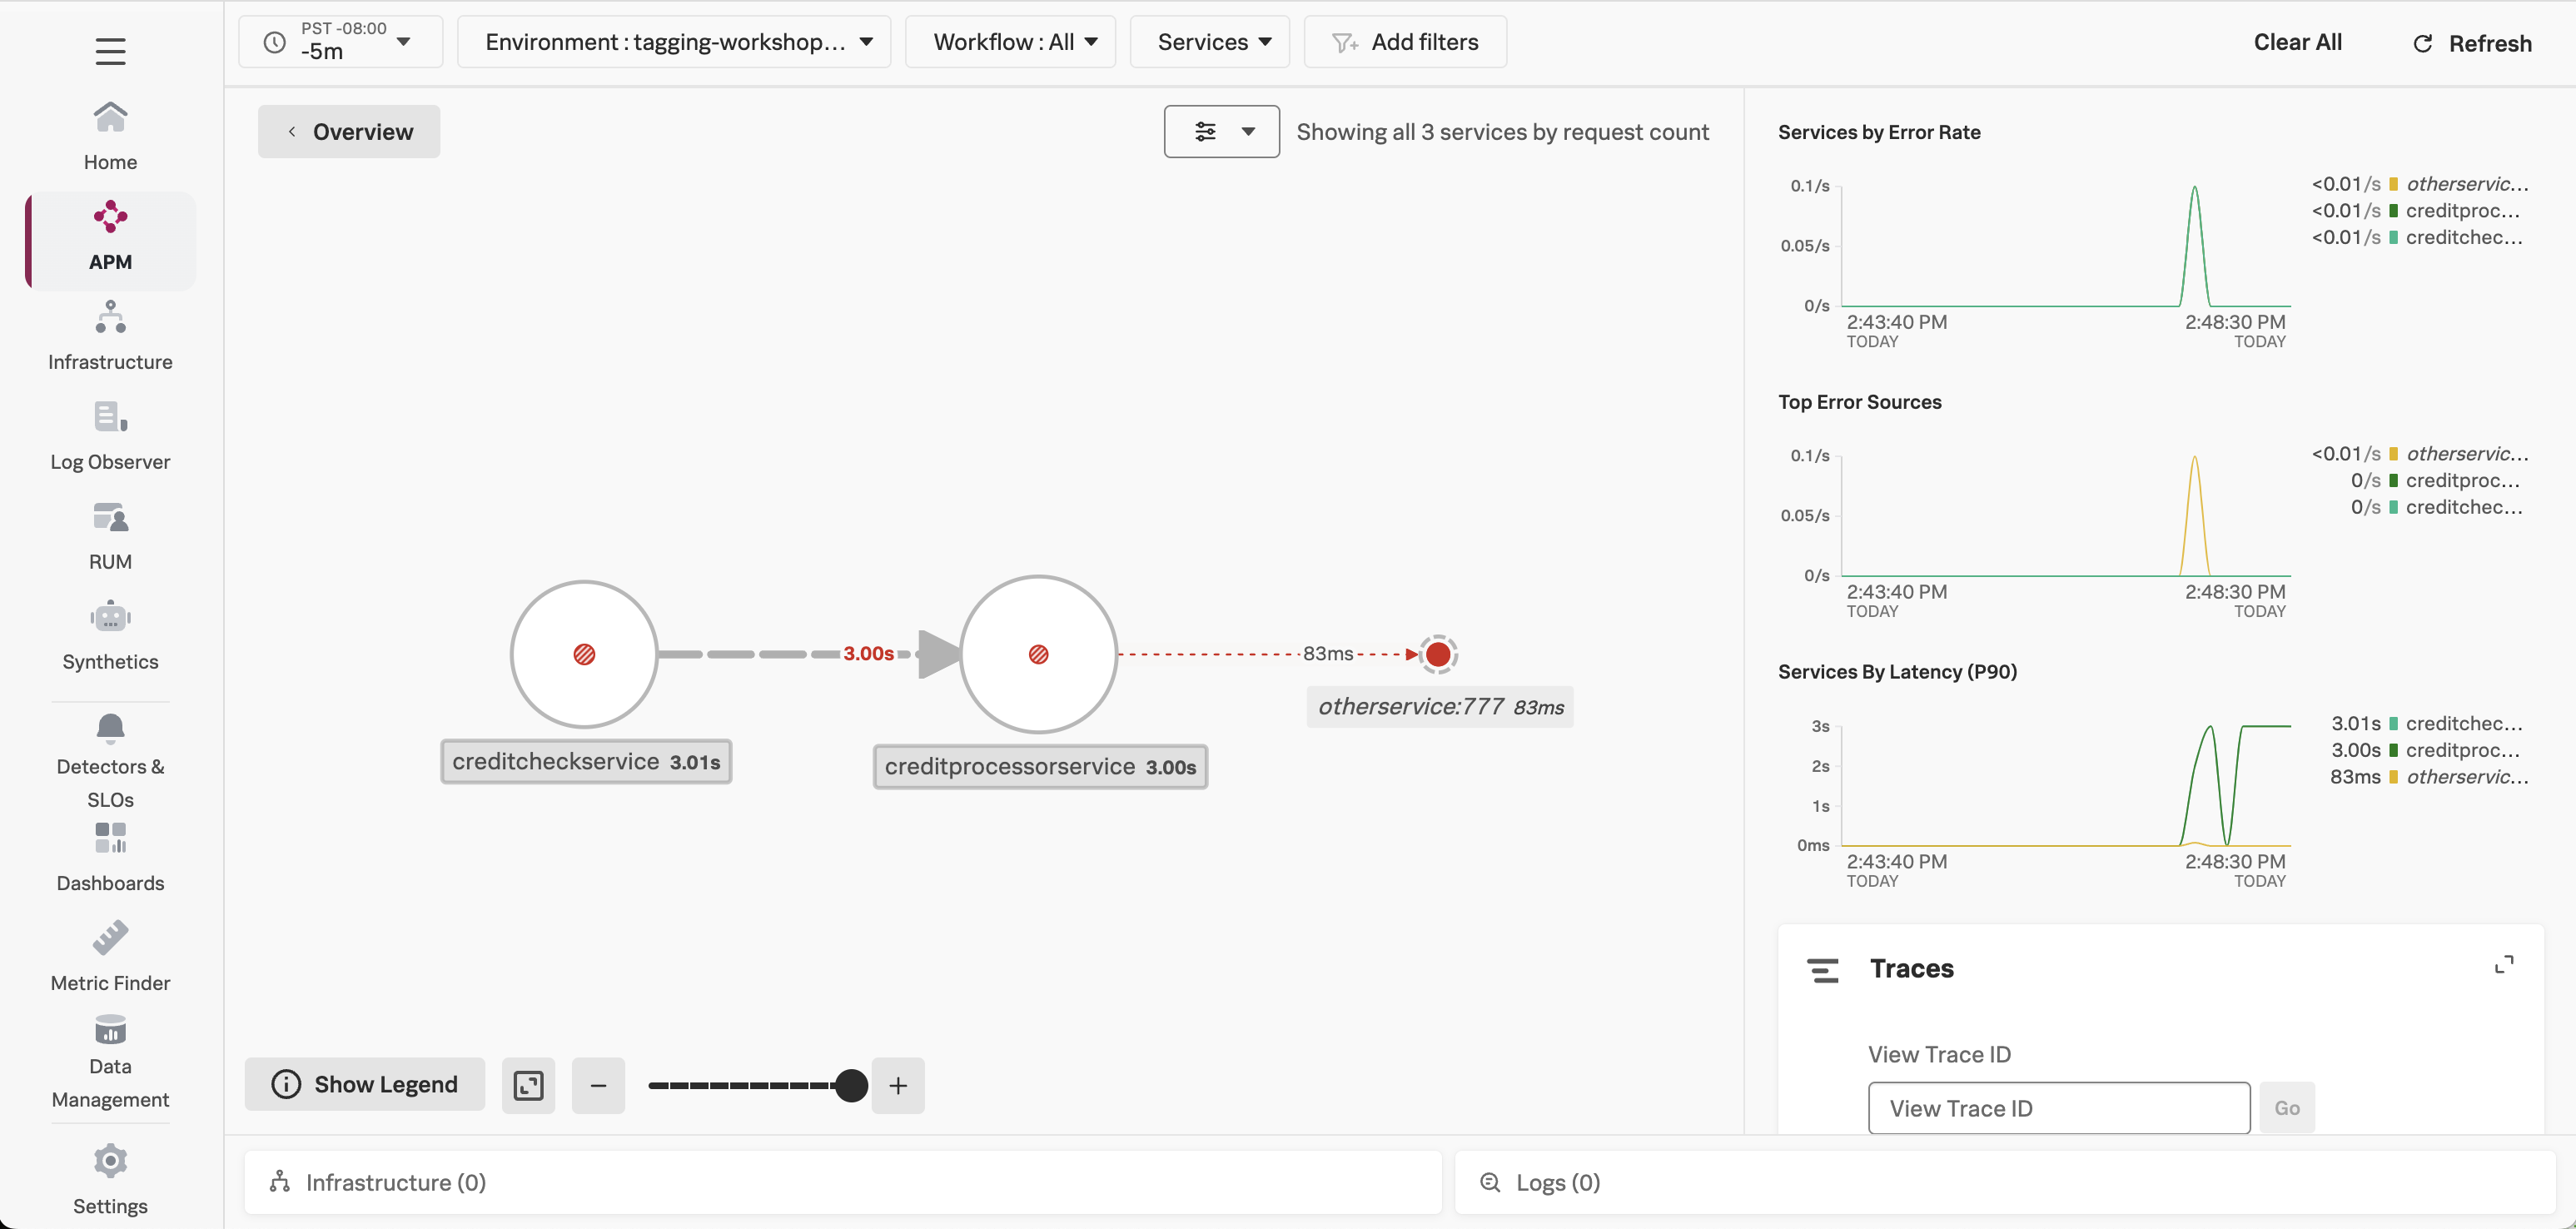
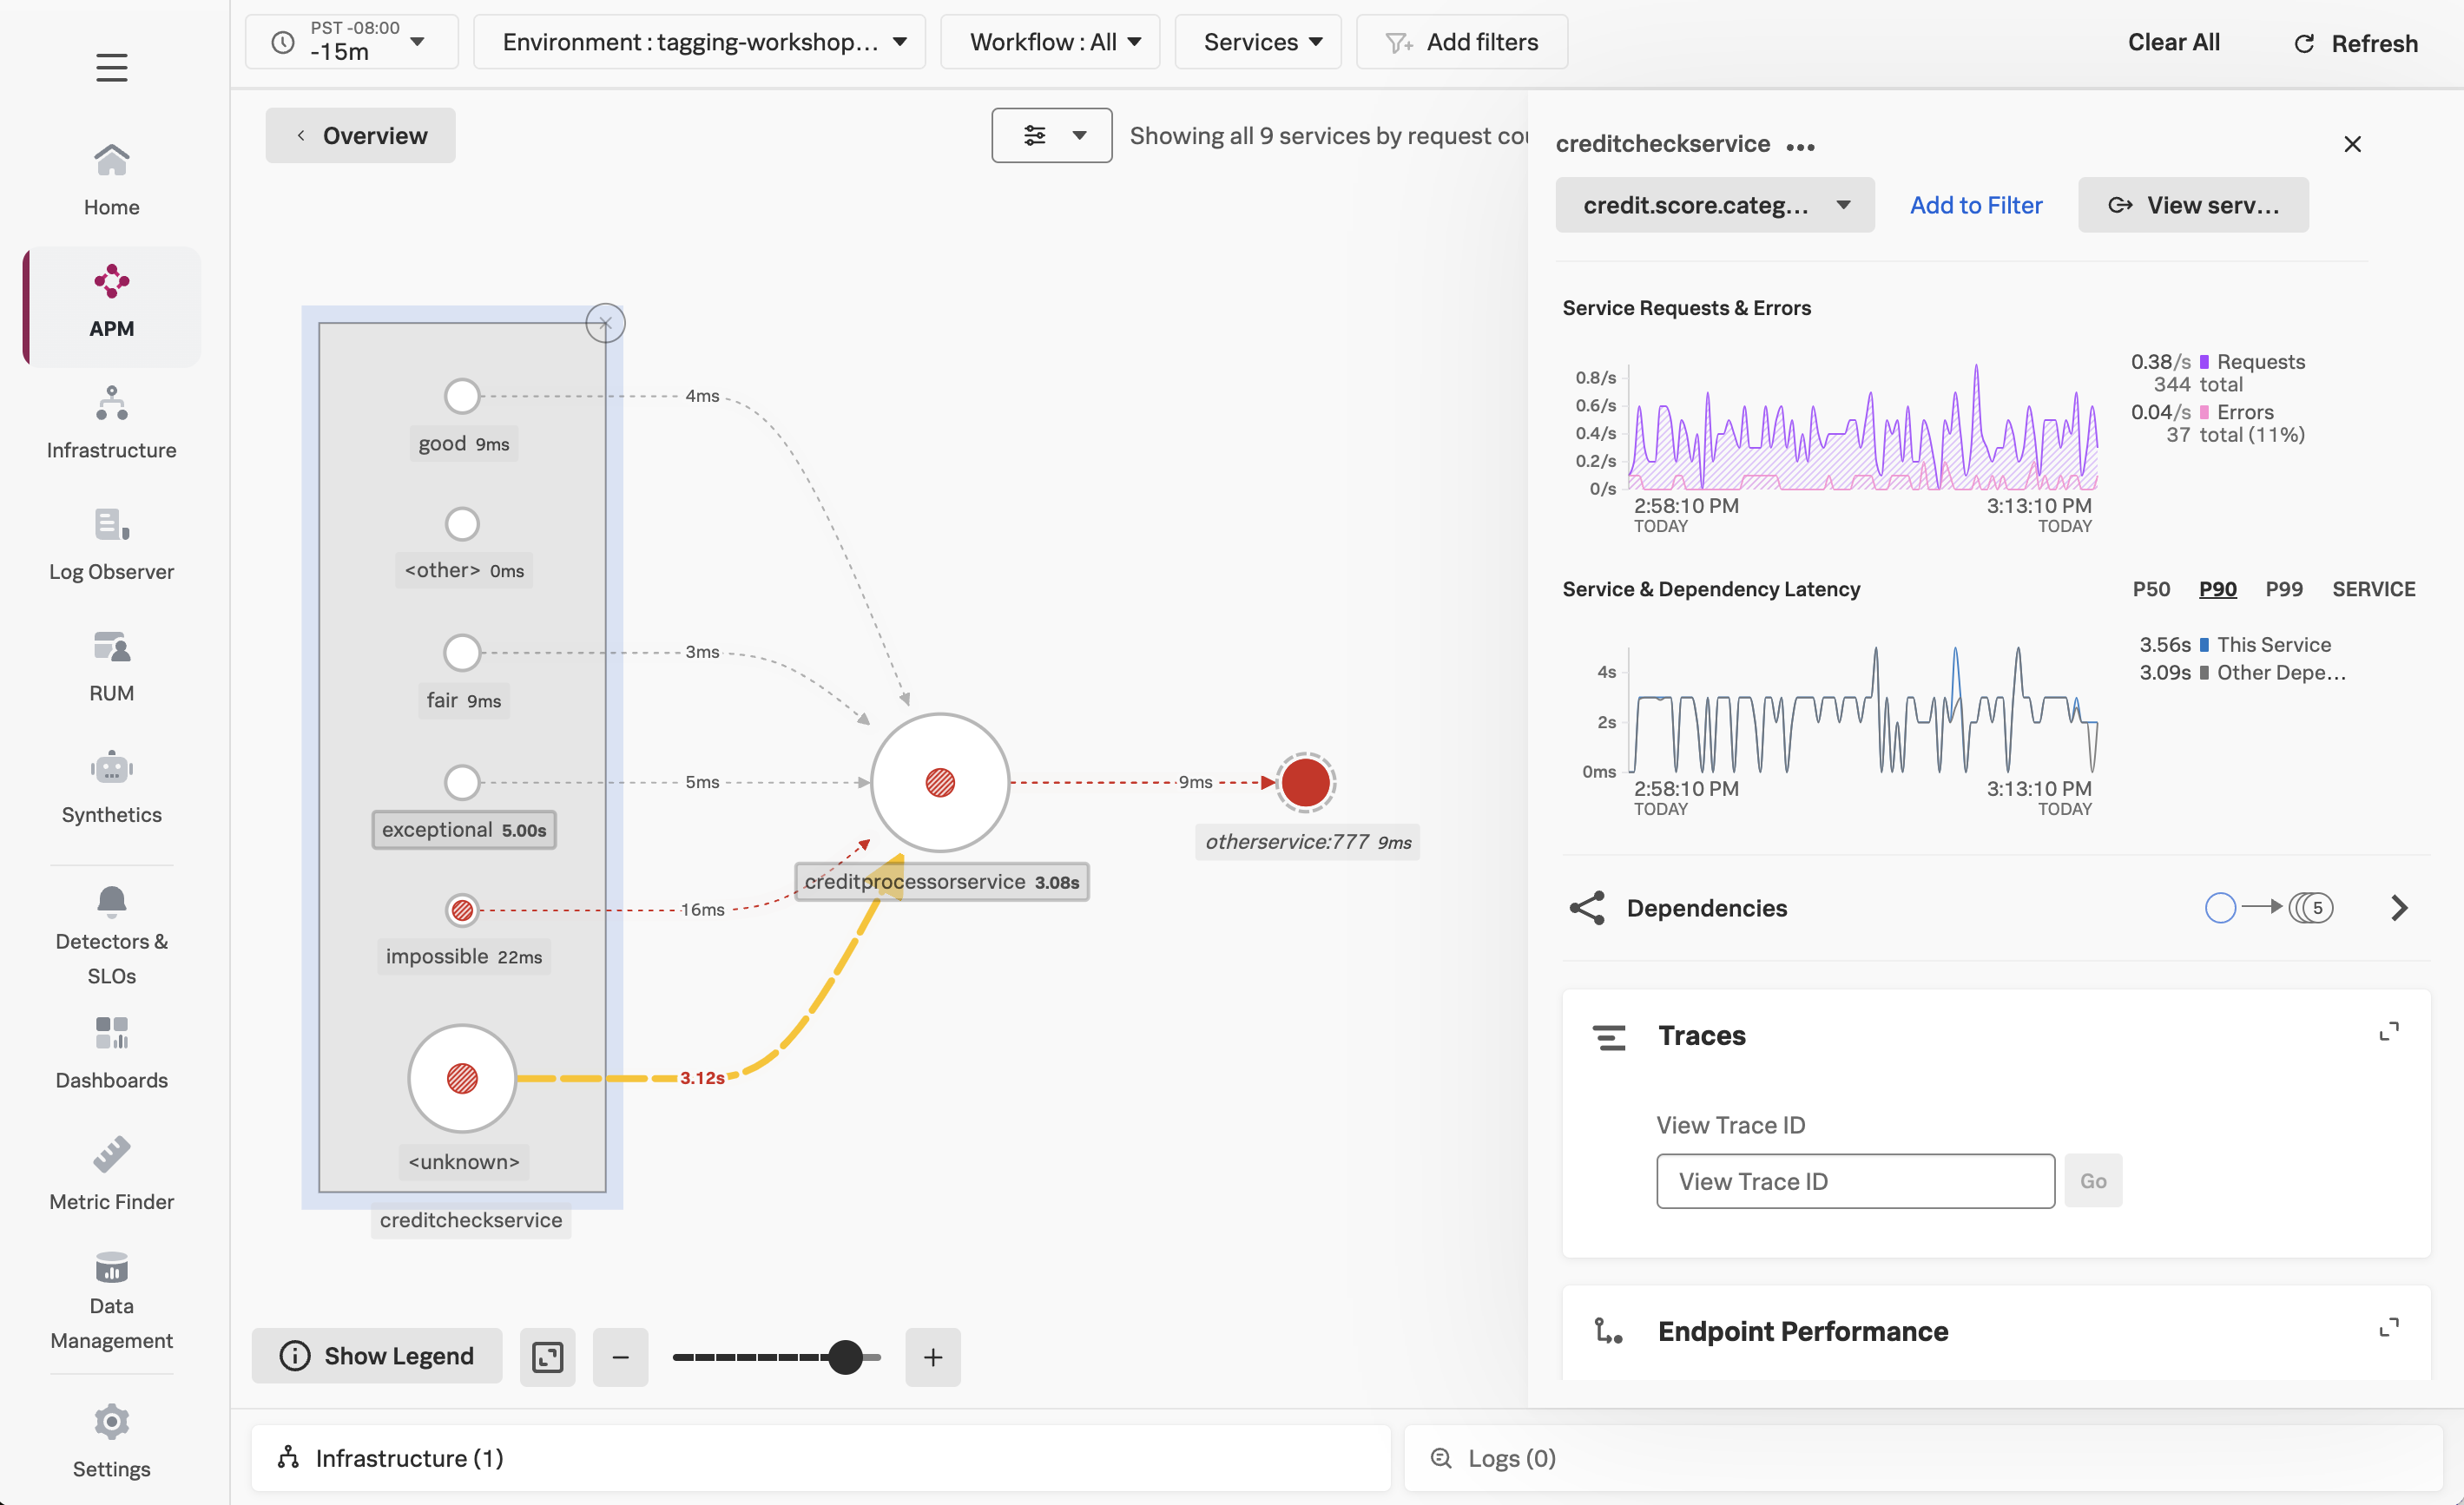
Click on Service Map on the right-hand side to view the service map. We can see that the creditcheckservice makes calls to the creditprocessorservice, with an average response time of at least 3 seconds:
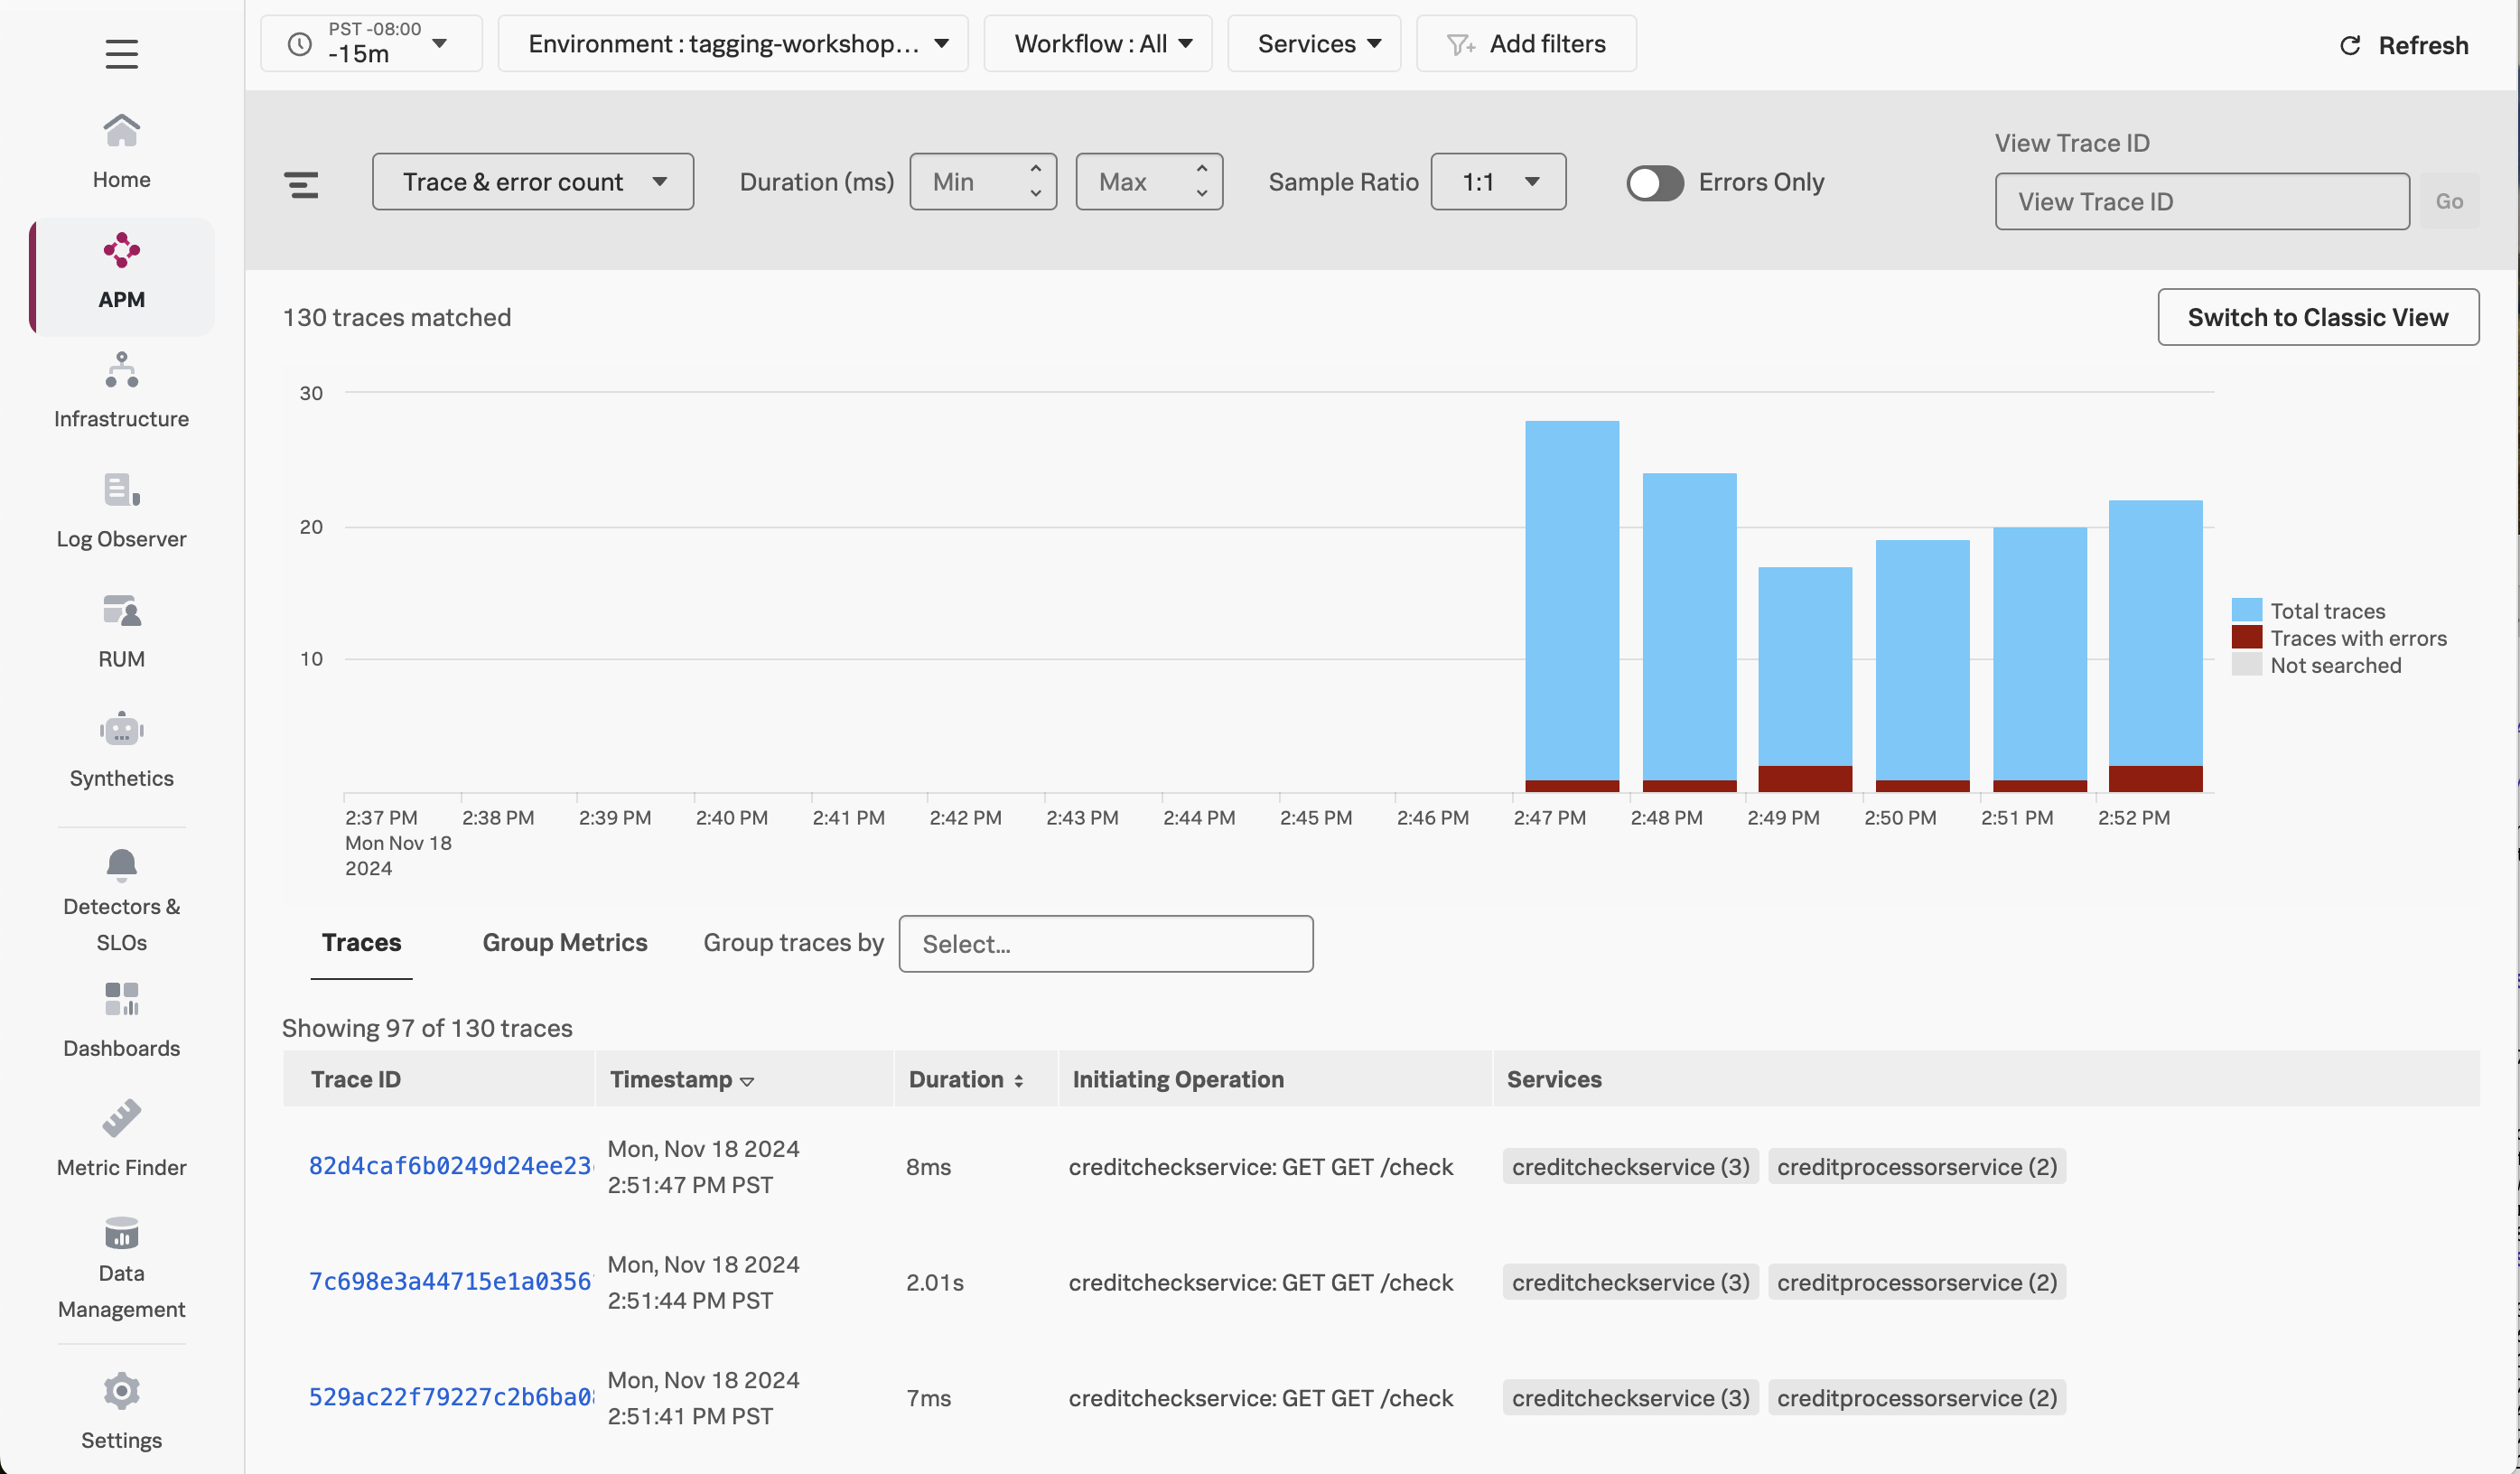
Next, click on Traces on the right-hand side to see the traces captured for this application. You’ll see that some traces run relatively fast (i.e. just a few milliseconds), whereas others take a few seconds.
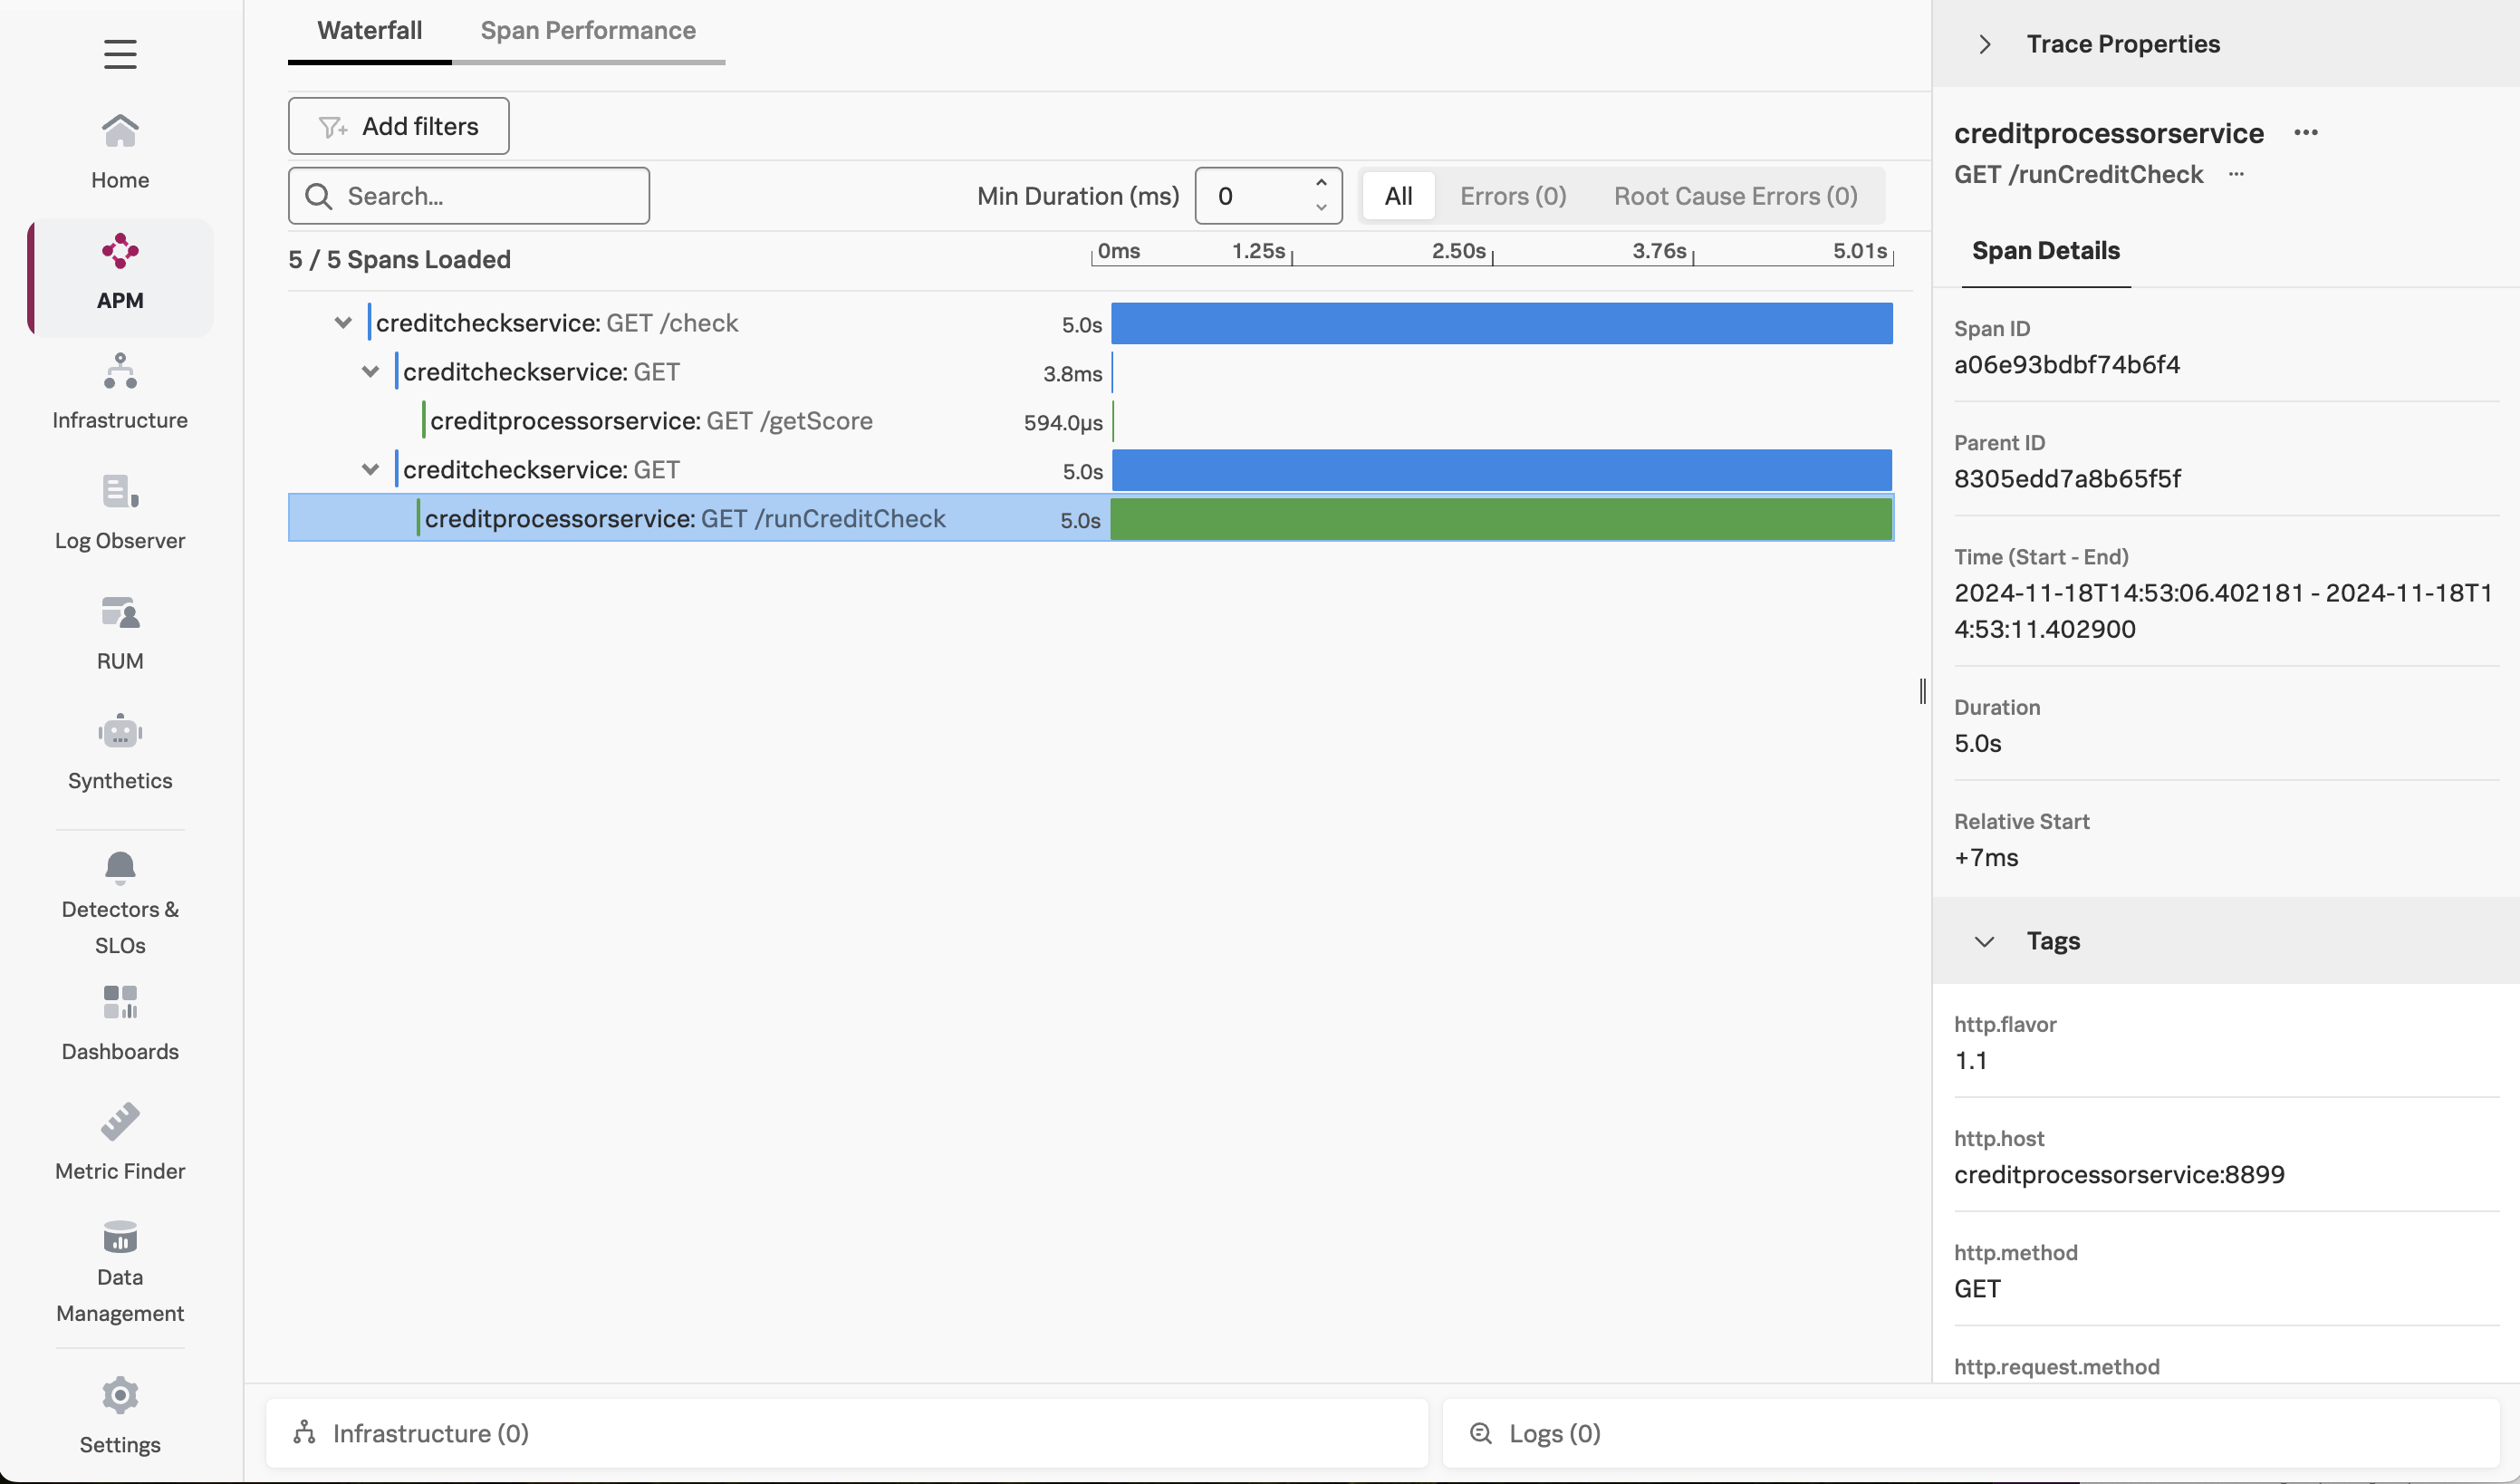
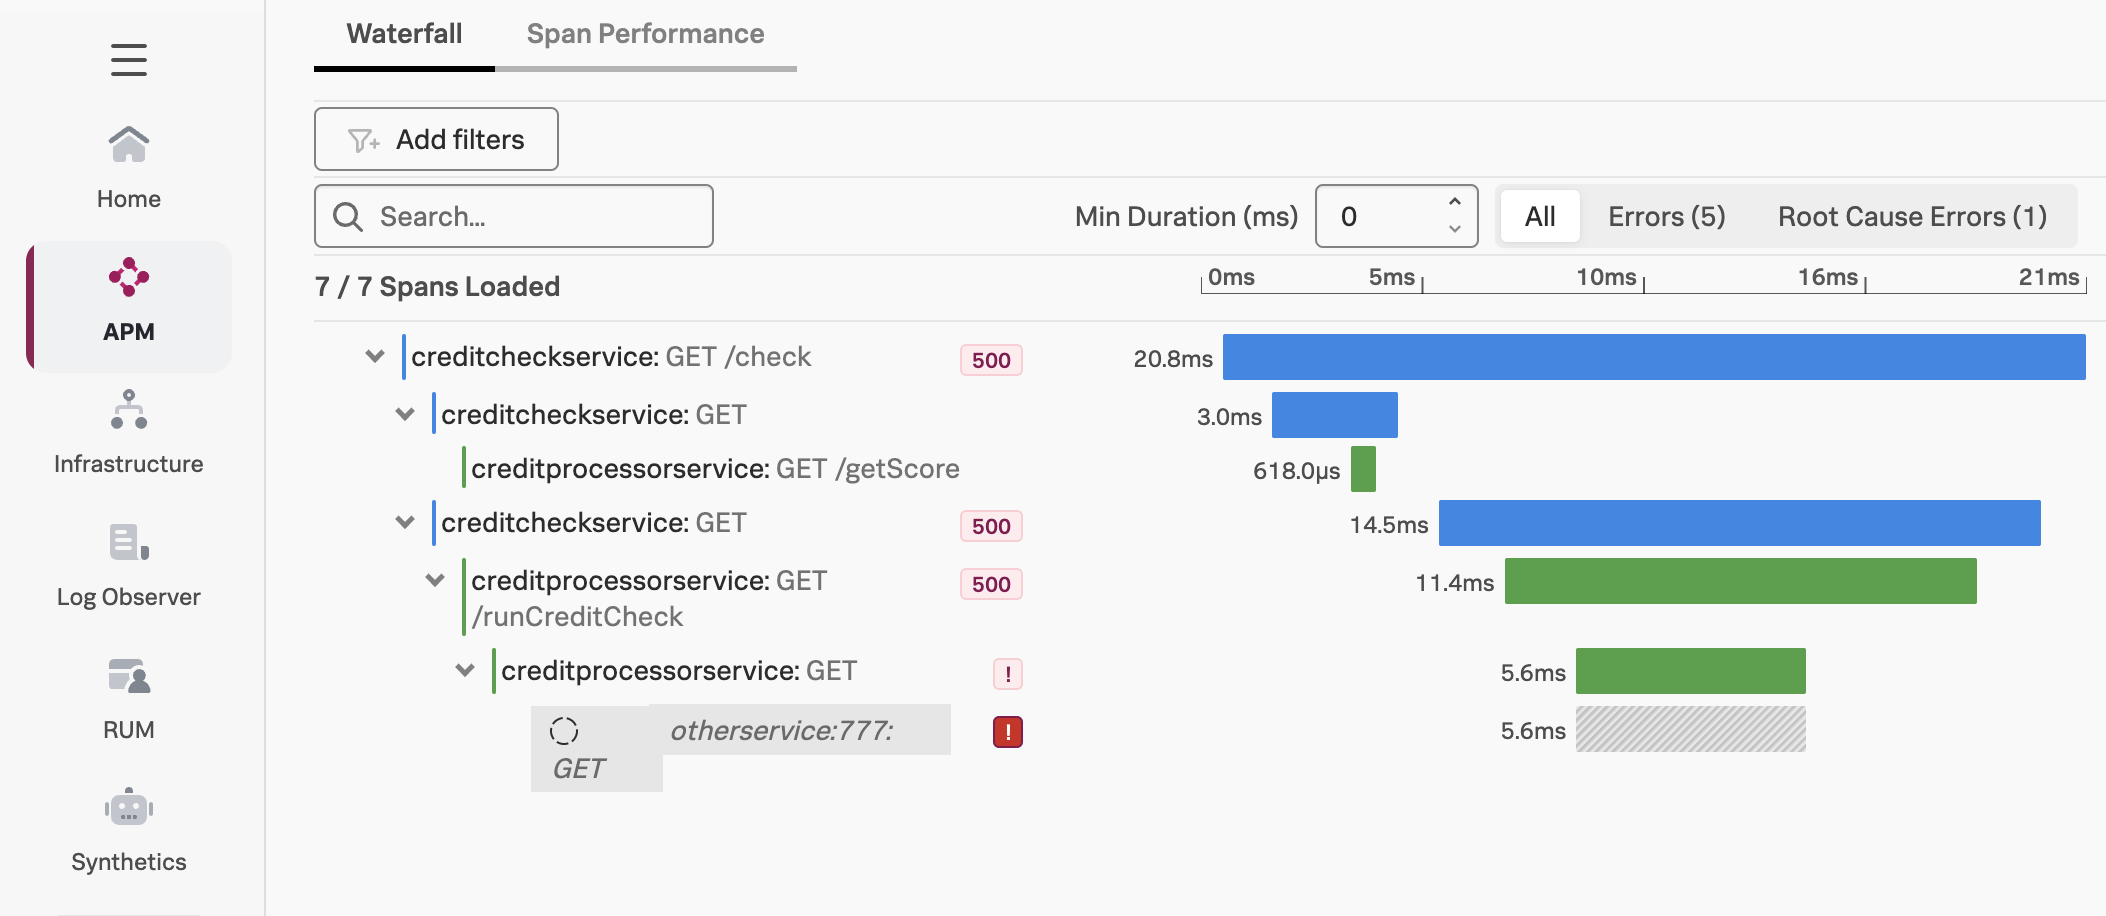
Click on one of the longer running traces. In this example, the trace took five seconds, and we can see that most of the time was spent calling the /runCreditCheck operation, which is part of the creditprocessorservice:
But why are some traces slow, and others are relatively quick?
Close the trace and return to the Trace Analyzer. If you toggle Errors only to on, you’ll also notice that some traces have errors:
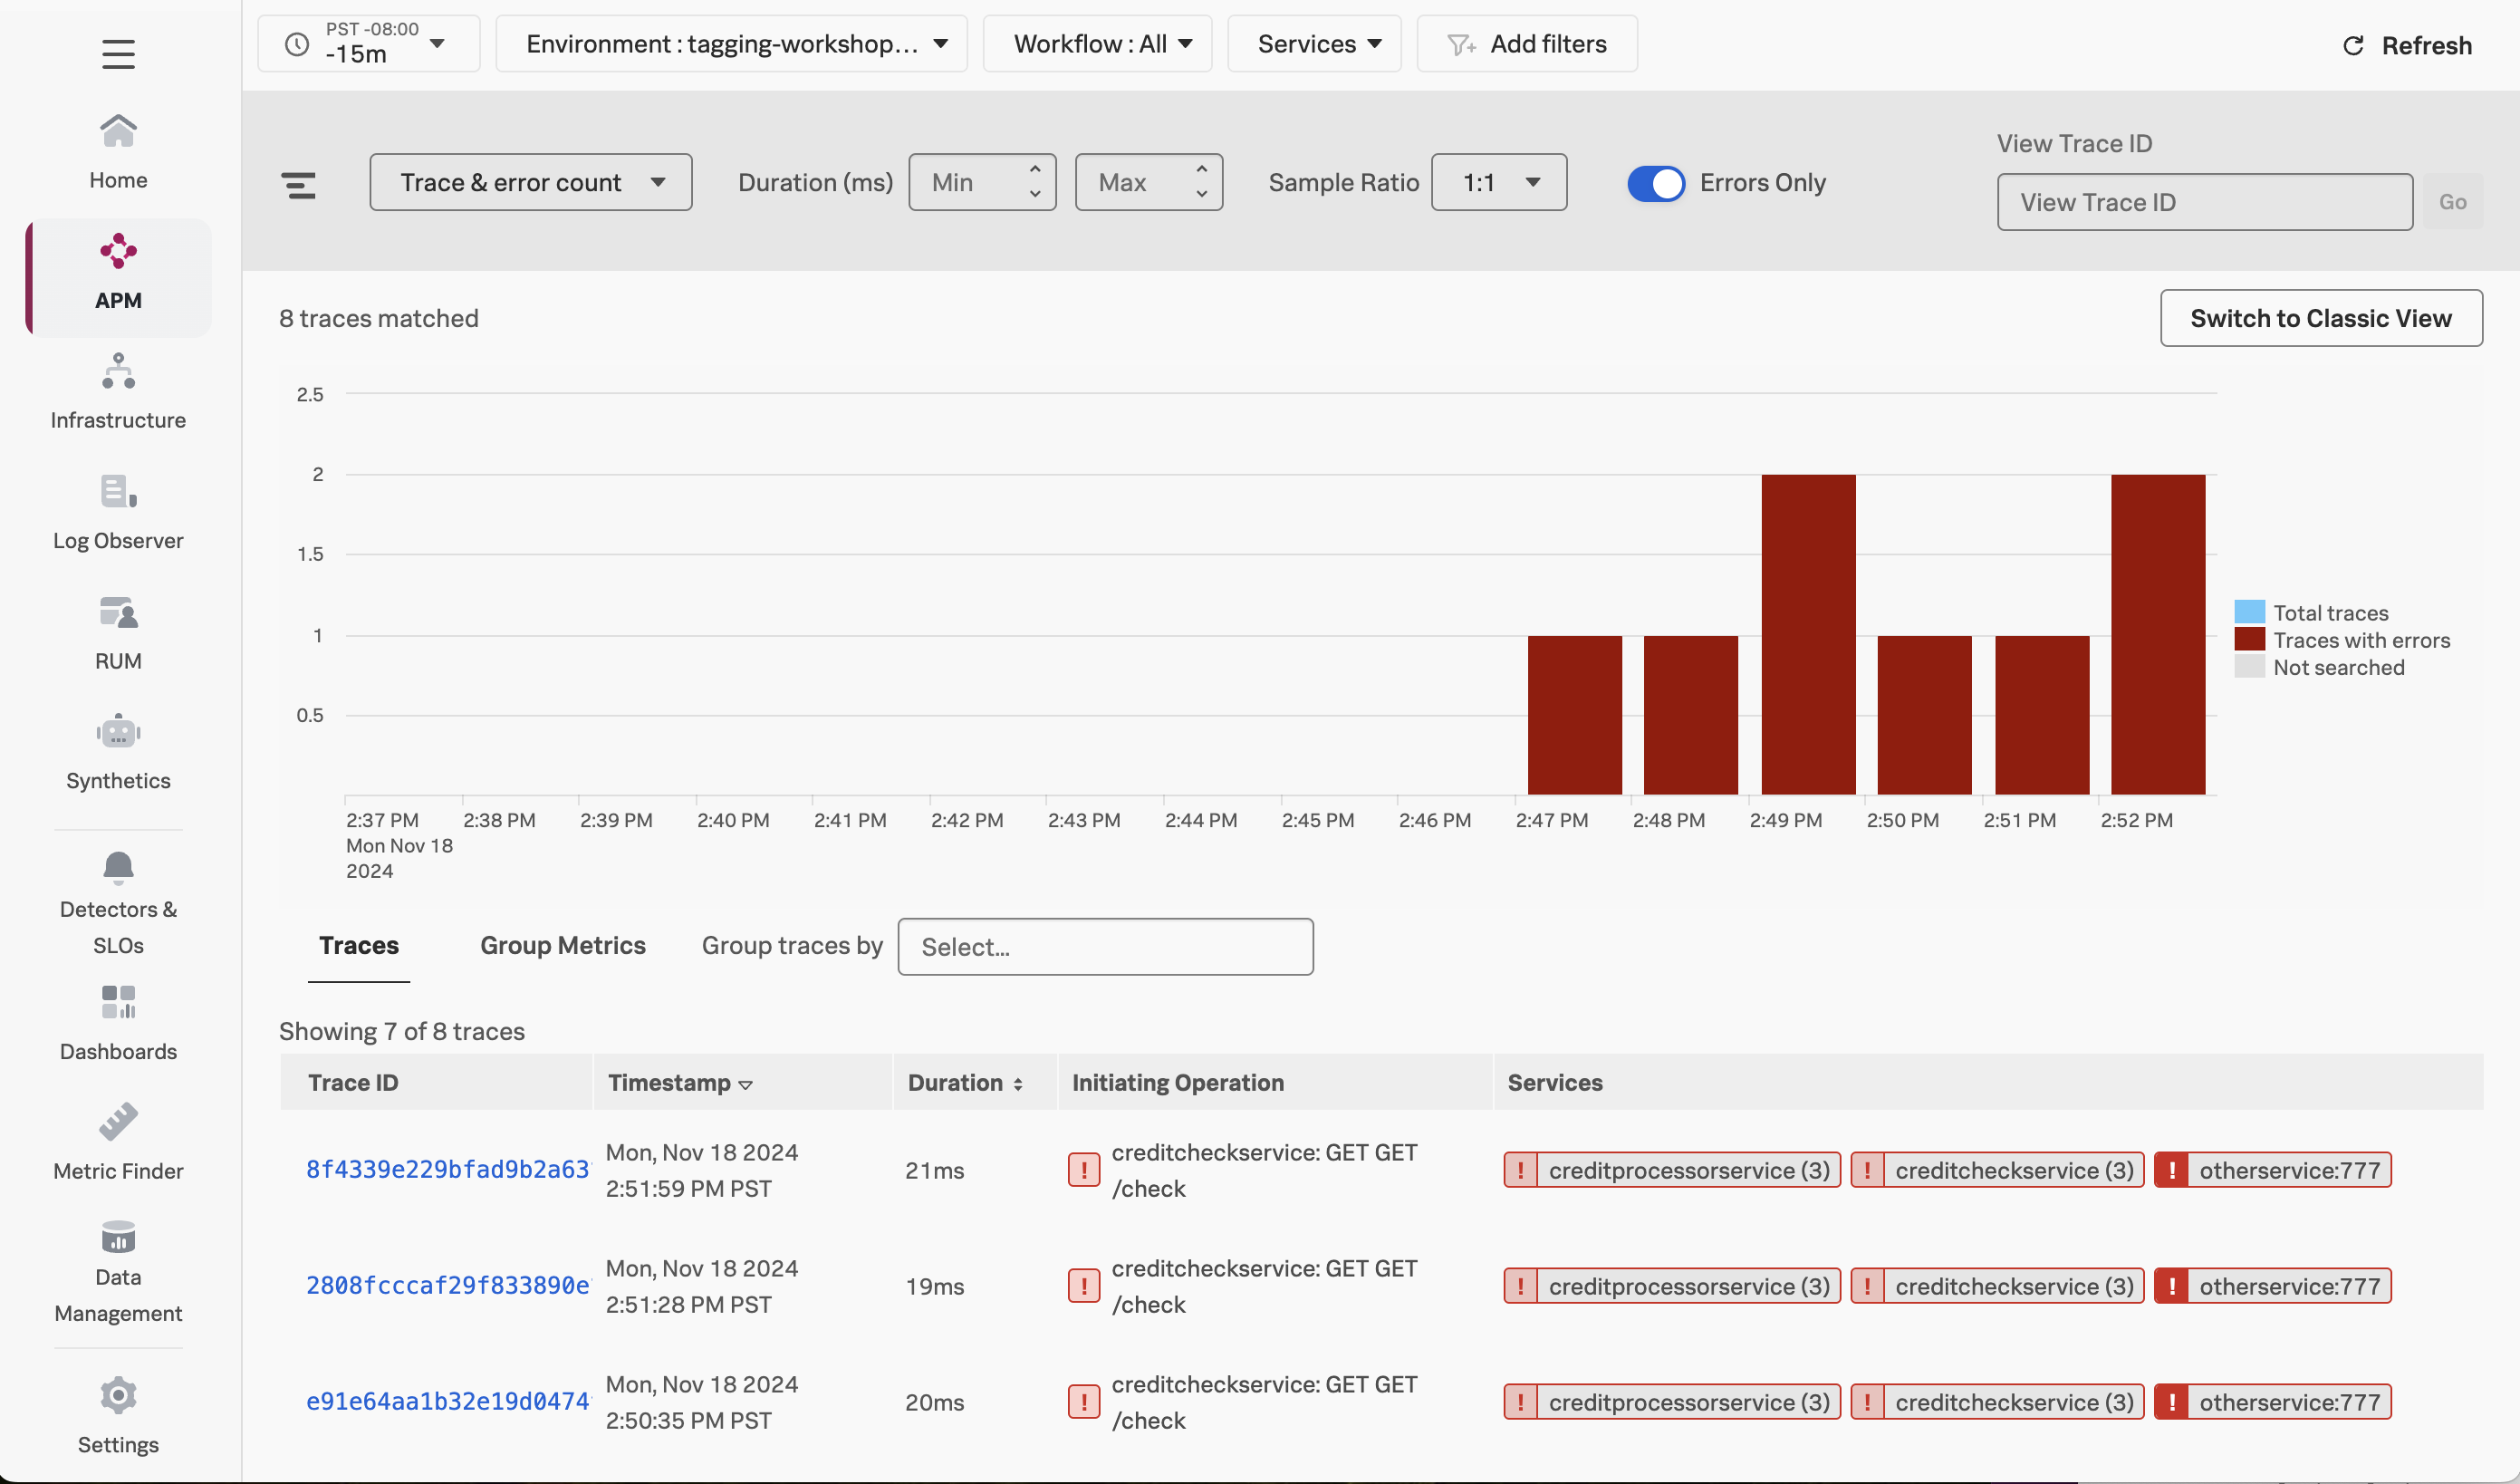
If we look at one of the error traces, we can see that the error occurs when the creditprocessorservice attempts to call another service named otherservice. But why do some requests result in a call to otherservice, and others don’t?
To determine why some requests perform slowly, and why some requests result in errors, we could look through the traces one by one and try to find a pattern behind the issues.
Splunk Observability Cloud provides a better way to find the root cause of an issue. We’ll explore this next.
Using Tag Spotlight
Since we indexed the credit.score.category tag, we can use it with Tag Spotlight to troubleshoot our application.
Navigate to APM then click on Tag Spotlight on the right-hand side. Ensure the creditcheckservice service is selected from the Service drop-down (if not already selected).
With Tag Spotlight, we can see 100% of credit score requests that result in a score of impossible have an error, yet requests for all other credit score types have no errors at all!
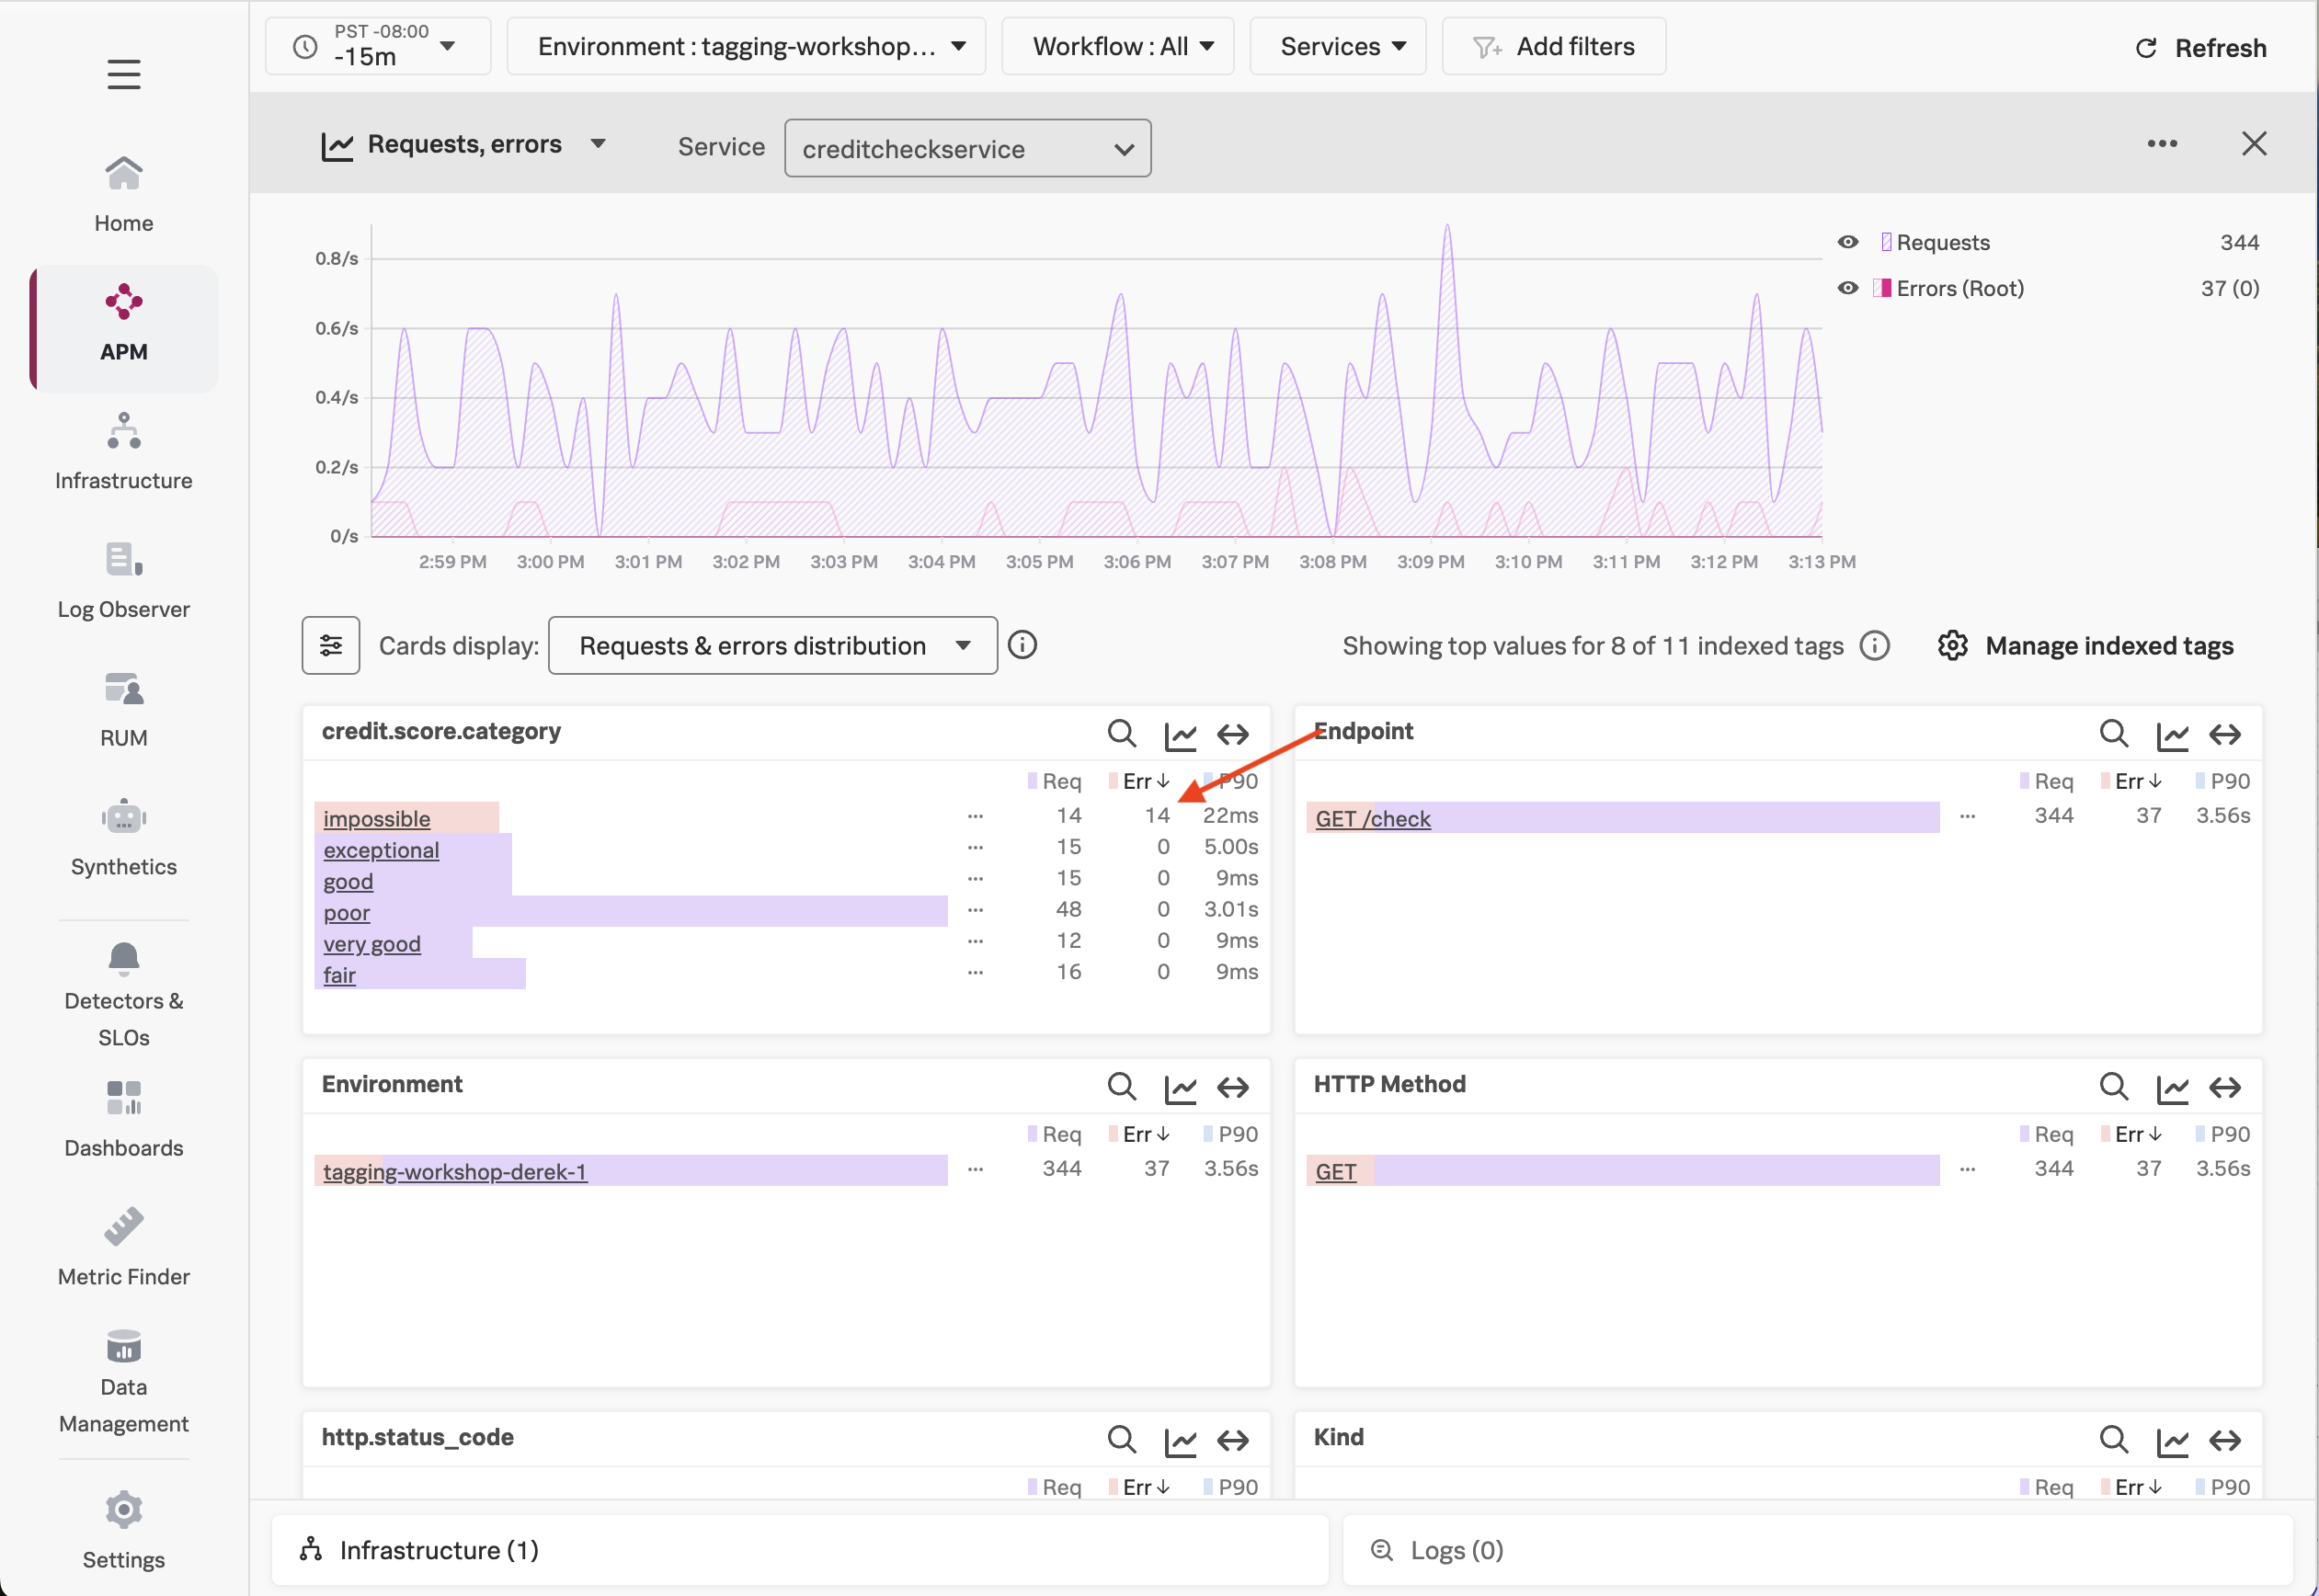
This illustrates the power of Tag Spotlight! Finding this pattern would be time-consuming without it, as we’d have to manually look through hundreds of traces to identify the pattern (and even then, there’s no guarantee we’d find it).
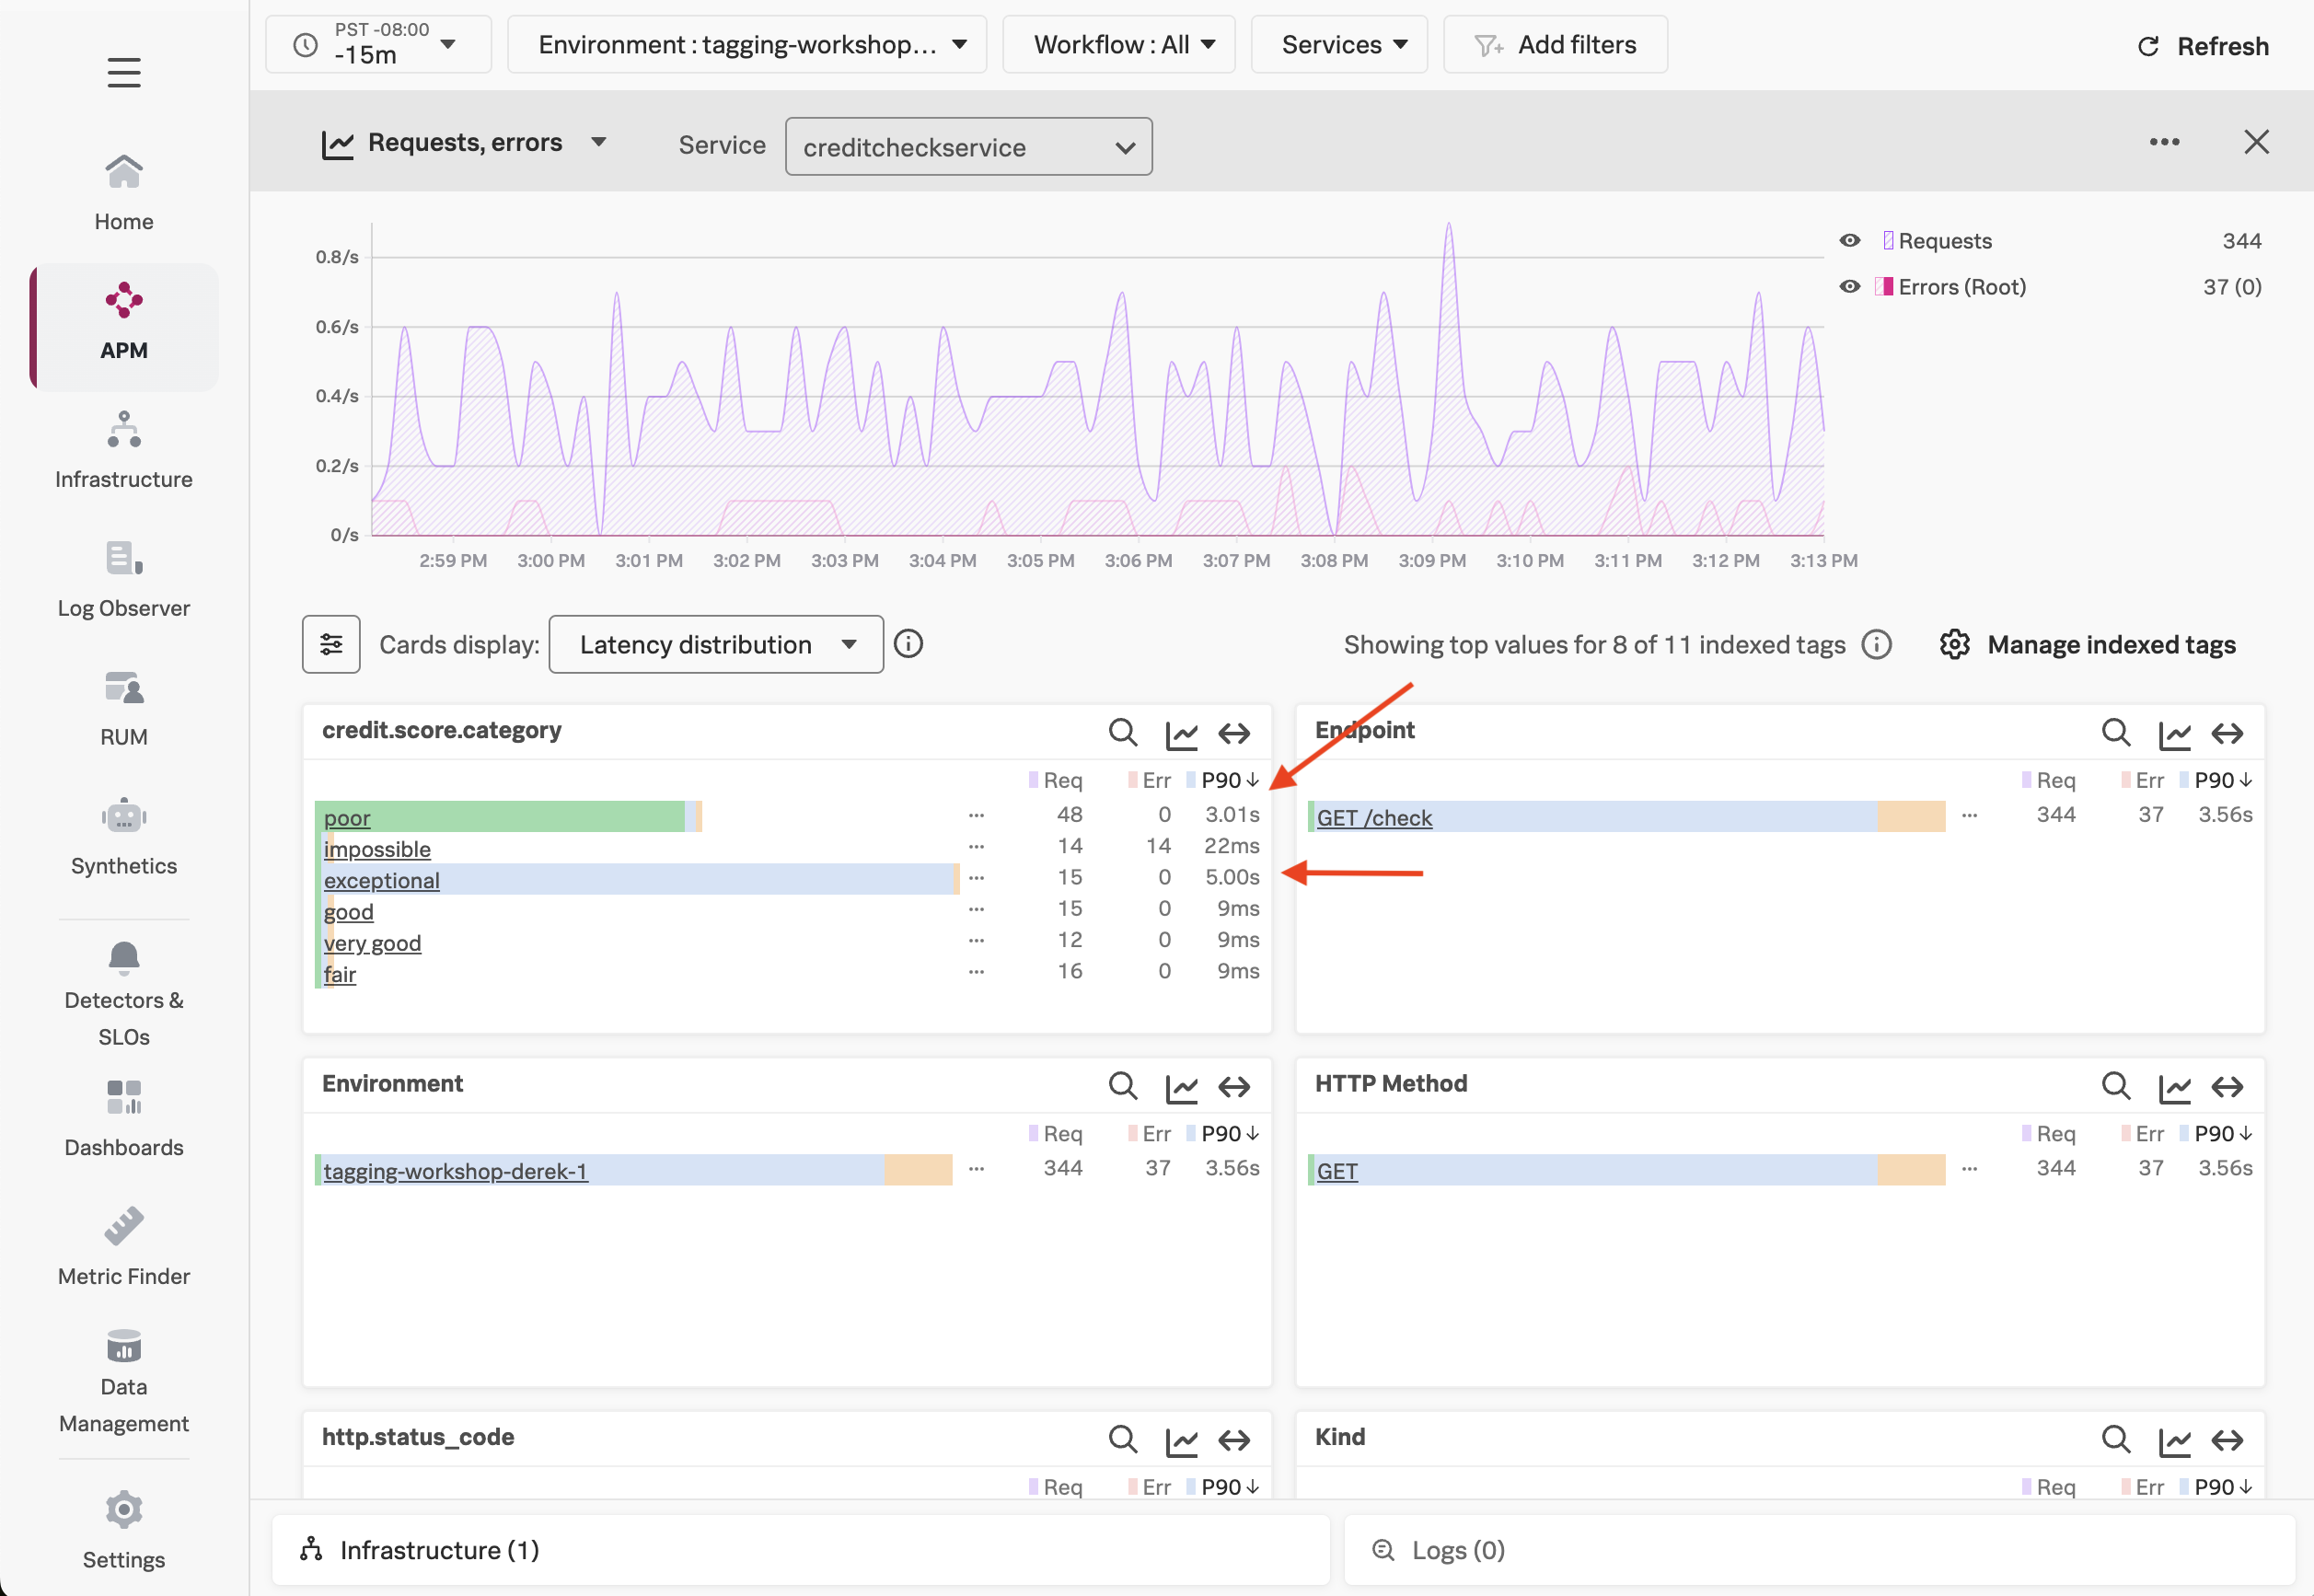
We’ve looked at errors, but what about latency? Let’s click on the Requests & errors distribution dropdown and change it to Latency distribution.
IMPORTANT: Click on the settings icon beside Cards display to add the P50 and P99 metrics.
Here, we can see that the requests with a poor credit score request are running slowly, with P50, P90, and P99 times of around 3 seconds, which is too long for our users to wait, and much slower than other requests.
We can also see that some requests with an exceptional credit score request are running slowly, with P99 times of around 5 seconds, though the P50 response time is relatively quick.
Using Dynamic Service Maps
Now that we know the credit score category associated with the request can impact performance and error rates, let’s explore another feature that utilizes indexed tags: Dynamic Service Maps.
With Dynamic Service Maps, we can breakdown a particular service by a tag. For example, let’s click on APM, then click Service Map to view the service map.
Click on creditcheckservice. Then, on the right-hand menu, click on the drop-down that says Breakdown, and select the credit.score.category tag.
At this point, the service map is updated dynamically, and we can see the performance of requests hitting creditcheckservice broken down by the credit score category:
This view makes it clear that performance for good and fair credit scores is excellent, while poor and exceptional scores are much slower, and impossible scores result in errors.
Our Findings
Tag Spotlight has uncovered several interesting patterns for the engineers that own this service to explore further:
- Why are all the
impossiblecredit score requests resulting in error? - Why are all the
poorcredit score requests running slowly? - Why do some of the
exceptionalrequests run slowly?
As an SRE, passing this context to the engineering team would be extremely helpful for their investigation, as it would allow them to track down the issue much more quickly than if we simply told them that the service was “sometimes slow”.
If you’re curious, have a look at the source code for the creditprocessorservice. You’ll see that requests with impossible, poor, and exceptional credit scores are handled differently, thus resulting in the differences in error rates and latency that we uncovered.
The behavior we saw with our application is typical for modern cloud-native applications, where different inputs passed to a service lead to different code paths, some of which result in slower performance or errors. For example, in a real credit check service, requests resulting in low credit scores may be sent to another downstream service to further evaluate risk, and may perform more slowly than requests resulting in higher scores, or encounter higher error rates.