

Monitoring Agentic AI Applications
Explore Other Agentic AI Frameworks
In earlier sections of this workshop, we focused on instrumenting Agentic AI applications built with LangChain and LangGraph using OpenTelemetry.
In this section, we broaden the scope to cover other popular Agentic AI frameworks and outline the available instrumentation approaches.
At a high level, there are two primary options for instrumenting Agentic AI applications with OpenTelemetry. The best approach depends on the framework used and whether the application already includes existing instrumentation.
Choosing the Right Instrumentation Approach #
Option 1: Splunk OpenTelemetry Instrumentation (Recommended When Available) #
Splunk provides OpenTelemetry instrumentation packages for several widely used Agentic AI frameworks, including:
- CrewAI
- LangChain/LangGraph
- LlamaIndex
- OpenAI SDK
- OpenAI Agents SDK
Choose this approach when:
- Your application uses one of the frameworks listed above.
- You want OpenTelemetry instrumentation optimized for Splunk Observability Cloud with minimal configuration.
- You prefer a zero-code instrumentation experience.
How it works #
Follow the steps in Zero-code instrumentation integrations to instrument your application.
Depending on the framework, you may need to:
- Install additional Splunk OpenTelemetry packages
- Set specific environment variables to enable optional features such as:
- Capturing LLM prompts and completions
- Evaluating semantic quality of LLM responses
- Integrating with Cisco AI Defense
Note: This is the same approach used earlier in the workshop for LangChain and LangGraph, including optional prompt and completion capture.
Option 2: Third-Party Instrumentation Libraries #
If your framework is not directly supported by Splunk OpenTelemetry instrumentation, you can use a third-party library that provides broader framework coverage.
Commonly used third-party instrumentation libraries include:
This approach is well suited when:
- Your application uses an Agentic AI framework not listed in Option 1
- The application is already instrumented with a third-party instrumentation library
- You want to avoid re-instrumenting existing code
Third-party libraries typically emit telemetry in their own formats or earlier OpenTelemetry schemas. To integrate this data with Splunk Observability Cloud:
- Enable a translation layer that converts the emitted telemetry into the latest OpenTelemetry semantic conventions.
- Configure the OpenTelemetry Collector to:
- Receive the translated data
- Export it to Splunk Observability Cloud
For step-by-step instructions, see: Translate and collect data from AI applications instrumented with third-party libraries .
Summary #
| Scenario | Recommended Option |
|---|---|
| Supported framework, minimal setup | Splunk OpenTelemetry Instrumentation |
| Unsupported framework | Third-party instrumentation library |
| Existing third-party instrumentation | Third-party + OpenTelemetry translation |
CrewAI Example #
Let’s walkthrough an example using CrewAI. The travel planner application we’ve
been using during the workshop has been re-written using CrewAI. You can find
the source code in the ~/workshop/agentic-ai/crewai folder.
Note that CrewAI uses a declarative approach to define agents and tasks. For example,
the ~/workshop/agentic-ai/crewai/config/agents.yaml file defines agents such as the
following:
coordinator:
  role: Travel Coordinator
  goal: Extract traveler intent and define a clear execution plan for specialists.
  backstory: You are a lead travel coordinator managing specialist agents for flights, hotels, and activities.
  verbose: true
  allow_delegation: false

flight_specialist:
  role: Flight Booking Specialist
  goal: Find an appealing and practical round-trip flight option.
  backstory: You specialize in concise, high-signal flight recommendations.
  verbose: true
  allow_delegation: false
And the ~/workshop/agentic-ai/crewai/config/tasks.yaml file defines tasks such as the
following:
coordinate_trip:
  description: >
  Read the user request and extract key trip details:
    origin, destination, travel style, and constraints.
    Provide a short execution brief for specialists.
  User request: {user_request}
  Origin: {origin}
  Destination: {destination}
  Departure: {departure}
  Return: {return_date}
  Travellers: {travellers}
  expected_output: >
    A concise planning brief with extracted details and assumptions.
  agent: coordinator
Notice that the following packages were added to the requirements.txt file
to instrument the CrewAI application:
splunk-opentelemetry==2.8.0
splunk-otel-instrumentation-crewai==0.1.3
splunk-otel-instrumentation-openai==0.1.0
splunk-otel-genai-emitters-splunk==0.1.7
splunk-otel-util-genai==0.1.9
opentelemetry-instrumentation-flask==0.59b0
Deploy the CrewAI Example #
Let’s deploy the CrewAI example by first building new Docker images:
cd ~/workshop/agentic-ai/crewai
docker build --platform linux/amd64 -t localhost:9999/agentic-ai-app:crewai .
docker push localhost:9999/agentic-ai-app:crewai
Tip
If the image is taking too long to build, consider using the pre-built
image instead. To do so, update the image name in
the ~/workshop/agentic-ai/crewai/k8s.yaml file to ghcr.io/splunk/agentic-ai-app:crewai
instead of localhost:9999/agentic-ai-app:crewai.
Let’s use a different environment name for this version of the application:
kubectl create configmap instance-config-crewai \
--from-literal=OTEL_RESOURCE_ATTRIBUTES=deployment.environment=agentic-ai-crewai-$INSTANCE \
-n travel-agent
We can then deploy the CrewAI application using the manifest file as follows:
kubectl apply -f ~/workshop/agentic-ai/crewai/k8s.yamlTest the Application in Kubernetes #
Ensure the new application pod has started successfully and the old pod is no longer present:
kubectl get pods -n travel-agentNAME READY STATUS RESTARTS AGE
travel-planner-langchain-68977dc5c4-4w7p9 1/1 Running 0 41sThen, run the following command to test the application:
curl http://travel-planner.localhost/travel/plan \
  -H "Content-Type: application/json" \
  -d '{
    "origin": "Seattle",
    "destination": "Tokyo",
    "user_request": "We are planning a week-long trip to Seattle from Tokyo. Looking for boutique hotel, business-class flights and unique experiences.",
    "travelers": 2
  }'
View Data in Splunk Observability Cloud #
Let’s return to Splunk Observability Cloud to view traces for the CrewAI application.
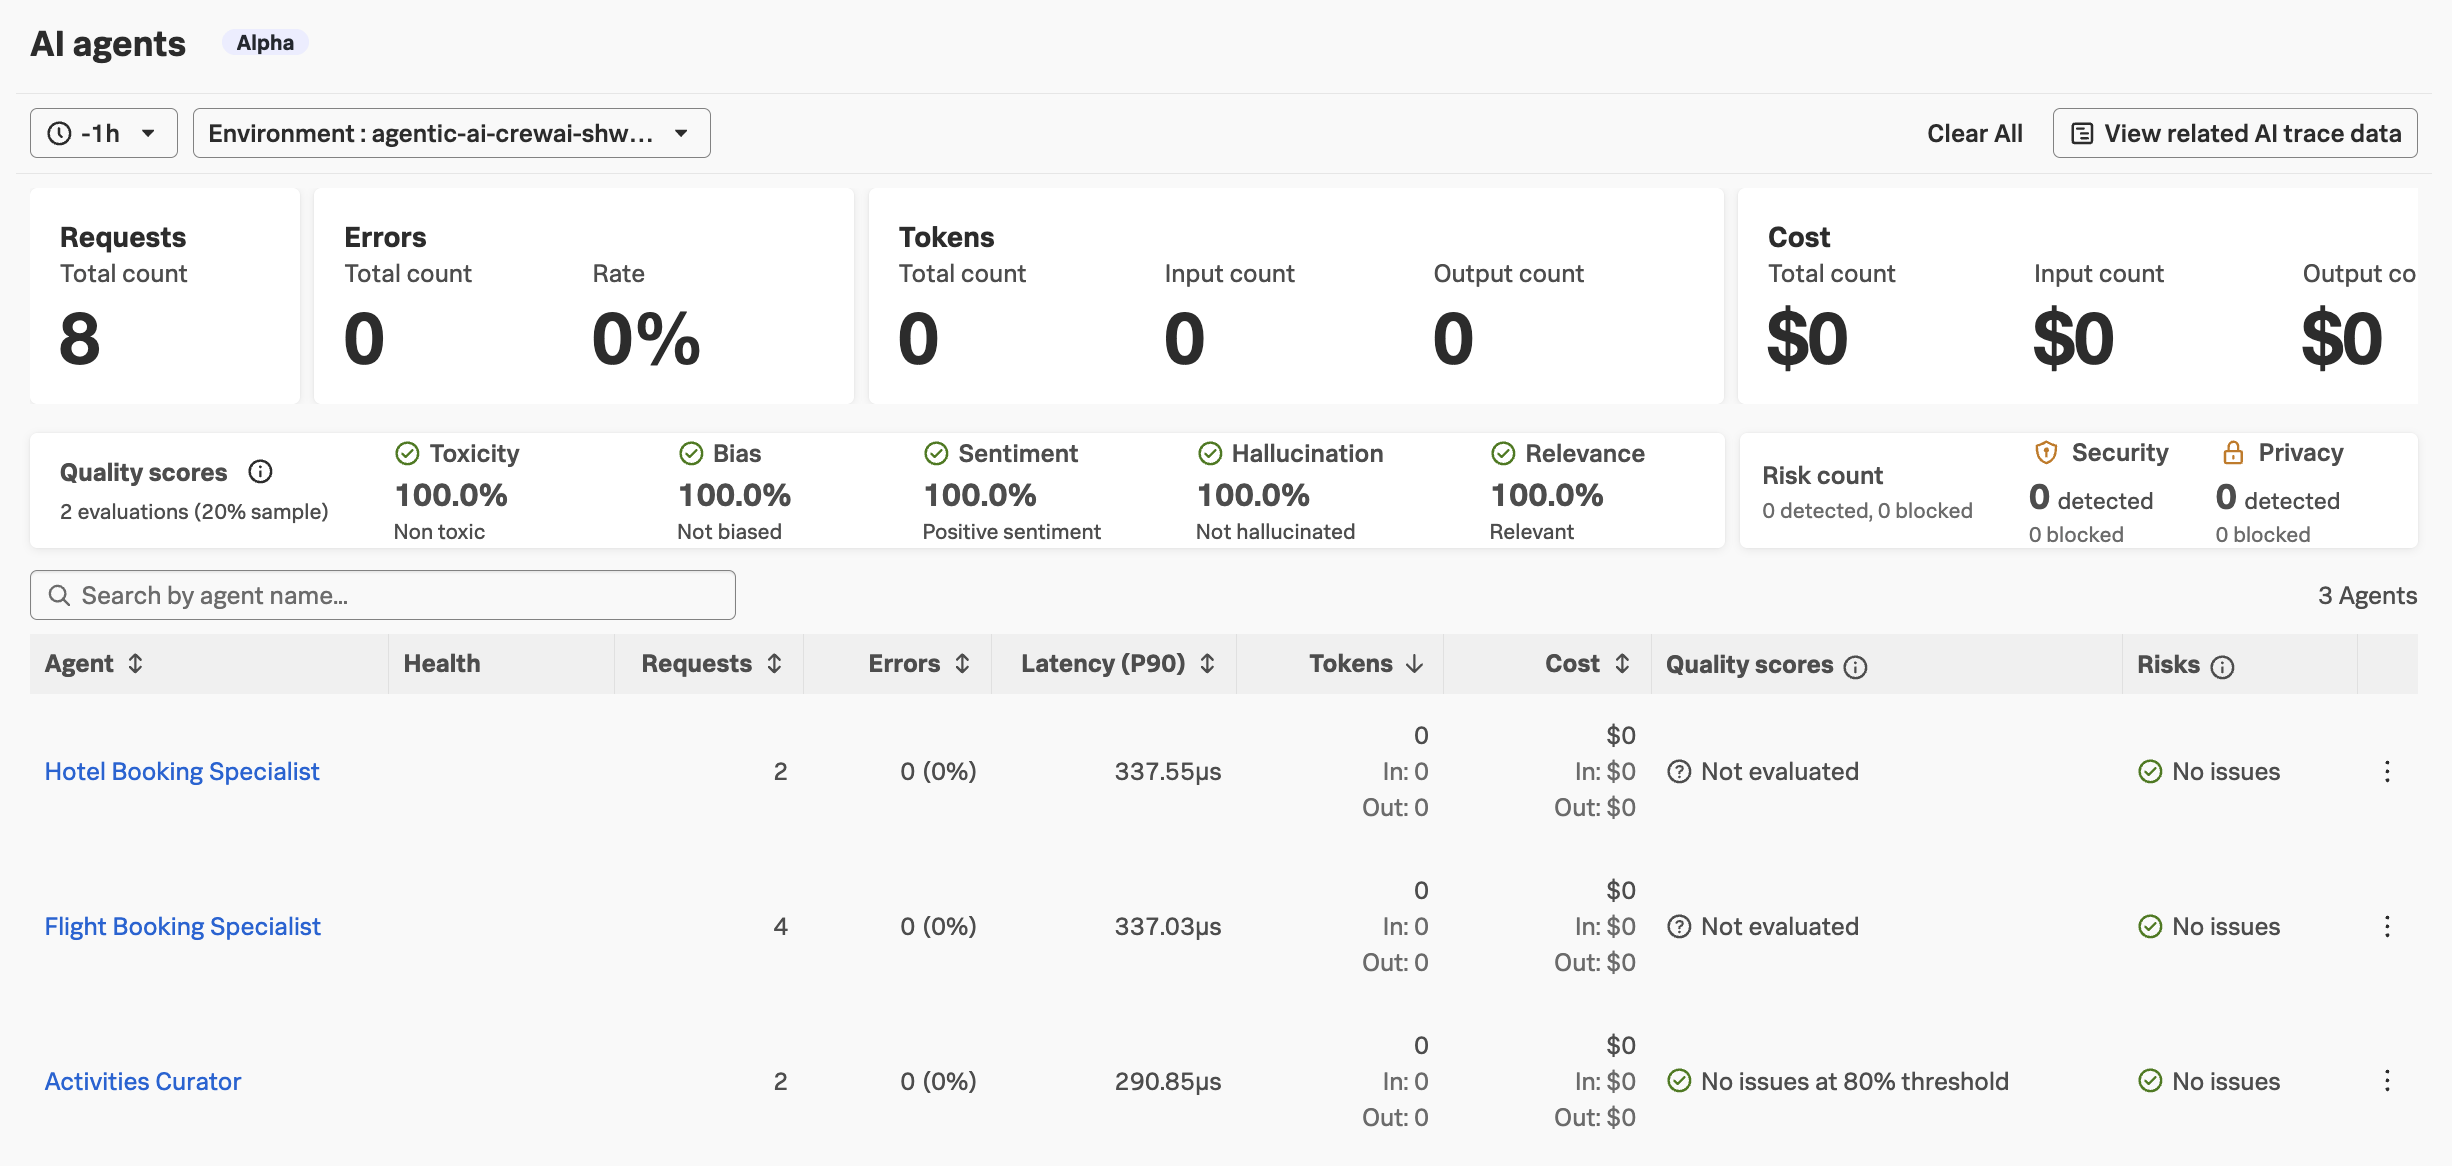
Navigate to APM and then select AI agents. Ensure your environment name
is selected (e.g. agentic-ai-crewai-$INSTANCE). You’ll notice that the agent
names are slightly different:
Navigate to APM -> AI trace data and load the most recent trace.
In the trace, we should see similar details that we captured with the LangChain/LangGraph version of the application:
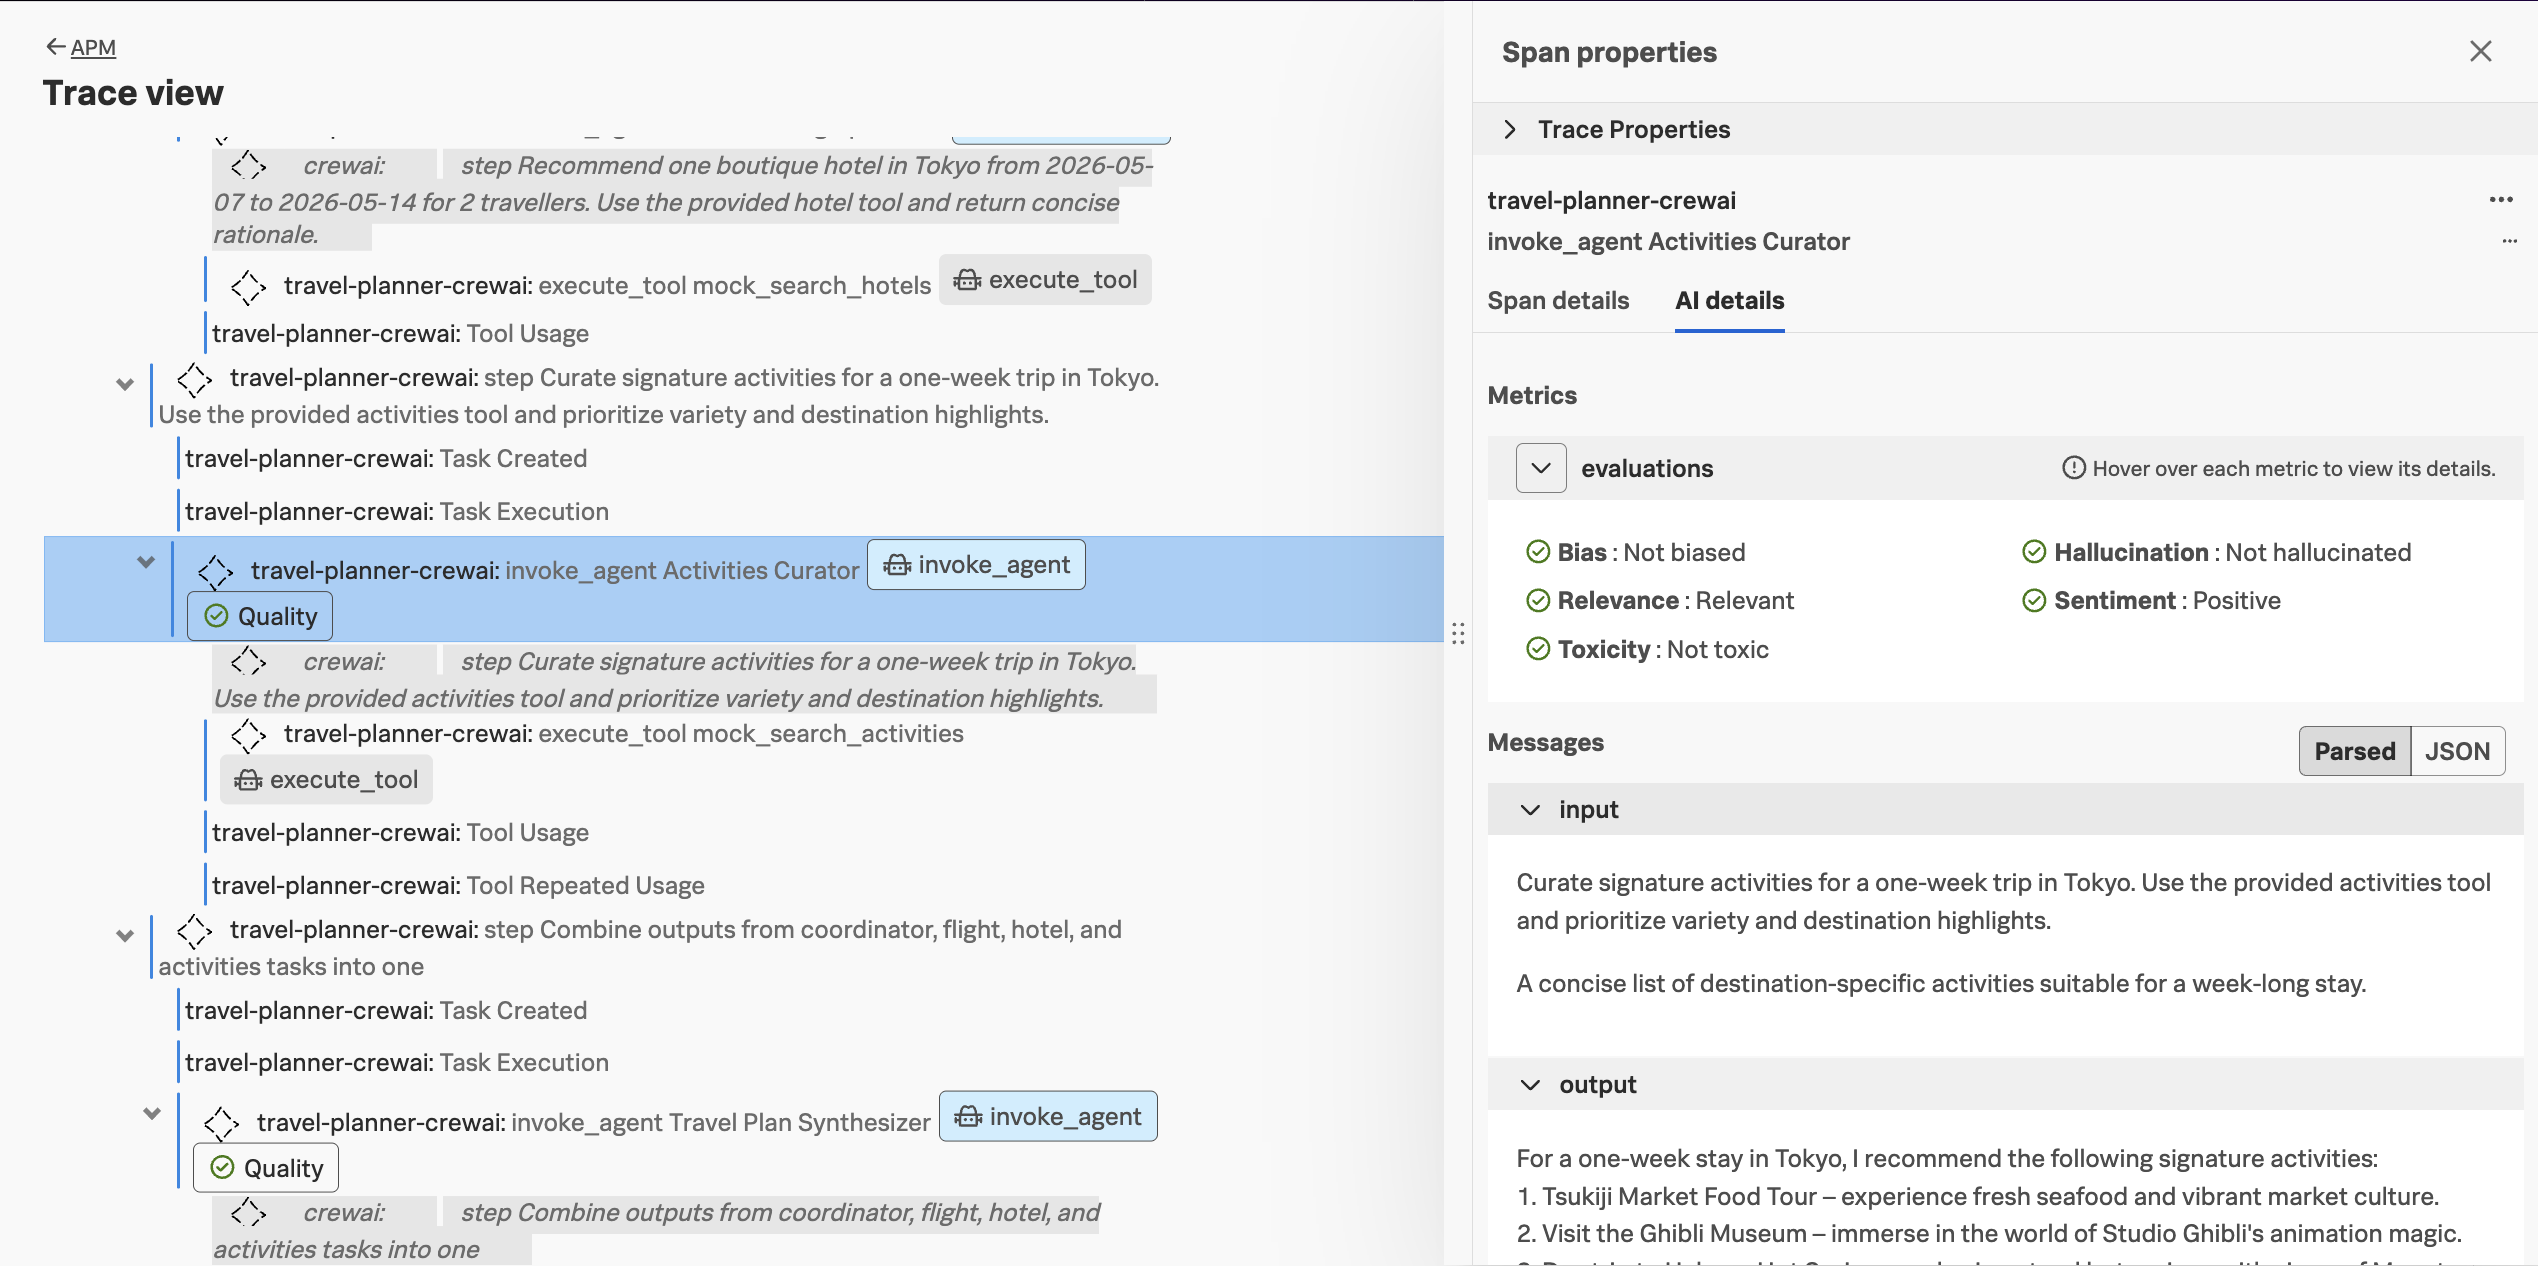
Do you notice anything different about the CrewAI traces compared to LangChain/LangGraph traces?