Monitoring Agentic AI Applications
Review Azure OpenAI Metrics, Dashboards, and Navigators
This workshop will use OpenAI models running in Azure.
You can monitor the performance of Azure OpenAI applications by configuring your Azure OpenAI applications to send metrics to Splunk Observability Cloud.
We’ve already integrated our Azure account with the workshop instance of Splunk Observability Cloud using the steps described in the documentation .
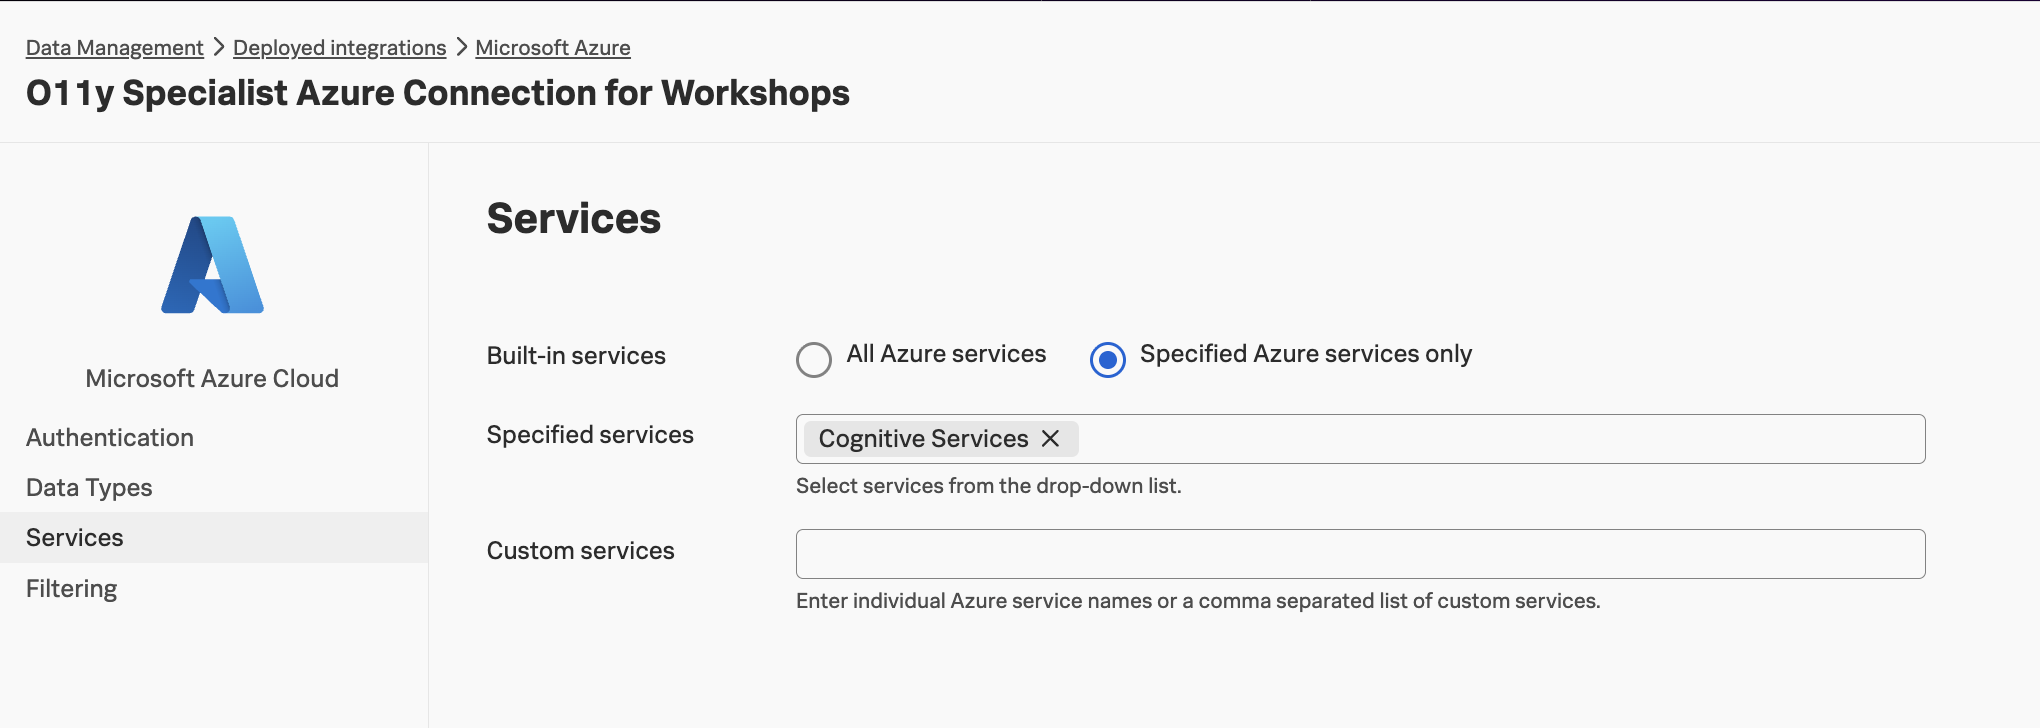
To ensure Azure OpenAI metrics are included, the connection was
configured to pull metrics from Cognitive Services:
Azure OpenAI Metrics #
A number of metrics are captured for Azure OpenAI:
- ProcessedPromptTokens
- GeneratedTokens
- AzureOpenAIRequests
- AzureOpenAITimeToResponse
- AzureOpenAIAvailabilityRate
- AzureOpenAITokenPerSecond
- AzureOpenAIContextTokensCacheMatchRate
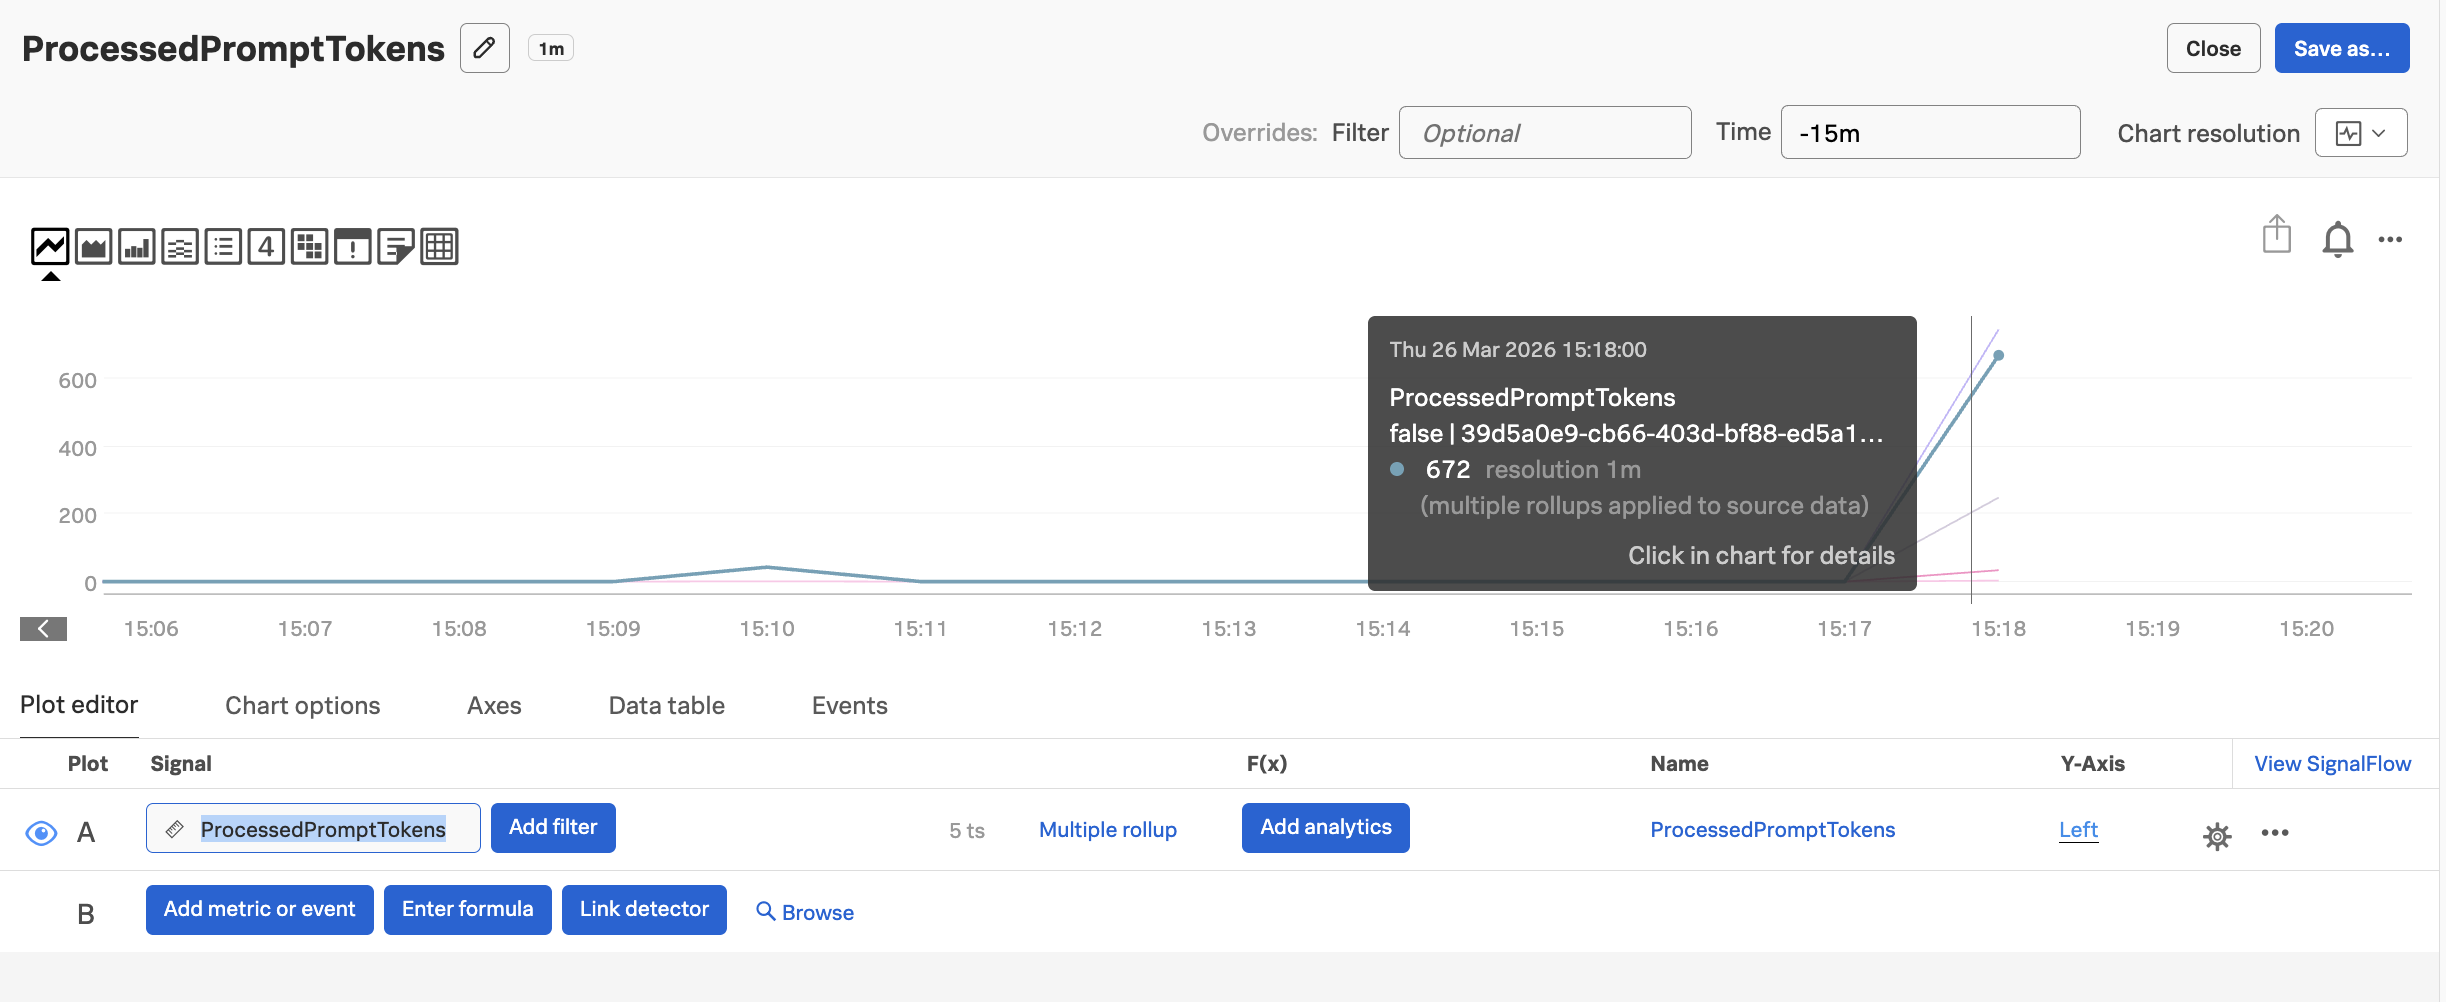
Navigate to Metrics -> Metric finder, and then search for the
ProcessedPromptTokens metric and click View in chart:
Note
You can also use this link to view this metric with the Metric finder.
Azure OpenAI Navigator #
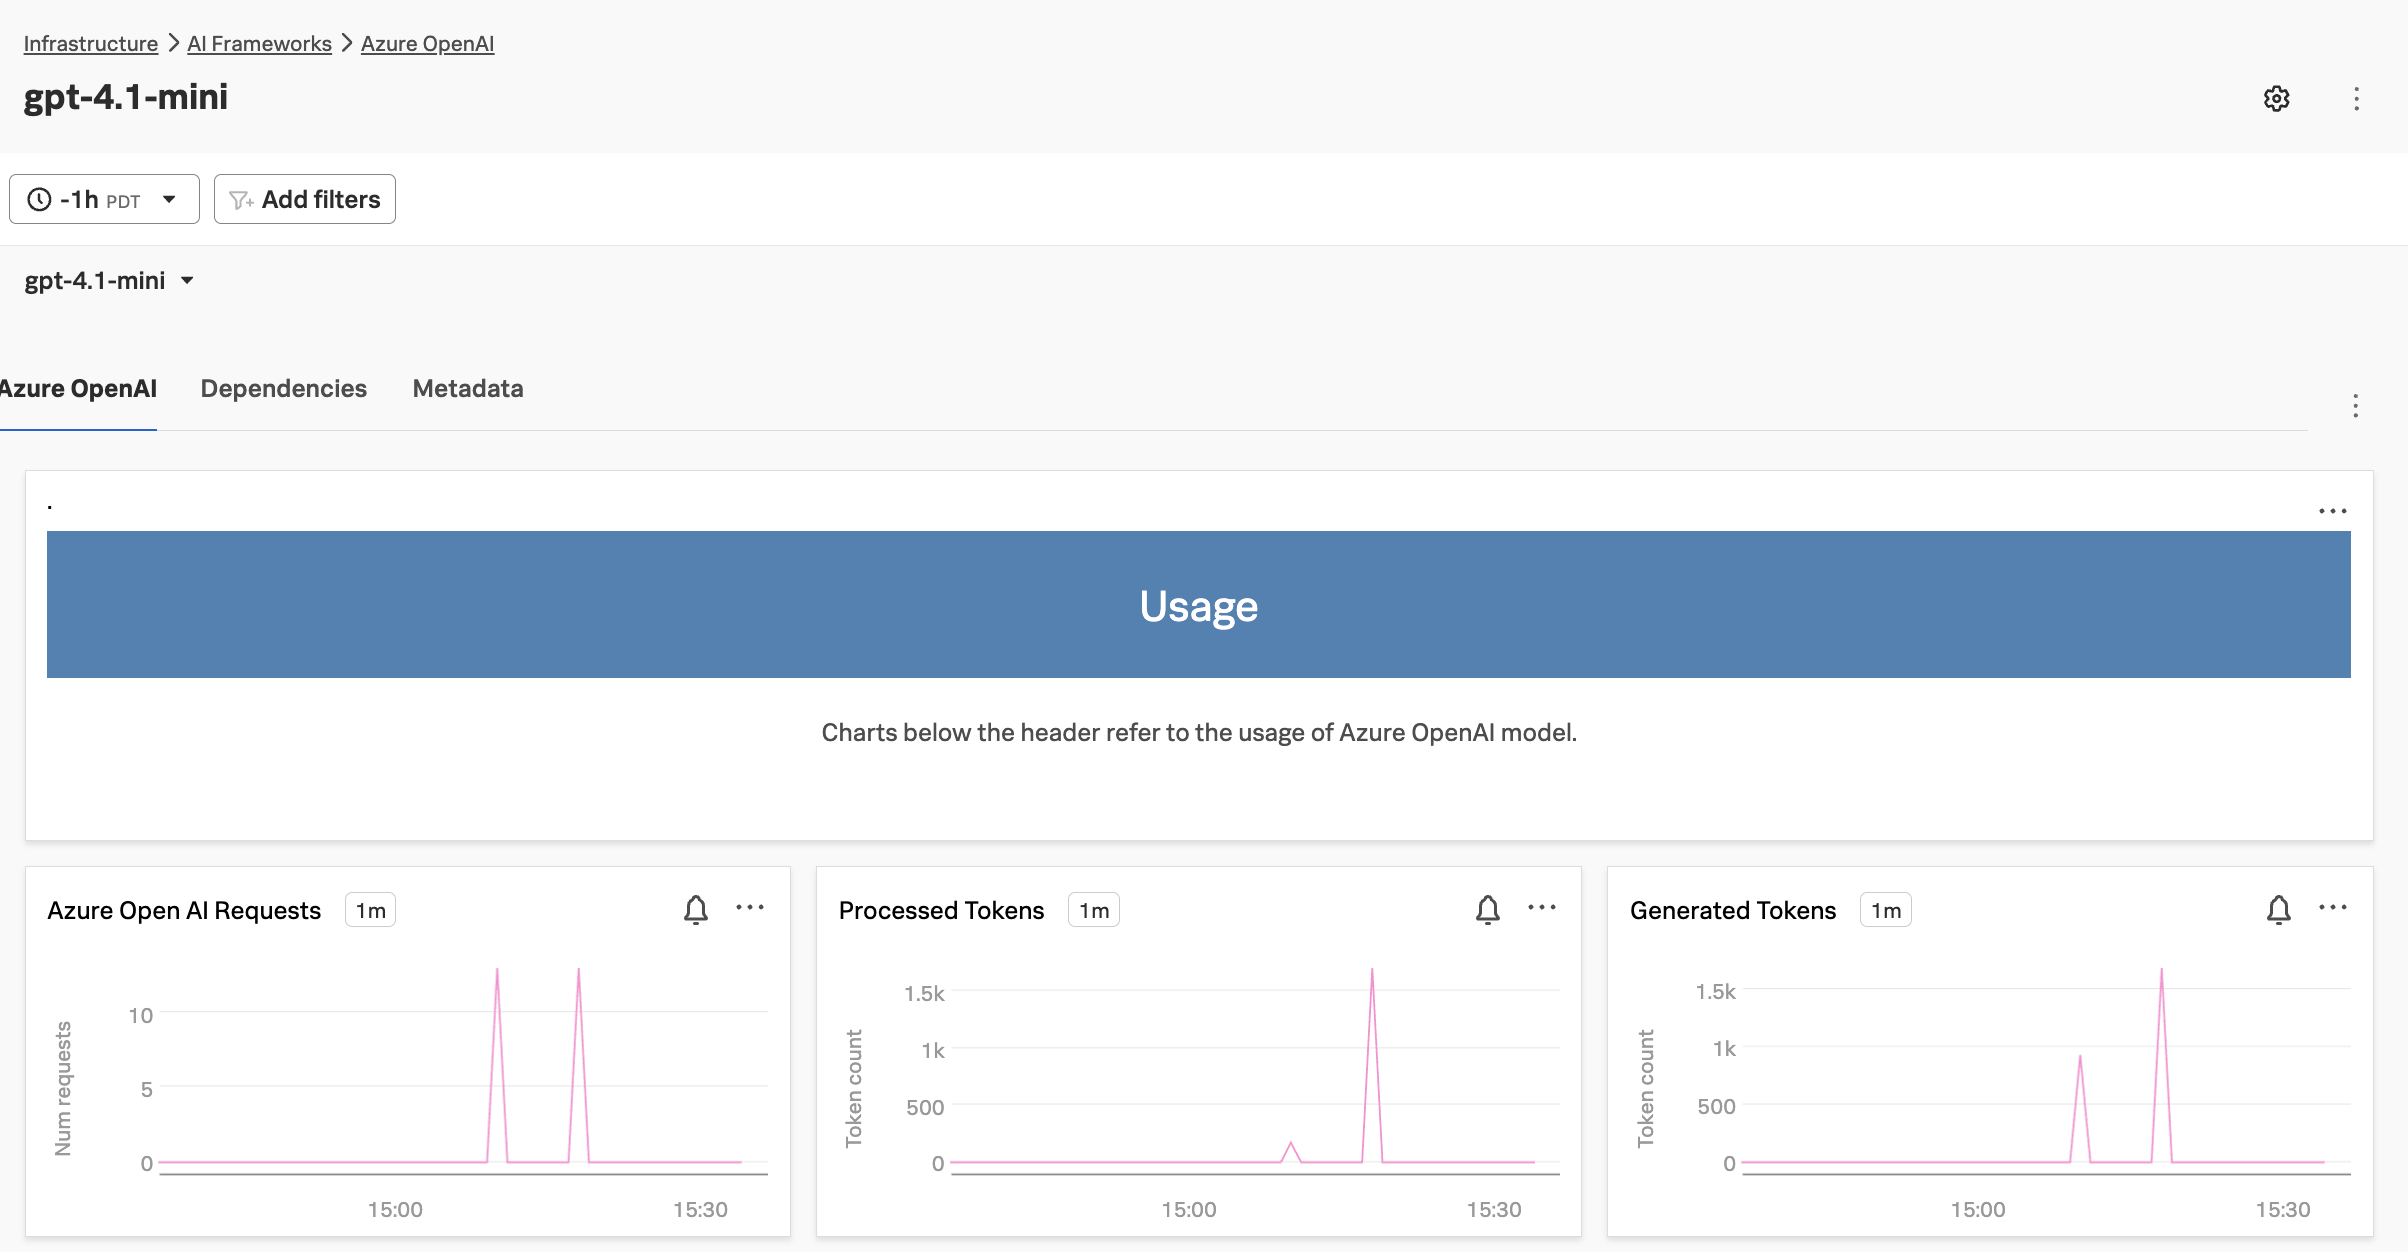
Splunk Observability Cloud collects OpenTelemetry generative AI client and model server metrics to track the token usage and Open AI large-language model (LLM) services running in Azure.
You can view these metrics using the Azure OpenAI navigator. Navigate to Infrastructure -> Overview -> AI Frameworks and then click on Azure OpenAI.
Ensure the Table tab is selected, the click on the gpt-4.1-mini model in the table. You should
see a navigator that looks like the following:
Azure OpenAI Dashboard #
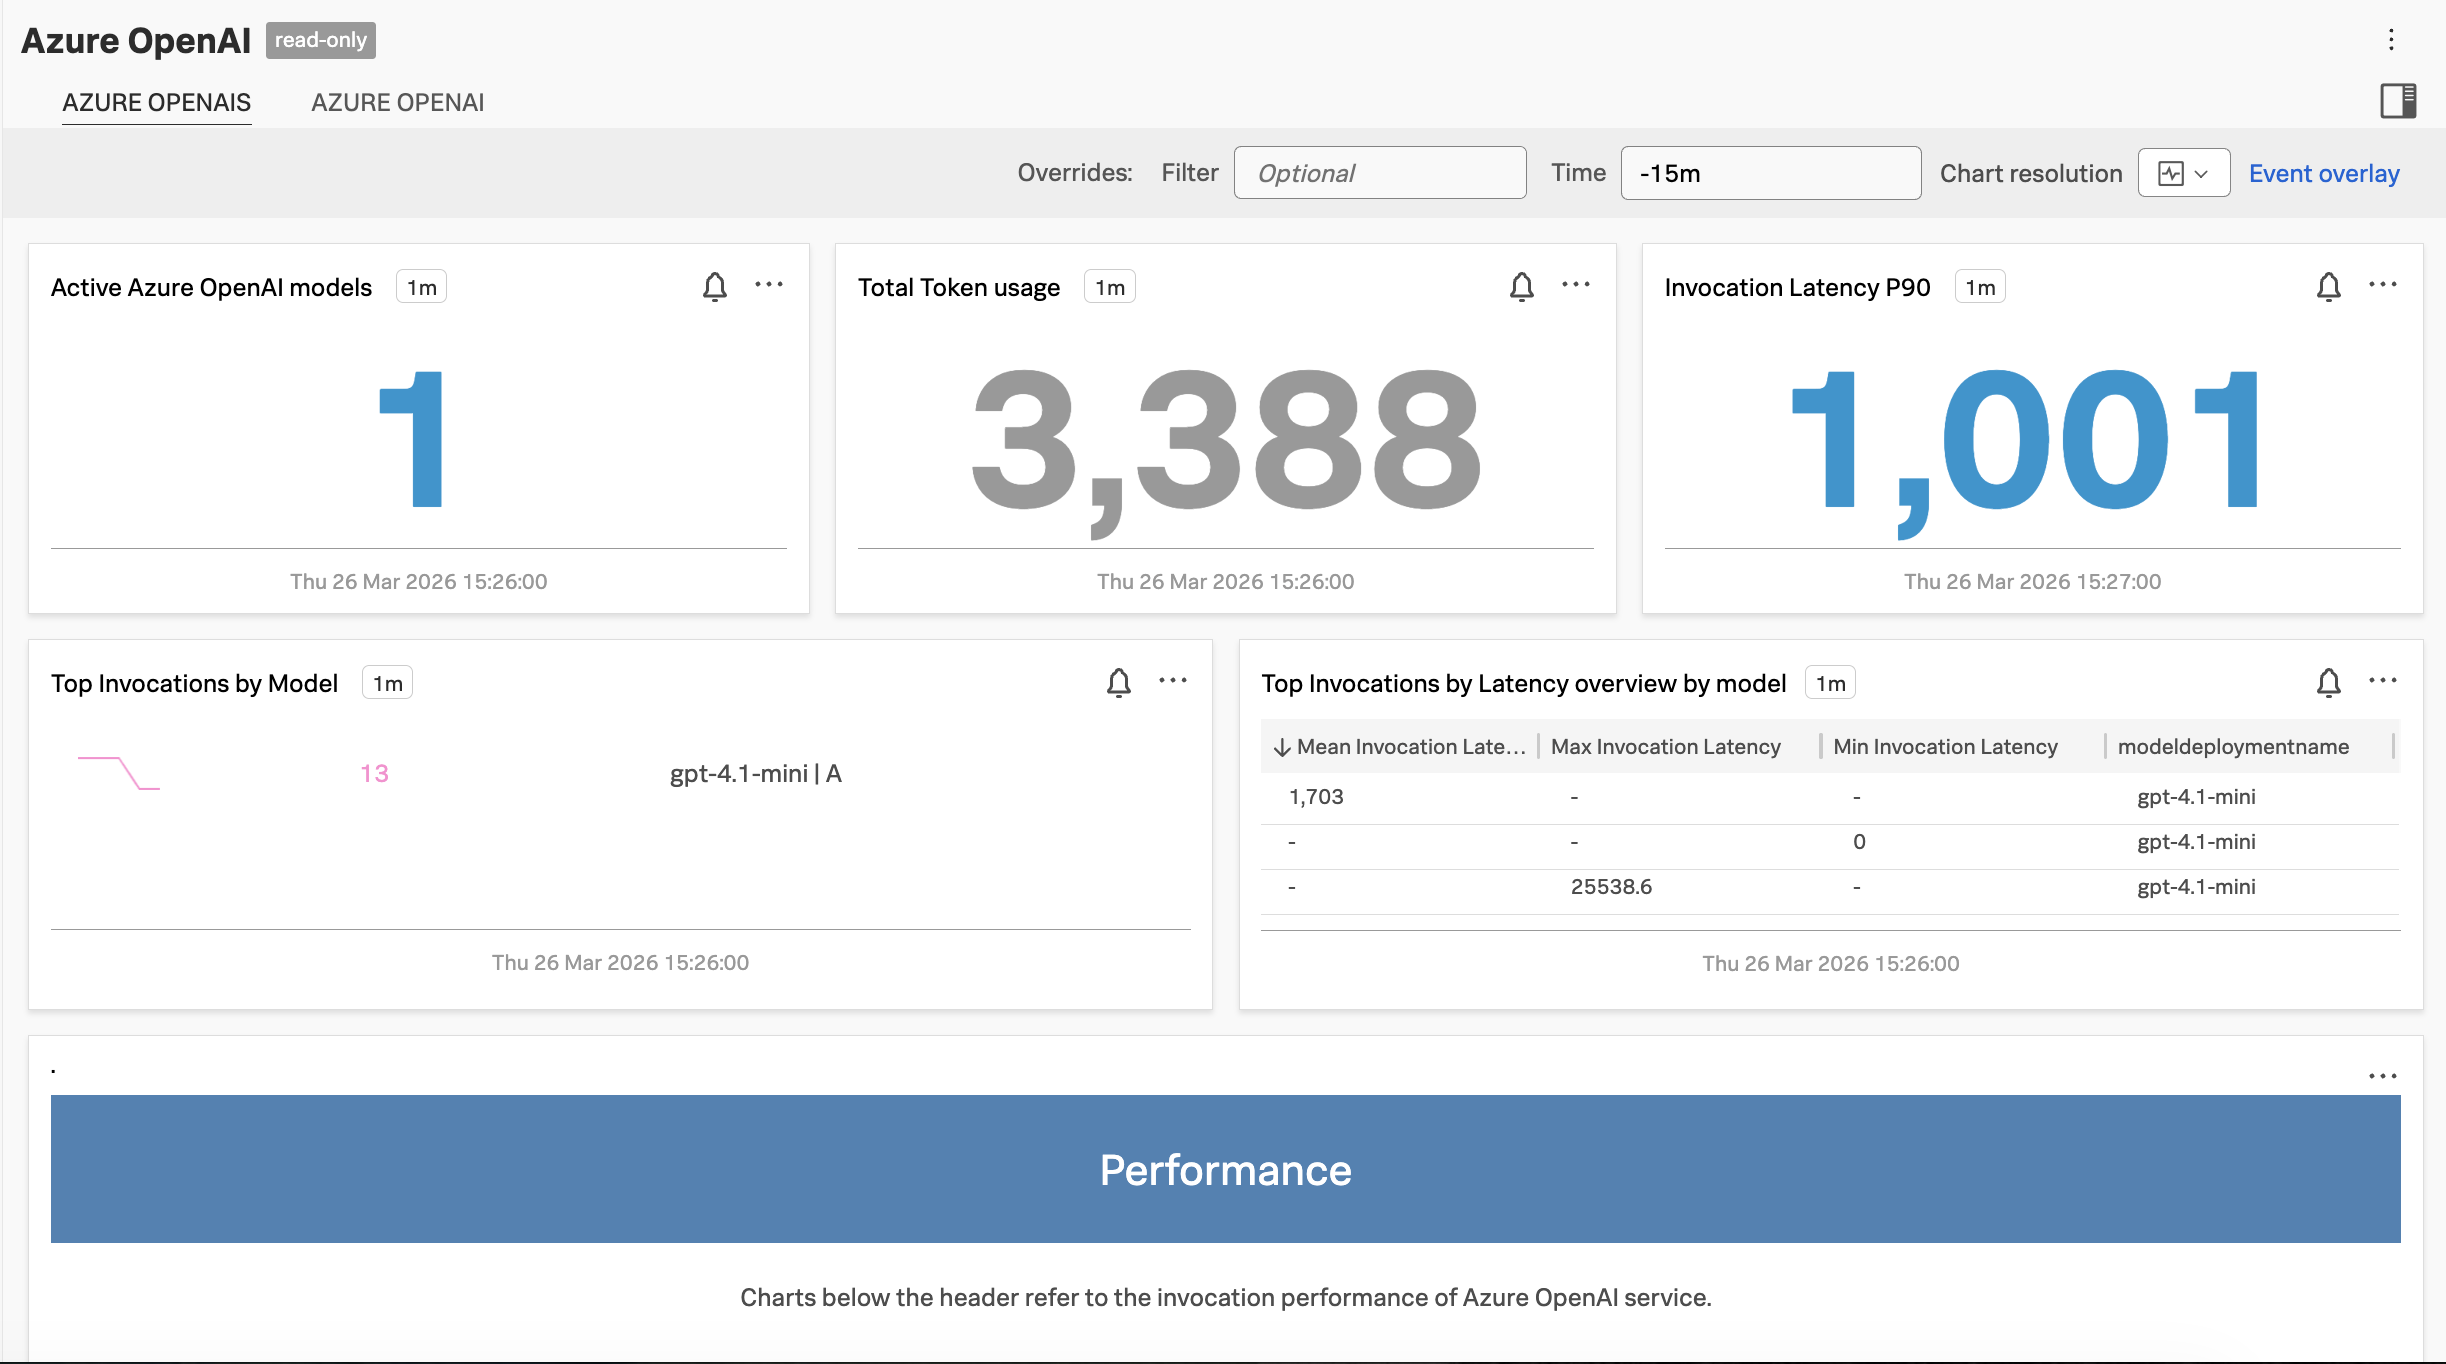
Splunk Observability Cloud provides a built-in dashboard for Azure OpenAI that gives you immediate visibility into:
- The active Azure OpenAI models
- Token usage
- Invocation latency
- Invocations by model
- Time to first byte
- Total response time
- Model availability
- Number of tokens per request
- Number of tokens processed by model
- Number of tokens generated by model
Navigate to Dashboards and then search for Azure OpenAI to view the dashboard: