Monitoring Agentic AI Applications
Deploy the OpenTelemetry Collector
We’ll be using OpenTelemetry throughout the workshop to capture metrics, traces, and logs from an Agentic AI application running in Kubernetes. In this section, we’ll install an OpenTelemetry collector in our Kubernetes cluster using Helm. This will be used to capture metrics, traces, and logs from our environment and send them to Splunk.
Install the Collector using Helm #
We first need to add the helm repo:
helm repo add splunk-otel-collector-chart https://signalfx.github.io/splunk-otel-collector-chartAnd ensure the repo is up-to-date:
helm repo updateTo configure the helm chart deployment, let’s create a new file named values.yaml in
the /home/splunk directory:
# switch to the /home/splunk dir
cd /home/splunk
# create a values.yaml file in vi
vi values.yaml
Then paste the following contents:
Tip
Type :set paste before pasting the contents, to prevent vi from auto-indenting the pasted code.
agent:
  config:
    exporters:
      signalfx:
        send_otlp_histograms: true
Tip
To save your changes in vi, press the esc key to enter command mode, then type :wq! followed by pressing the enter/return key.
This custom configuration ensures that any histogram metrics received by the exporter
will be sent to Splunk Observability backend in OTLP format without conversion
to SignalFx format. This setting is critical to ensure that histogram metrics used
by AI Agent Monitoring such as gen_ai.evaluation.score are processed as expected.
Now we can use the following command to install the collector:
  helm upgrade --install splunk-otel-collector --version 0.136.0 \
  --set="splunkObservability.realm=$REALM" \
  --set="splunkObservability.accessToken=$ACCESS_TOKEN" \
  --set="clusterName=$INSTANCE-cluster" \
  --set="environment=agentic-ai-$INSTANCE" \
  --set="splunkPlatform.token=$HEC_TOKEN" \
  --set="splunkPlatform.endpoint=$HEC_URL" \
  --set="splunkPlatform.index=splunk4rookies-workshop" \
  -f values.yaml \
splunk-otel-collector-chart/splunk-otel-collectorNAME: splunk-otel-collector
LAST DEPLOYED: Fri Dec 20 01:01:43 2024
NAMESPACE: default
STATUS: deployed
REVISION: 1
TEST SUITE: None
NOTES:
Splunk OpenTelemetry Collector is installed and configured to send data to Splunk Observability realm us1.Confirm the Collector is Running #
We can confirm whether the collector is running with the following command:
kubectl get podsNAME READY STATUS RESTARTS AGE
splunk-otel-collector-agent-dkn88 1/1 Running 0 53s
splunk-otel-collector-agent-ksmh4 1/1 Running 0 53s
splunk-otel-collector-agent-lc2lf 1/1 Running 0 53s
splunk-otel-collector-k8s-cluster-receiver-dbf64995b-xgm9b 1/1 Running 0 53sConfirm your K8s Cluster is in O11y Cloud #
Using the New Kubernetes Experience #
If you’re configured to use the new Kubernetes experience in O11y Cloud, follow the steps in this section. Otherwise, refer to the Using the Traditional Kubernetes Experience section instead.
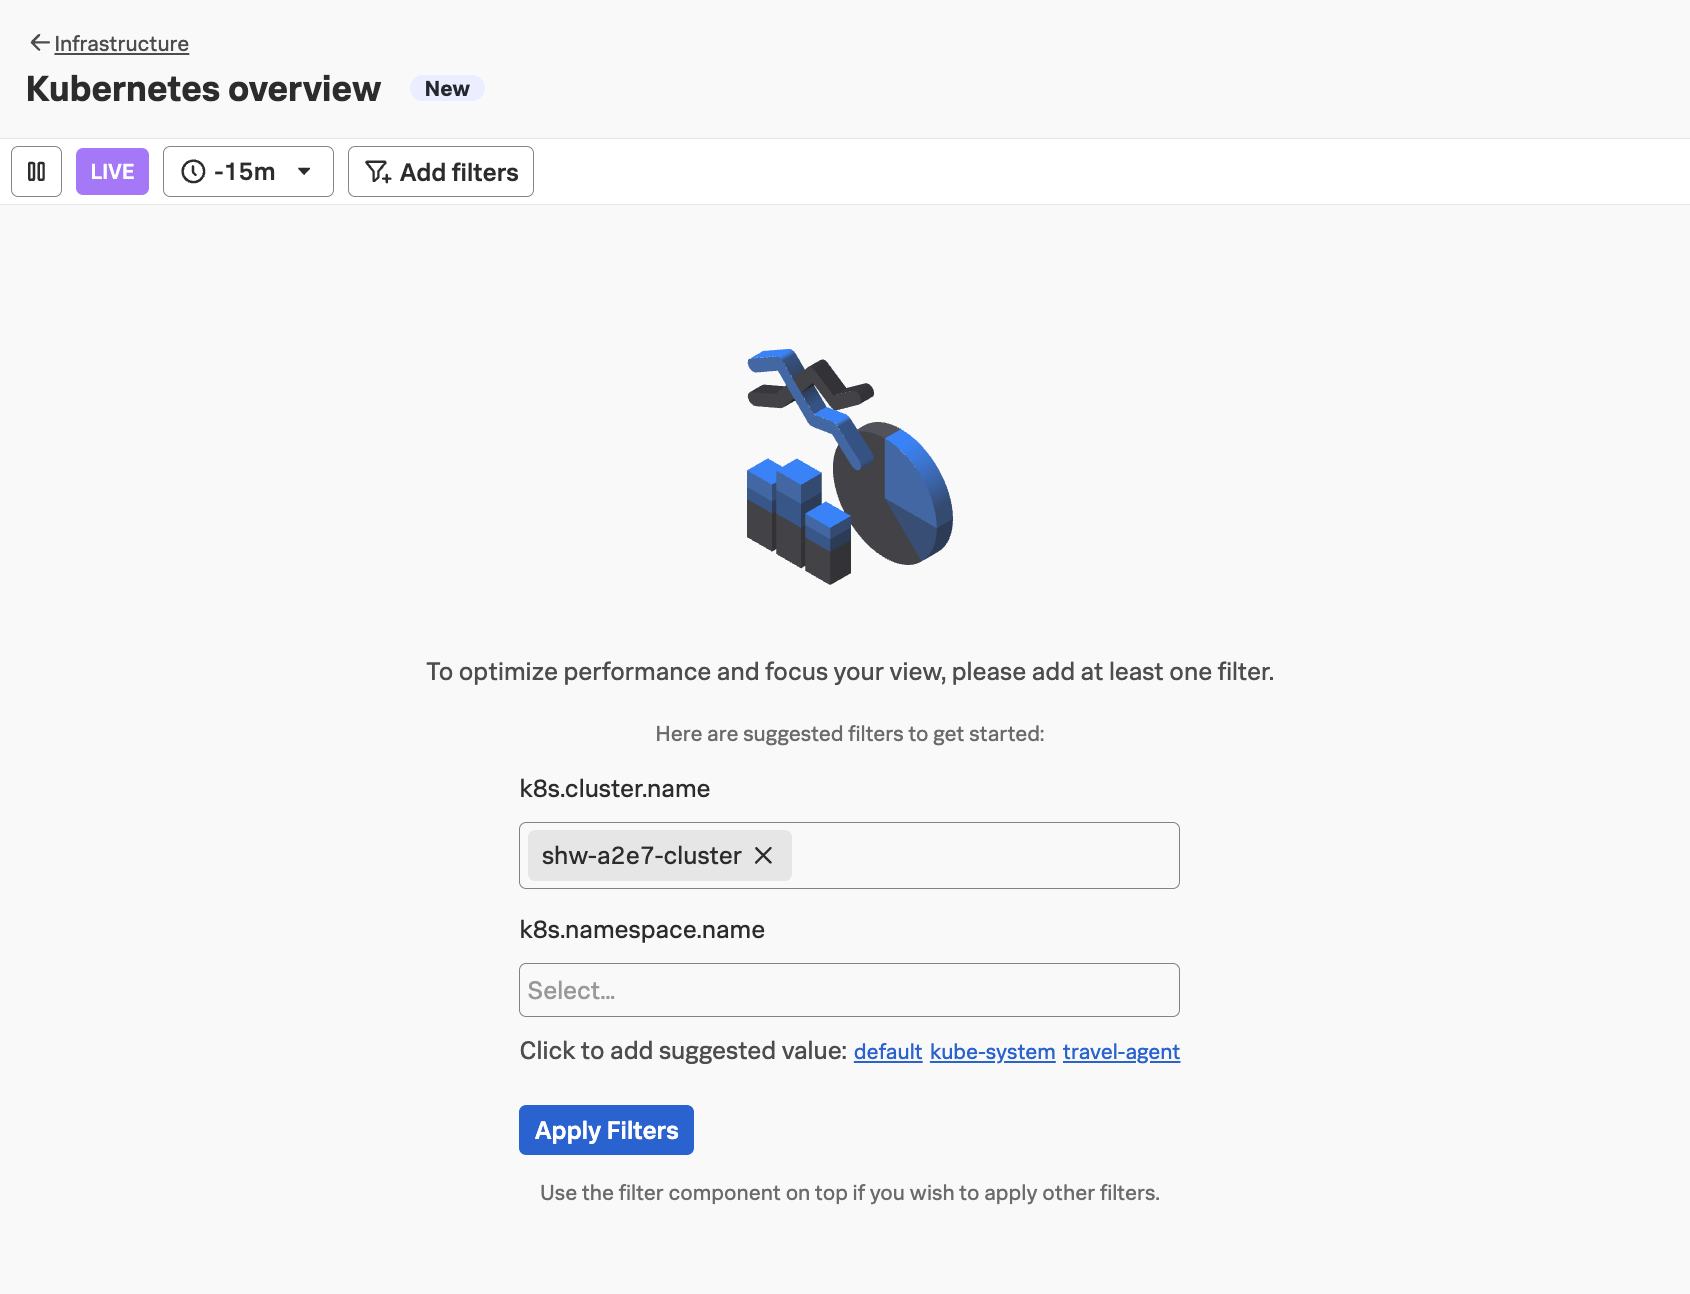
In Splunk Observability Cloud, navigate to Infrastructure -> Kubernetes overview,
then add your cluster name (which is <your instance name>-cluster):
Tip
Use the echo $INSTANCE command if you’ve forgotten your instance name
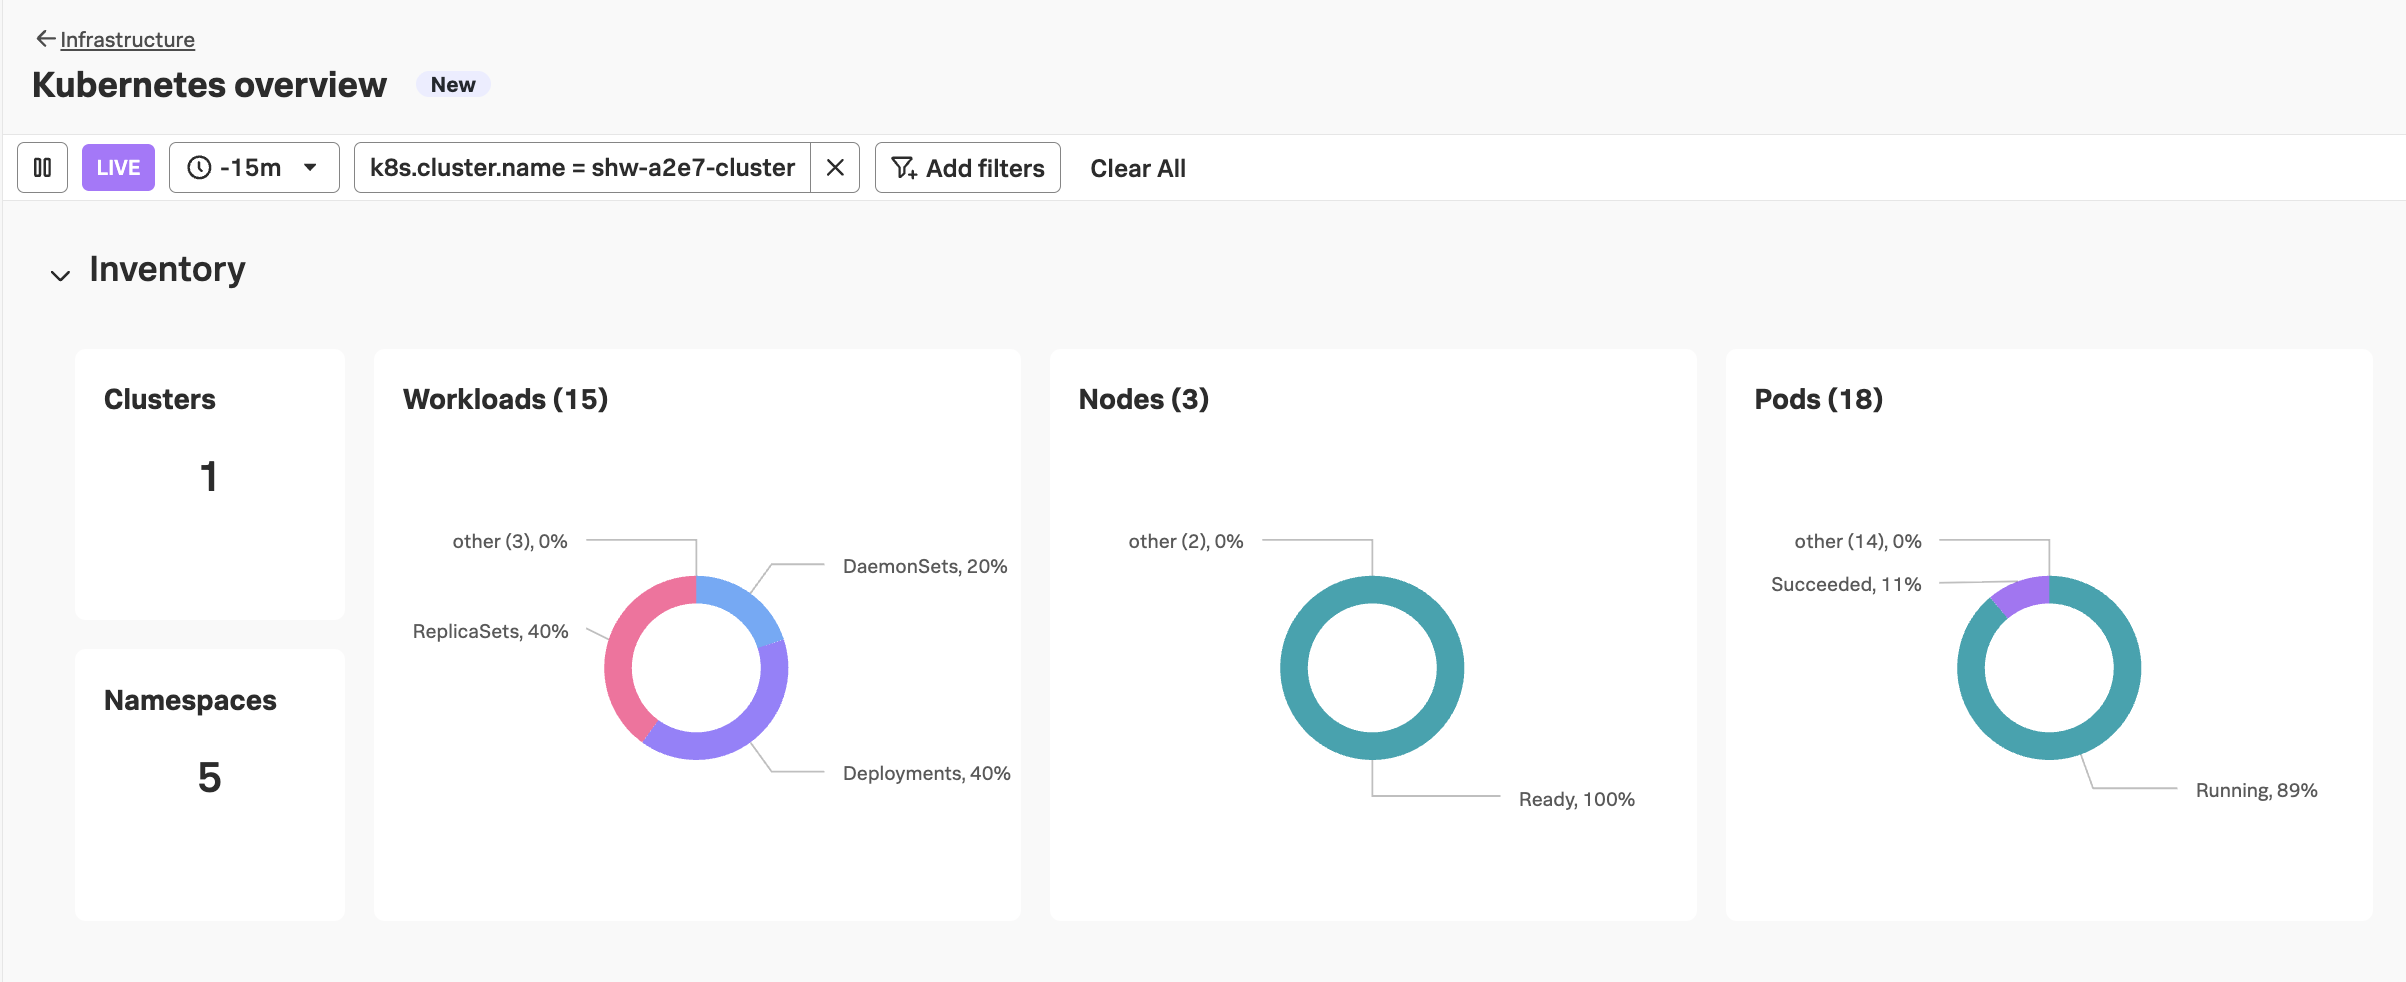
After clicking Apply Filters you should see an overview for your cluster similar to the following:
Using the Traditional Kubernetes Experience #
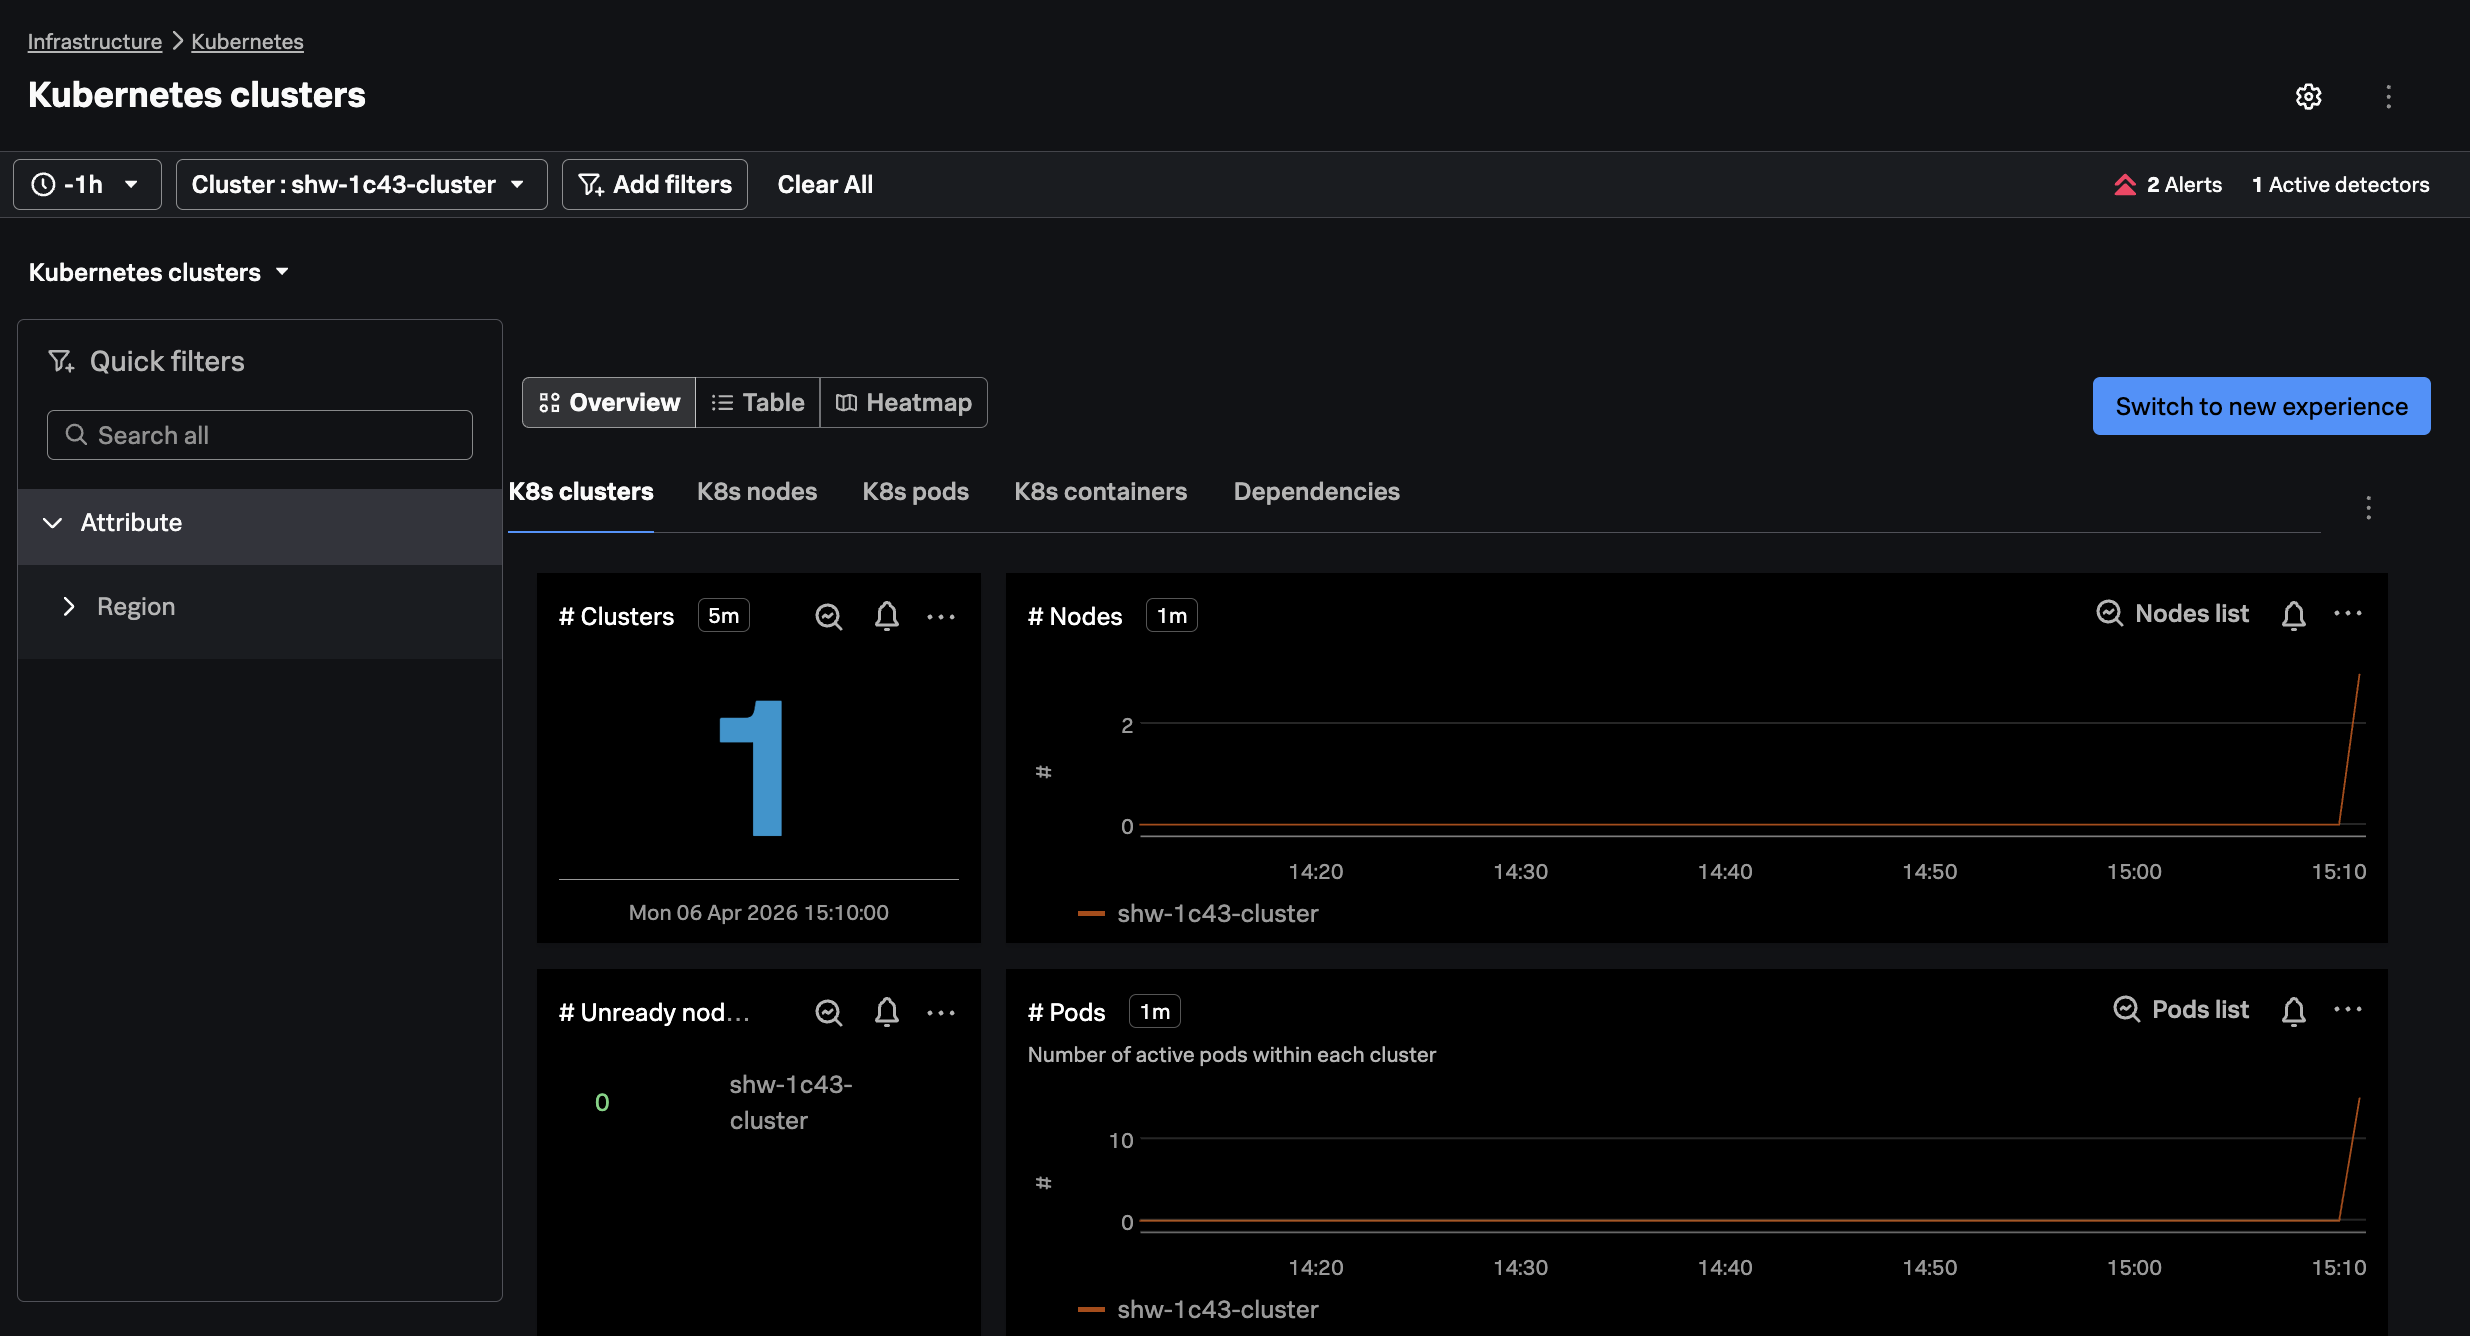
In Splunk Observability Cloud, navigate to Infrastructure -> Kubernetes -> Kubernetes Clusters,
and then search for your cluster name (which is <your instance name>-cluster):
Tip
Use the echo $INSTANCE command if you’ve forgotten your instance name