

Instrument the Application
Generate Traffic
With the callback attached, run the instrumented app and send a few requests. Every turn now produces a trace in Splunk Agent Observability. You’ll explore those traces in detail in the next chapter.
Deploy the healthcare assistant app
Run the following command to deploy the healthcare assistant app:
cd ~/workshop/healthcare-assistant/2-app-with-instrumentation
kubectl apply -f k8s.yaml
Ensure that the new application pod is running:
kubectl get pods -l app=healthcare-assistantNAME READY STATUS RESTARTS AGE
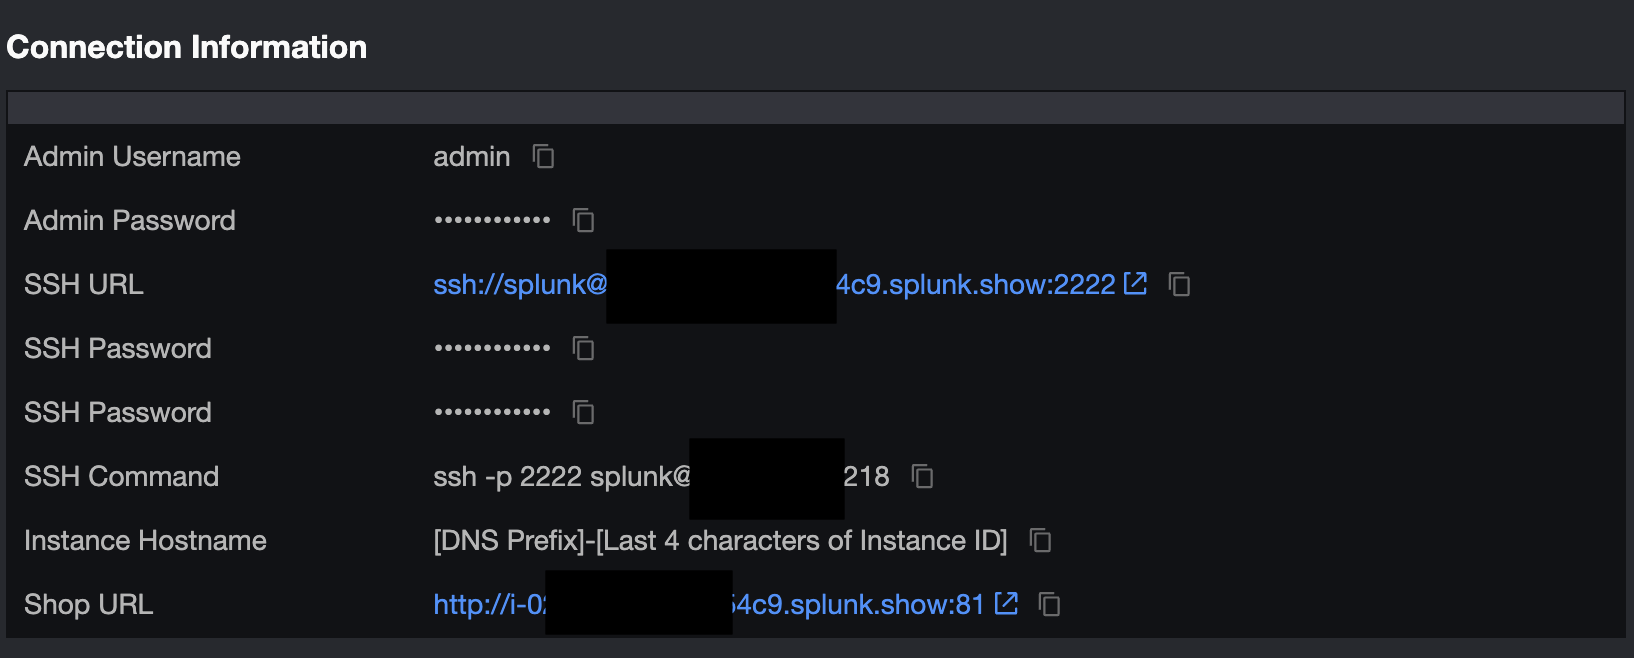
healthcare-assistant-d764fc757-l9fxt 1/1 Running 0 20sTo access the application, click on the Shop URL link in the Connection Information section of Splunk Show event:
Send a few requests
Exercise both tool paths so you generate a RAG trace and a text-to-SQL trace:
What is the dosage and common side effects of Lisinopril?
Can you look up information for patient P001?
Note that each prompt returns the same answer that it did before instrumentation; the callback doesn’t change the app’s behavior, it just records it.
Tip
If you’d like to explore other medications that you can ask about, you can look at the following document:
cat ~/workshop/healthcare-assistant/docs/qa.csvTrigger a hallucination
Next, click on the Log Hallucination button on the left-hand side of the application. This will send
the same question as before:
What is the dosage and common side effects of Lisinopril?
But this time, the healthcare assistant responds to say that the common dosage is 100mg daily, which is much higher than the actual recommended dosage of just 10-40mg daily.
This is an inaccurate, and potentially dangerous, response that we’ll definitely want to know about!
Review the application logs
Use the following command to view the application logs:
kubectl logs -l app=healthcare-assistantIf everything is working as expected, you should see the following in the logs:
Collecting usage statistics. To deactivate, set browser.gatherUsageStats to false.

2026-07-07 17:52:39.433 Uvicorn server started on :::8501

  You can now view your Streamlit app in your browser.

  Local URL: http://localhost:8501
  Network URL: http://10.42.0.18:8501
  External URL: http://98.92.157.71:8501
Tip
The app already enables SDK console logging at INFO near the top of
~/workshop/healthcare-assistant/2-app-with-instrumentation/agent.py. To see even more detail
about what the SDK is doing, temporarily raise it to DEBUG:
from splunk_ao.utils.log_config import enable_console_logging
import logging

enable_console_logging(level=logging.DEBUG)
Then rebuild the Docker image:
cd ~/workshop/healthcare-assistant
docker build -f 2-app-with-instrumentation/Dockerfile -t localhost:9999/healthcare-assistant:app-with-instrumentation-v3 .
docker push localhost:9999/healthcare-assistant:app-with-instrumentation-v3
Update the ~/workshop/healthcare-assistant/2-app-with-instrumentation/k8s.yaml file to reference the local image instead:
image: localhost:9999/healthcare-assistant:app-with-instrumentation-v3And redeploy the application:
cd ~/workshop/healthcare-assistant/2-app-with-instrumentation
kubectl apply -f k8s.yaml
Use the following command to view the application logs:
kubectl logs -l app=healthcare-assistant You can now view your Streamlit app in your browser.
Local URL: http://localhost:8501
Network URL: http://10.42.2.14:8501
External URL: http://35.175.237.123:8501
INFO - splunk_ao.logger - Ingest service healthy at https://api.multitenant.galileocloud.io, using IngestTraces client
INFO - splunk_ao.logger - Searching for session with external ID: ca0f30ed-9b69-401a-8258-b9c043bdc73a ...
INFO - splunk_ao.logger - Starting a new session...
INFO - splunk_ao.logger - Session started with ID: ec03c538-cf9e-4bed-b97e-4b3c2e46ffbcWhat you just unlocked
You sent three messages. Roughly how many traces did you create, and what determines that?