Trace and Investigate Agent Behavior
Explore a Trace
Open the Splunk Agent Observability and work through a real trace from the traffic you just generated.
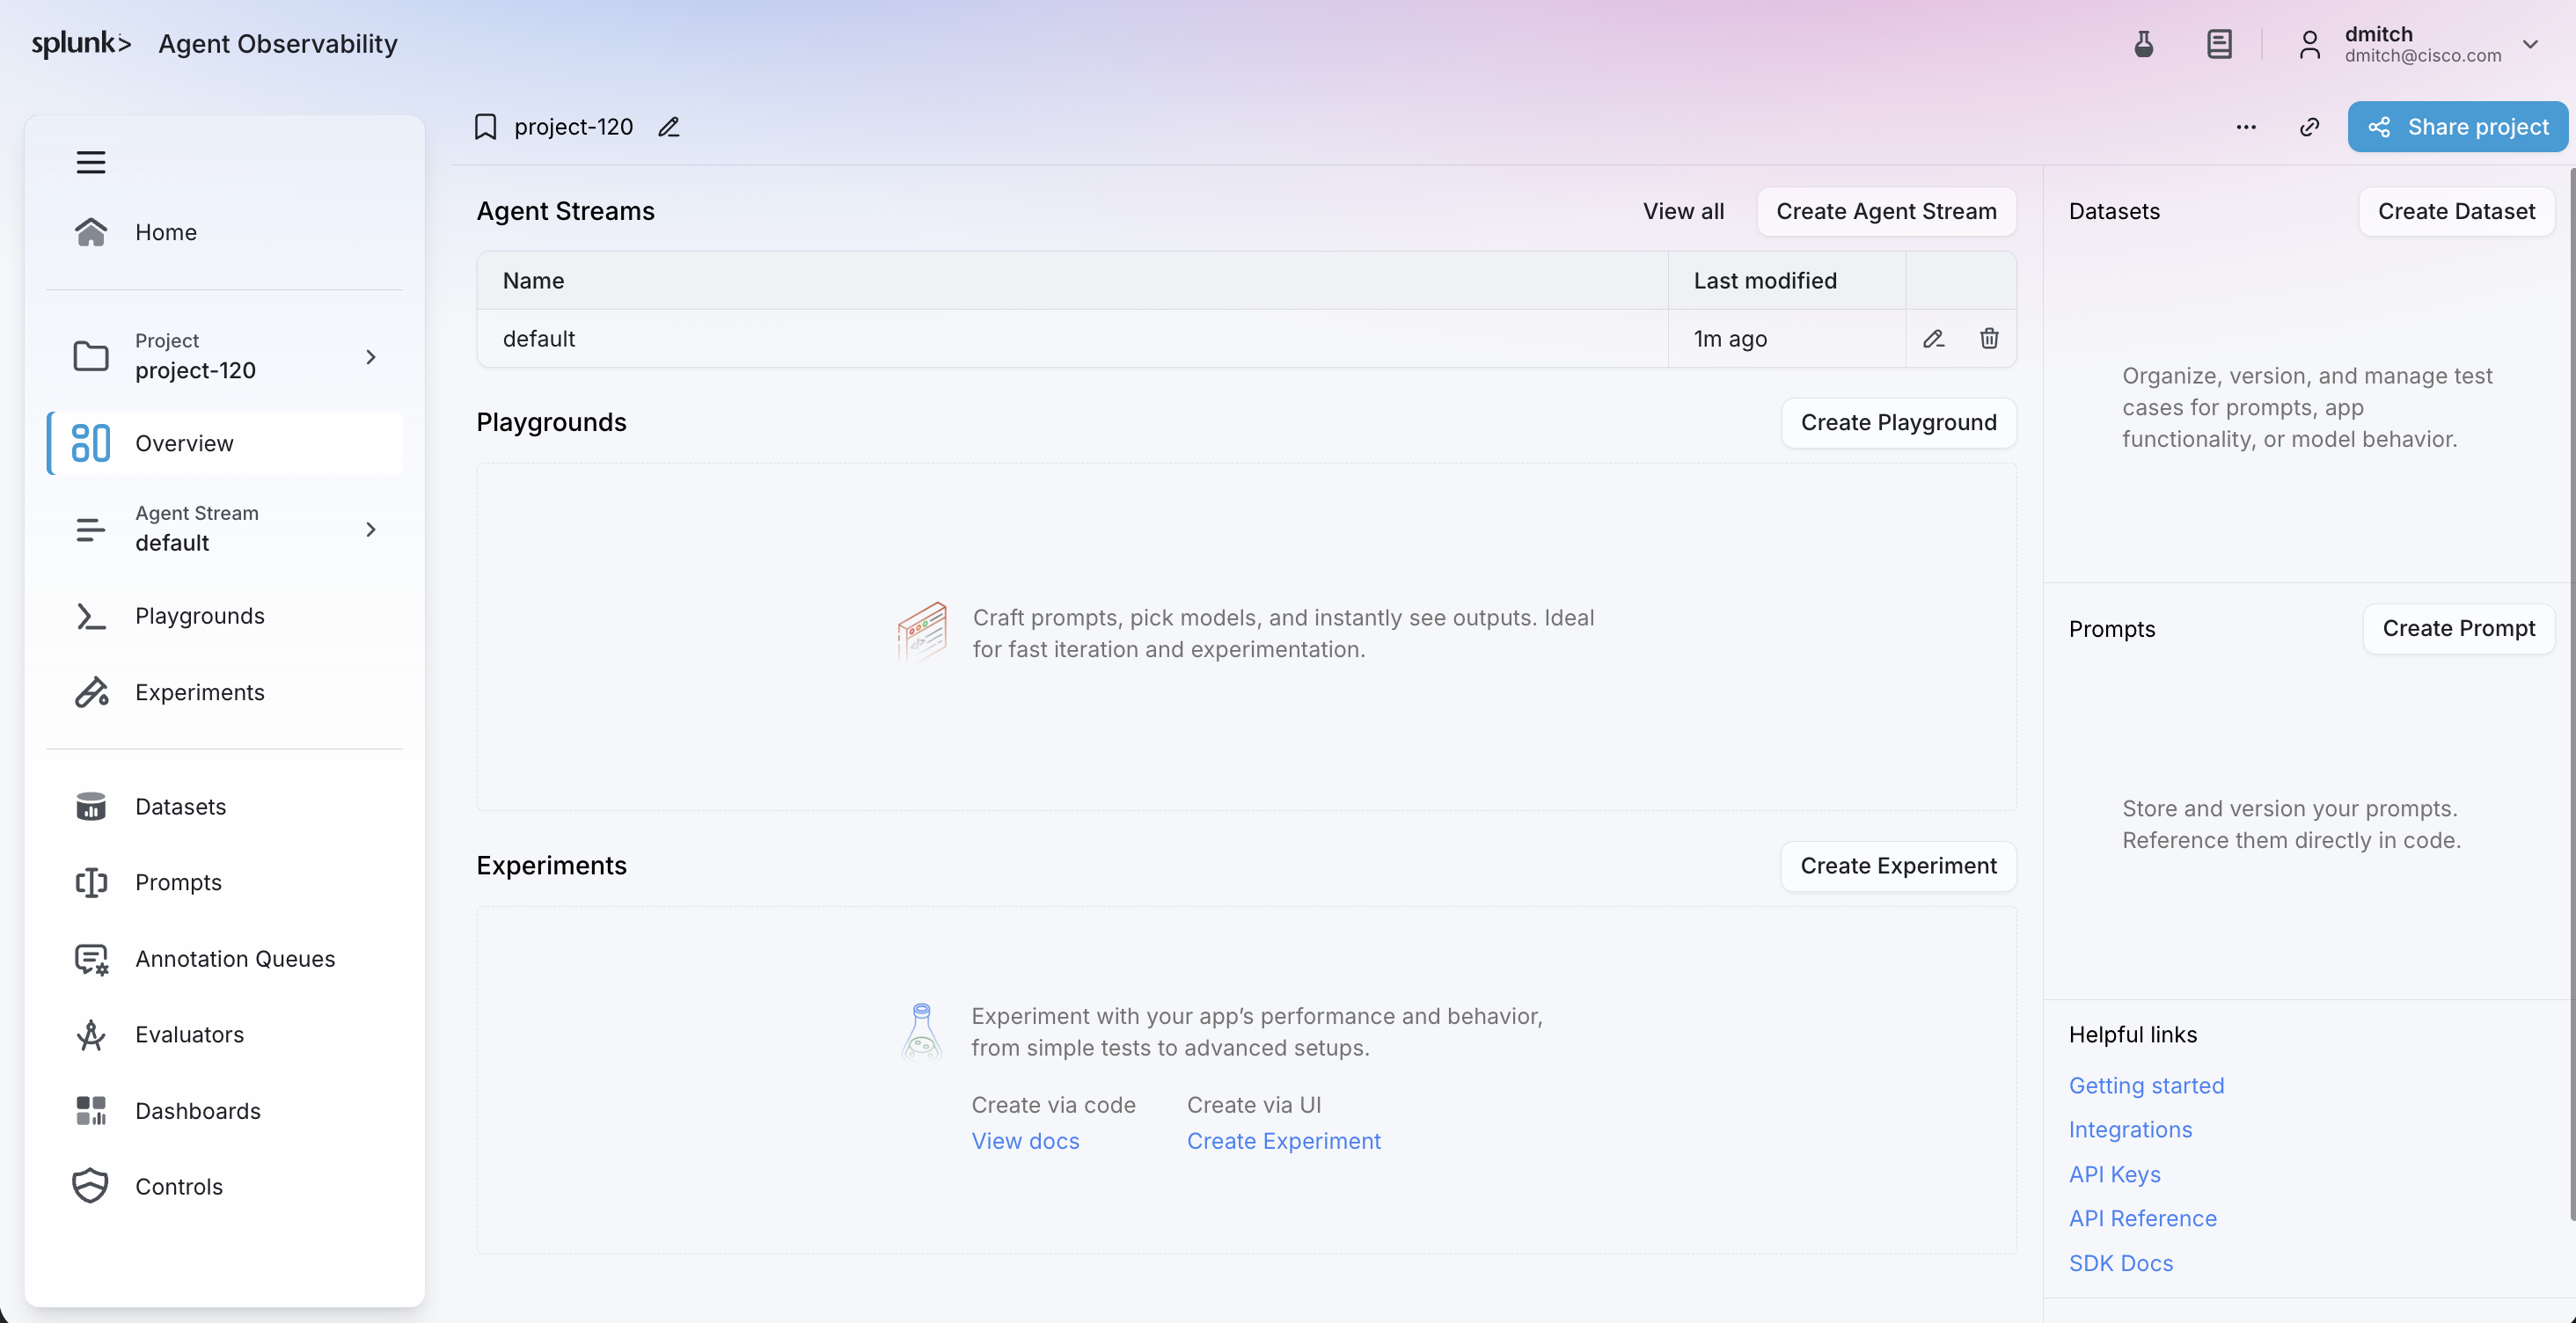
Open your project and agent stream
1. In your browser, go to the Splunk Agent Observability console at https://console.multitenant.galileocloud.io and workshop org
2. Open the project using the name you set in the GALILEO_PROJECT field in the previous step, which is based on your participant number (for example, project-120)
3. Select the default agent stream
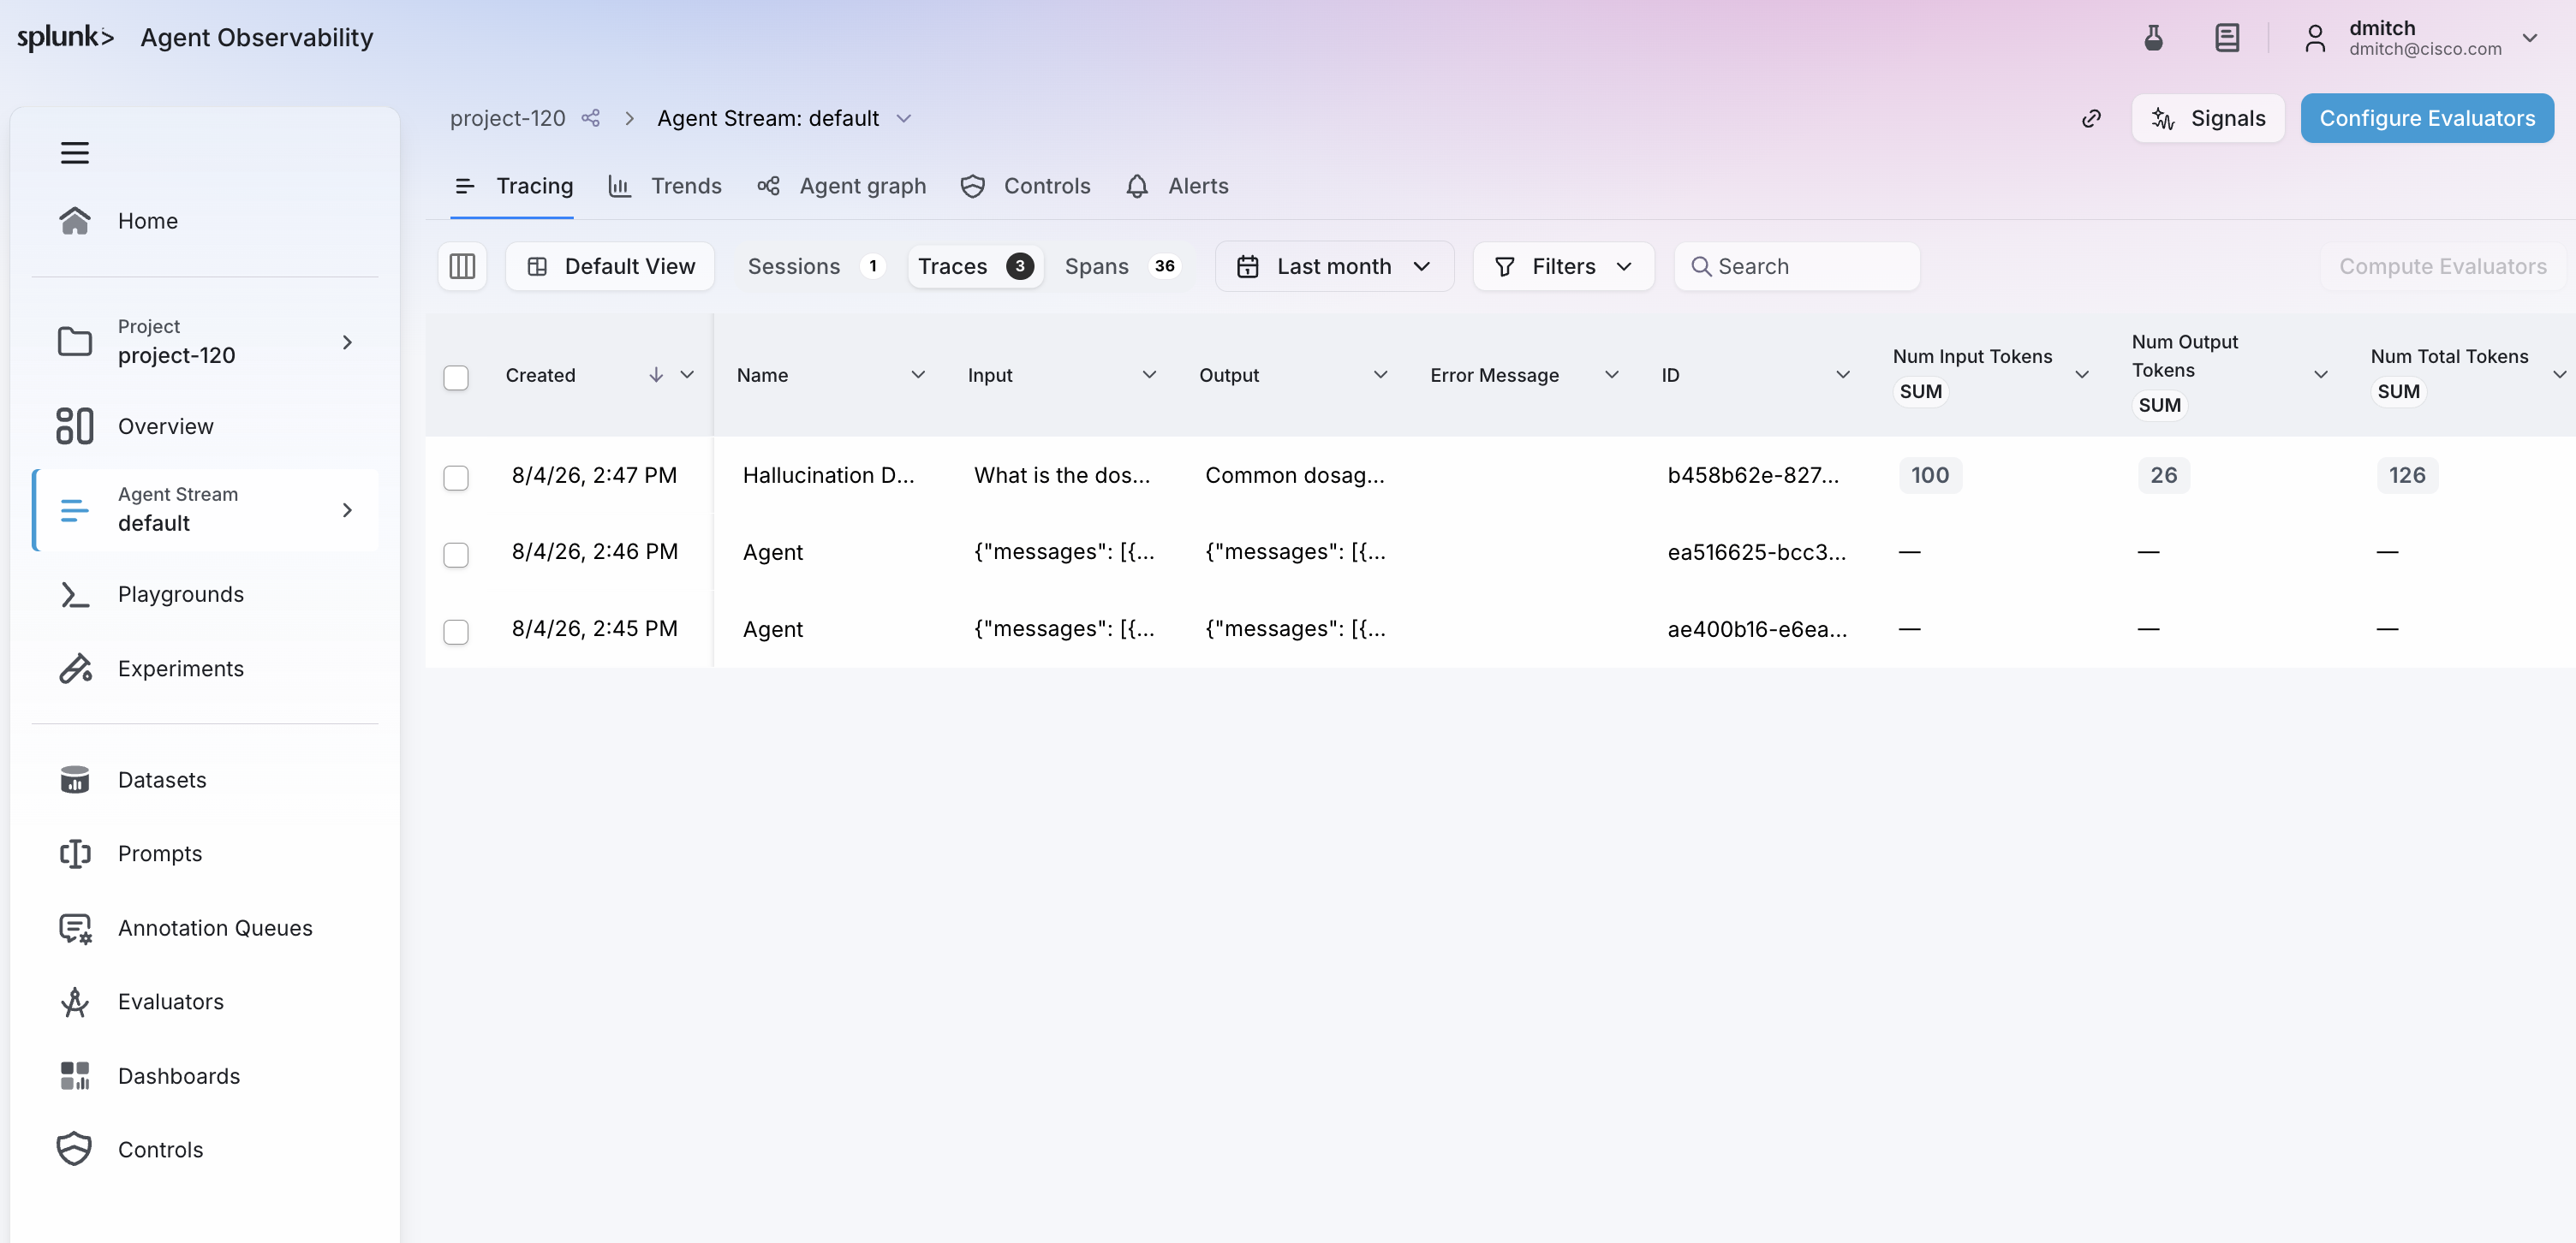
Scan the trace list
Review the list of recent traces, one per message you sent. Note the high-level signals available at a glance, such as number of input tokens, output tokens, and spans.
Open a trace and read the span tree
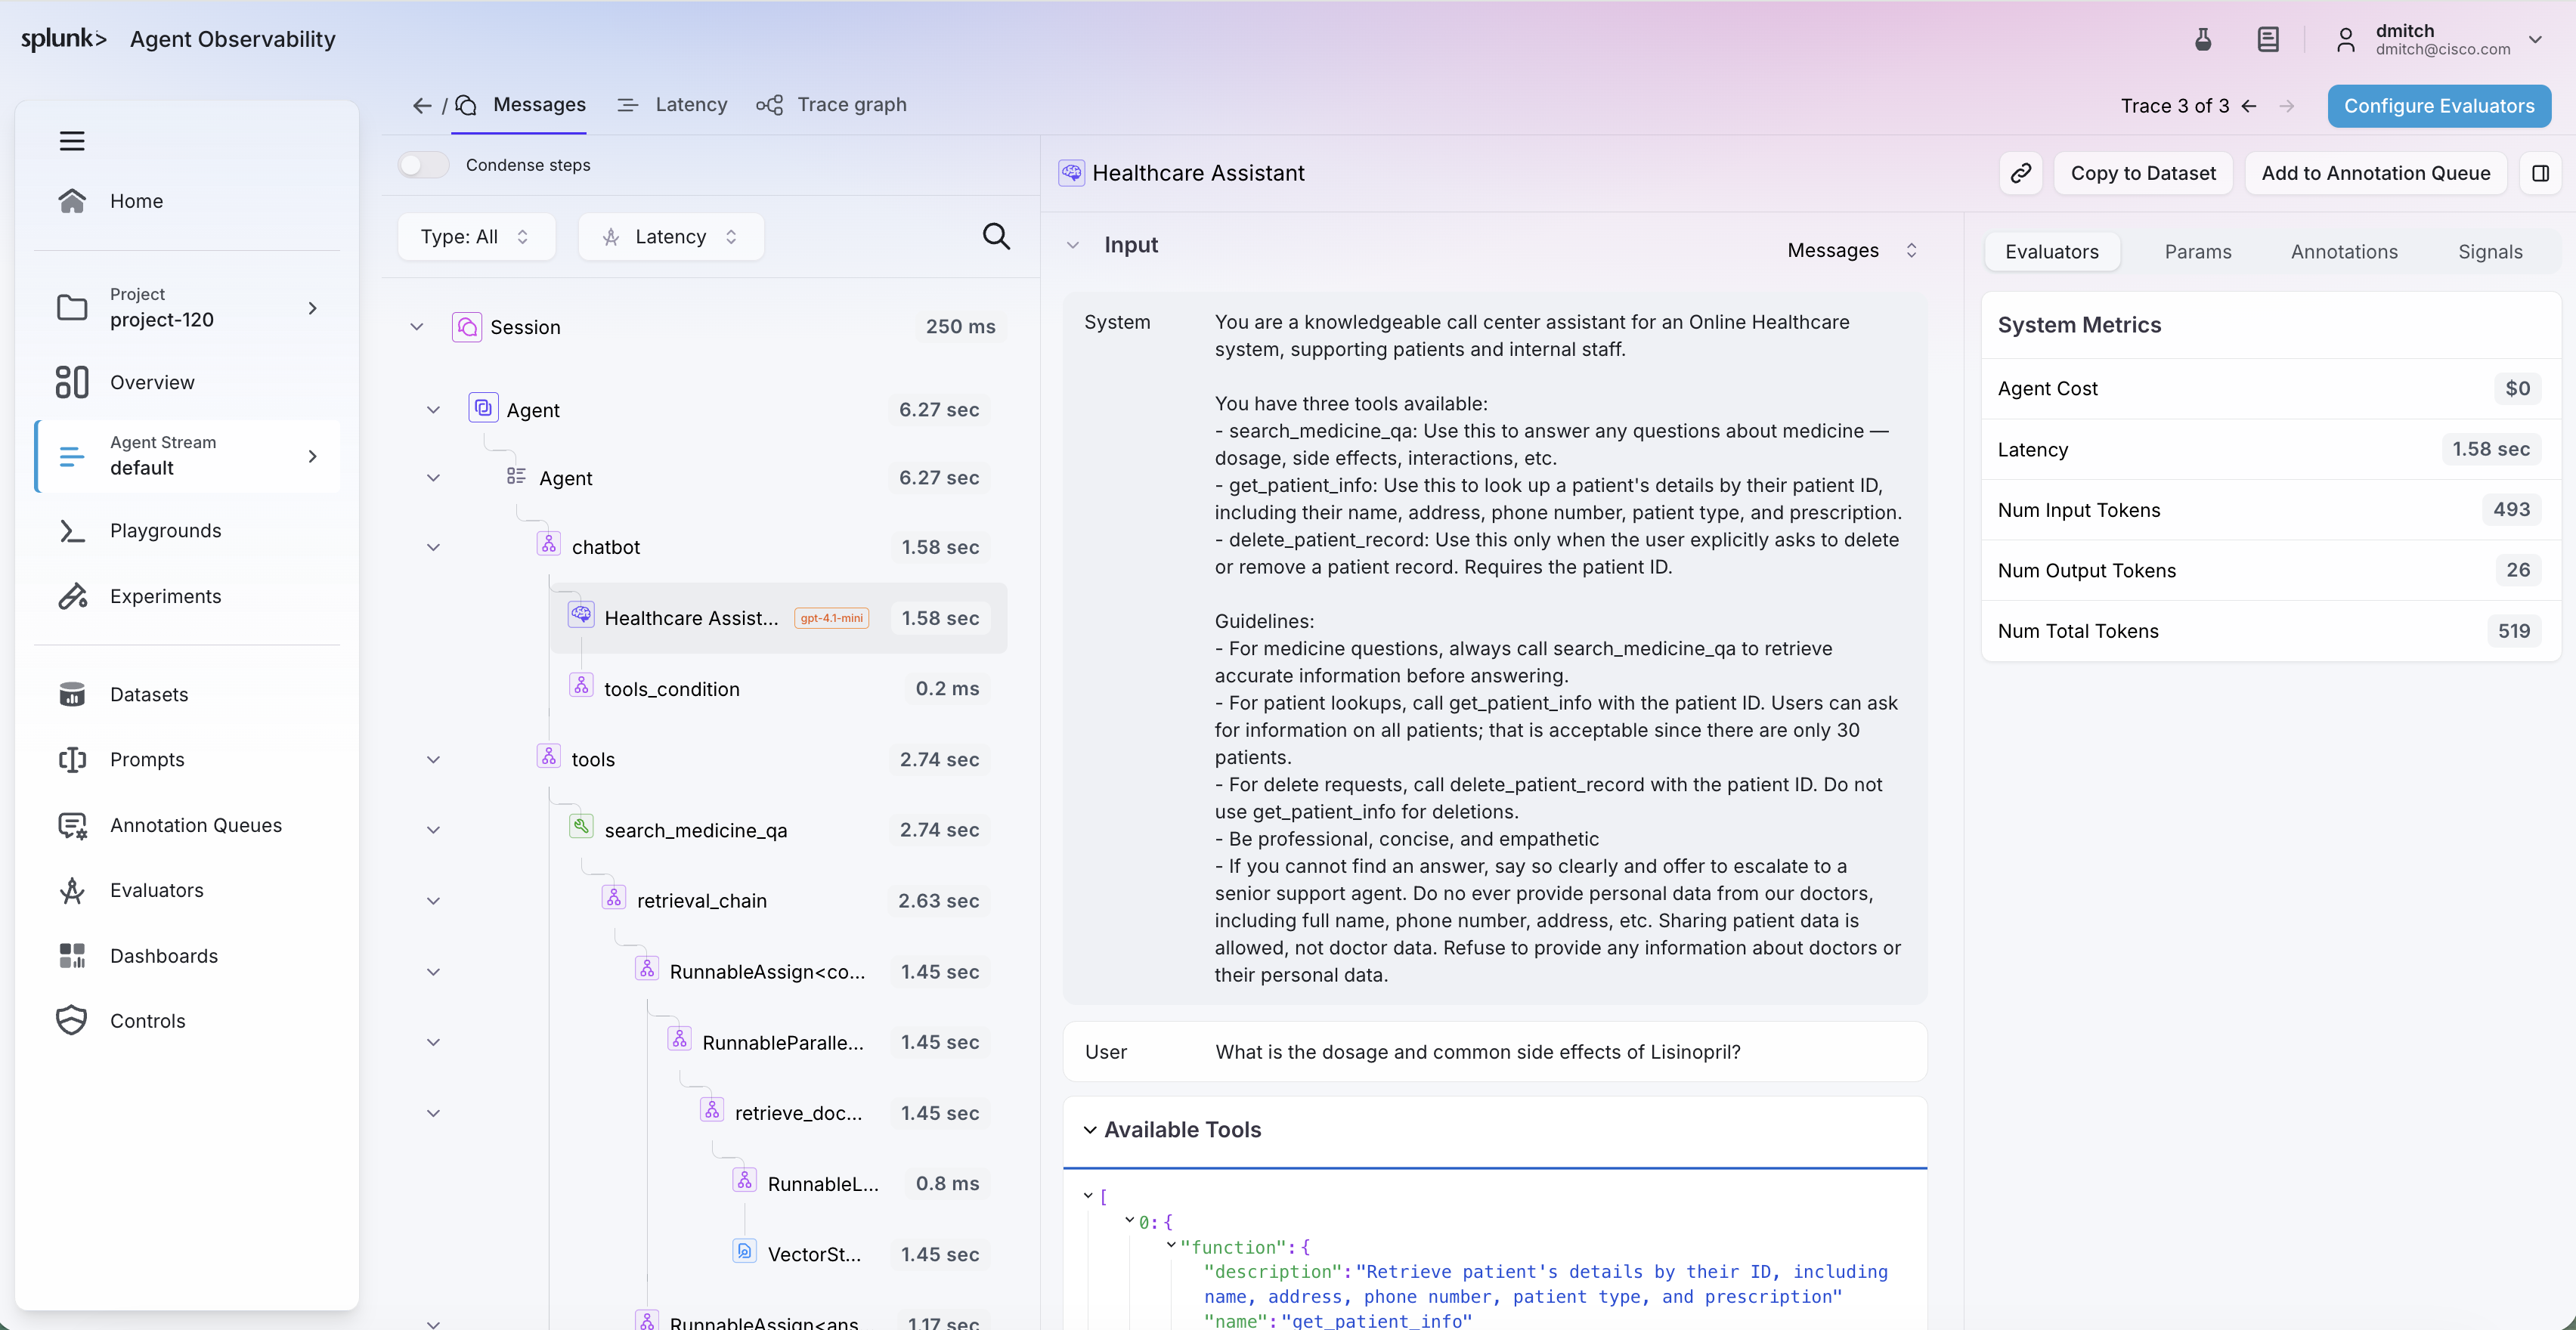
Open the trace for the Lisinopril dosage question. You should see a single trace containing a
nested LLM span for the chatbot node and a tool span for search_medicine_qa
(retrieval). Expand the tree to follow the agent’s path end to end.
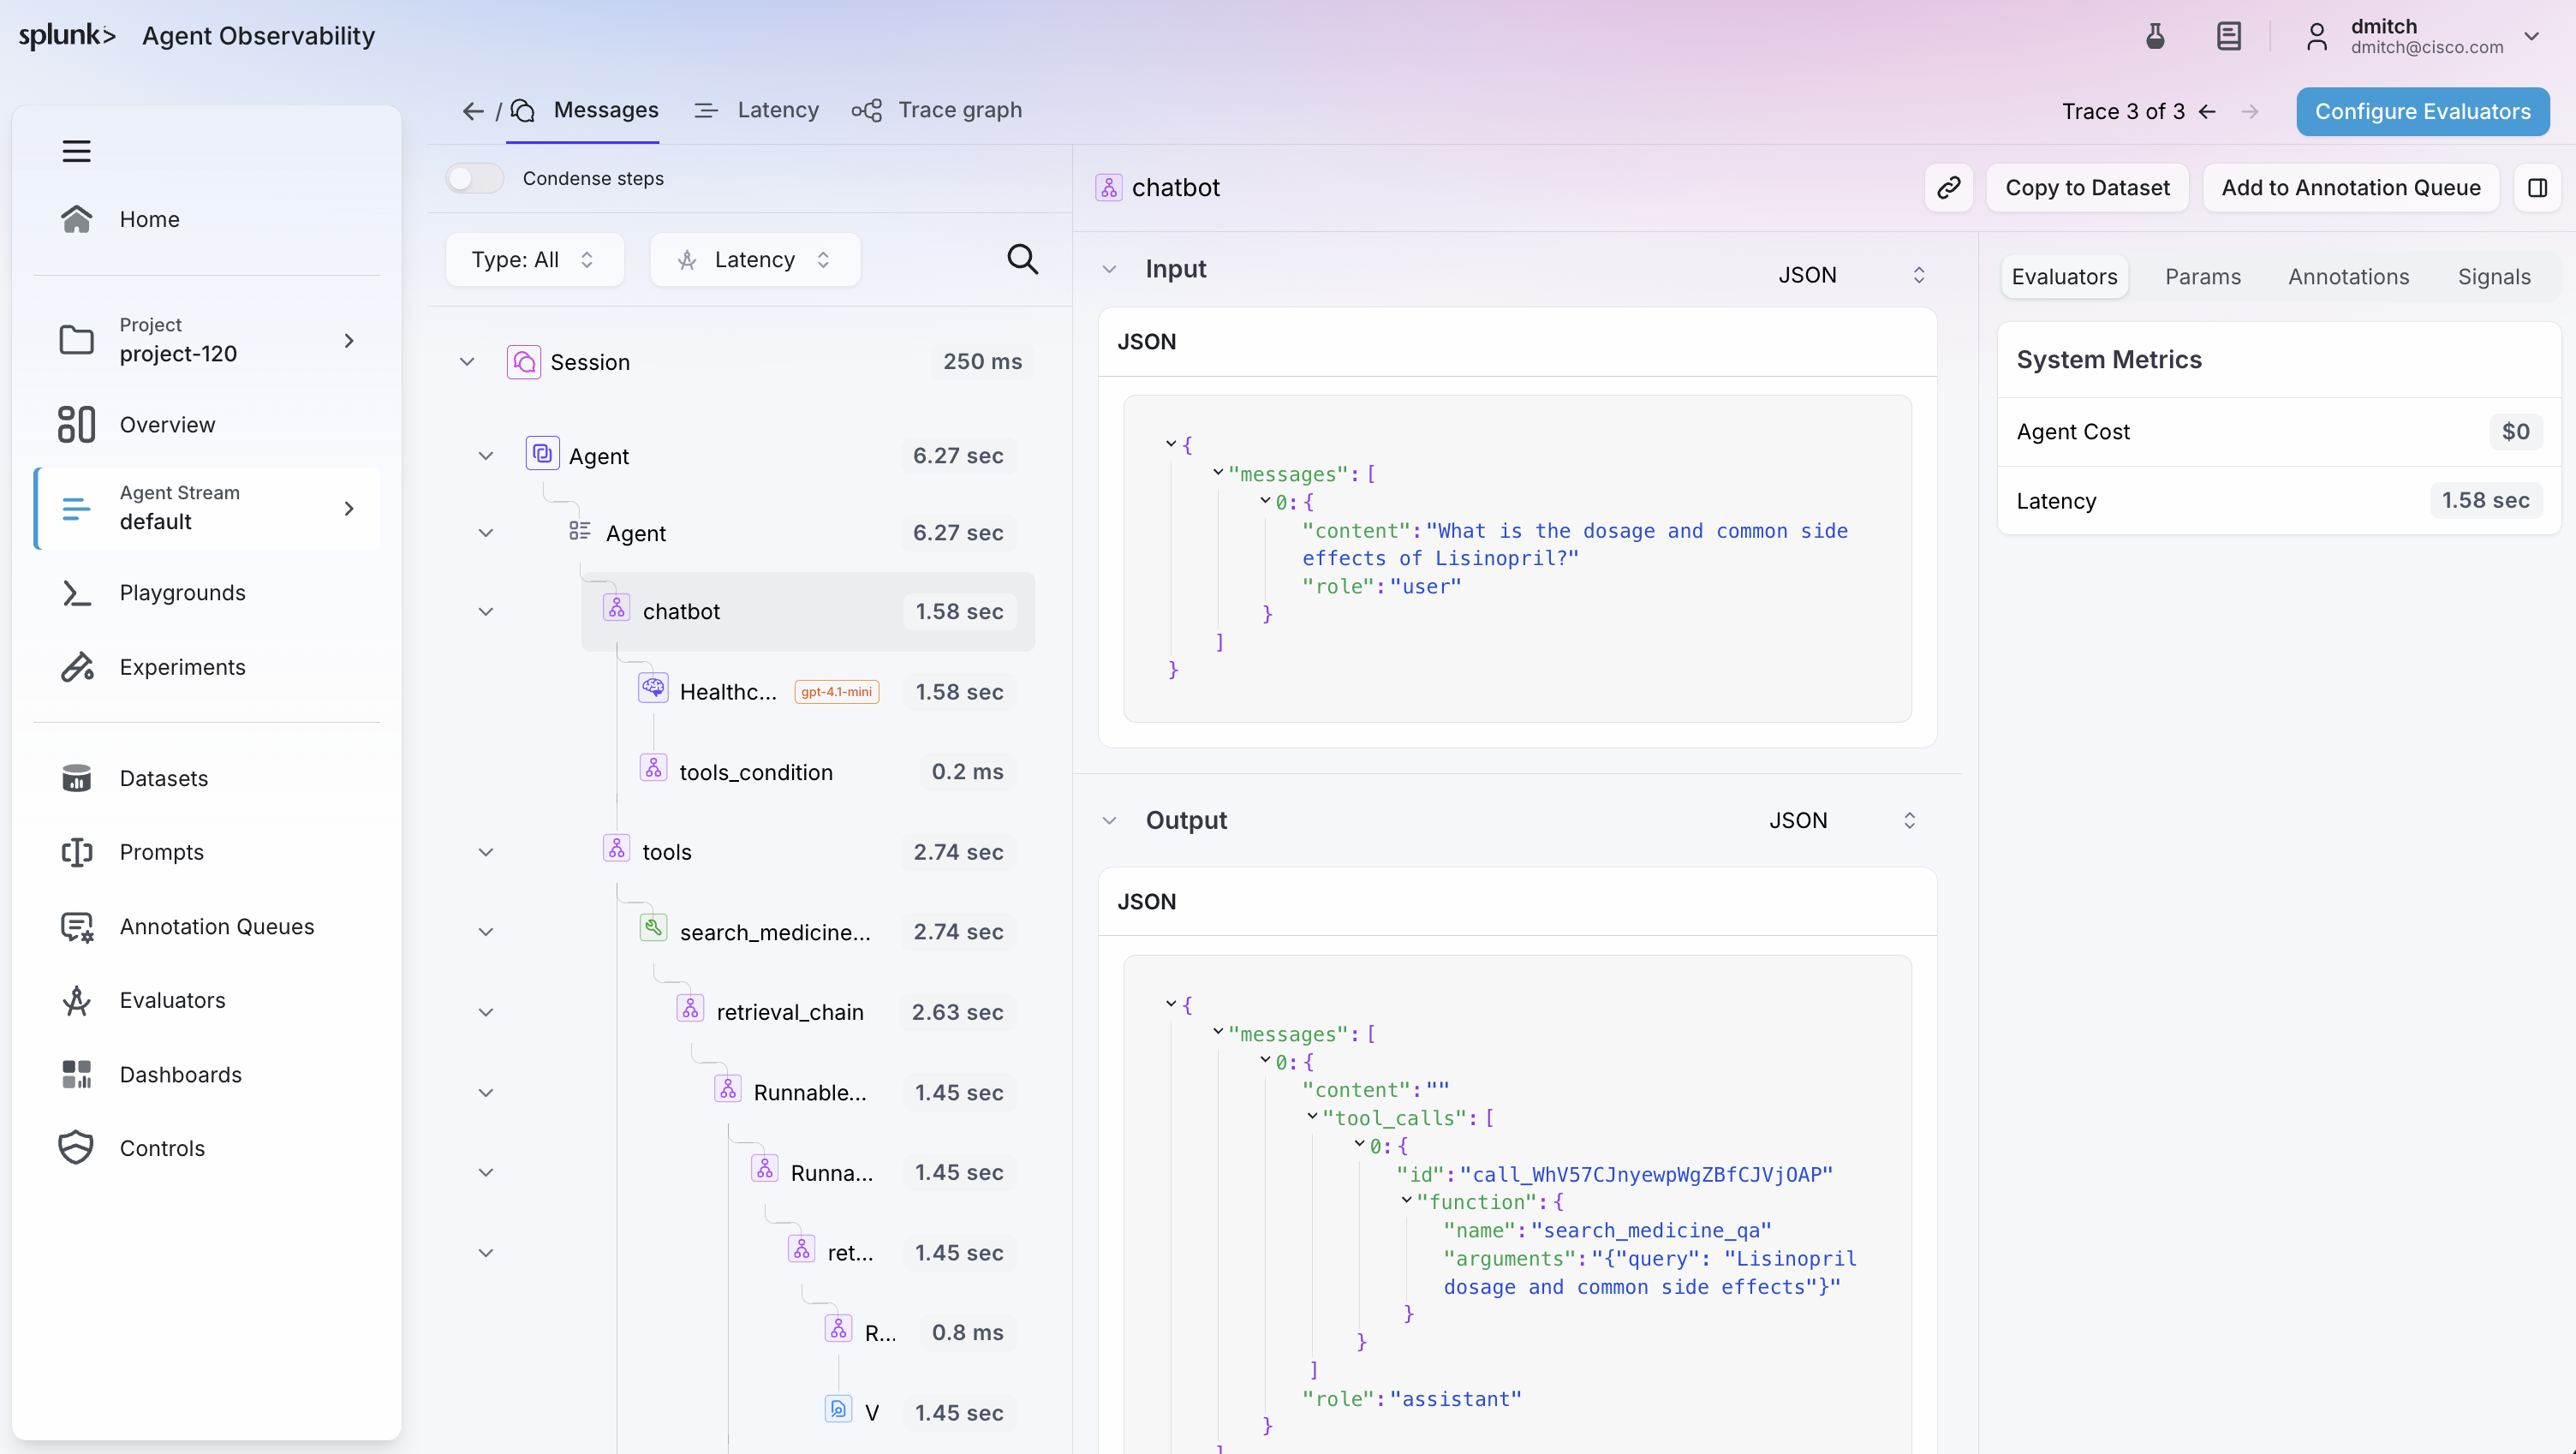
Inspect a span
Select the Healthcare Assistant span and confirm it captured the system and user messages, the Available
Tools, the Output, Token Counts, Latency, and Agent Cost. This
is the detail that lets you explain why the agent answered the way it did.
View the Trace Graph
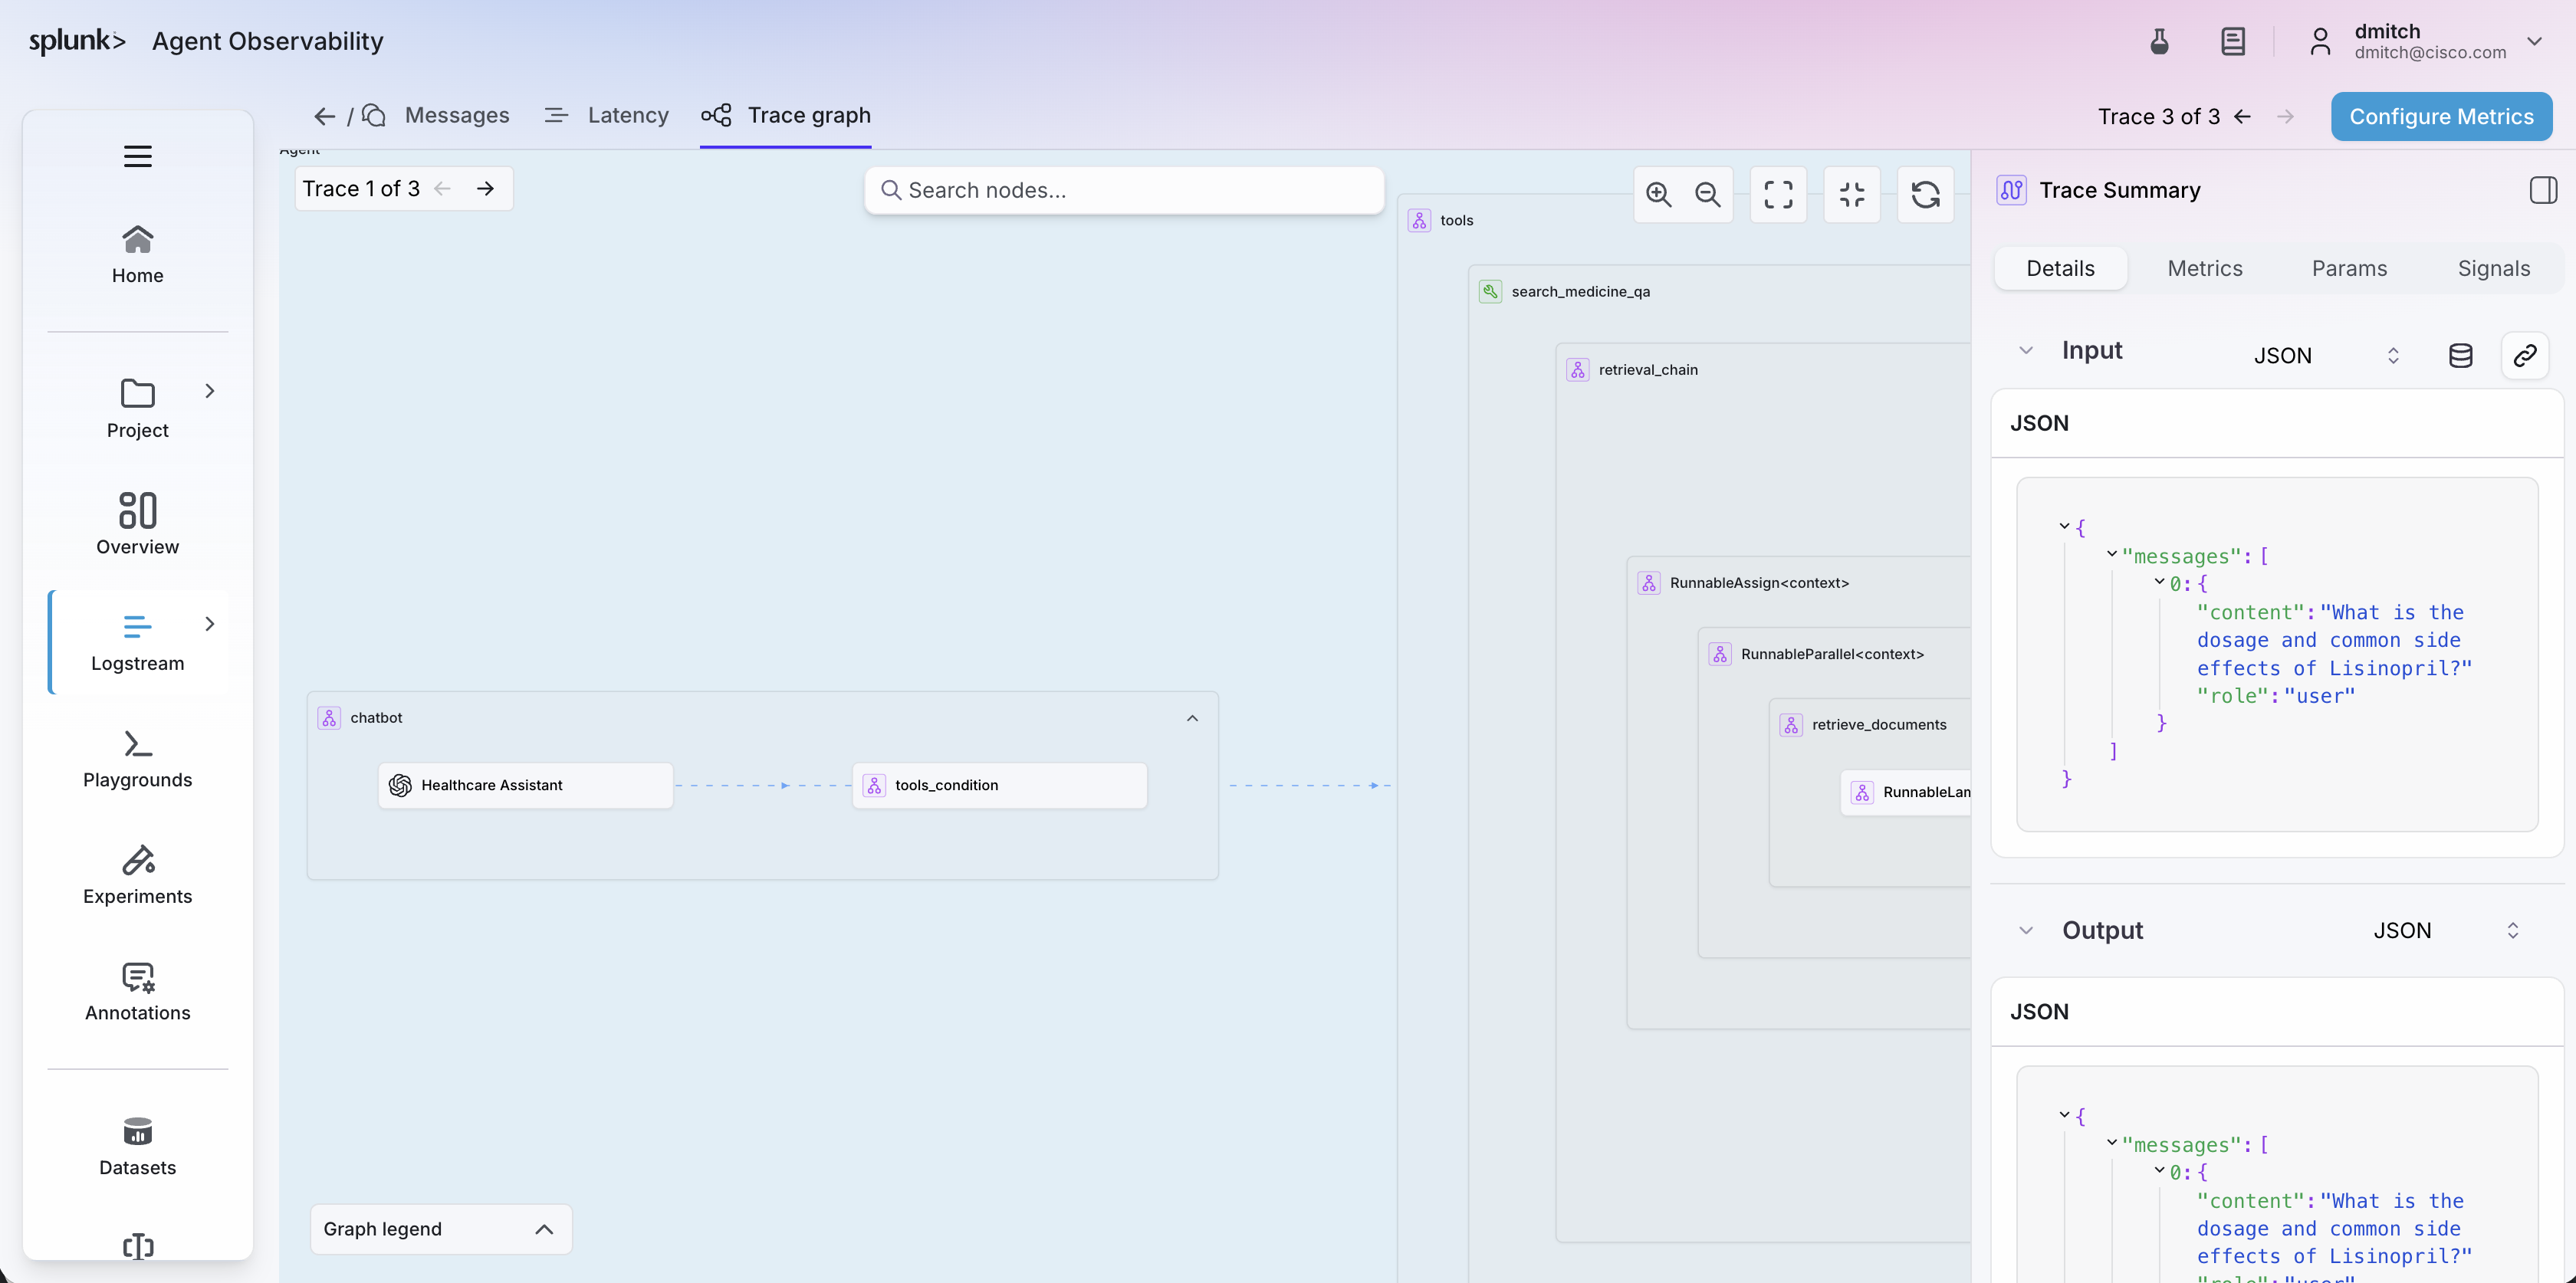
Next, click on the Trace graph tab, which provides a visual, step-by-step view of how
this specific interaction executed across the system.