

Trace and Investigate Agent Behavior
Explore Other Views
Let’s explore other views in Splunk Agent Observability using the traffic you just generated.
1
Open your project and agent stream
Return to your project and the
default agent stream in Splunk Agent Observability.2
View the Agent Graph
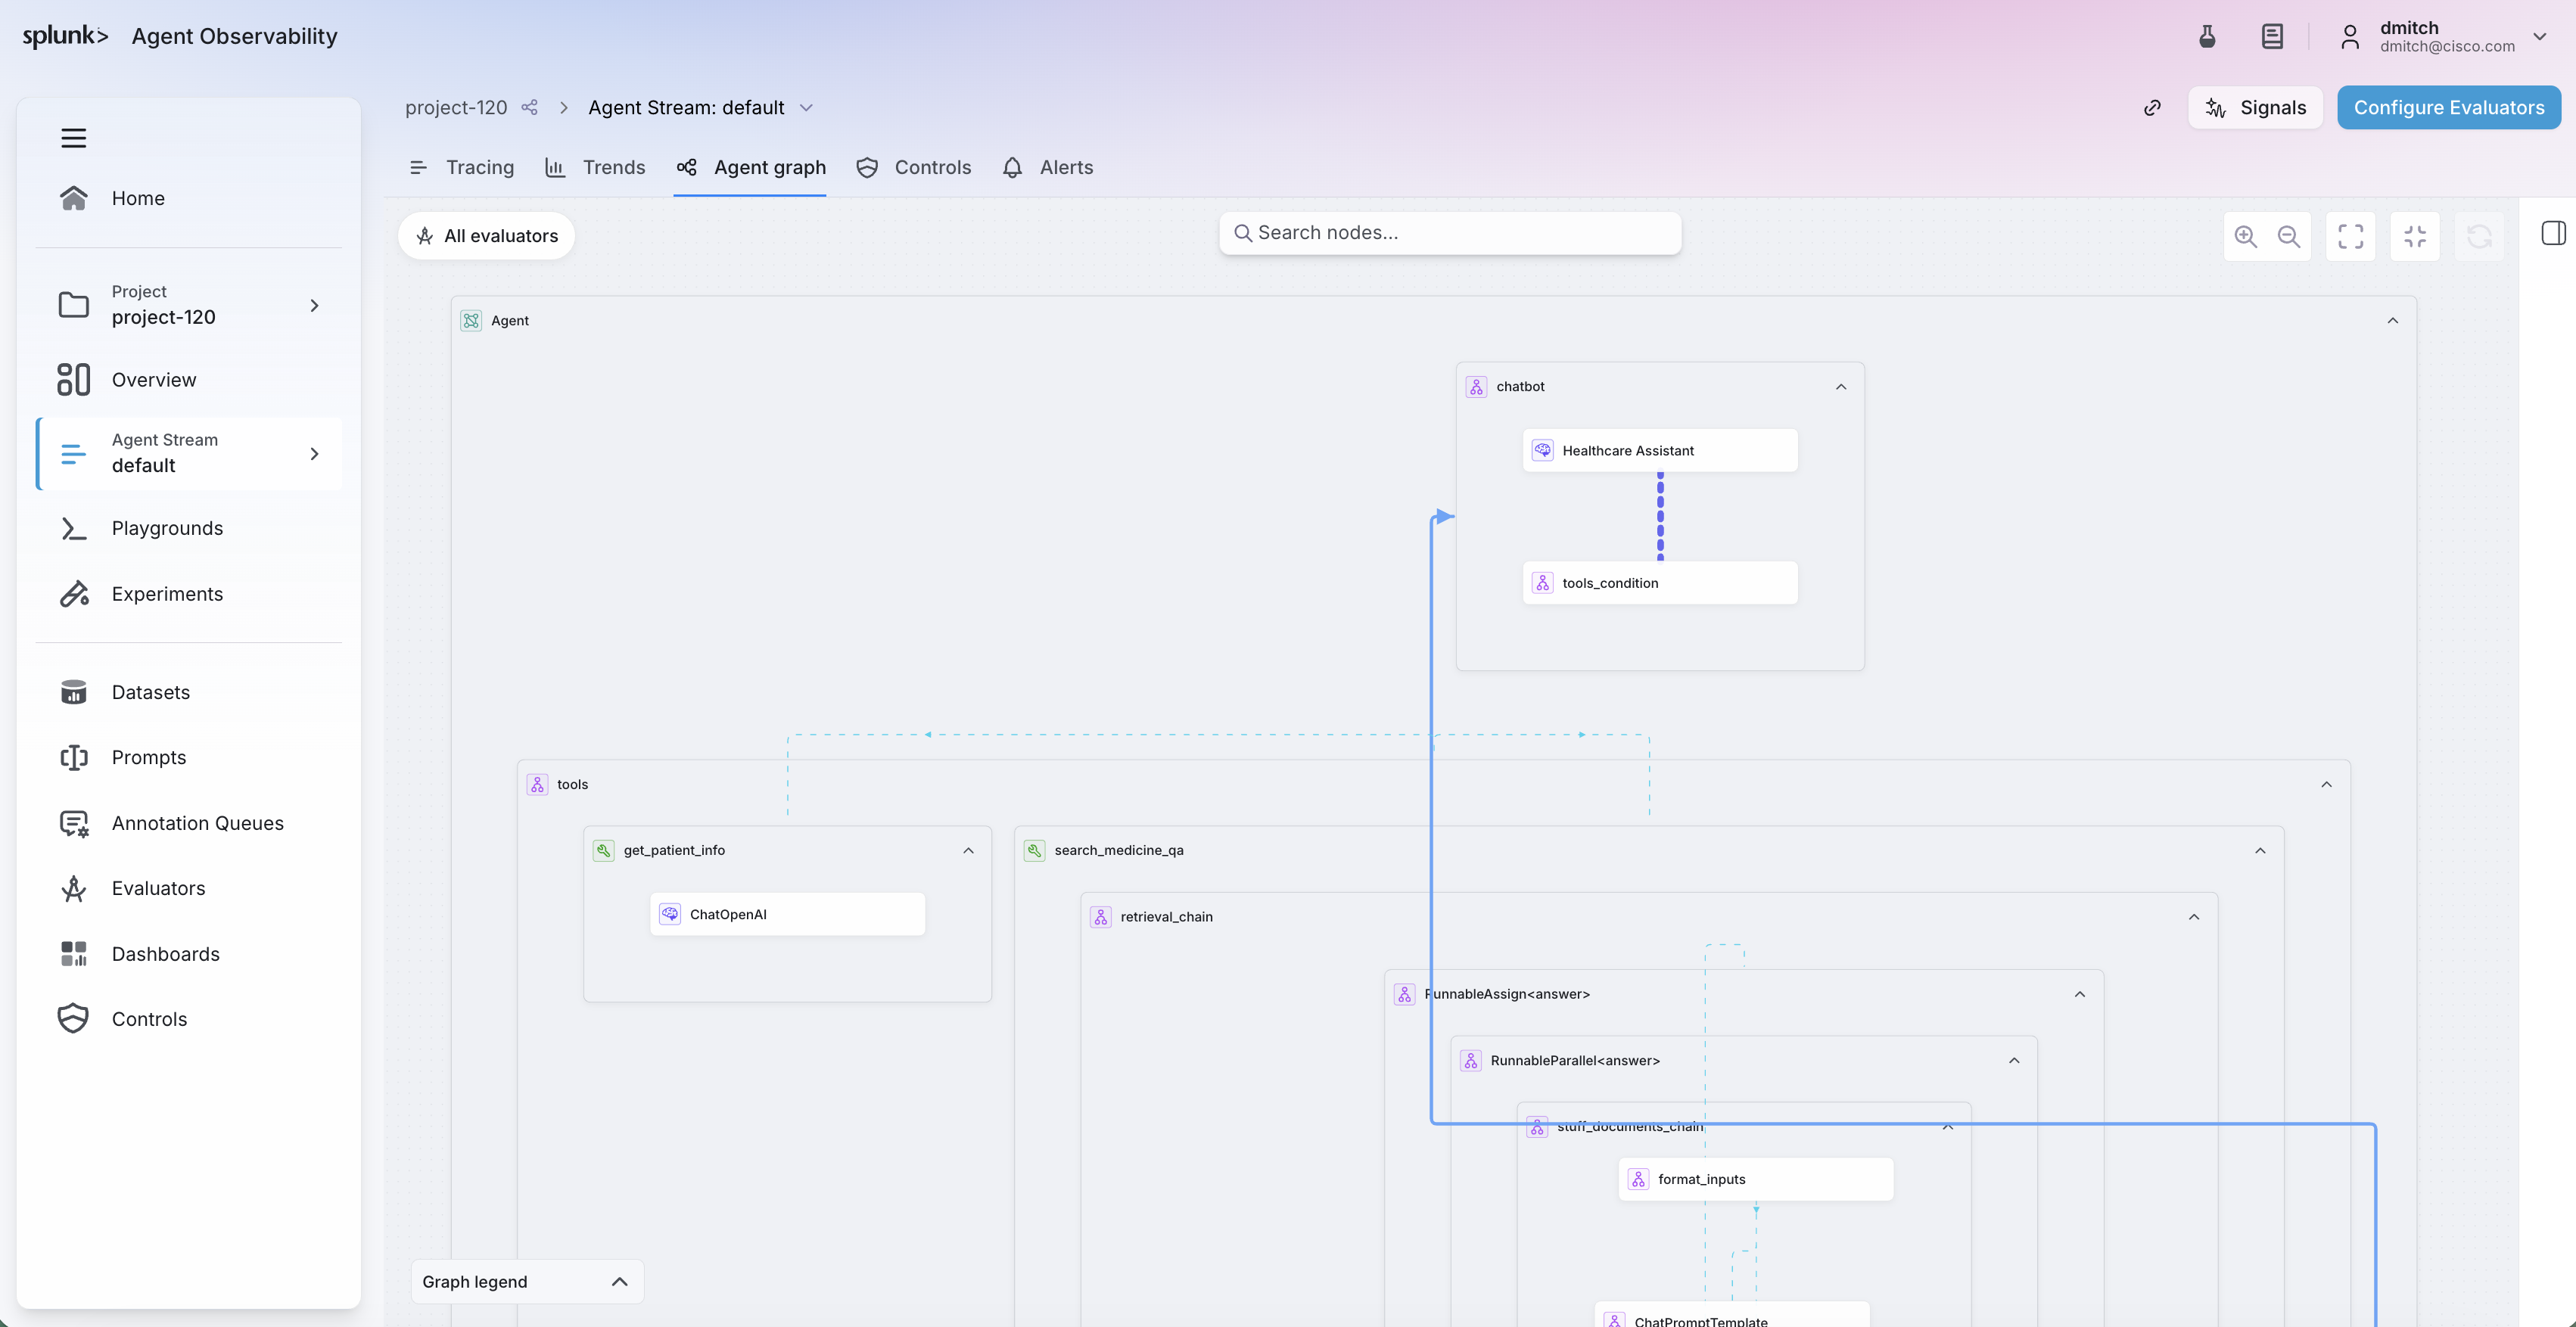
Click on the Agent graph tab, which aggregates agent behavior
across all traces in the agent stream. It shows the most common execution paths, along with latency and frequency patterns,
so you can quickly see how the agent is behaving with actual users.
3
View Trends
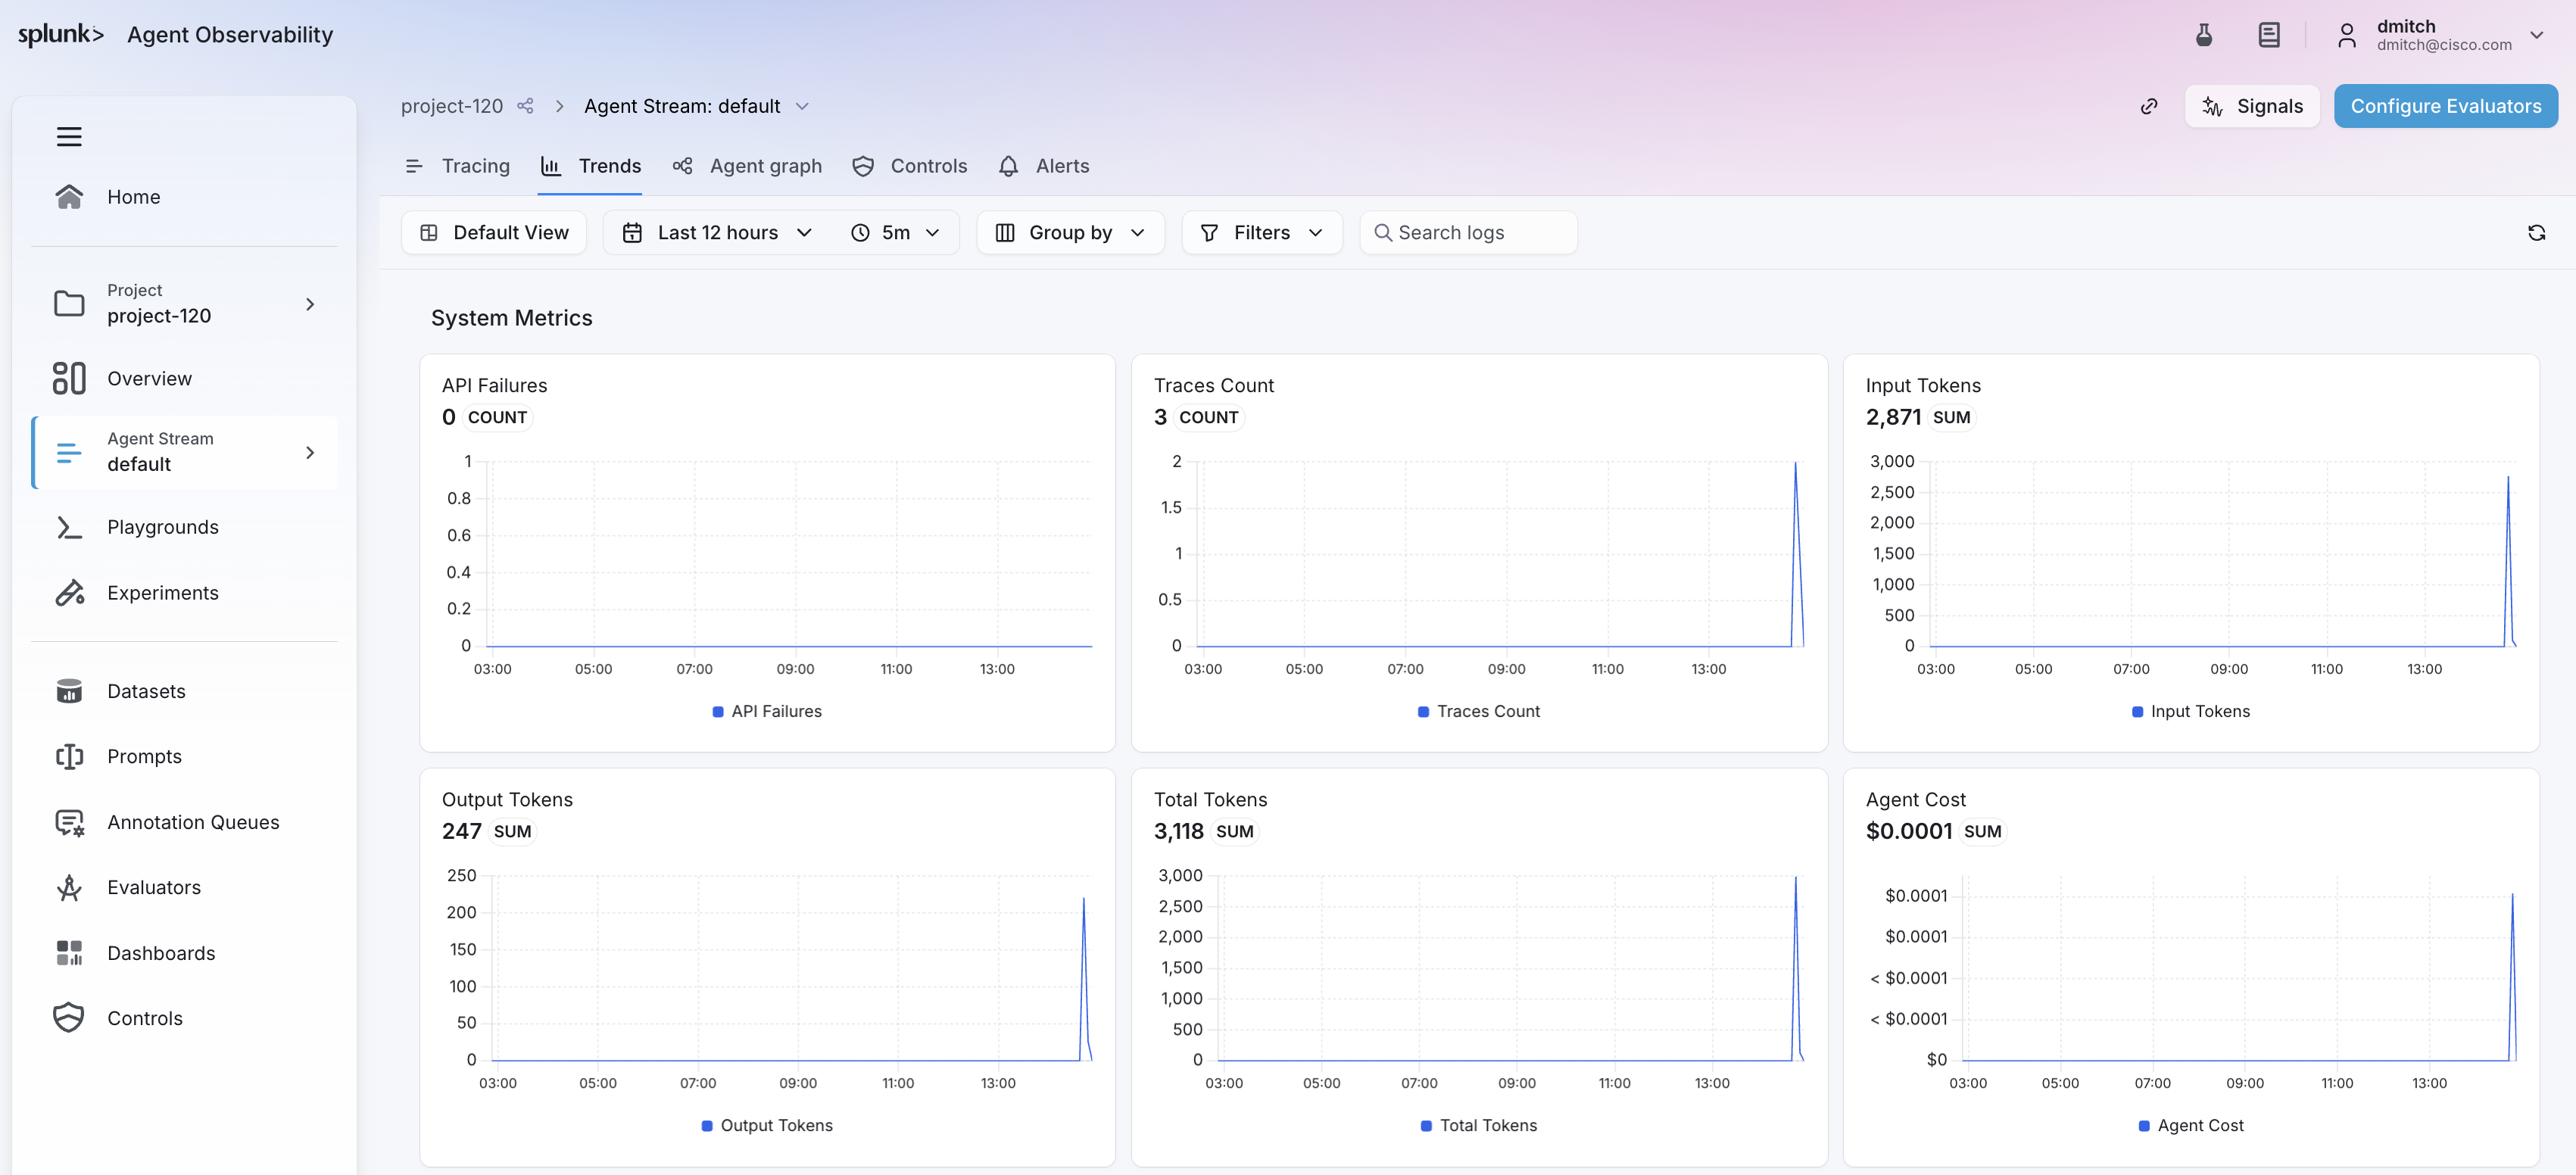
We can also switch to the Trends tab to understand how the system is performing over time. For example, we can
see how the overall latency and token usage trends across requests.
From investigation to automation
Reading individual traces is powerful for a single incident, but you can’t manually inspect
millions of them. In the next chapter you’ll enable evaluators to score every trace
automatically, so problems like ungrounded medical advice surface on their own.