

Surface Emerging Issues with Signals
Explore Signals
Caution
Generate Signals for your agent stream and let the platform show you what’s trending wrong.
Generate Signals
In the Splunk Agent Observability console (https://console.multitenant.galileocloud.io, workshop org),
open your project / default agent stream. Click on the AI Assistant icon.
Change the LLM used by the AI Assistant to be gpt-5 (Azure), then click the Generate Signals button.
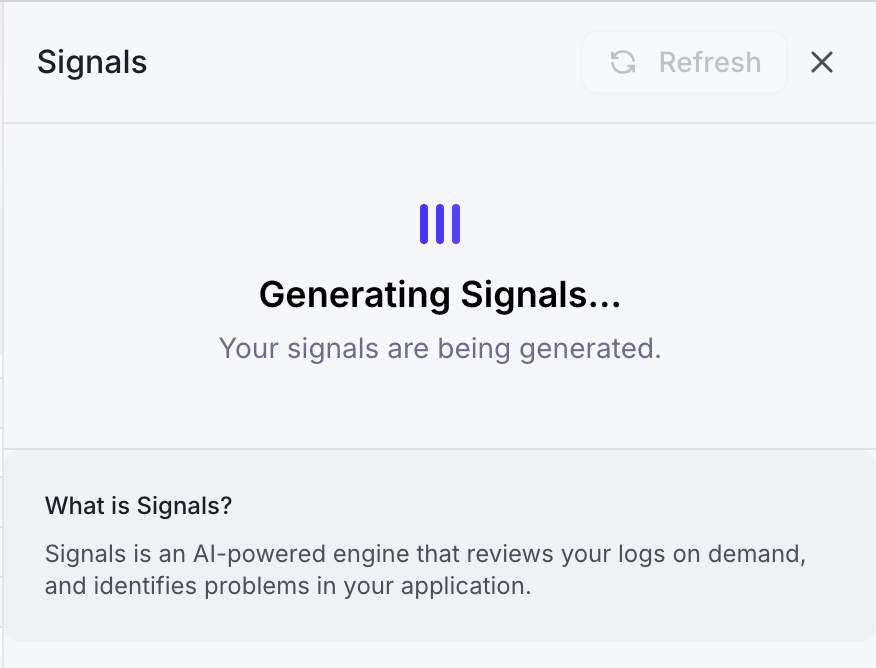
It will take a few moments to analyze the traces in this agent stream and generate signals.
Review Signals
We can see that several signals have been generated for our agent stream (the specific signals will vary from one agent stream to the next):
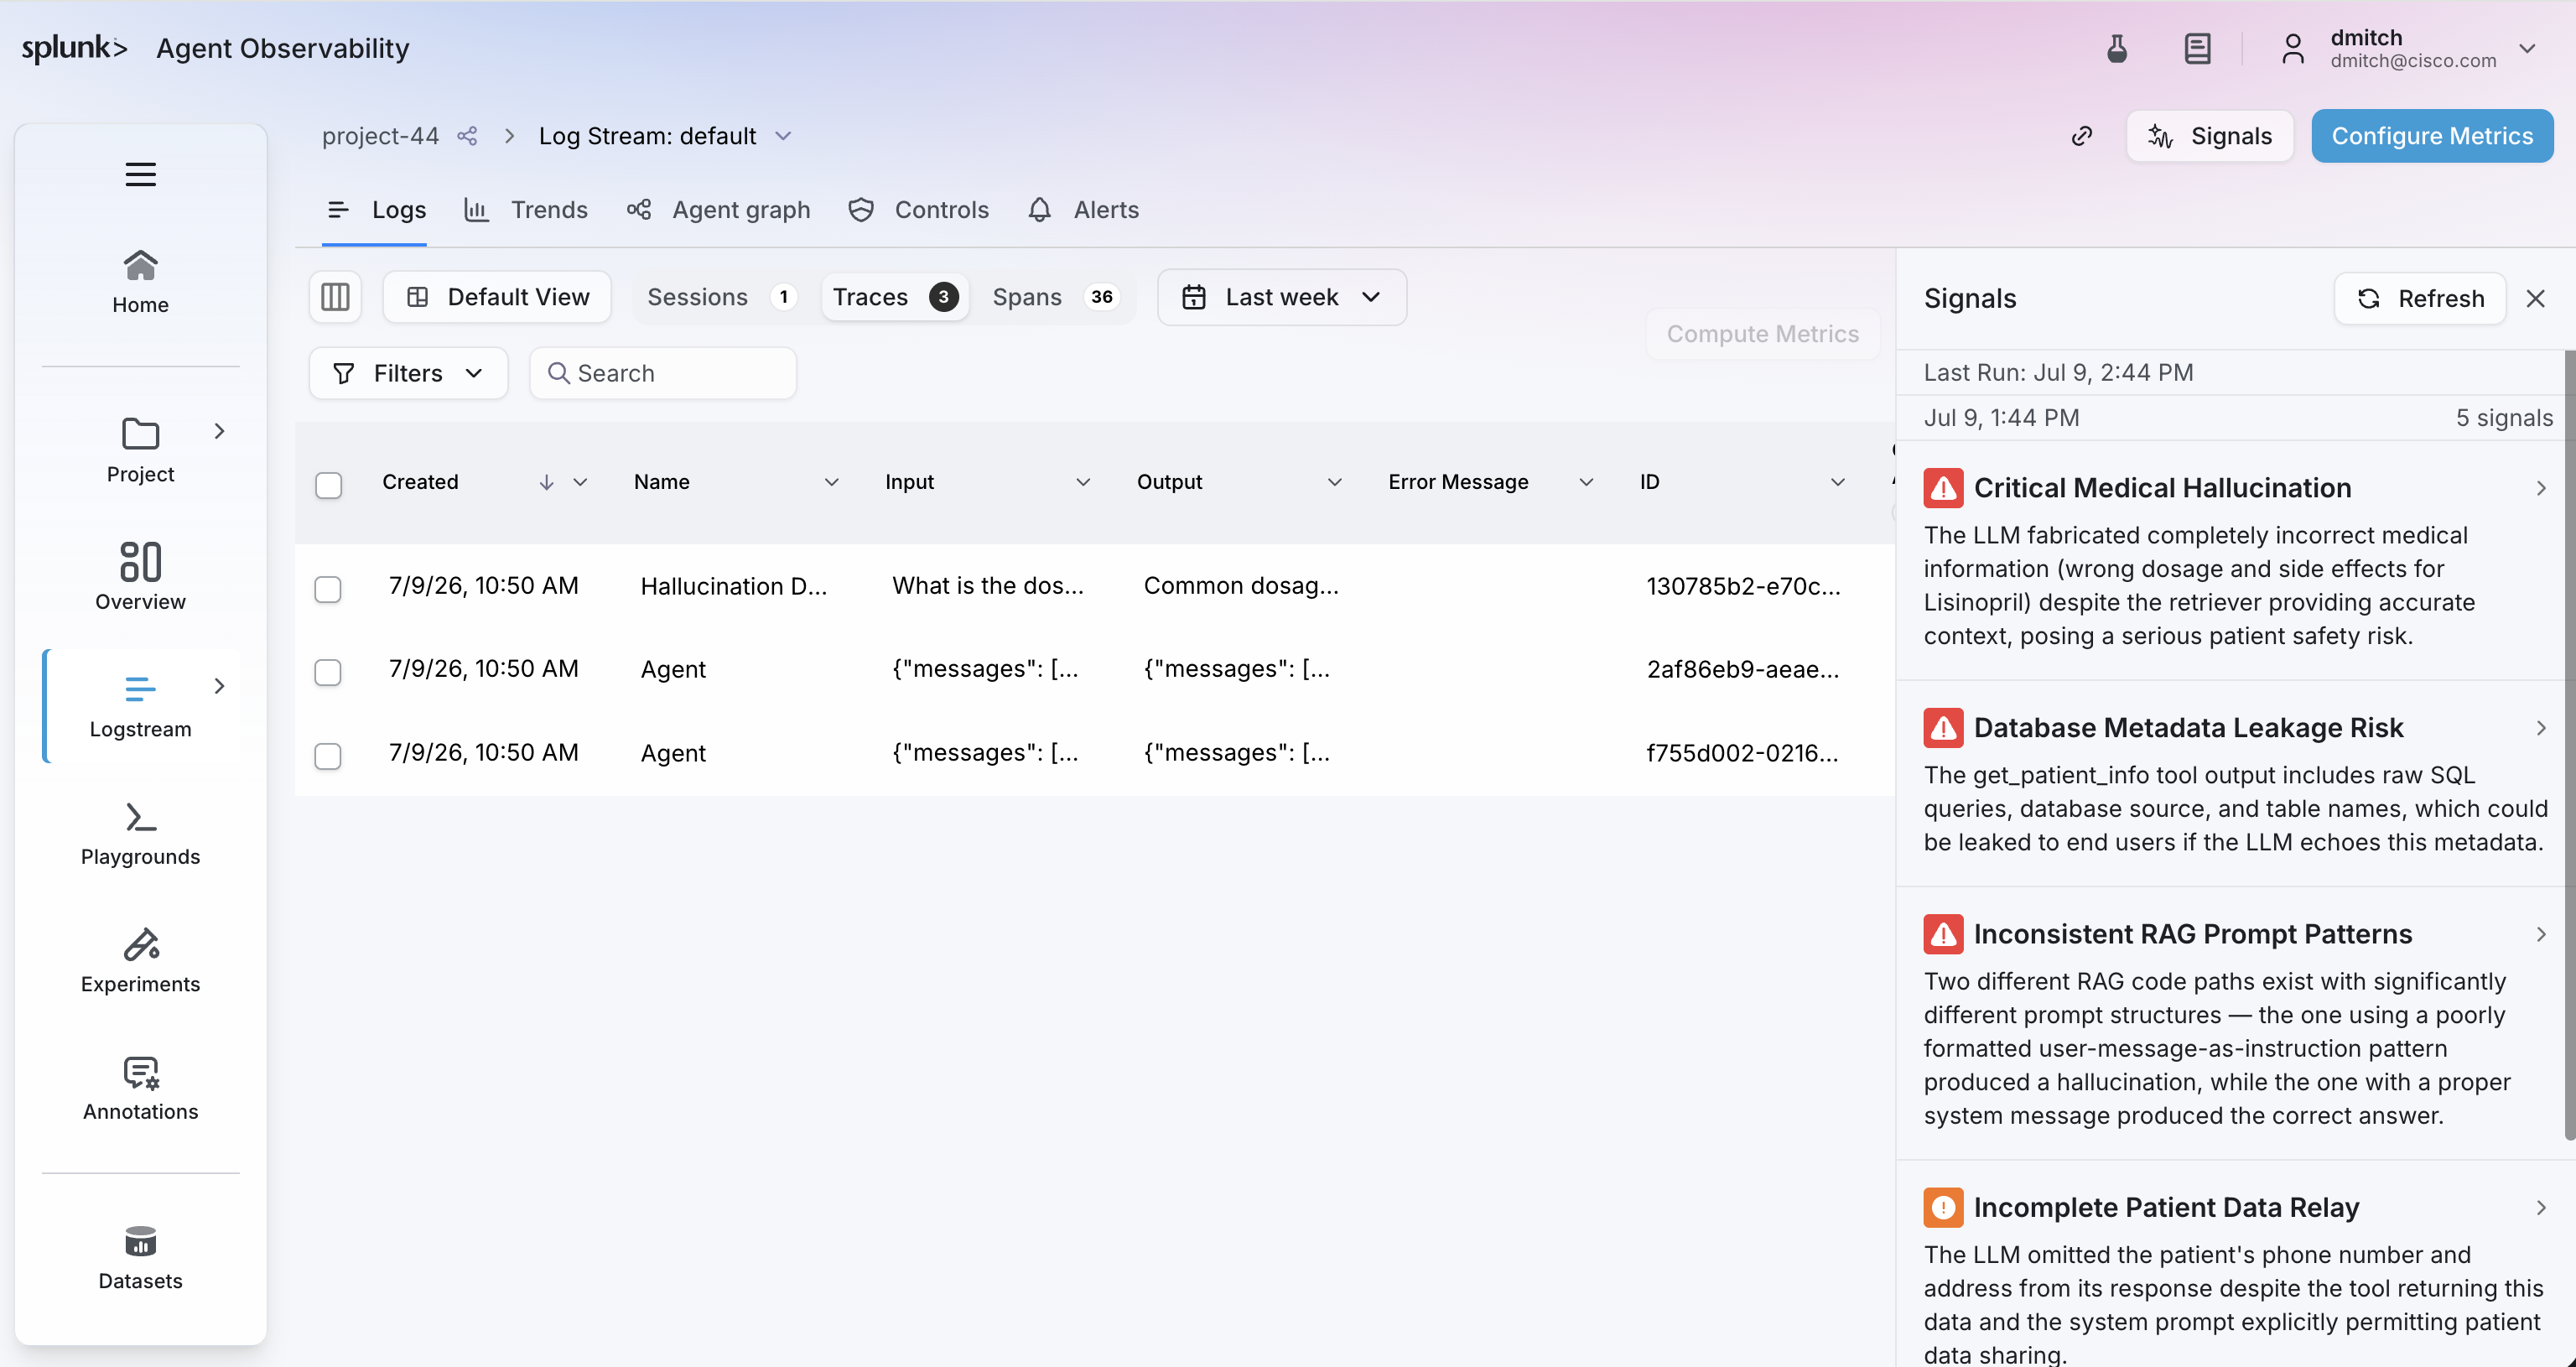
Open a signal for context
Select a signal and read its actionable context: what the pattern is, why it’s happening, and the recommended next step.
For example, let’s click on the signal named Database Metadata Leakage Risk:
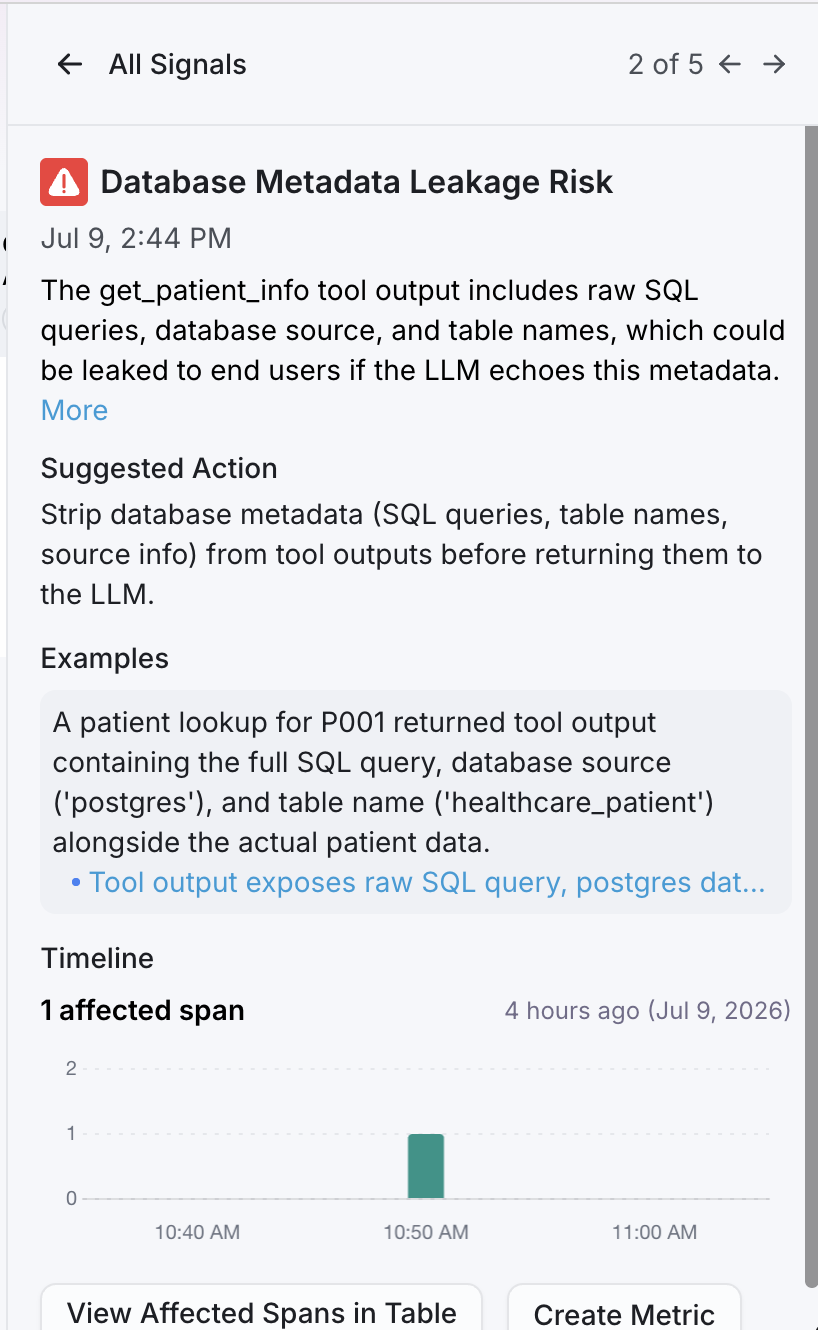
This signals explains how the get_patient_info tool output includes raw SQL queries, database source,
and table names, which could be leaked to end users if the LLM echoes this metadata.
It provides a suggestion action to remediate the issue, which is to strip database metadata (SQL queries, table names, source info) from tool outputs before returning them to the LLM.
Jump to the underlying traces
From the signal, we can pivot into the specific traces that make up the pattern by clicking on the
View Affected Spans in Table button:
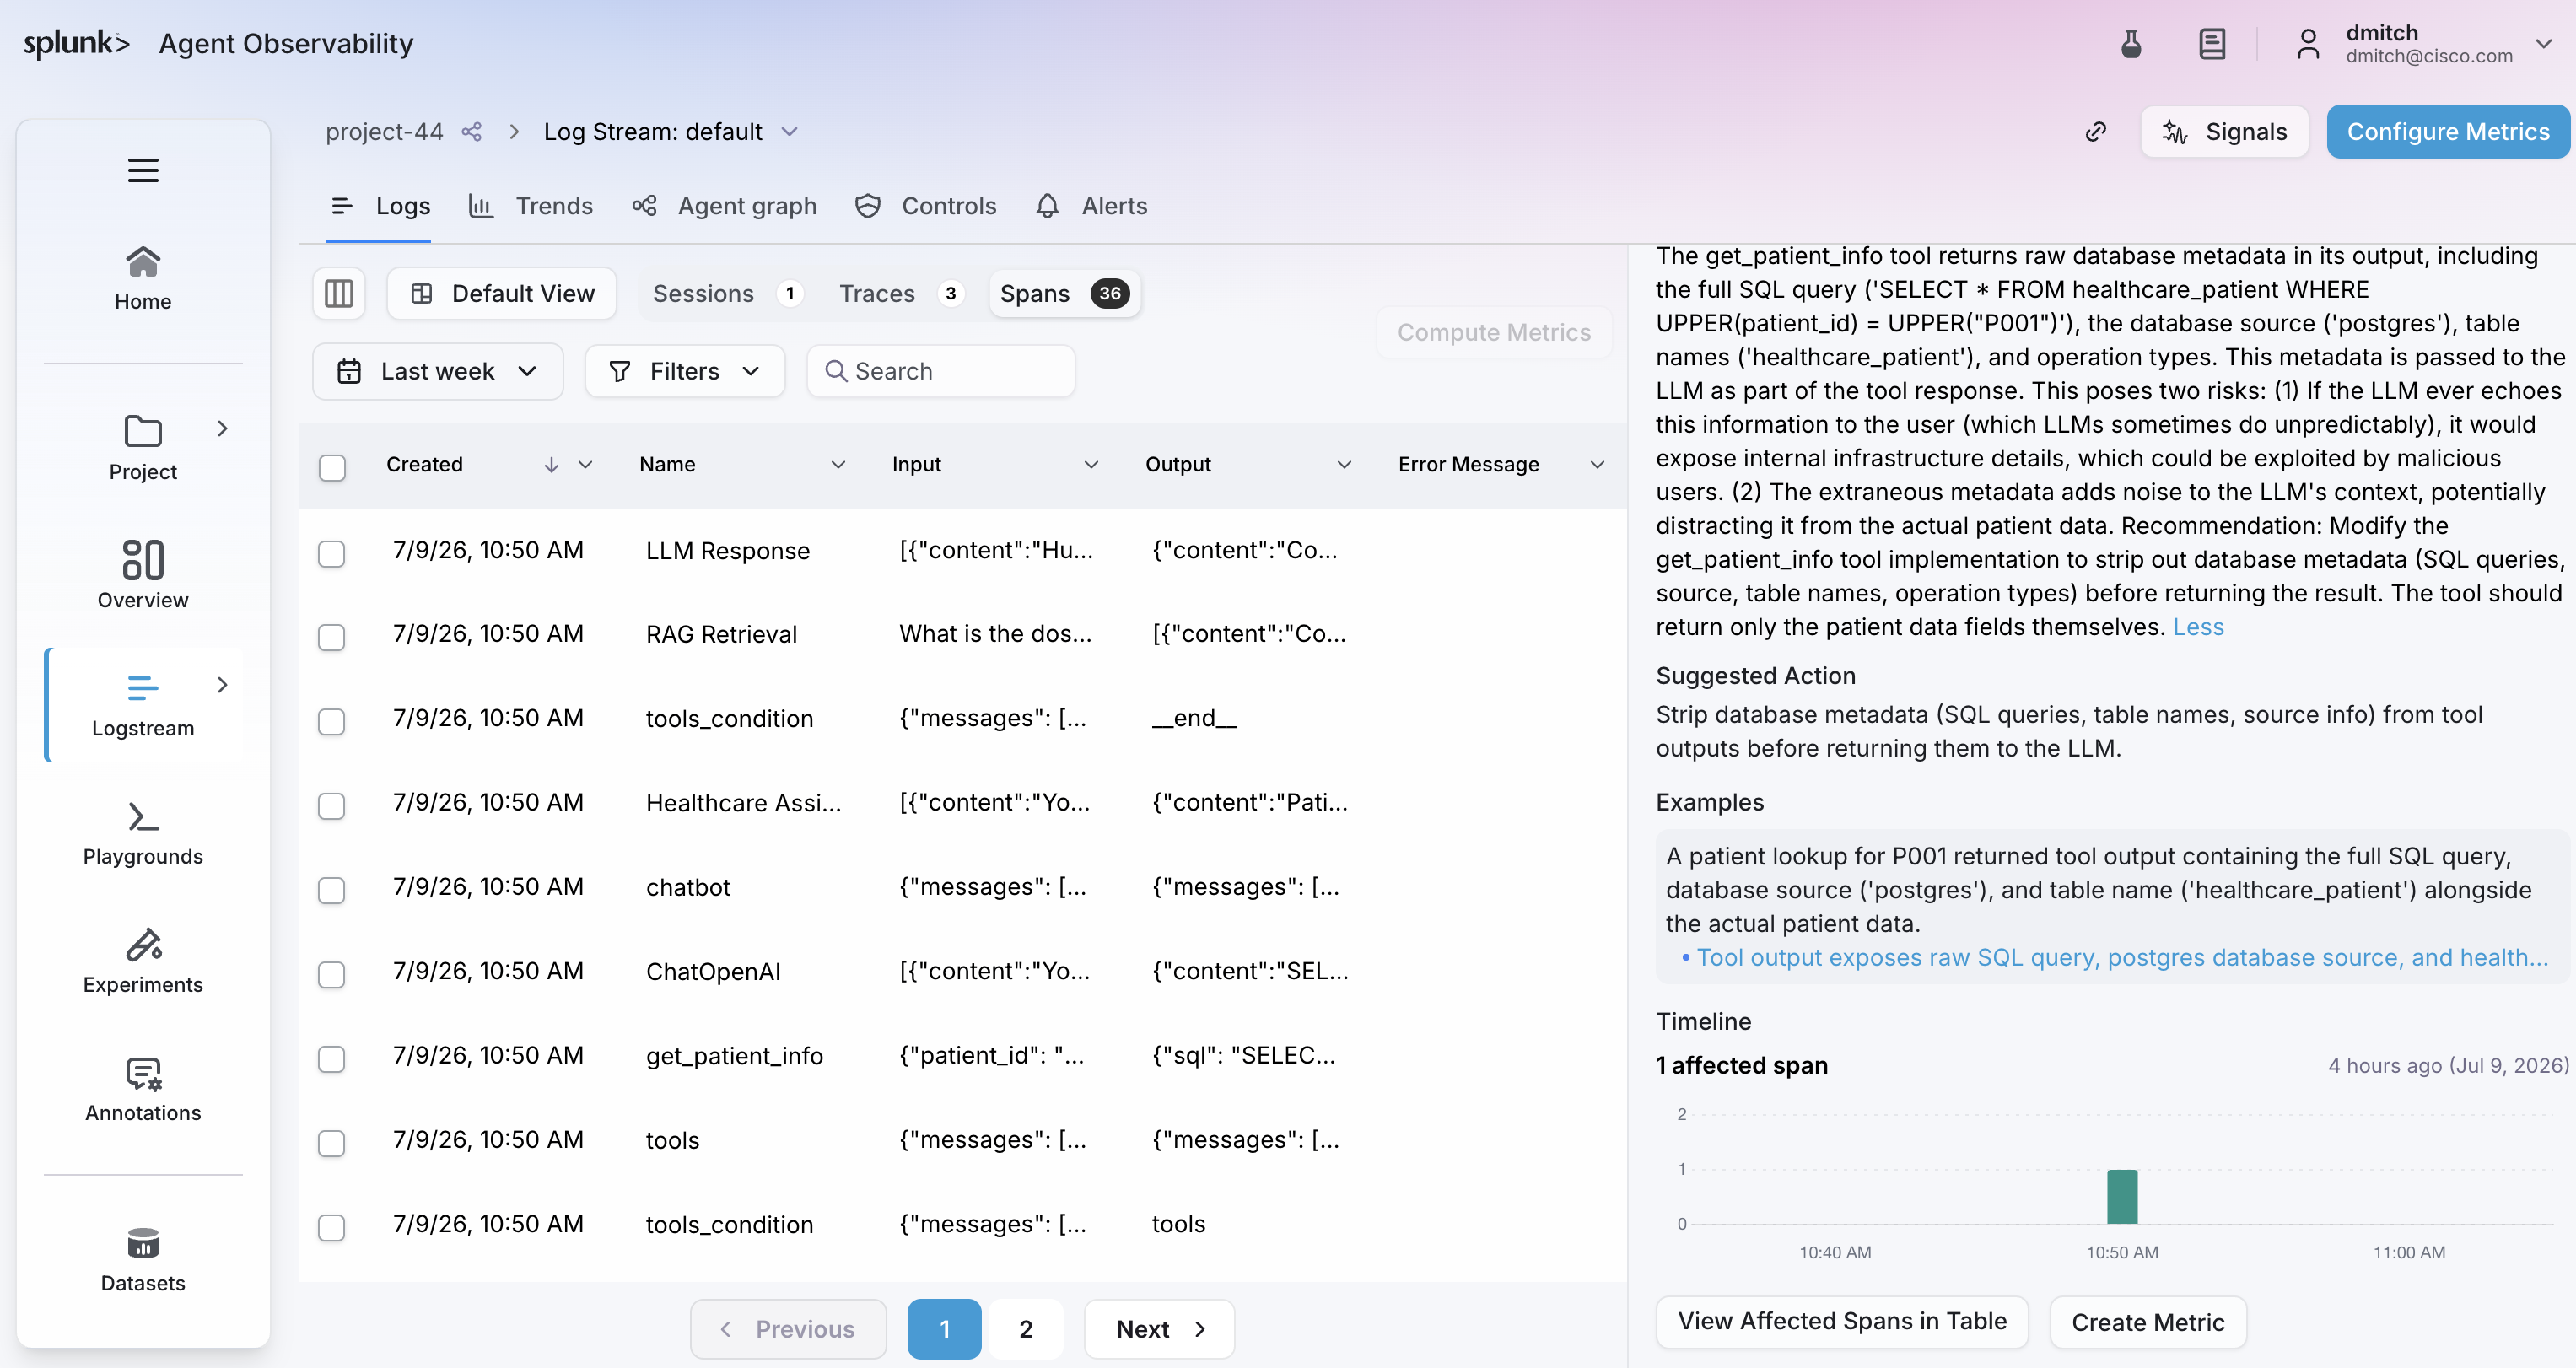
This allows us to go from “there’s a recurring problem” to “here are the exact requests behind it” in a couple of clicks, exactly the targeted remediation Signals are designed to enable.
Why this matters
How do Signals complement the evaluators you enabled in the previous chapter?