Monitor Server Health
In this exercise you will review several dashboards to monitor server health and navigate between server and application contexts.
In this exercise you will complete the following tasks:
- Review the Server Main dashboard
- Review the Server Processes dashboard
- Review the Server Volumes dashboard
- Review the Server Network dashboard
- Navigate between Server and Application contexts
Review the Server Main Dashboard #
Now that you have the Machine agent installed, let’s take a look at some of the features available in the Server Visibility module. From your Application Dashboard, click on the Servers tab and drill into the servers main dashboard by following these steps.
- Click the Servers tab on the left menu.
- Check the checkbox on the left for your server.
- Click View Details.

You can now explore the server dashboard. This dashboard enables you to perform the following tasks:
See charts of key performance metrics for the selected monitored servers, including:
- Server availability
- CPU, memory, and network usage percentages
- Server properties
- Disk, partition, and volume metrics
- Top 10 processes consuming CPU resources and memory.
You can read more about the Server Main dashboard here .
Review the Top Pane of the dashboard which provides you the following information:
- Host Id: This is an ID for the server that is unique to the Splunk AppDynamics Controller
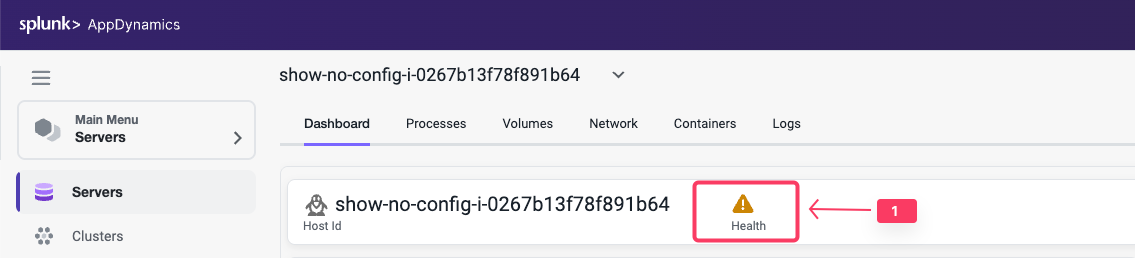
- Health: Shows the overall health of the server.
- Hierachy: Arbitrary hierarchy to group your severs together. See documentation for additional details here
- Click on the health server icon to view the Violations * Anomalies panel. Review the panel to identify potential issues
- Click on the Current Health Rule Evaluation Status to see if there are any current issues being alerted on for this server
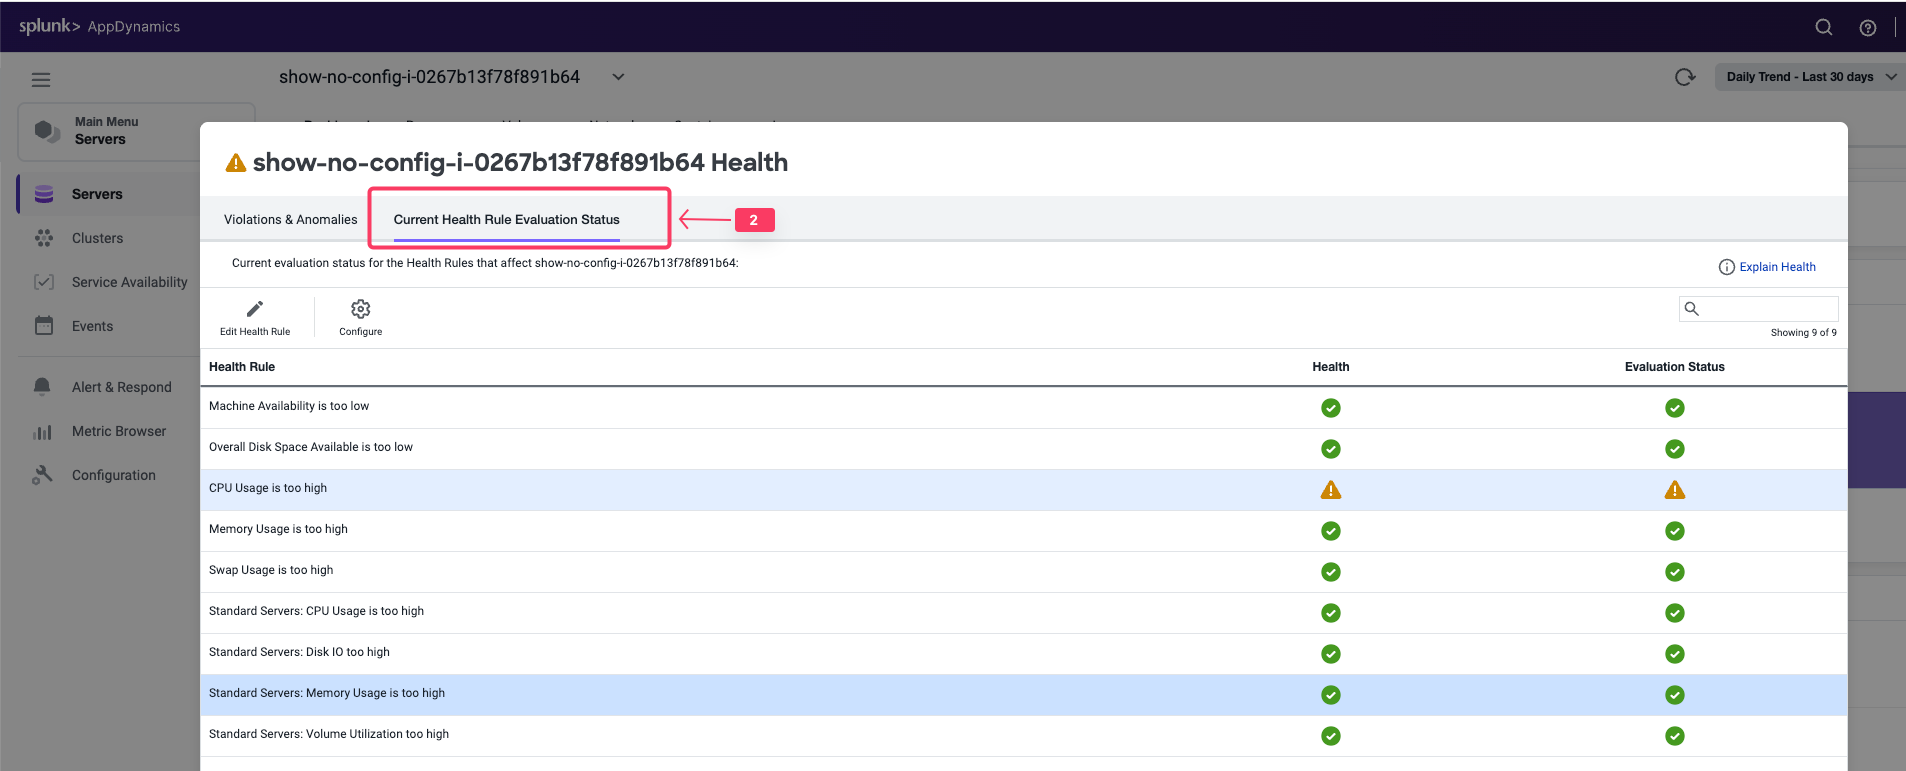
- Click on the CPU Usage too high rule
- Click on Edit Health Rule. This will open the Edit Health Rule panel
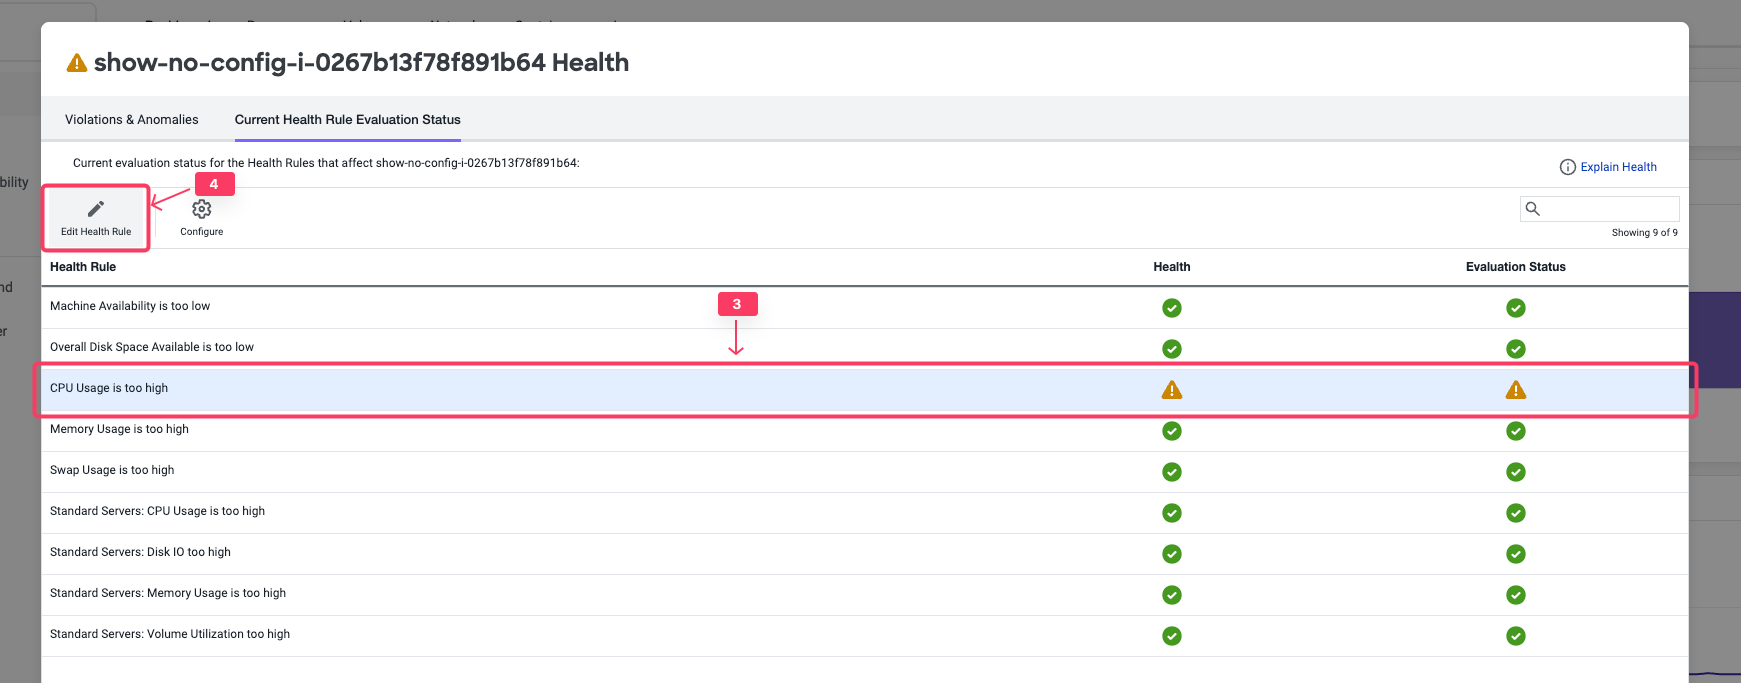
This panel gives us the ability to configure the Health Rule. A different lab will go into more details on creating and customizing health rules. For now we will just review the existing rule
- Click on the Warning Criteria
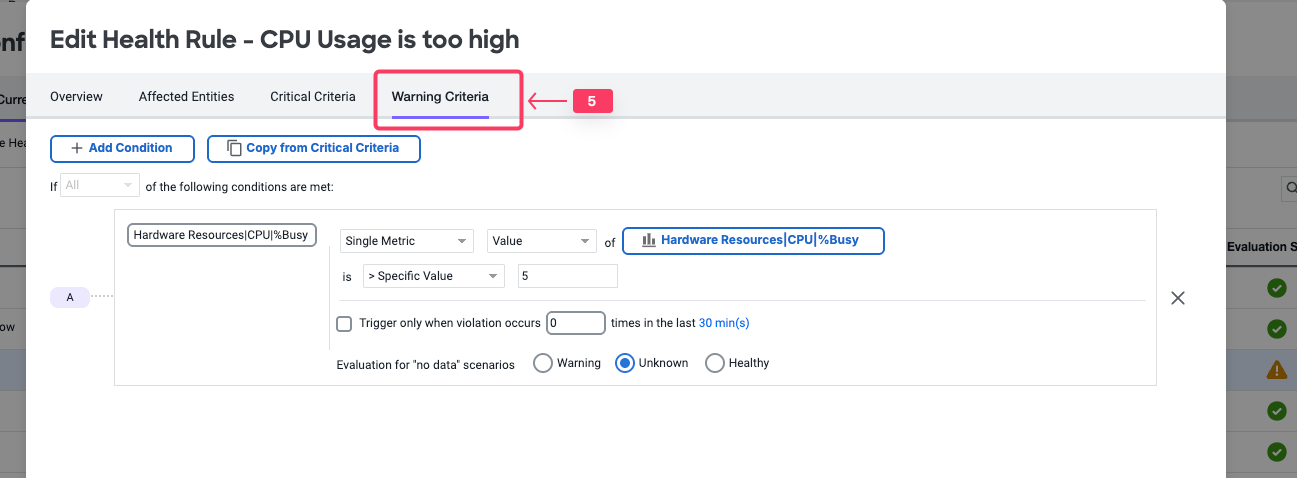
In this example we can see that the warning criteria is set when the CPU is above 5%. This is the reason why our health rule is showing a warning and not a healthy state. Cancel out of the Edit Health Rule panel to get back to the Server Dashboard
Review the Server Processes Dashboard #
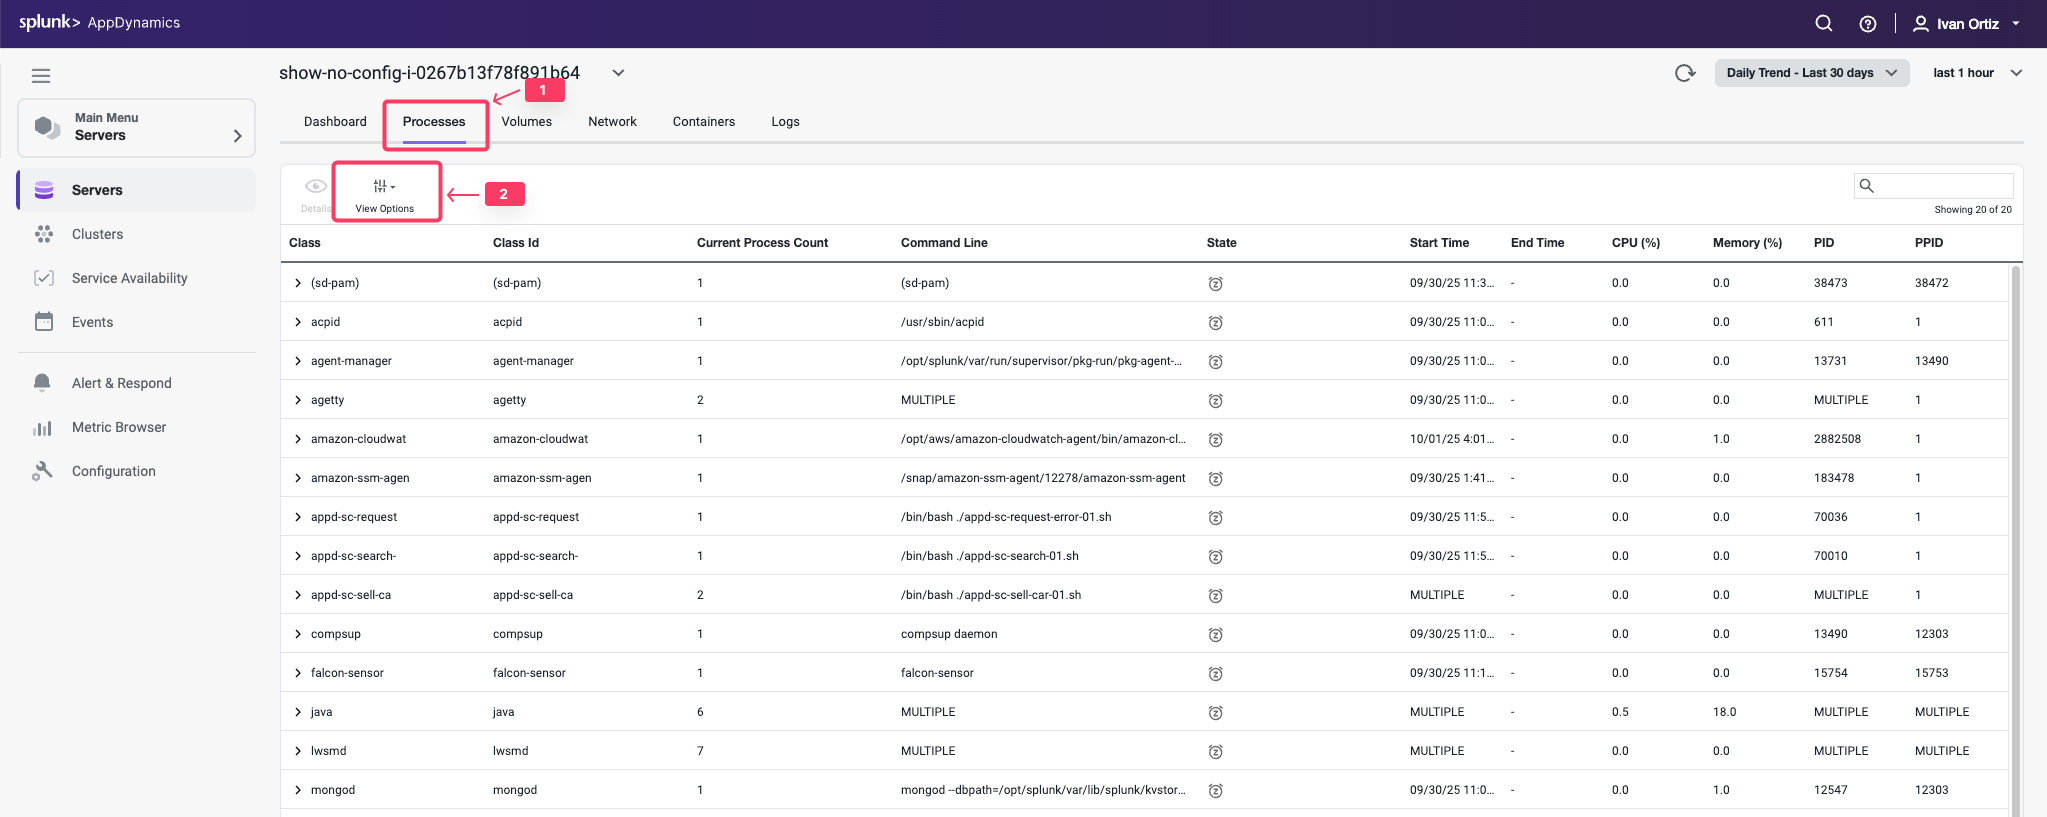
- Click the Processes tab.
- Click View Options to select different data columns. Review the KPIs available to view
You can now explore the server processes dashboard. This dashboard enables you to perform the following tasks:
- View all the processes active during the selected time period. The processes are grouped by class as specified in the ServerMonitoring.yml file.
- View the full command line that started this process by hovering over the process entry in the Command Line column.
- Expand a process class to see the processes associated with that class.
- Use View Options to configure which columns to display in the chart.
- Change the time period of the metrics displayed.
- Sort the chart using the columns as a sorting key. You can not sort on sparkline charts: CPU Trend and Memory Trend.
- See CPU and Memory usage trends at a glance.
You can read more about the Server Processes dashboard here .
Review the Server Volumes Dashboard #
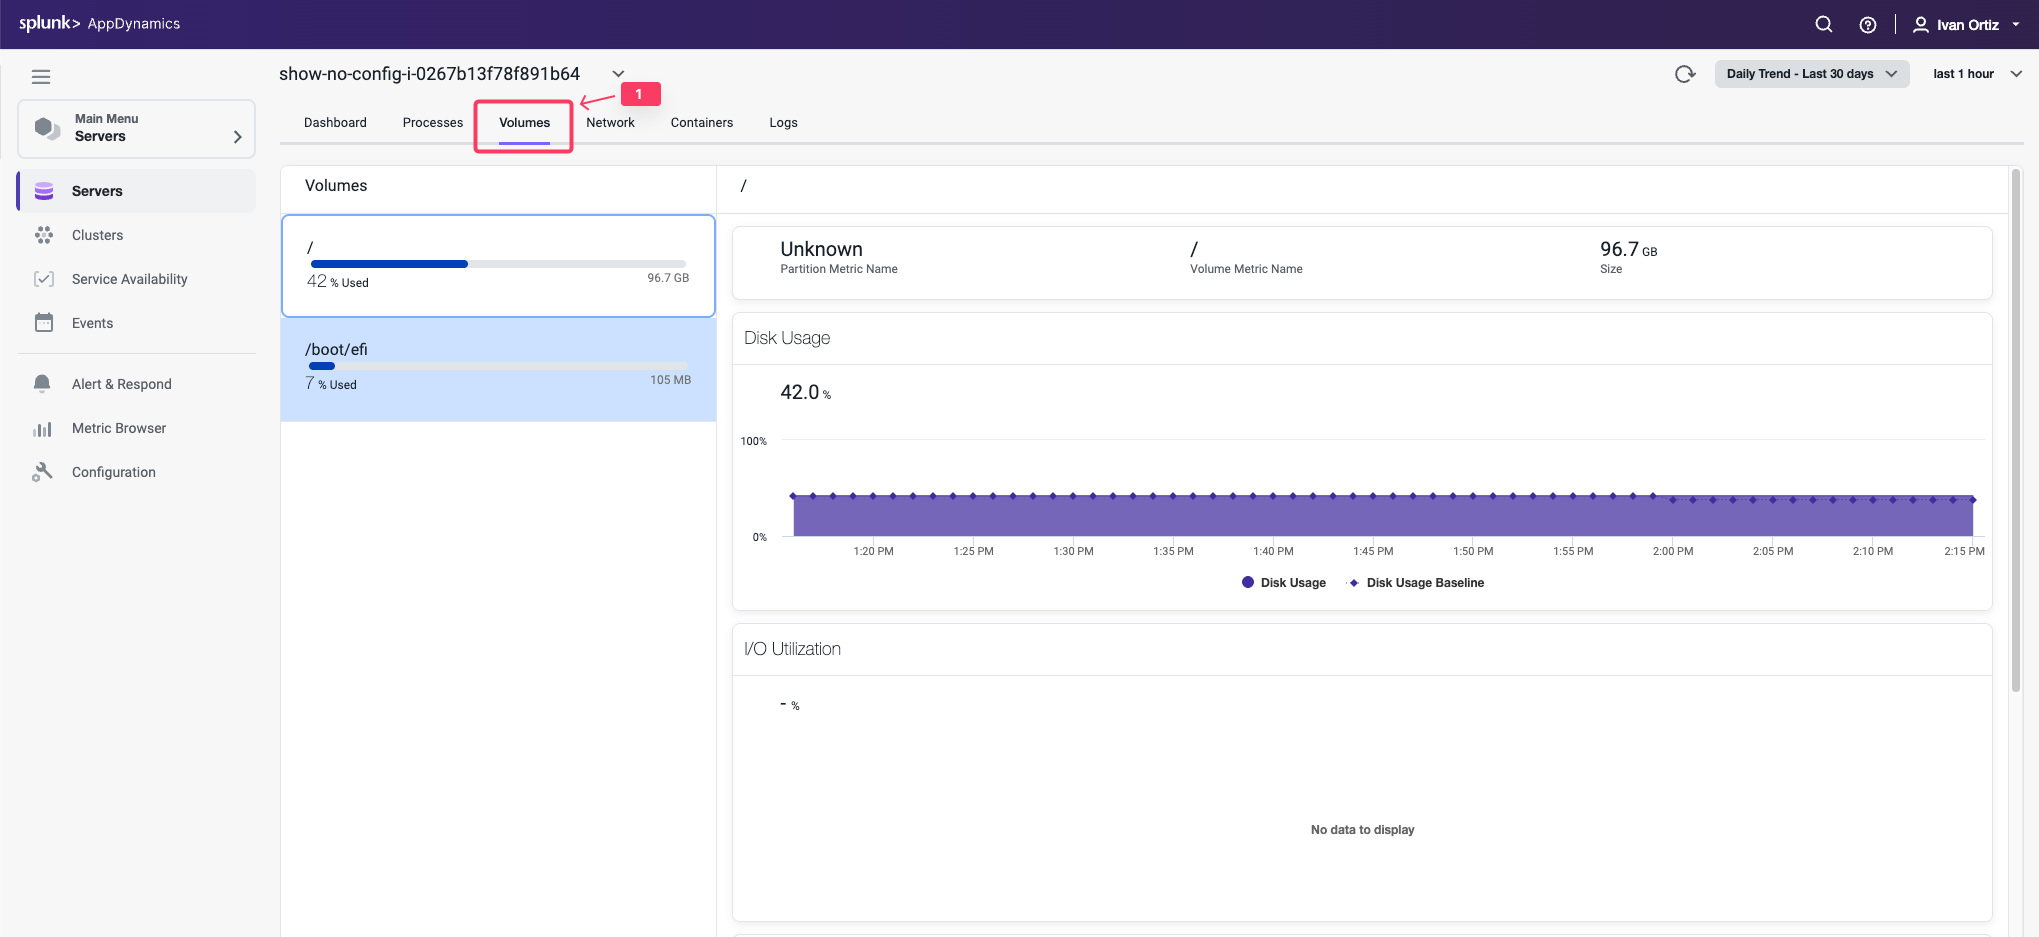
- Click the Volumes tab.
You can now explore the server volumes dashboard. This dashboard enables you to perform the following tasks:
- See the list of volumes, the percentage used and total storage space available on the disk, partition or volume.
- See disk usage and I/O utilization, rate, operations per second, and wait time.
- Change the time period of the metrics collected and displayed.
- Click on any point on a chart to see the metric value for that time.
You can read more about the Server Volumes dashboard here .
Review the Server Network Dashboard #
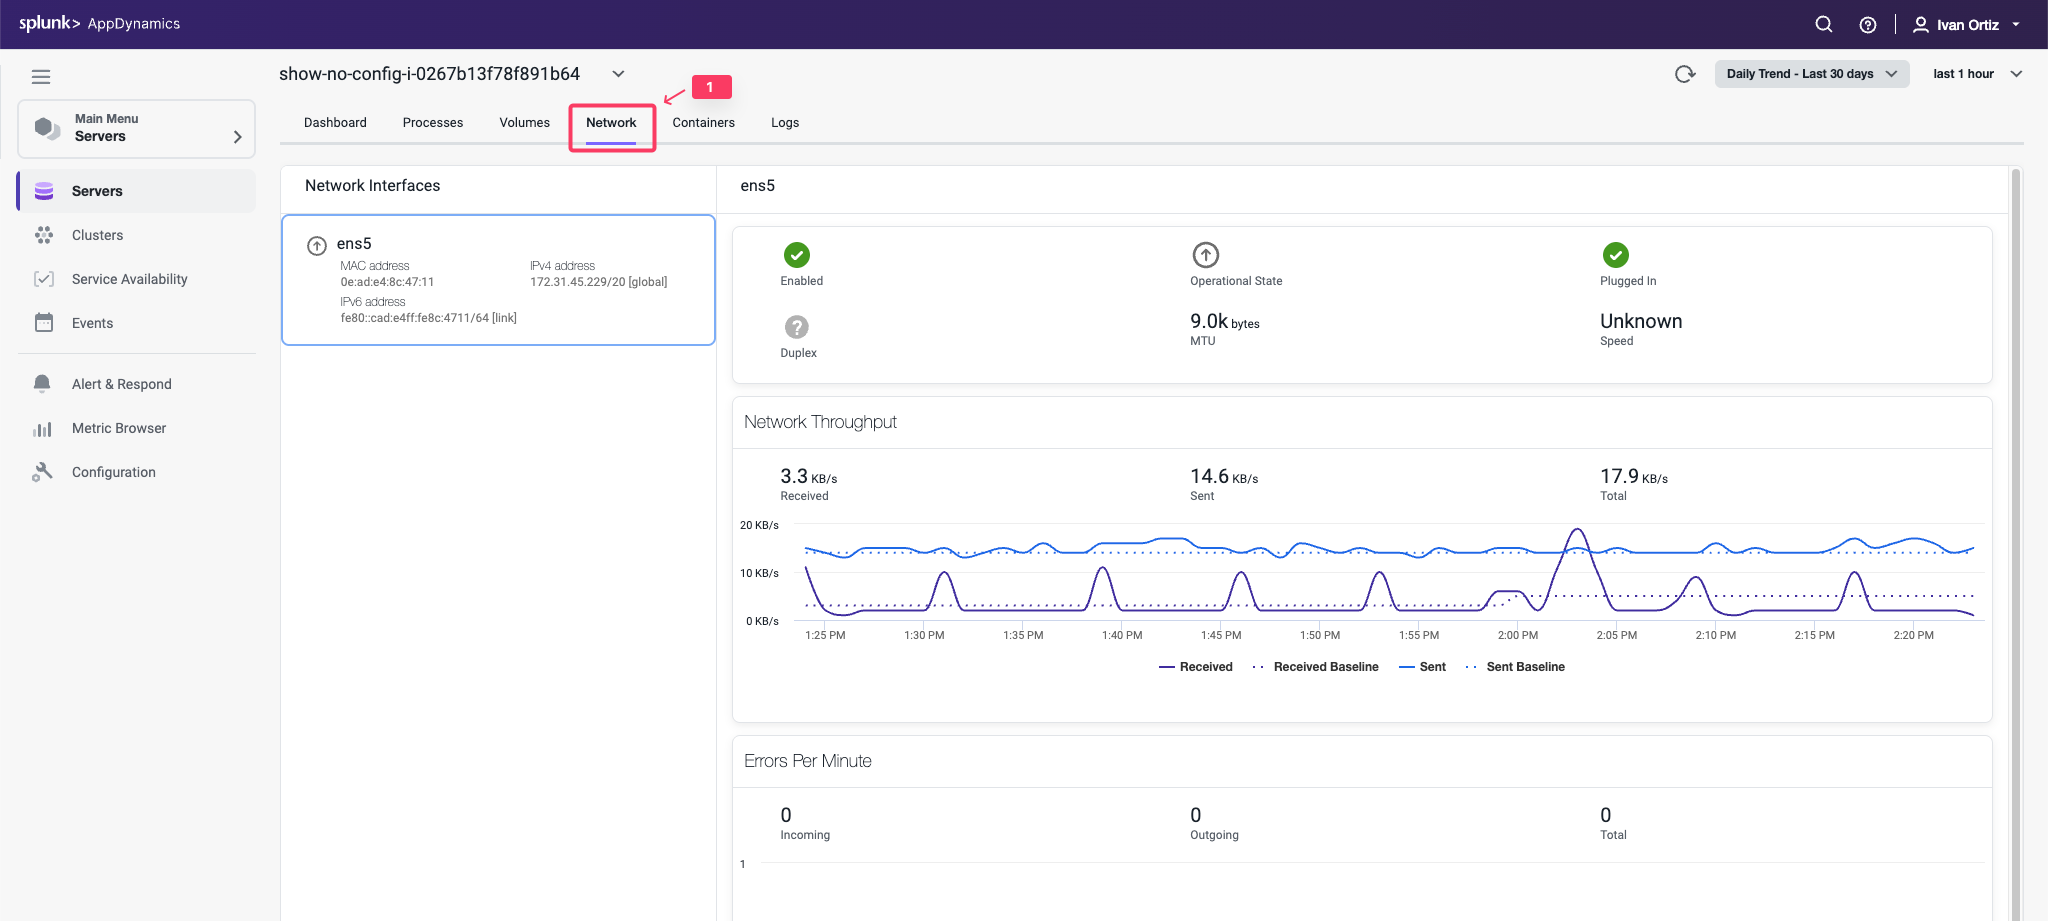
- Click the Network tab.
You can now explore the Server Network dashboard. This dashboard enables you to perform the following tasks:
- See the MAC, IPv4, and IPv6 address for each network interface.
- See whether or not the network interface is enabled, functional, its operational state equipped with an ethernet cable that is plugged in, operating in full or half-full duplex mode, maximum transmission unit (MTU) or size (in bytes) of the largest protocol data unit that the network interface can pass, speed of the ethernet connection in Mbit/sec.
- View network throughput in kilobytes/sec and packet traffic.
- Change the time period of the metrics displayed.
- Hover over on any point on a chart to see the metric value for that time.
You can read more about the Server Network dashboard here .