

Phase 1: Run with AppDynamics
3. Run and Verify in AppD
Now run the application with the AppDynamics agent attached. This is the “normal” single-destination instrumentation.
Run with the AppDynamics Agent #
Replace <YOUR-ACCESS-KEY> with the AppDynamics token from the previous step:
Export your environment variables
bash
export APPD_ACCESS_KEY=<Your-AppDynamics-access-key>and
bash
export APPD_APP_NAME=Dual-Ingest-${INSTANCE}Then we can start java with the agent:
bash
cd ~/workshop/appd

java -javaagent:agent/javaagent.jar \
  -Dappdynamics.controller.hostName=se-lab.saas.appdynamics.com \
  -Dappdynamics.controller.port=443 \
  -Dappdynamics.controller.ssl.enabled=true \
  -Dappdynamics.agent.applicationName=${APPD_APP_NAME} \
  -Dappdynamics.agent.tierName=OrderService \
  -Dappdynamics.agent.nodeName=OrderService-Node \
  -Dappdynamics.agent.accountName=se-lab \
  -Dappdynamics.agent.accountAccessKey=${APPD_ACCESS_KEY} \
  -jar app/target/ingest-workshop-1.0.0.jar &
text
java -javaagent:agent/javaagent.jar \
  -Dappdynamics.controller.hostName=se-lab.saas.appdynamics.com \
  -Dappdynamics.controller.port=443 \
  -Dappdynamics.controller.ssl.enabled=true \
  -Dappdynamics.agent.applicationName=Dual-Ingest-shw-4267 \
  -Dappdynamics.agent.tierName=OrderService \
  -Dappdynamics.agent.nodeName=OrderService-Node \
  -Dappdynamics.agent.accountName=se-lab \
  -Dappdynamics.agent.accountAccessKey="hj9999999999" \
  -jar app/target/ingest-workshop-1.0.0.jar &
Wait for the Spring Boot startup banner to appear (about 10-15 seconds). Press return to go back to your prompt.
Generate Load #
Start a simple load generator in the background:
bash
while true; do
  curl -s localhost:8080/order > /dev/null
  curl -s localhost:8080/inventory > /dev/null
  sleep 2
done &
Verify in the AppDynamics Controller #
- Open the AppDynamics Controller
- Navigate to Applications and find your application (e.g.
Dual-Ingest-<your_INSTANCE_var>) - Click into the application to view the Flow Map
Patience
It may take 2-5 minutes for the application to register and for business transactions to appear in the flow map. Refresh the page if needed.You should see:
- The OrderService tier in the flow map
- Business transactions for
/orderand/inventoryendpoints - Metric data flowing into the controller
At this point, data is flowing only to AppDynamics. The application has no connection to Splunk Observability Cloud. In the next phase, you’ll change that by enabling dual signal mode.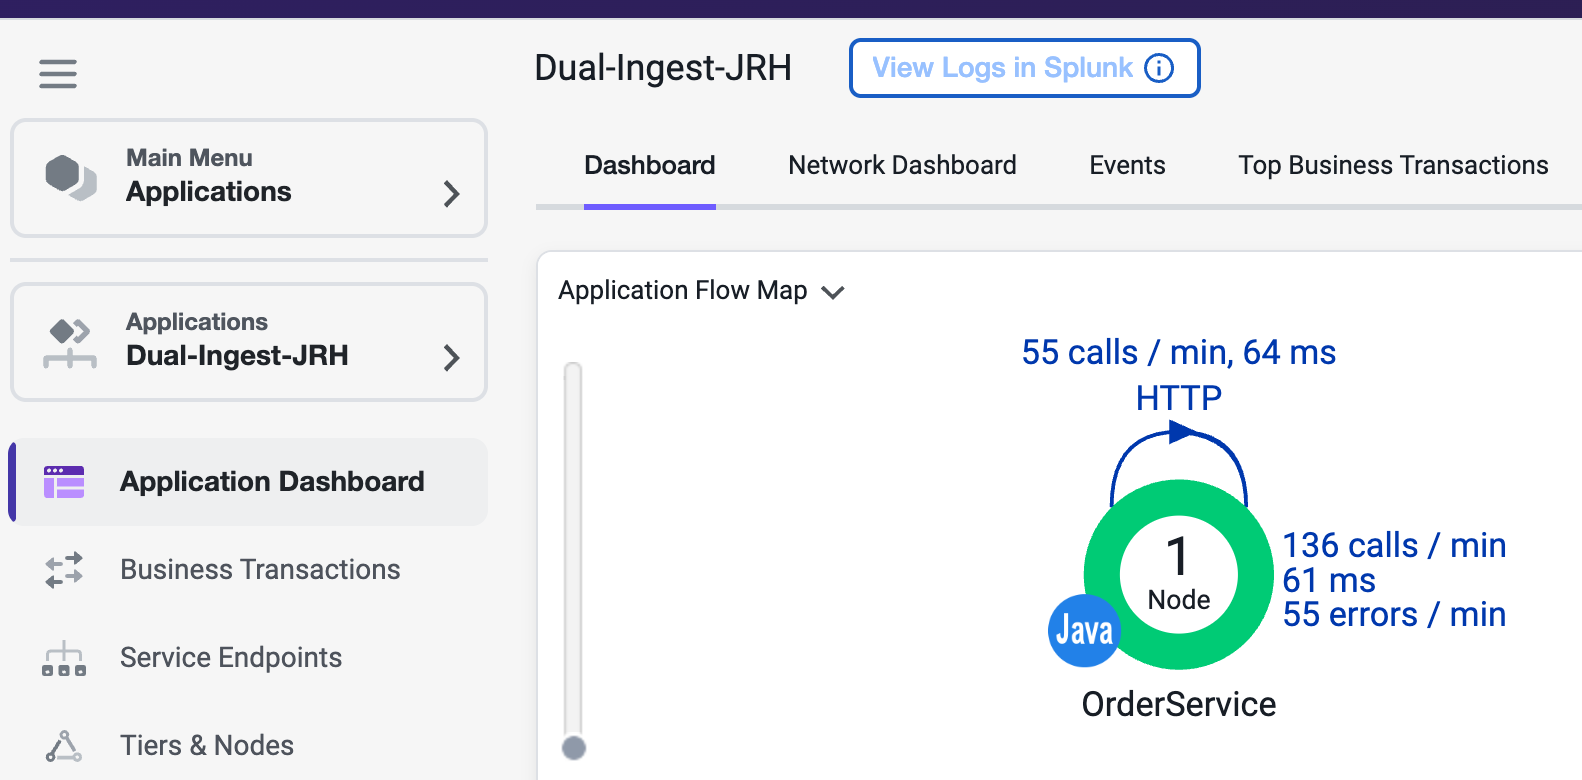
Keep it running
Leave the application and load generator running. You’ll stop them in the next section to add dual mode flags.