Phase 3: Global Data Links
Create a global data link in Splunk Observability Cloud that navigates directly to the corresponding AppDynamics tier view using the appd.* span attributes.
NOTICE
If participating in a group workshop please observe your instructor and refrain from creating more global data links. You do not need to complete this section of the workshop yourself. The instructions are included for enablement and documentation purposes. Thank you!The appd.* attributes on your traces are more than metadata they can power global data links that let anyone viewing a trace in Splunk Observability Cloud jump straight into the corresponding AppDynamics view with a single click.
What are Global Data Links? #
Global data links are a Splunk Observability Cloud feature that creates clickable links on span attributes, tag values, or metric dimensions. When a user clicks a linked value, they are taken to an external URL you define with the actual attribute value substituted into the URL template.
Pre-requisite for our Data Link #
Copy the URL to your application in AppDynamics. The important part of the URL that identifies your application is a query parameter on the url (E.G. &application=99999)
The full url including the application query parameter are used to build your global data link
Create the Global Data Link #
- In Splunk Observability Cloud, click Settings (gear icon) in the left navigation panel.
- Click Global Data Links.
- Click New Link.
- Configure the link:
| Field | Value |
|---|---|
| Link Label | Open in AppDynamics |
| Link to | Custom URL |
| Show on | Property:Value pair - Choose appd.app.name:<YOUR APPLICATION NAME> (E.G. appd.app.name:Dual-Ingest-JRH) |
| URL | https://se-lab.saas.appdynamics.com/controller/#/location=APP_DASHBOARD&timeRange=Custom_Time_Range.BETWEEN_TIMES.{{ end_time }}.{{ start_time }}.6&application=<YOUR_APPLICATION_ID_NUMBER>&dashboardMode=force |
| Time format | Unix time: epoch milliseconds |
| Minimum trigger | appd.tier.name |
URL Template Syntax
The double curly braces {{ end_time }} and {{ start_time }} are template variables. Splunk Observability Cloud substitutes them with the actual values at click time.
<YOUR_APPLICATION_ID_NUMBER> is the number from your query parameters for your specific application
- Click Save.
Test the Global Data Link #
- Navigate back to APM and open a trace for your OrderService service.
- Click on the root span to view its attributes.
- Find
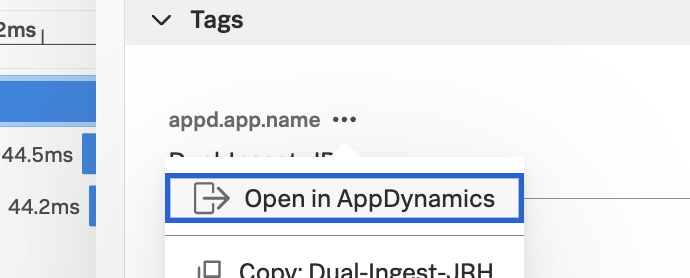
appd.app.namein the attributes list it should now be a clickable link labeled Open in AppDynamics. - Click the link. A new browser tab should open, taking you directly to the OrderService application view in the AppDynamics Controller.
Note
You must be logged into the AppDynamics Controller in the same browser for the link to work. If you’re prompted to log in, use your Cisco credentials.Navigating the Other Direction (AppD to Splunk) #
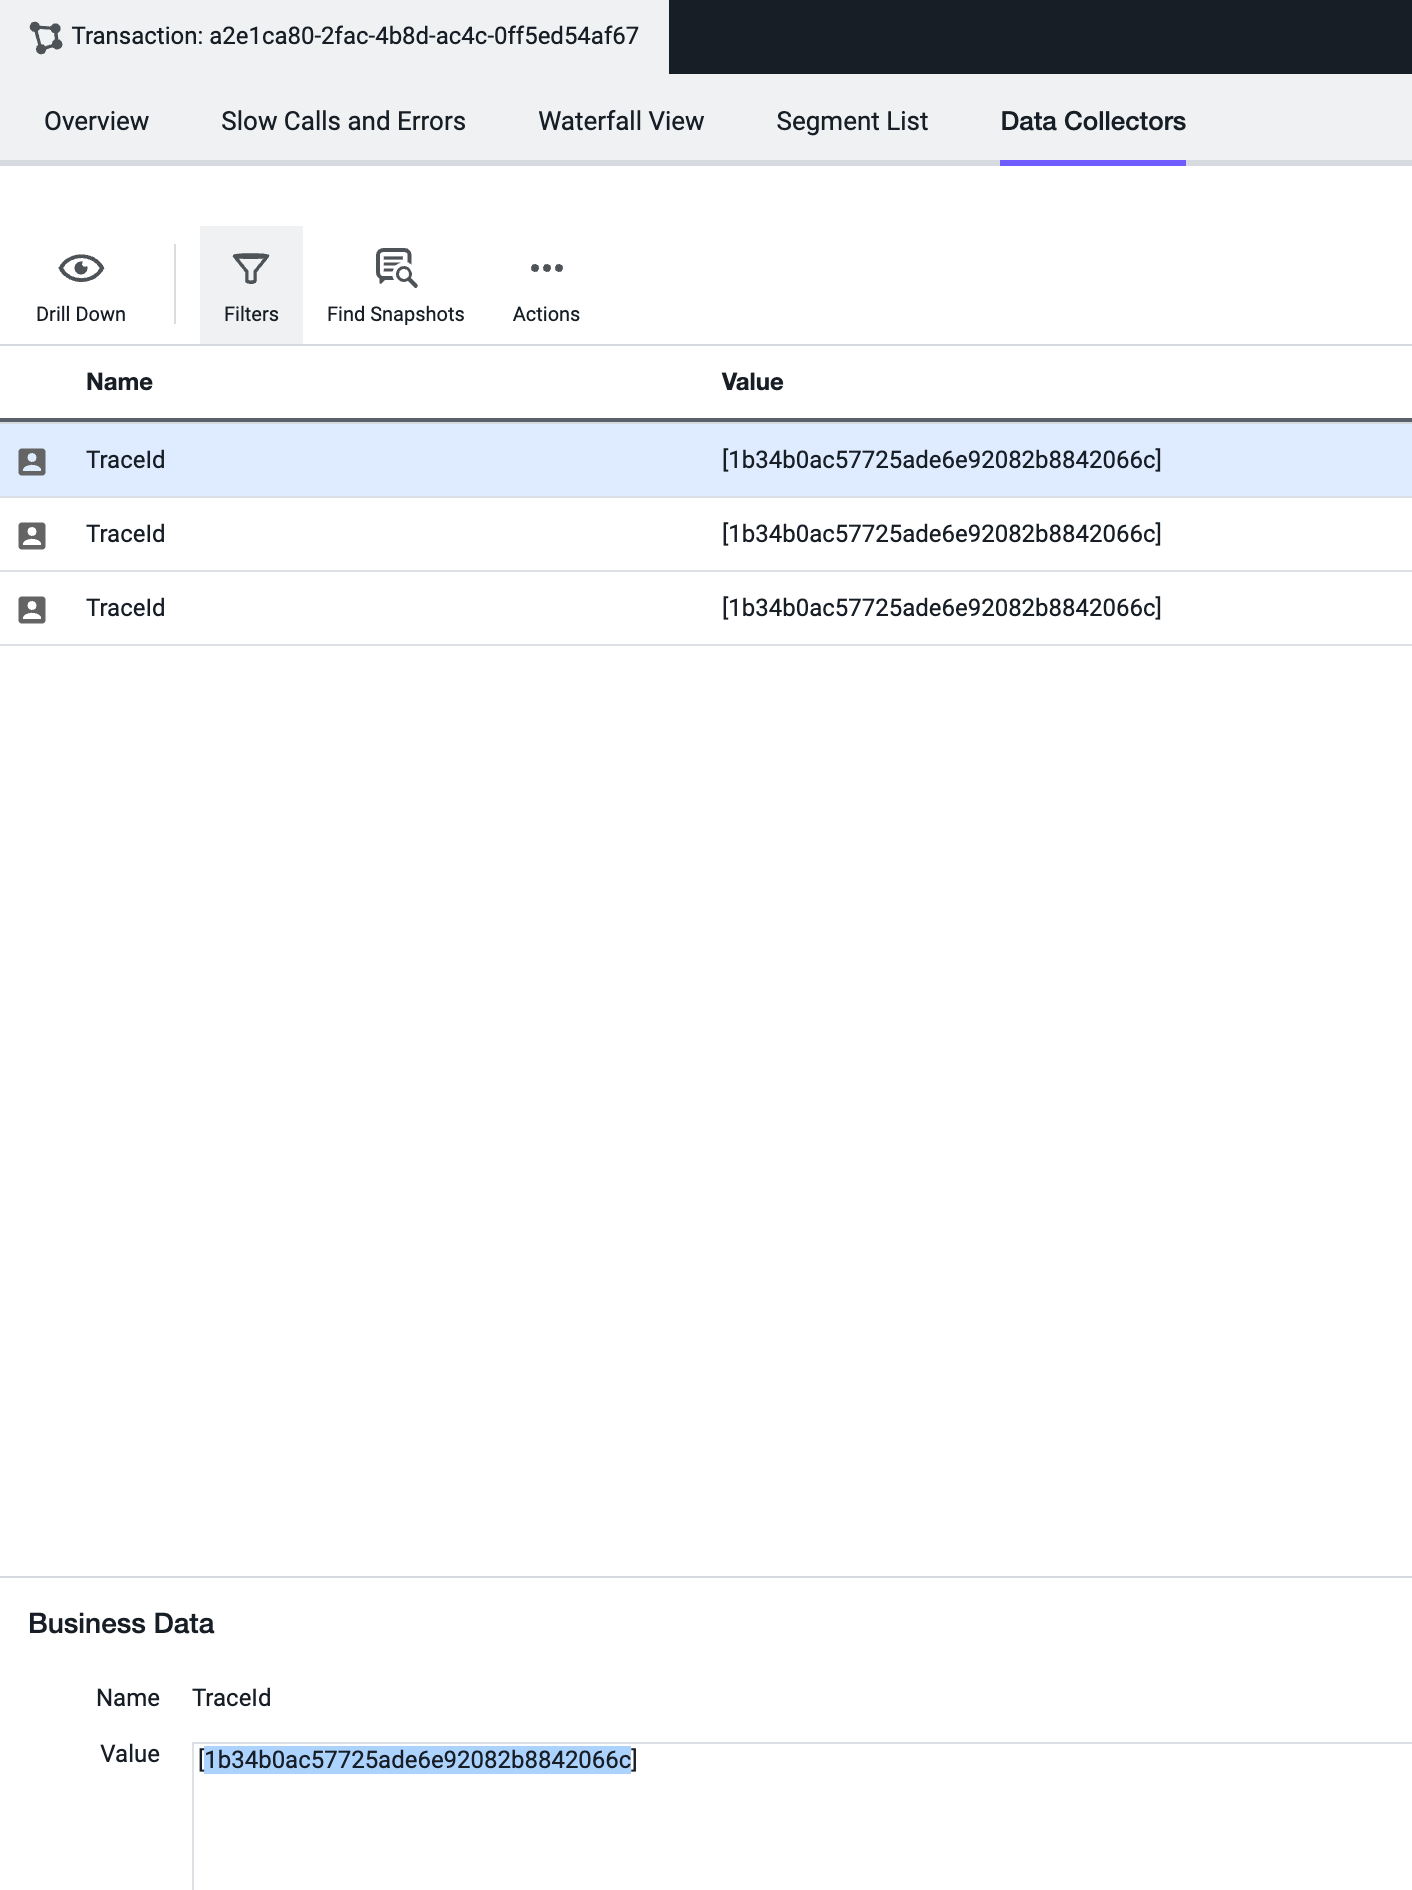
Navigation in the opposite direction is also possible. AppDynamics snapshots captured in dual mode include the OTel TraceId under the Data Collectors tab.
To find the corresponding trace in Splunk Observability Cloud:
- In the AppDynamics Controller, open a Transaction Snapshot for a business transaction.
- Go to the Data Collectors tab.
- Find the
TraceIdvalue. - In Splunk Observability Cloud, go to APM → Traces and search for that trace ID.
This gives you bidirectional association between the two platforms.