Verify Kubernetes Cluster metrics
Once the installation has completed, you can log in to Splunk Observability Cloud and verify that the metrics are flowing in from your Kubernetes cluster.
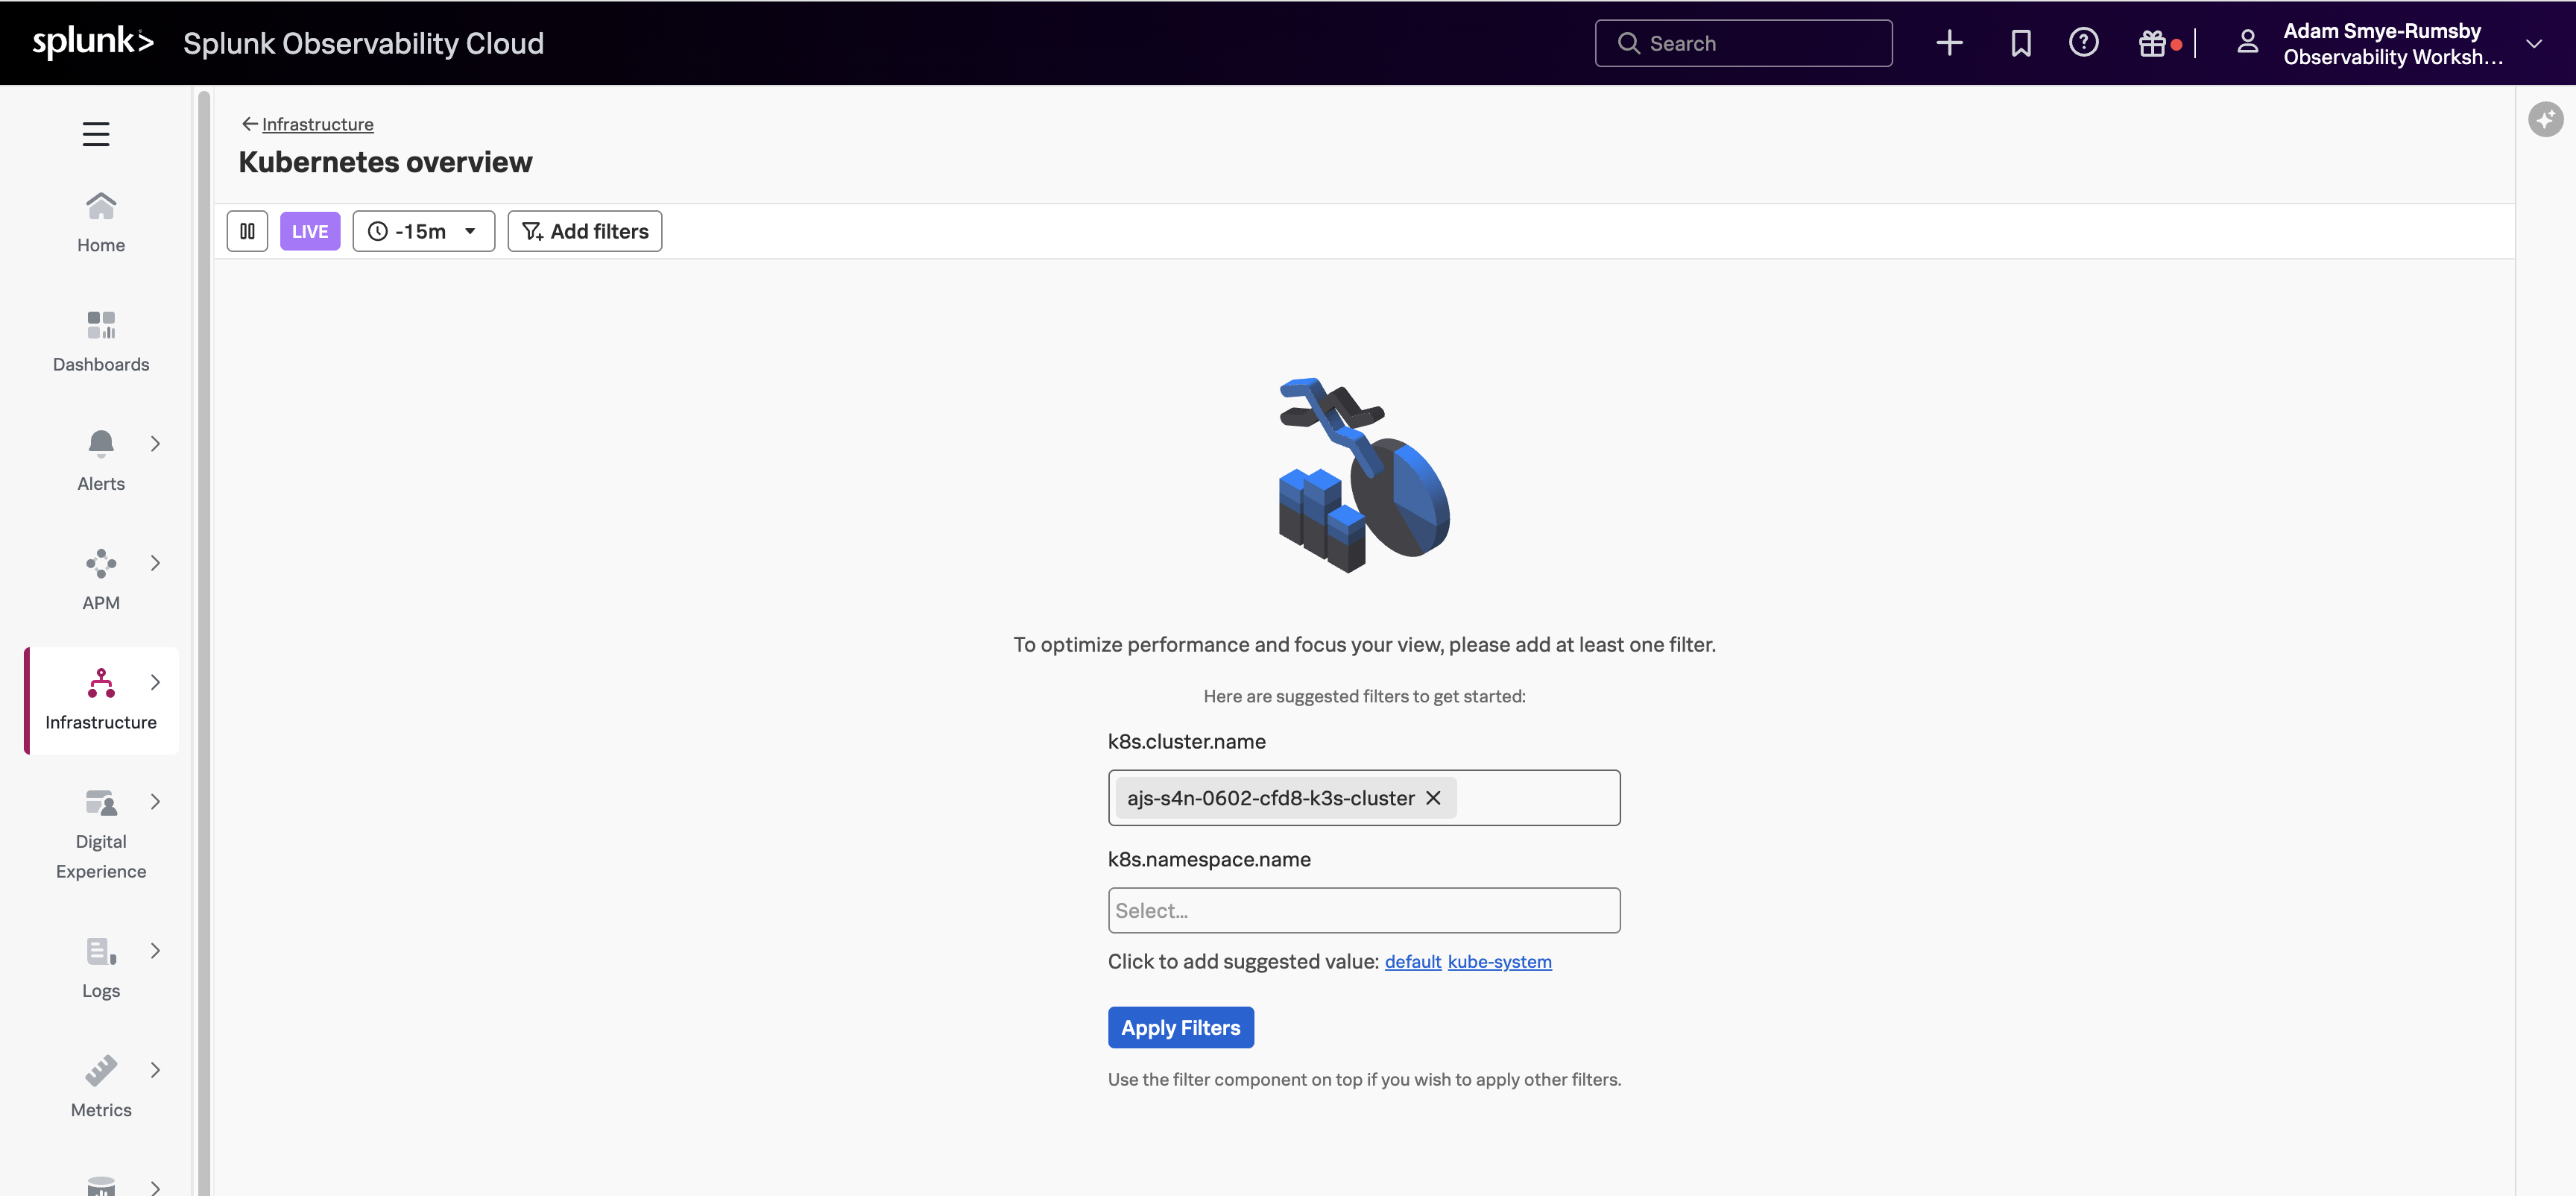
From the left-hand menu, click on Infrastructure and select Kubernetes overview. You will be prompted to apply at least one filter. Click inside the k8s.cluster.name field, then select <INSTANCE>-k3s-cluster (where<INSTANCE> is replaced with the value you noted down earlier). Click Apply Filters.
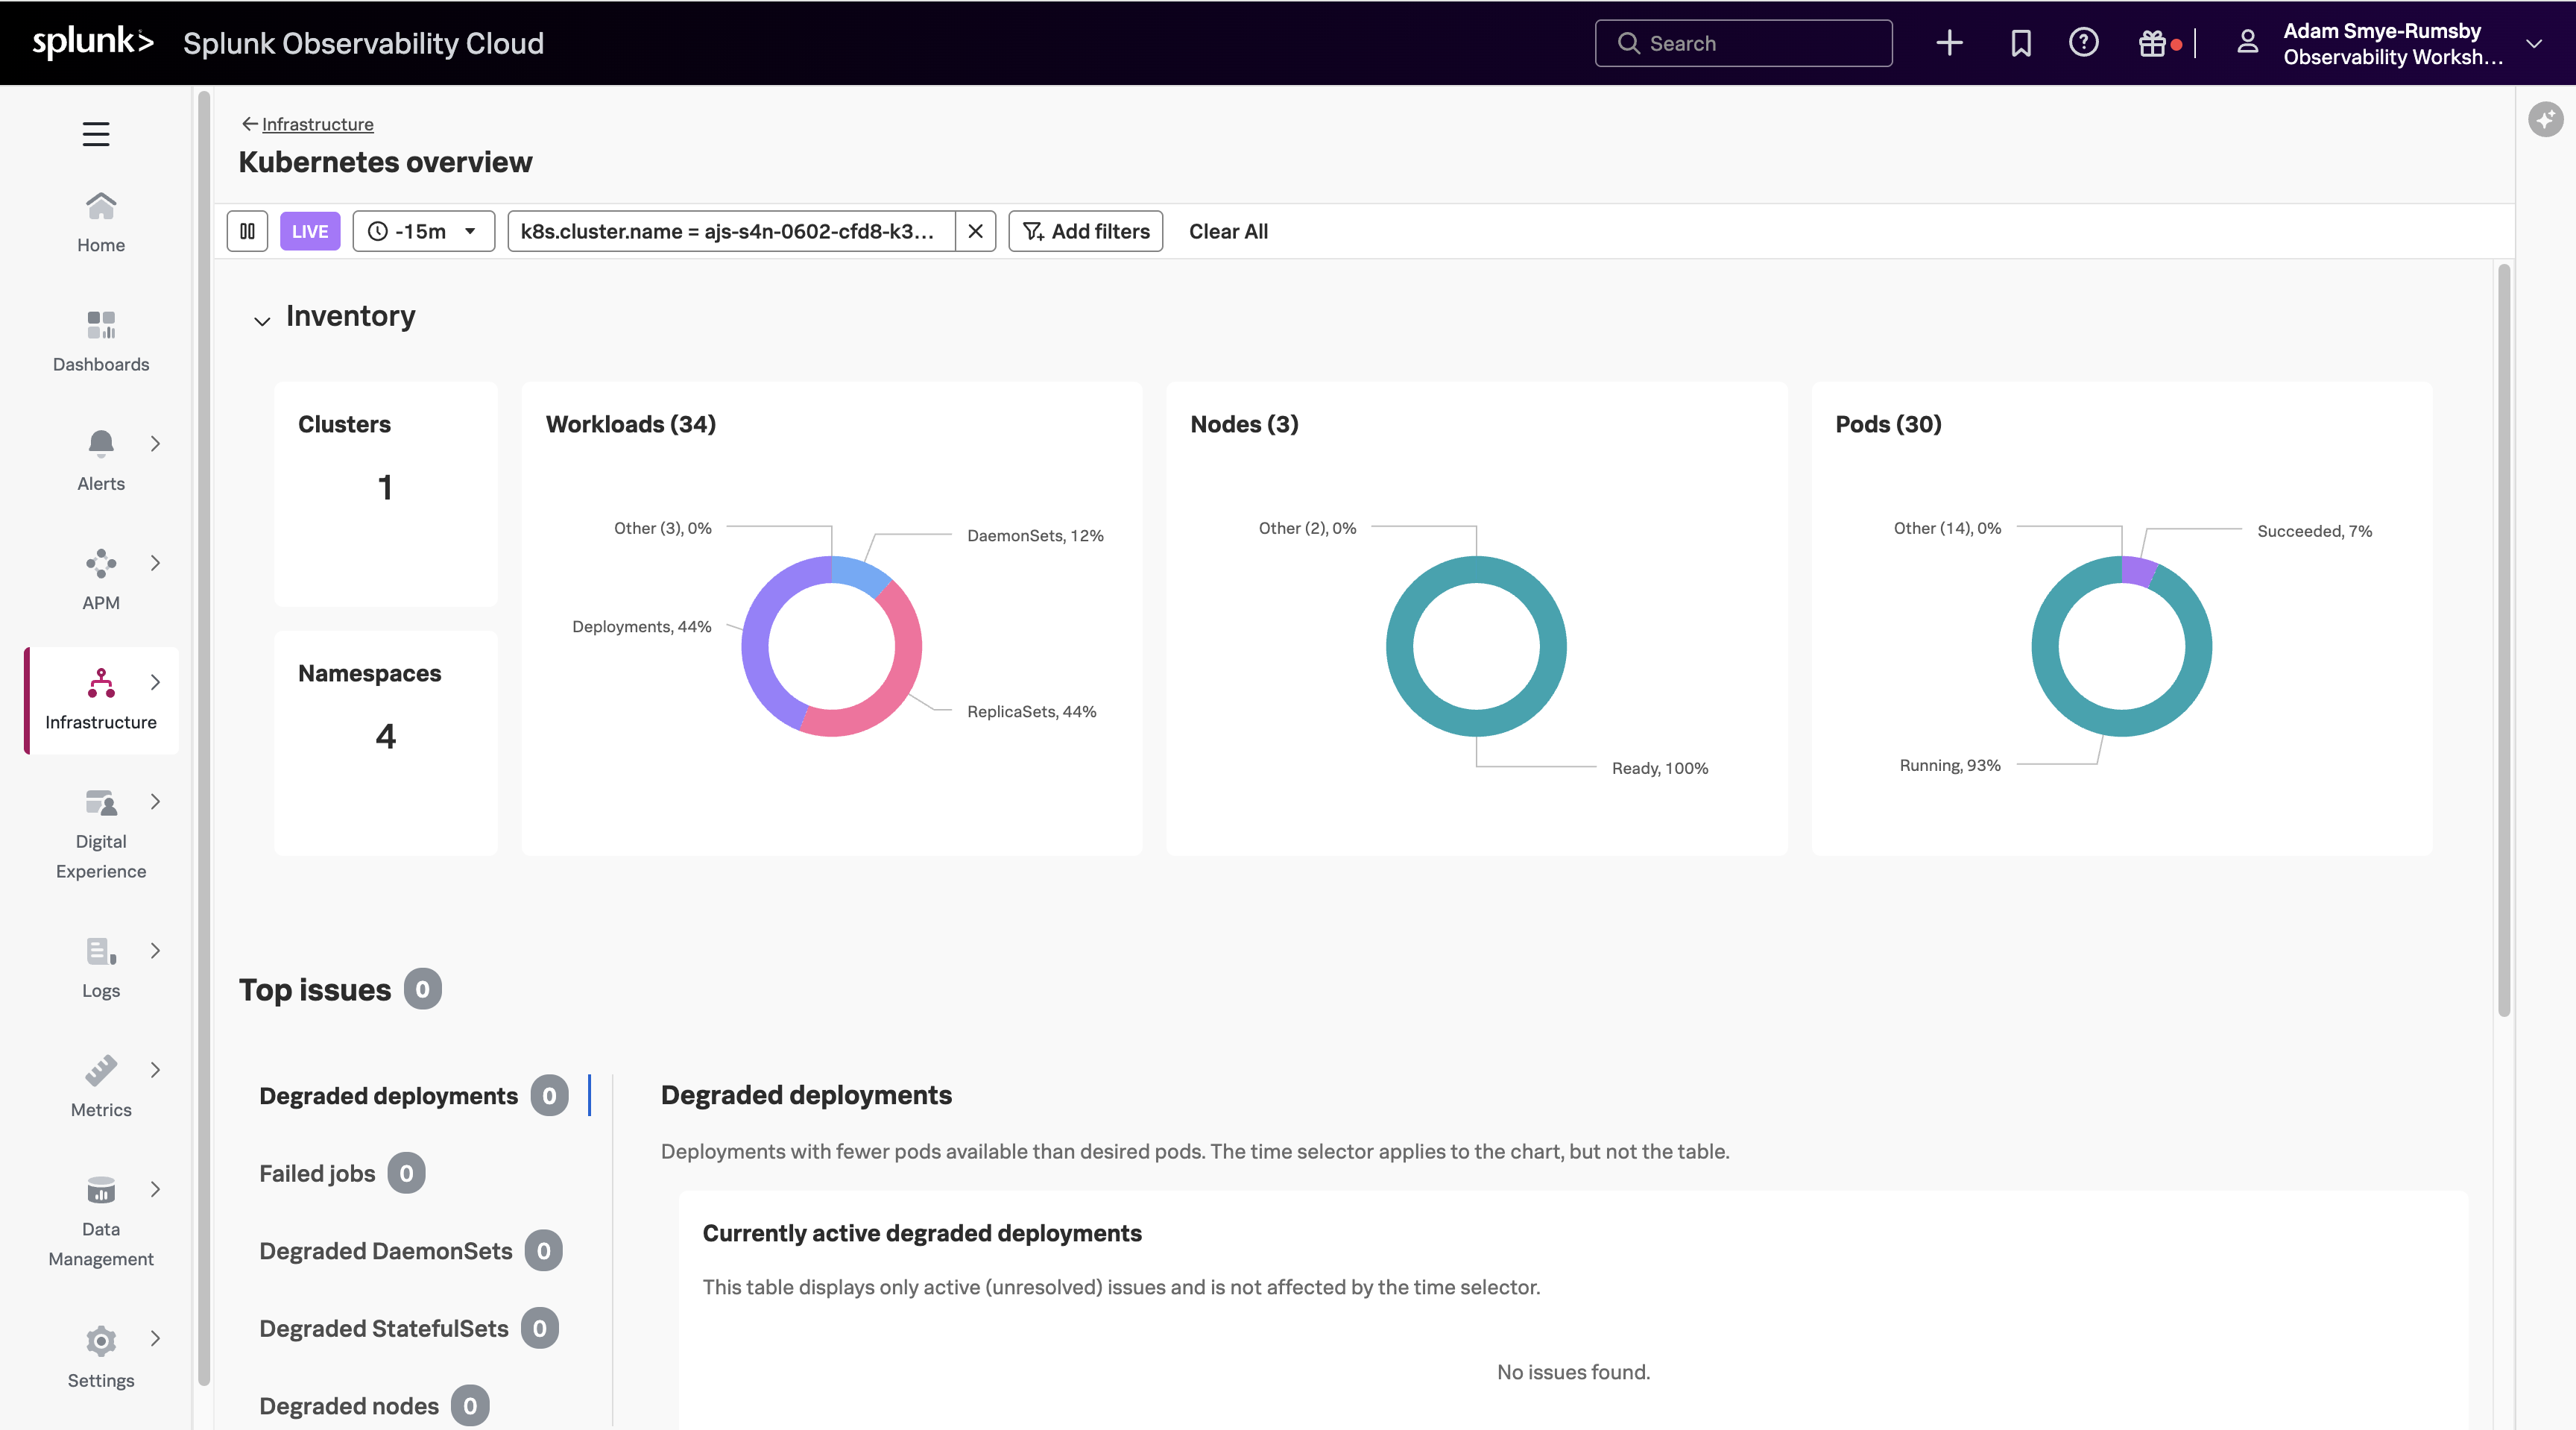
Once you are in the Kubernetes overview, select the Nodes (3) card title to list all the nodes in your cluster that are reporting metrics.
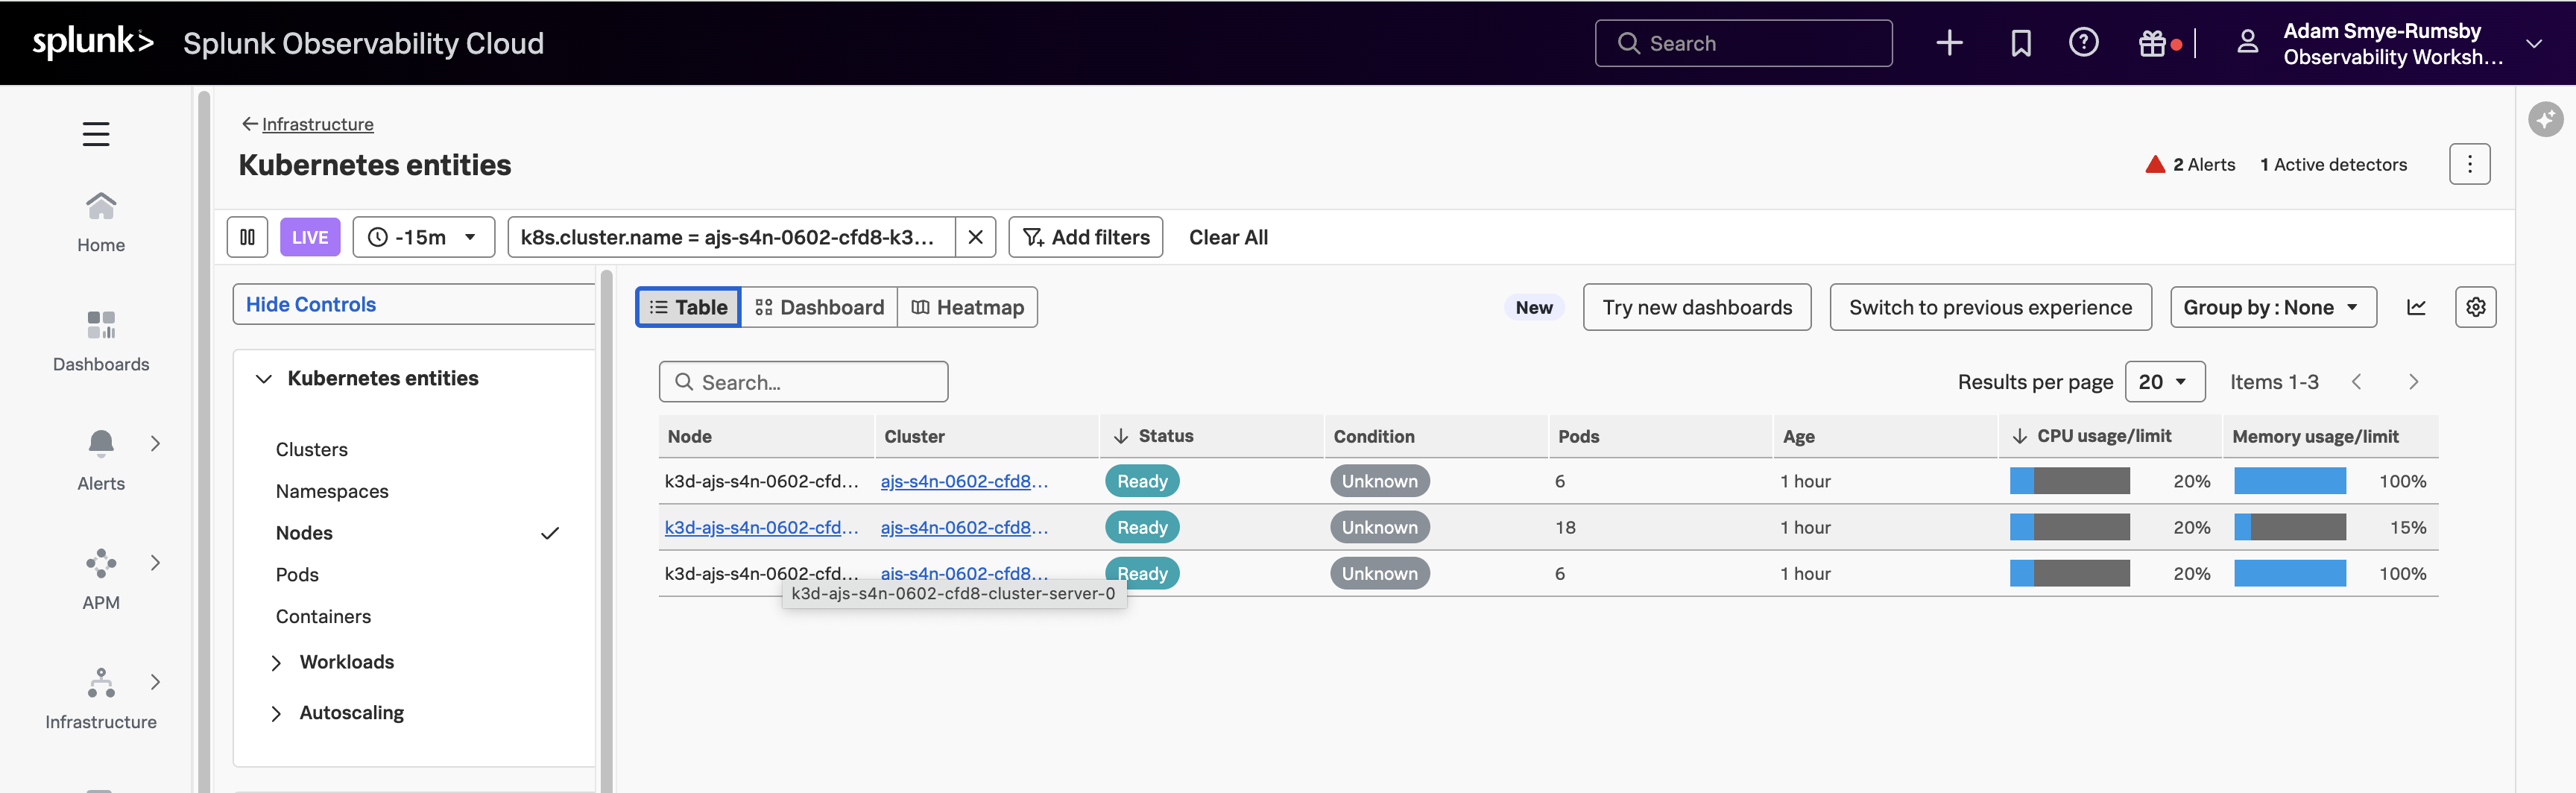
Next, in the Kubernetes entities panel, select the node that hosts the largest number of pods. It will be named k3d-<INSTANCE>-cluster-server-0 or similar.
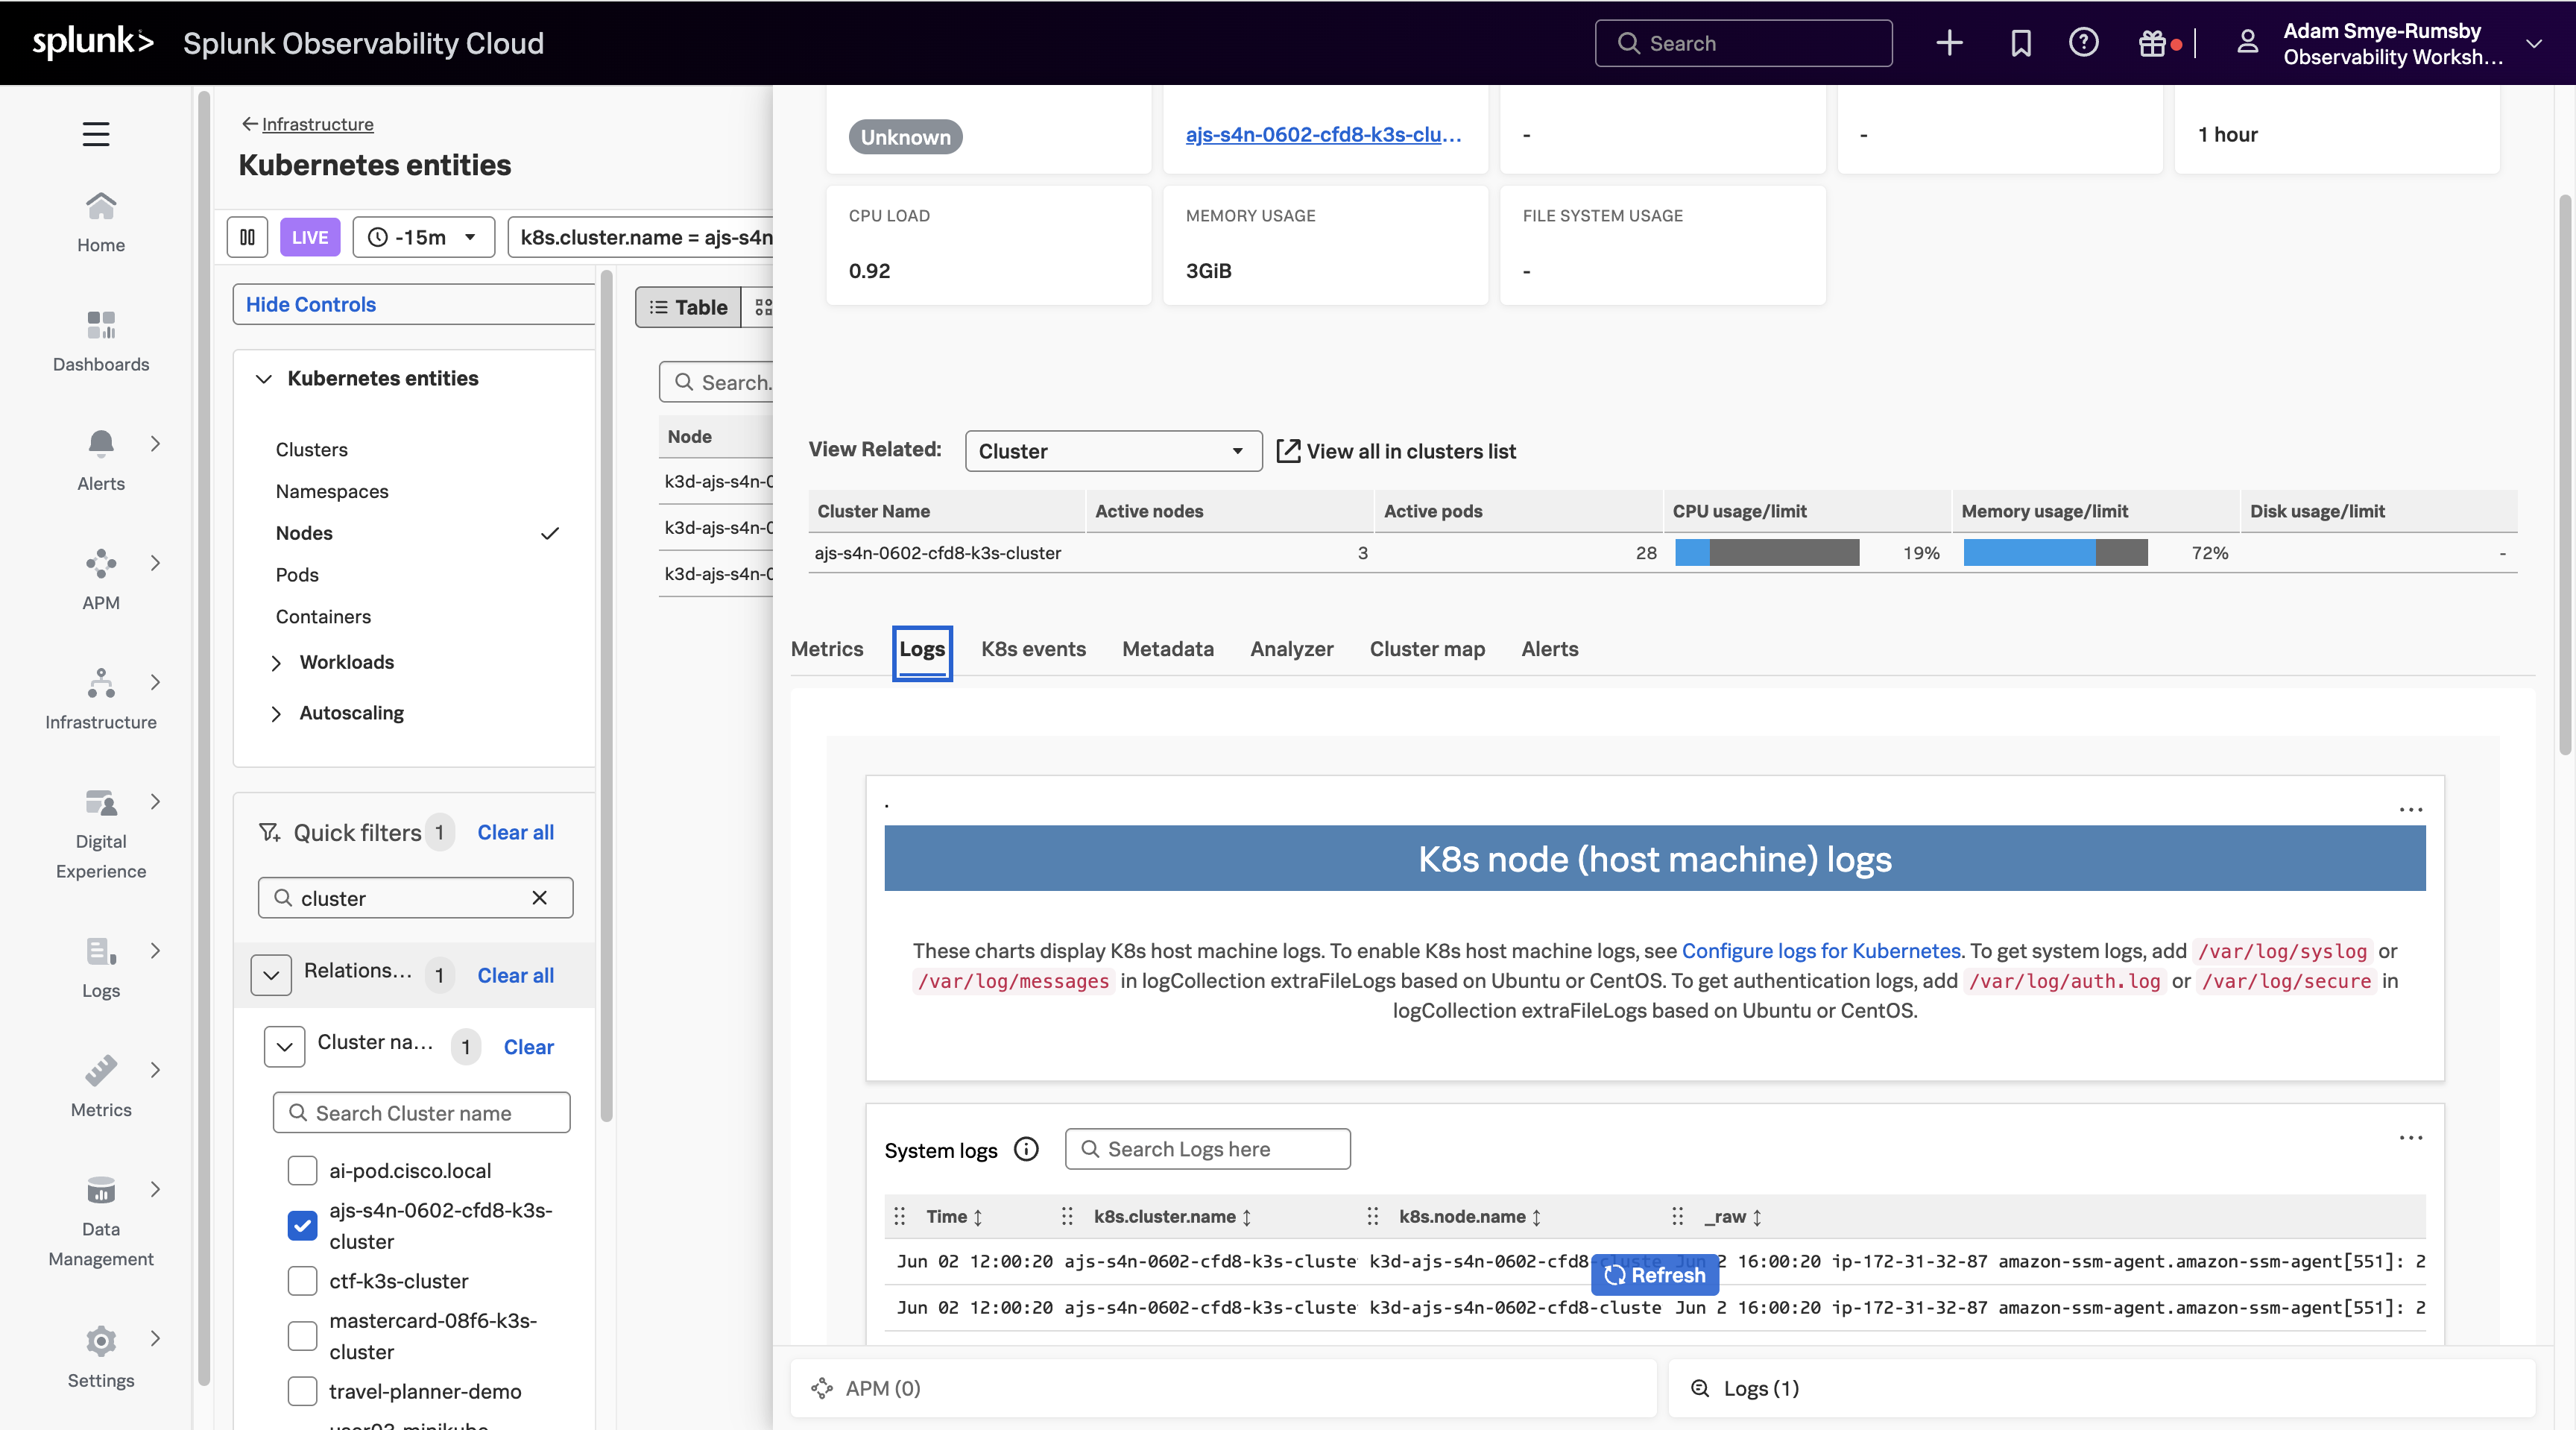
In the node panel, select the Logs tab to see the logs from the relevant node.