APM Features
APM Trace
To pick a trace, select a line in the Service Requests & Errors chart (1). A selection of related traces will appear.
Once you have the list of related traces, right-click on the blue (2) Trace ID Link and open the trace in a new browser tab, making sure the trace you select has the same three services mentioned in the Services Column.
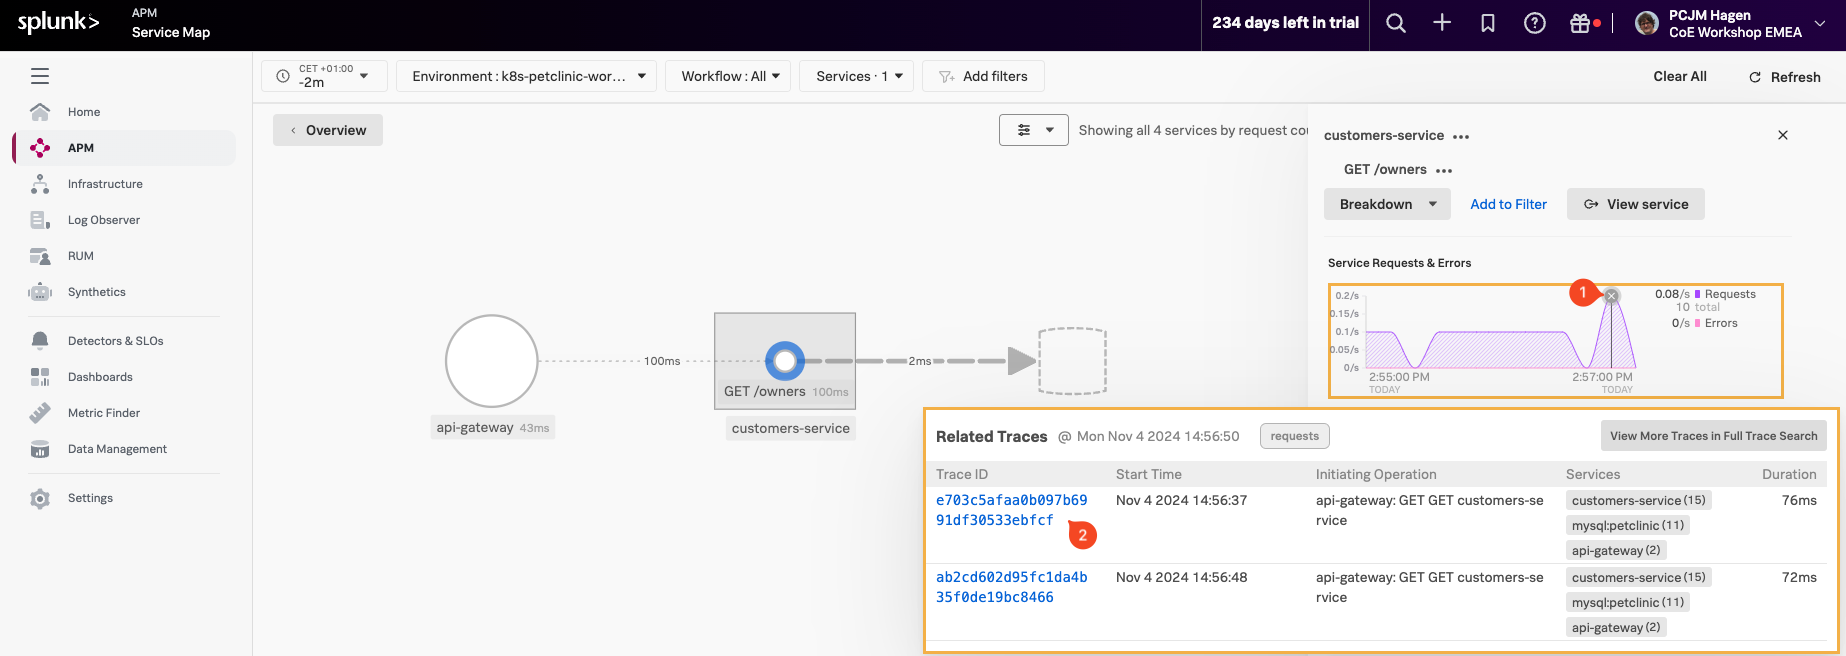
Note
Be sure to open the trace in a new browser tab, as we will refer back to the same trace in later sections. Opening the trace in a new tab will save time and streamline navigation later.
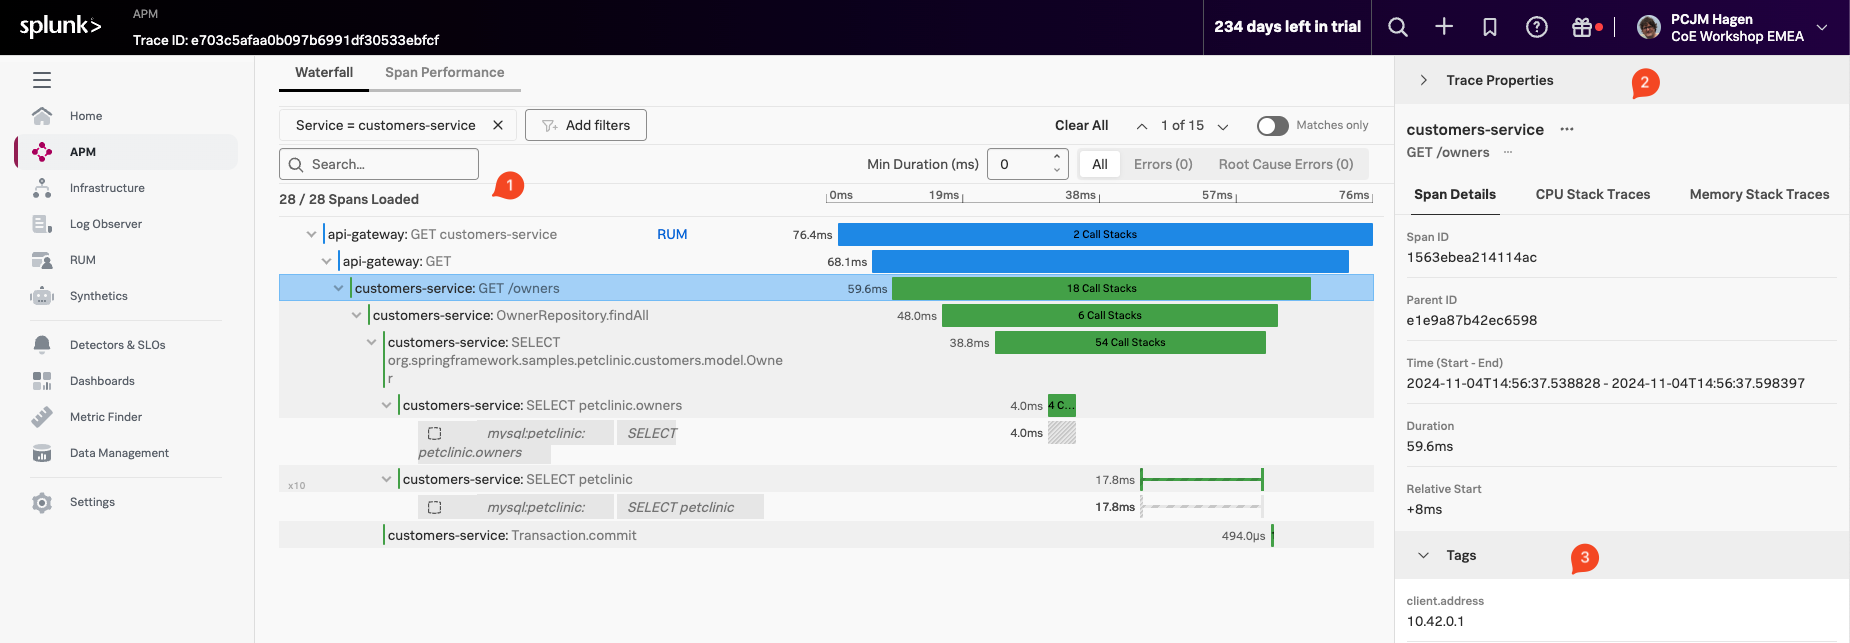
This brings us to the selected Trace in the Waterfall view:
Here we find several sections:
- The Waterfall Pane (1), where you see the trace and all the instrumented functions visible as spans, with their duration representation and order/relationship showing.
- The Trace Info Pane (2), which shows the selected Span information (highlighted with a box around the Span in the Waterfall Pane).
- The Span Pane (3) where you can find all the Tags that have been sent in the selected Span. You can scroll down to see all of them.
- The process Pane, with tags related to the process that created the Span (scroll down to see as it is not in the screenshot).
- The Trace Properties, located at the top right-hand side of the pane is collapsed by default.