Real User Monitoring
Select the RUM view for the Petclinic App
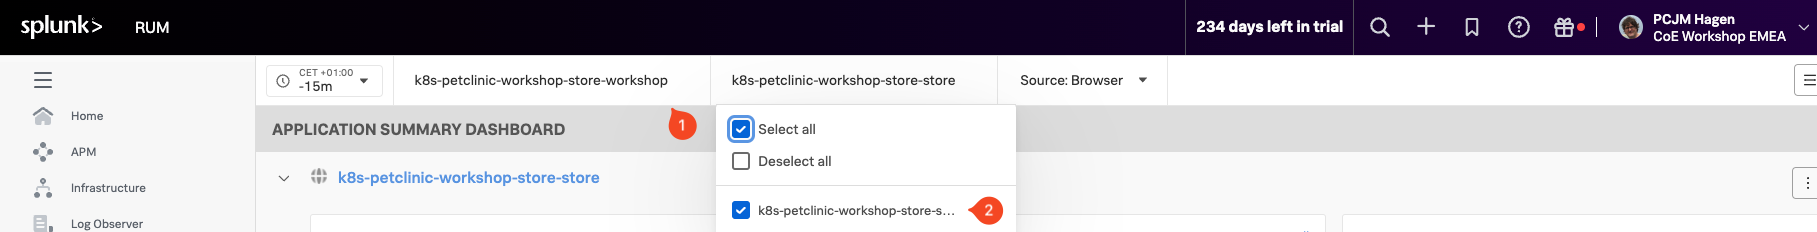
Let’s start with a quick, high level tour of RUM by clicking Digital Experience → Real user monitoring → Overview in the left-hand menu. Then change the Environment filter (1) to the name of your workshop instance from the dropdown box, selecting <INSTANCE>-workshop (1) (where INSTANCE is the value from the shell script you ran earlier). Make sure it is the only instance selected.
Then change the App (2) dropdown box to the name of your app, it will be <INSTANCE>-store
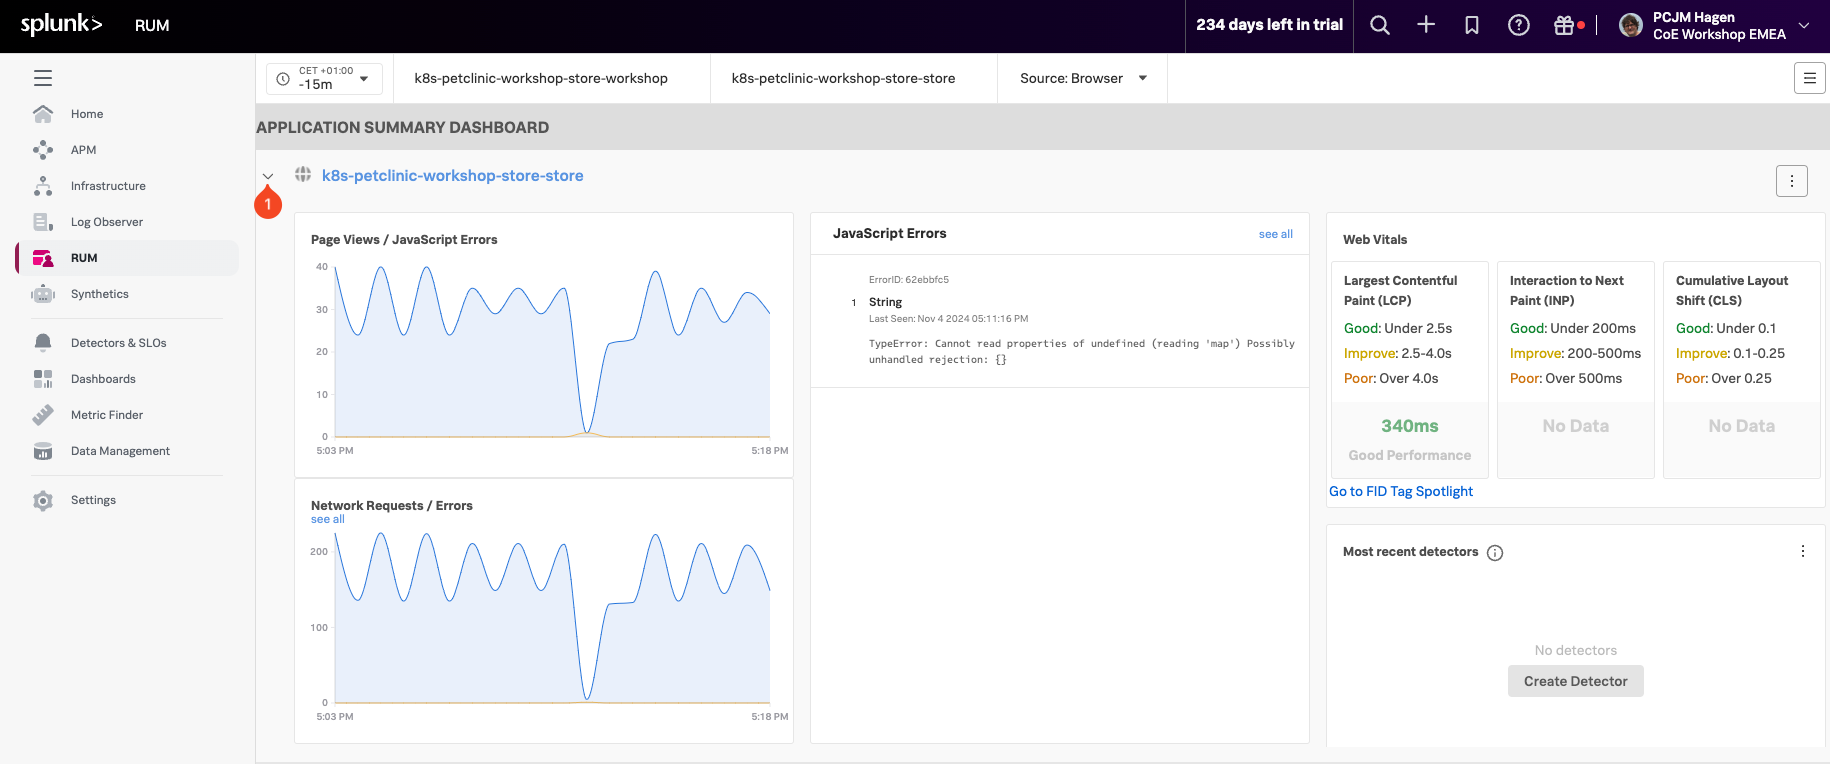
Once you have selected your Environment and App, you will see an overview page showing the RUM status of your Application. (If your Summary Dashboard is just a single row of numbers, you are looking at the condensed view. You can expand it by clicking on the > (1) in front of the Application name). If any JavaScript errors occurred, they will show up as shown below:
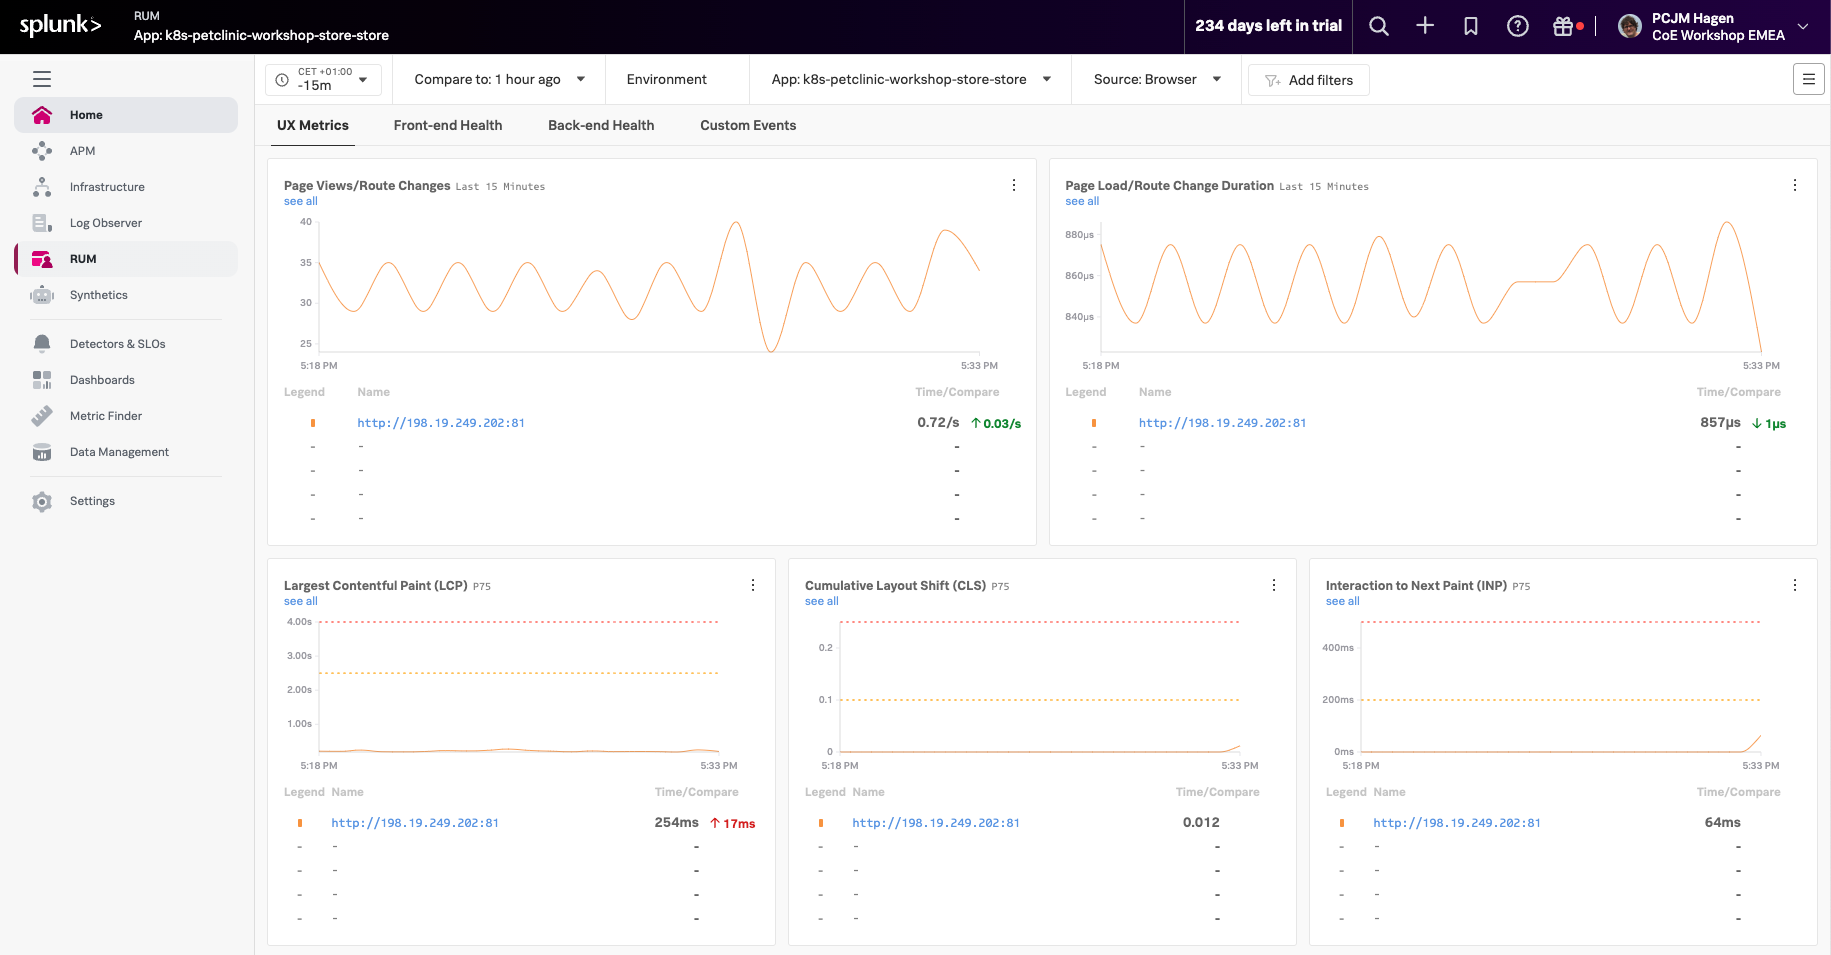
To continue, click on the blue link (with your workshop name) to get to the details page. This will bring up a new dashboard view breaking down the interactions by UX Metrics, Front-end Health, Back-end Health and Custom Workflows and comparing them to historic metrics.
This will bring us to the Tag Spotlight page.