Workshop
Deploy the OpenTelemetry Collector
In this section we’ll deploy the OpenTelemetry Collector in our OpenShift namespace, which gathers metrics, logs, and traces from the infrastructure and applications running in the cluster, and sends the resulting data to Splunk Observability Cloud.
Deploy the OpenTelemetry Collector #
Ensure Helm is installed #
Run the following command to confirm that Helm is installed:
helm versionversion.BuildInfo{Version:"v3.19.4", GitCommit:"7cfb6e486dac026202556836bb910c37d847793e", GitTreeState:"clean", GoVersion:"go1.24.11"}If it’s not installed, execute the following commands:
sudo apt-get install curl gpg apt-transport-https --yes
curl -fsSL https://packages.buildkite.com/helm-linux/helm-debian/gpgkey | gpg --dearmor | sudo tee /usr/share/keyrings/helm.gpg > /dev/null
echo "deb [signed-by=/usr/share/keyrings/helm.gpg] https://packages.buildkite.com/helm-linux/helm-debian/any/ any main" | sudo tee /etc/apt/sources.list.d/helm-stable-debian.list
sudo apt-get update
sudo apt-get install helm
Add the Splunk OpenTelemetry Collector Helm Chart #
Add the Splunk OpenTelemetry Collector for Kubernetes’ Helm chart repository:
helm repo add splunk-otel-collector-chart https://signalfx.github.io/splunk-otel-collector-chartEnsure the repository is up-to-date:
helm repo updateConfigure Environment Variables #
Set environment variables to configure the Splunk environment you’d like the collector to send data to:
export USER_NAME=workshop-participant-$PARTICIPANT_NUMBER
export CLUSTER_NAME=ai-pod-$USER_NAME
export ENVIRONMENT_NAME=ai-pod-$USER_NAME
export SPLUNK_INDEX=splunk4rookies-workshop
Confirm that the environment name is set:
echo $ENVIRONMENT_NAMEai-pod-workshop-participant-1Deploy the Collector #
Navigate to the workshop directory:
cd ~/workshop/cisco-ai-podsThen install the collector in your namespace using the following command:
{ [ -z "$CLUSTER_NAME" ] || \
  [ -z "$ENVIRONMENT_NAME" ] || \
  [ -z "$USER_NAME" ]; } && \
  echo "Error: Missing variables" || \
  helm upgrade --install splunk-otel-collector \
  --set="clusterName=$CLUSTER_NAME" \
  --set="environment=$ENVIRONMENT_NAME" \
  --set="splunkObservability.accessToken=$ACCESS_TOKEN" \
  --set="splunkObservability.realm=$REALM" \
  --set="splunkPlatform.endpoint=$HEC_URL" \
  --set="splunkPlatform.token=$HEC_TOKEN" \
  --set="splunkPlatform.index=$SPLUNK_INDEX" \
  -f ./otel-collector/otel-collector-values.yaml \
  -n $USER_NAME \
  splunk-otel-collector-chart/splunk-otel-collector
Note: if you get an error that says
Missing variables, you’ll need to define your environment variables again. Add your participant number before running the following commands:bashexport PARTICIPANT_NUMBER=<your participant number> export USER_NAME=workshop-participant-$PARTICIPANT_NUMBER export CLUSTER_NAME=ai-pod-$USER_NAME export ENVIRONMENT_NAME=ai-pod-$USER_NAME export SPLUNK_INDEX=splunk4rookies-workshop
Run the following command to confirm that the collector pods are running:
watch -n 1 oc get pods

NAME                                                          READY   STATUS    RESTARTS   AGE
splunk-otel-collector-agent-58rwm                             1/1     Running   0          6m40s
splunk-otel-collector-agent-8dndr                             1/1     Running   0          6m40s
Note: in OpenShift environments, the collector takes about three minutes to start and transition to the
Runningstate.
Review Collector Data in Splunk Observability Cloud #
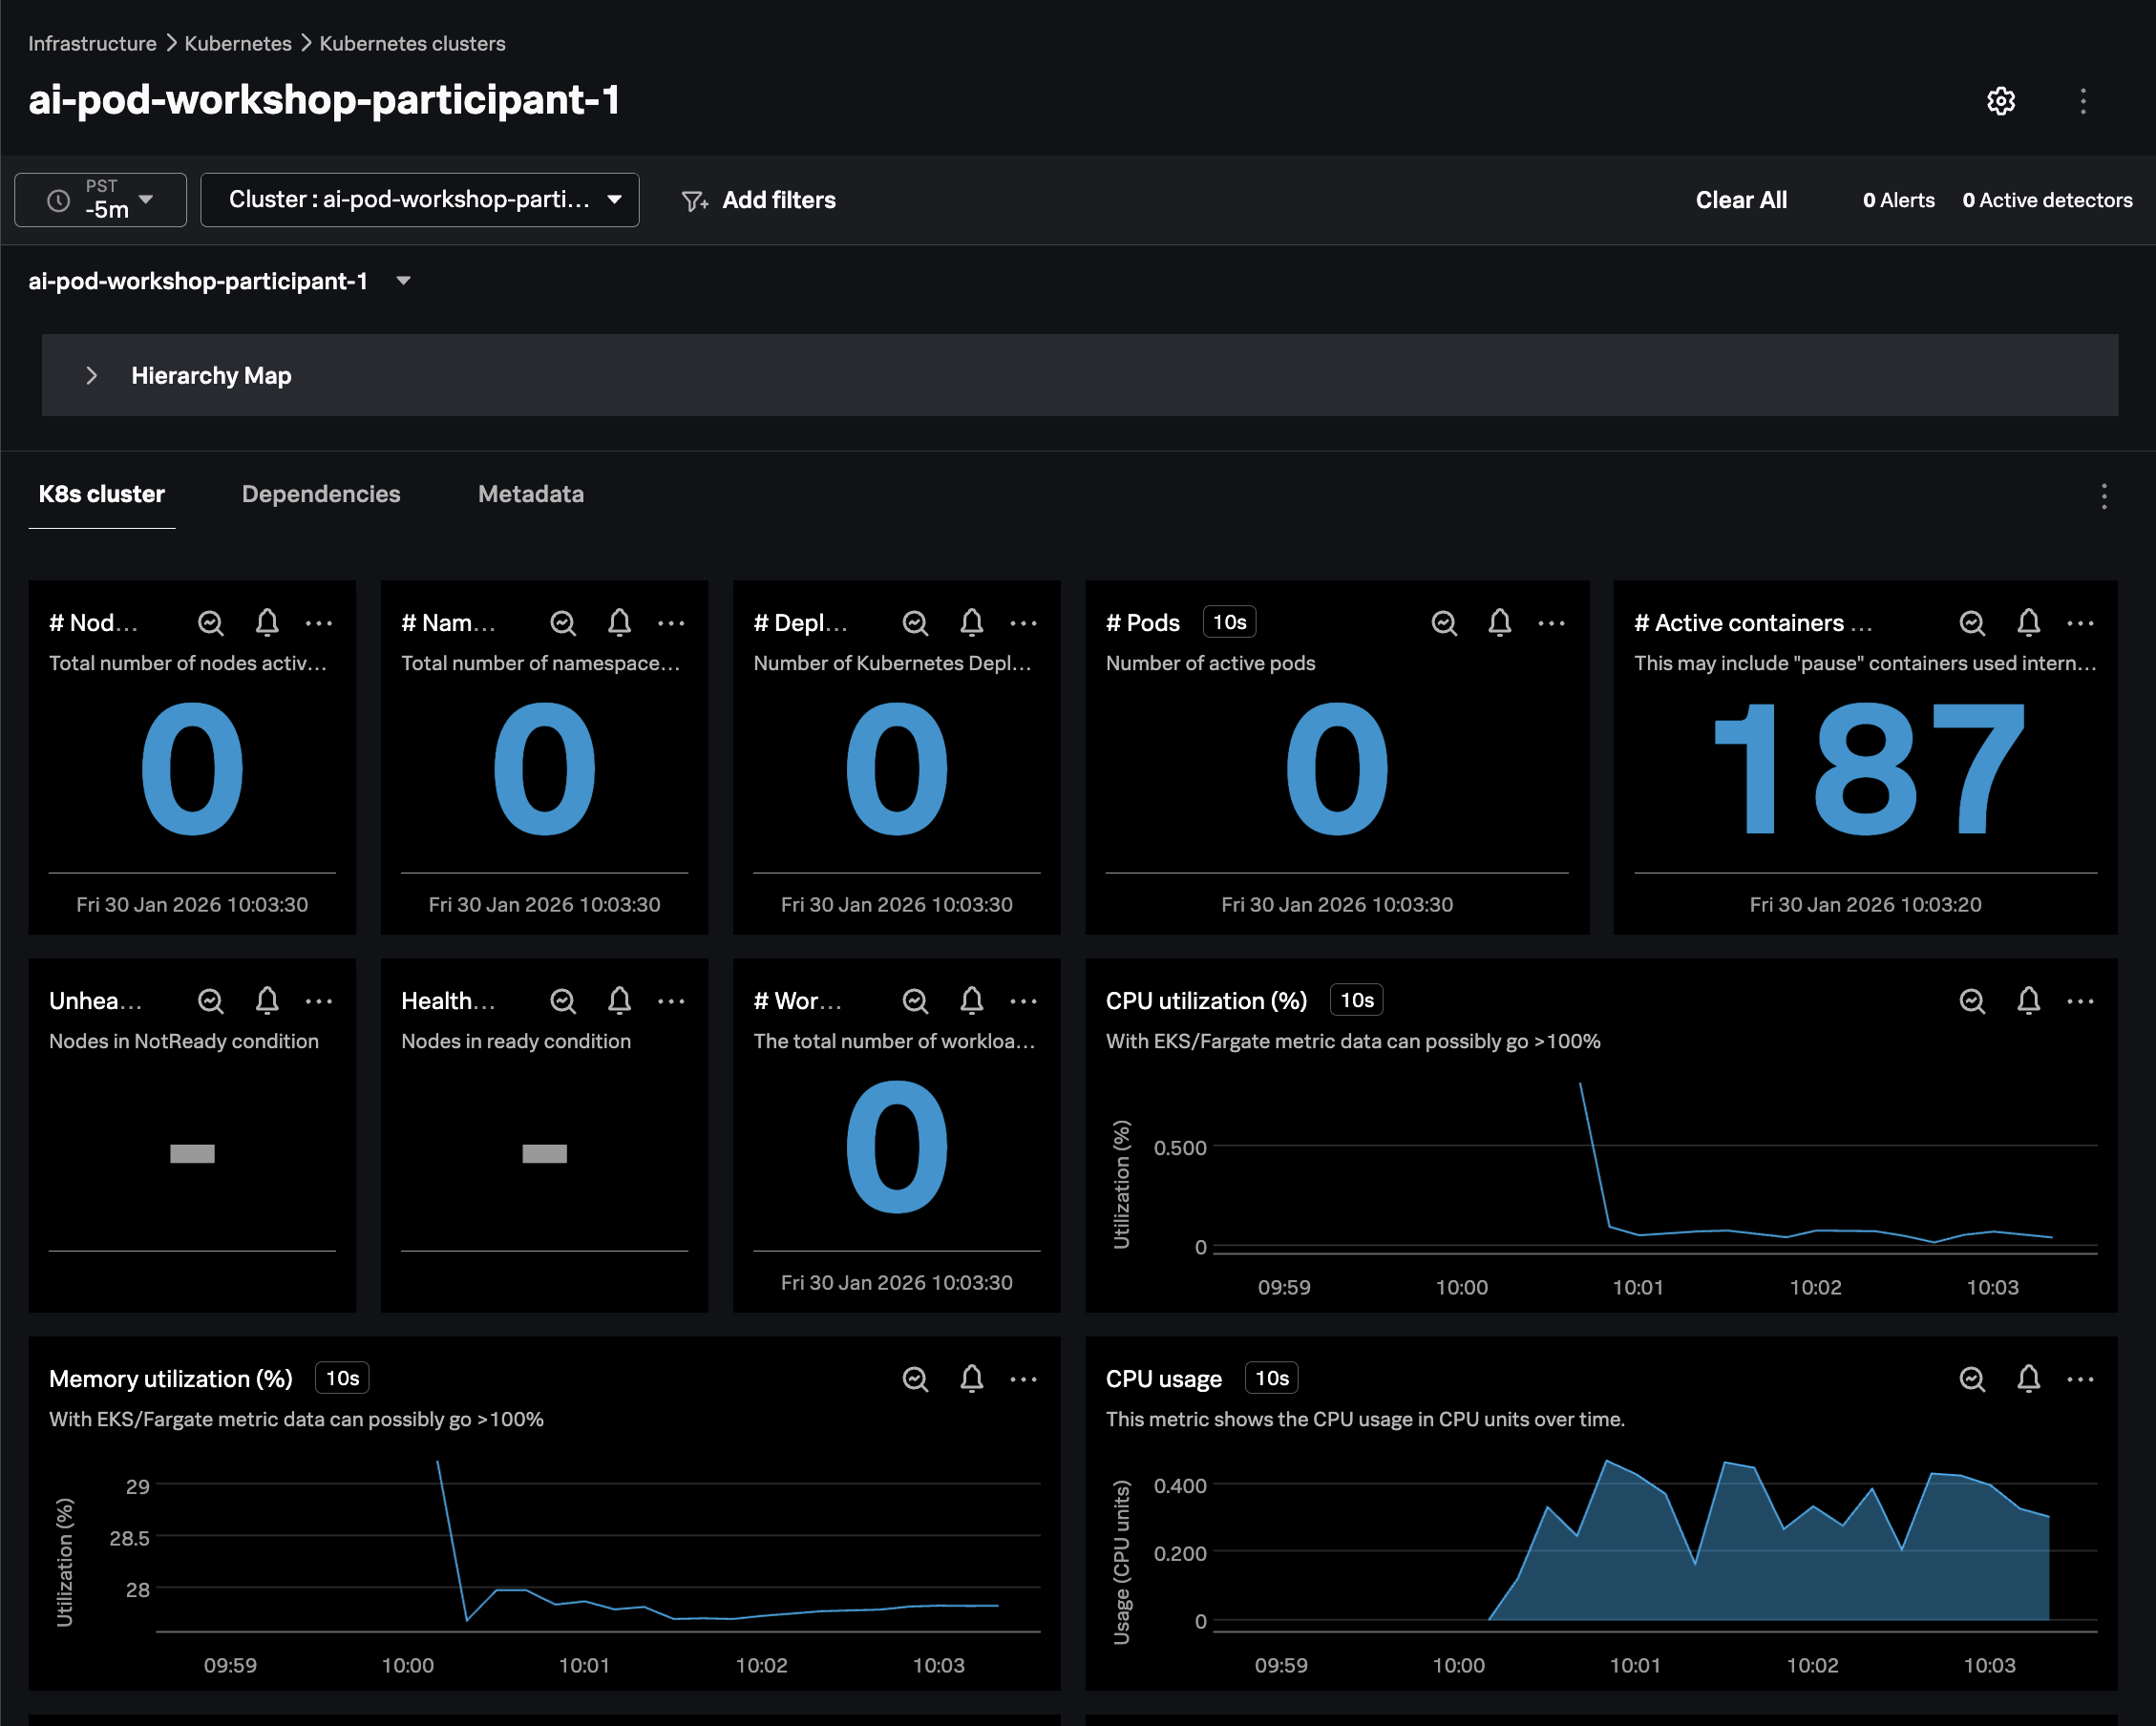
Confirm that you can see your cluster in Splunk Observability Cloud by navigating to
Infrastructure Monitoring -> Kubernetes -> Kubernetes Clusters and then
adding a filter on k8s.cluster.name with your cluster name (i.e. ai-pod-workshop-participant-1):