Workshop
Review AI POD Dashboards
In this section, we’ll review the AI POD dashboards in Splunk Observability Cloud to confirm that the data from NVIDIA, Pure Storage, and Weaviate is captured as expected.
Update the OpenTelemetry Collector Config #
We can apply the collector configuration changes by running the following Helm command:
{ [ -z "$CLUSTER_NAME" ] || \
  [ -z "$ENVIRONMENT_NAME" ] || \
  [ -z "$USER_NAME" ]; } && \
  echo "Error: Missing variables" || \
  helm upgrade splunk-otel-collector \
  --set="clusterName=$CLUSTER_NAME" \
  --set="environment=$ENVIRONMENT_NAME" \
  --set="splunkObservability.accessToken=$ACCESS_TOKEN" \
  --set="splunkObservability.realm=$REALM" \
  --set="splunkPlatform.endpoint=$HEC_URL" \
  --set="splunkPlatform.token=$HEC_TOKEN" \
  --set="splunkPlatform.index=$SPLUNK_INDEX" \
  -f ./otel-collector-values.yaml \
  -n $USER_NAME \
  splunk-otel-collector-chart/splunk-otel-collector
Note: if you get an error that says
Missing variables, you’ll need to define your environment variables again. Add your participant number before running the following commands:bashexport PARTICIPANT_NUMBER=<your participant number> export USER_NAME=workshop-participant-$PARTICIPANT_NUMBER export CLUSTER_NAME=ai-pod-$USER_NAME export ENVIRONMENT_NAME=ai-pod-$USER_NAME export SPLUNK_INDEX=splunk4rookies-workshop
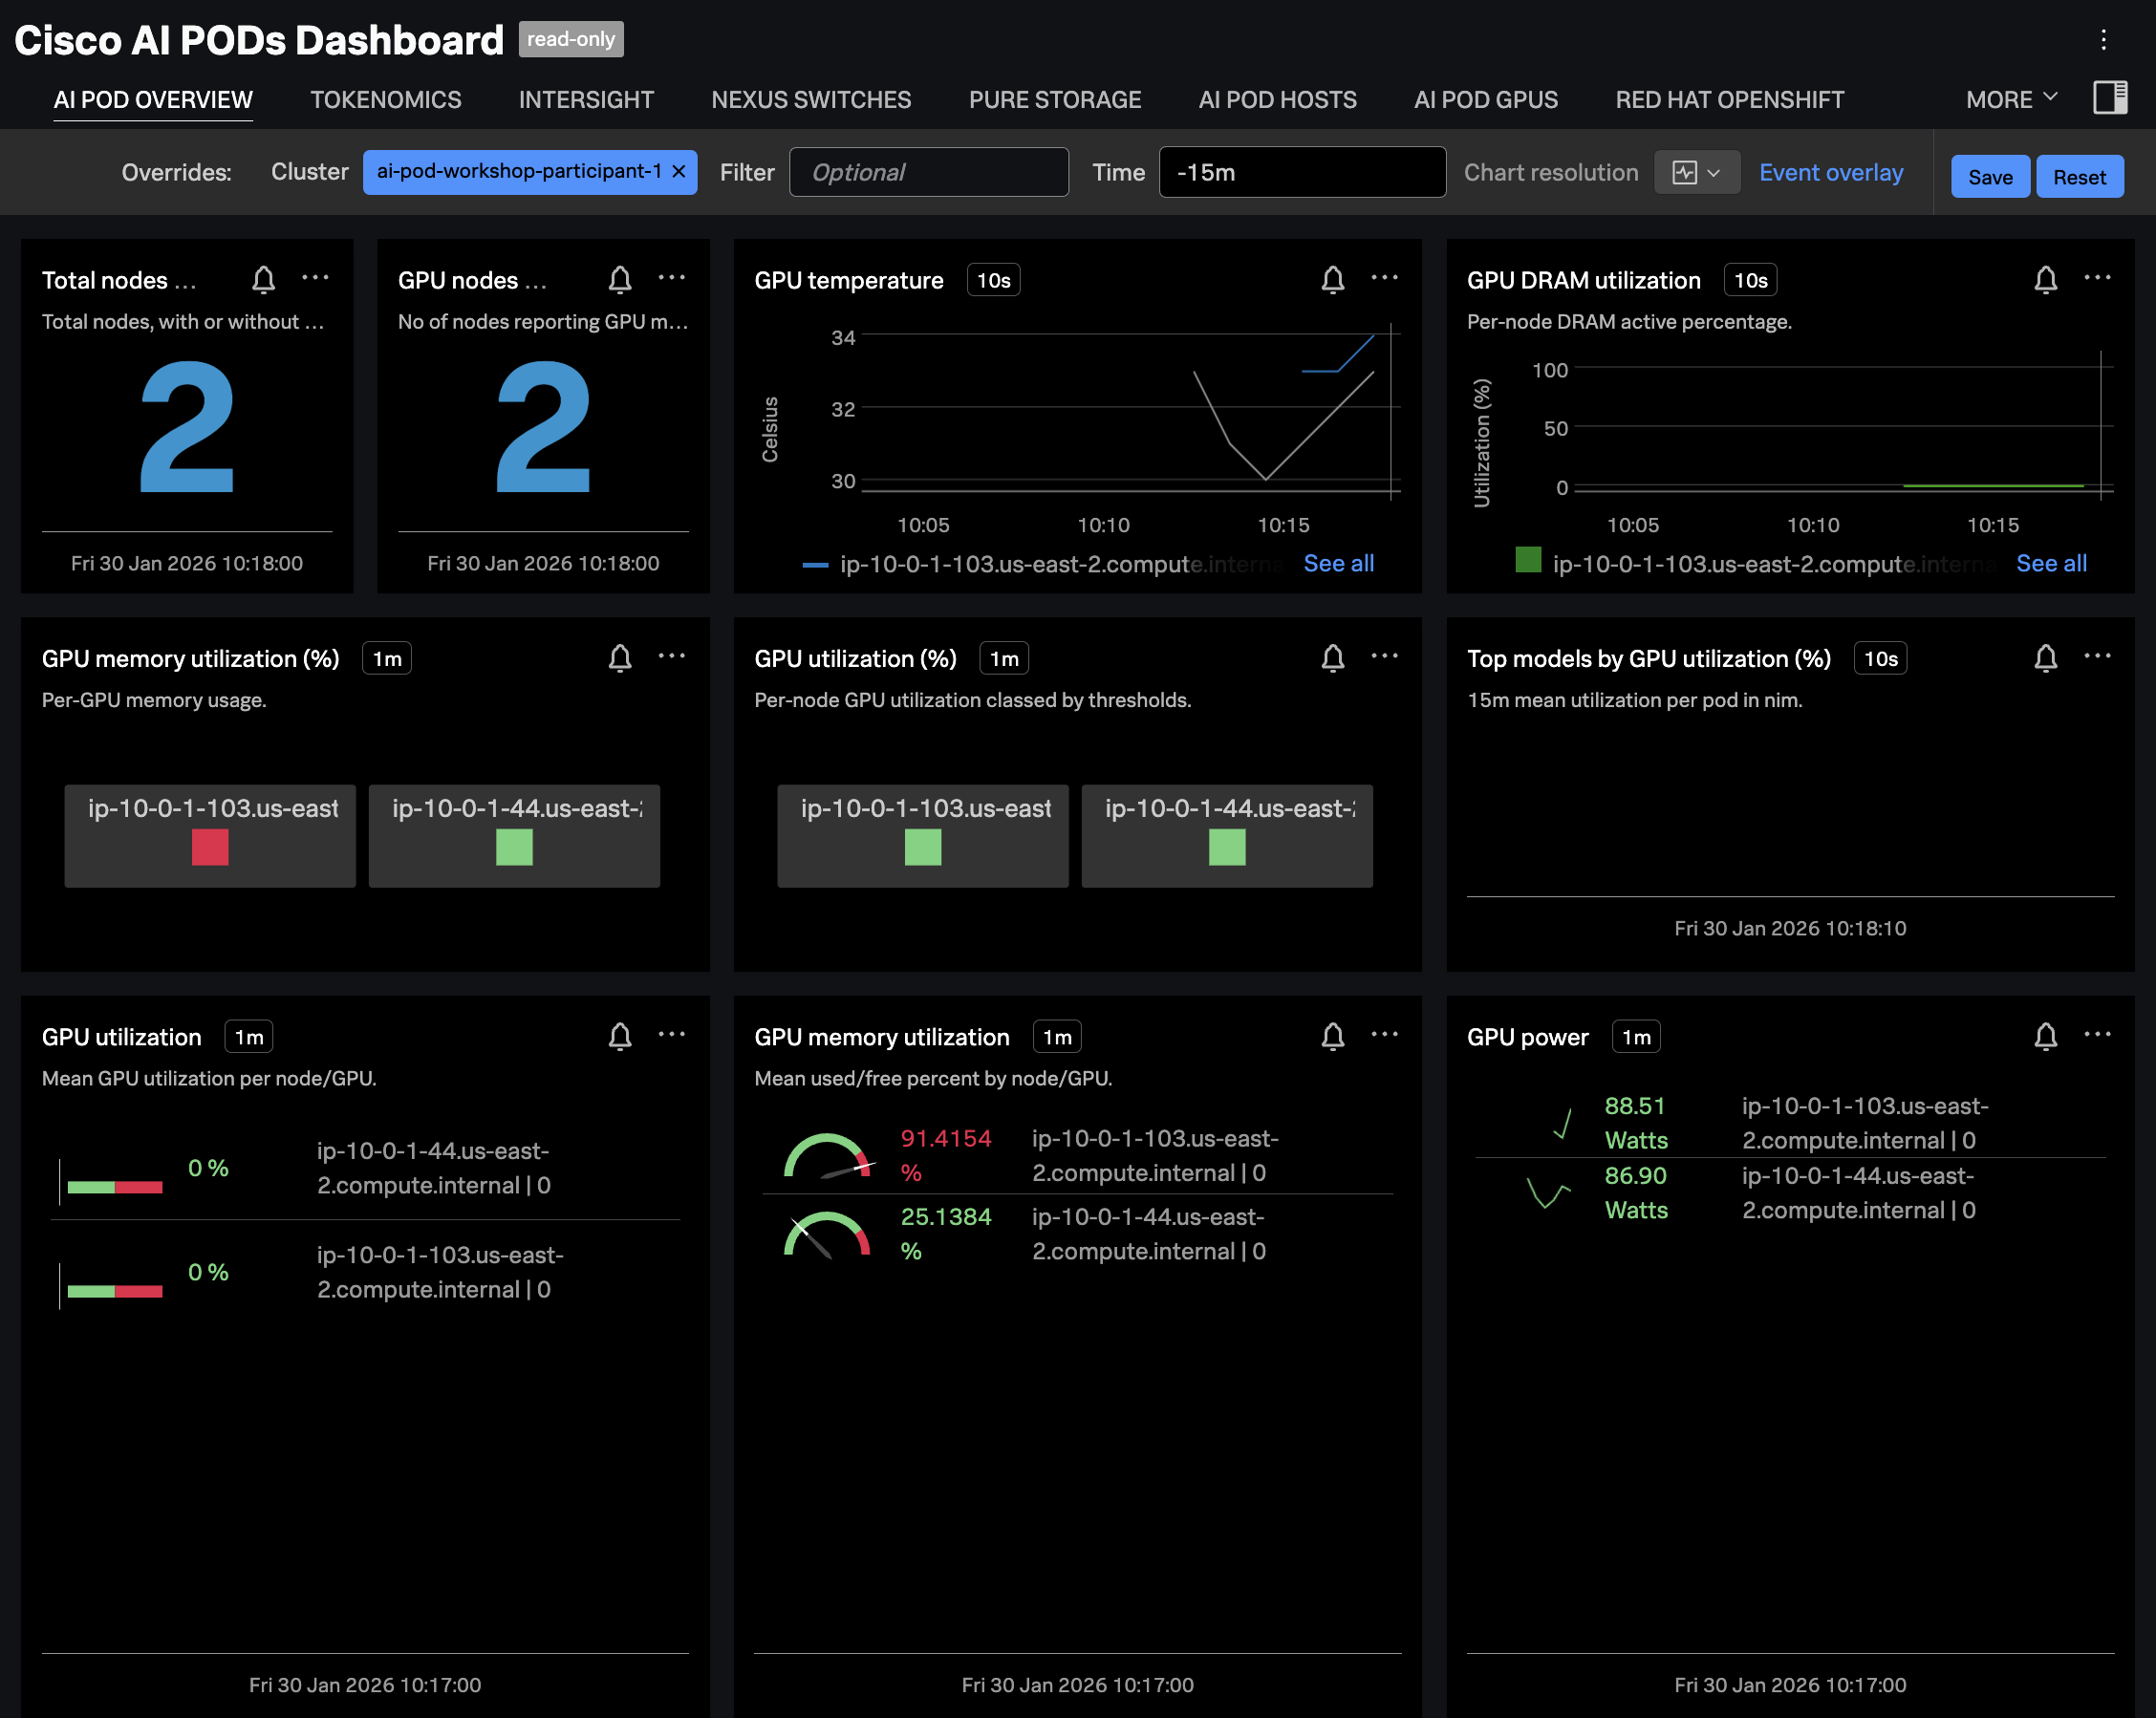
Review the AI POD Overview Dashboard Tab #
Navigate to Dashboards in Splunk Observability Cloud, then search for the
Cisco AI PODs Dashboard, which is included in the Built-in dashboard groups.
Ensure the dashboard is filtered on your OpenShift cluster name.
The charts should be populated as in the following example:
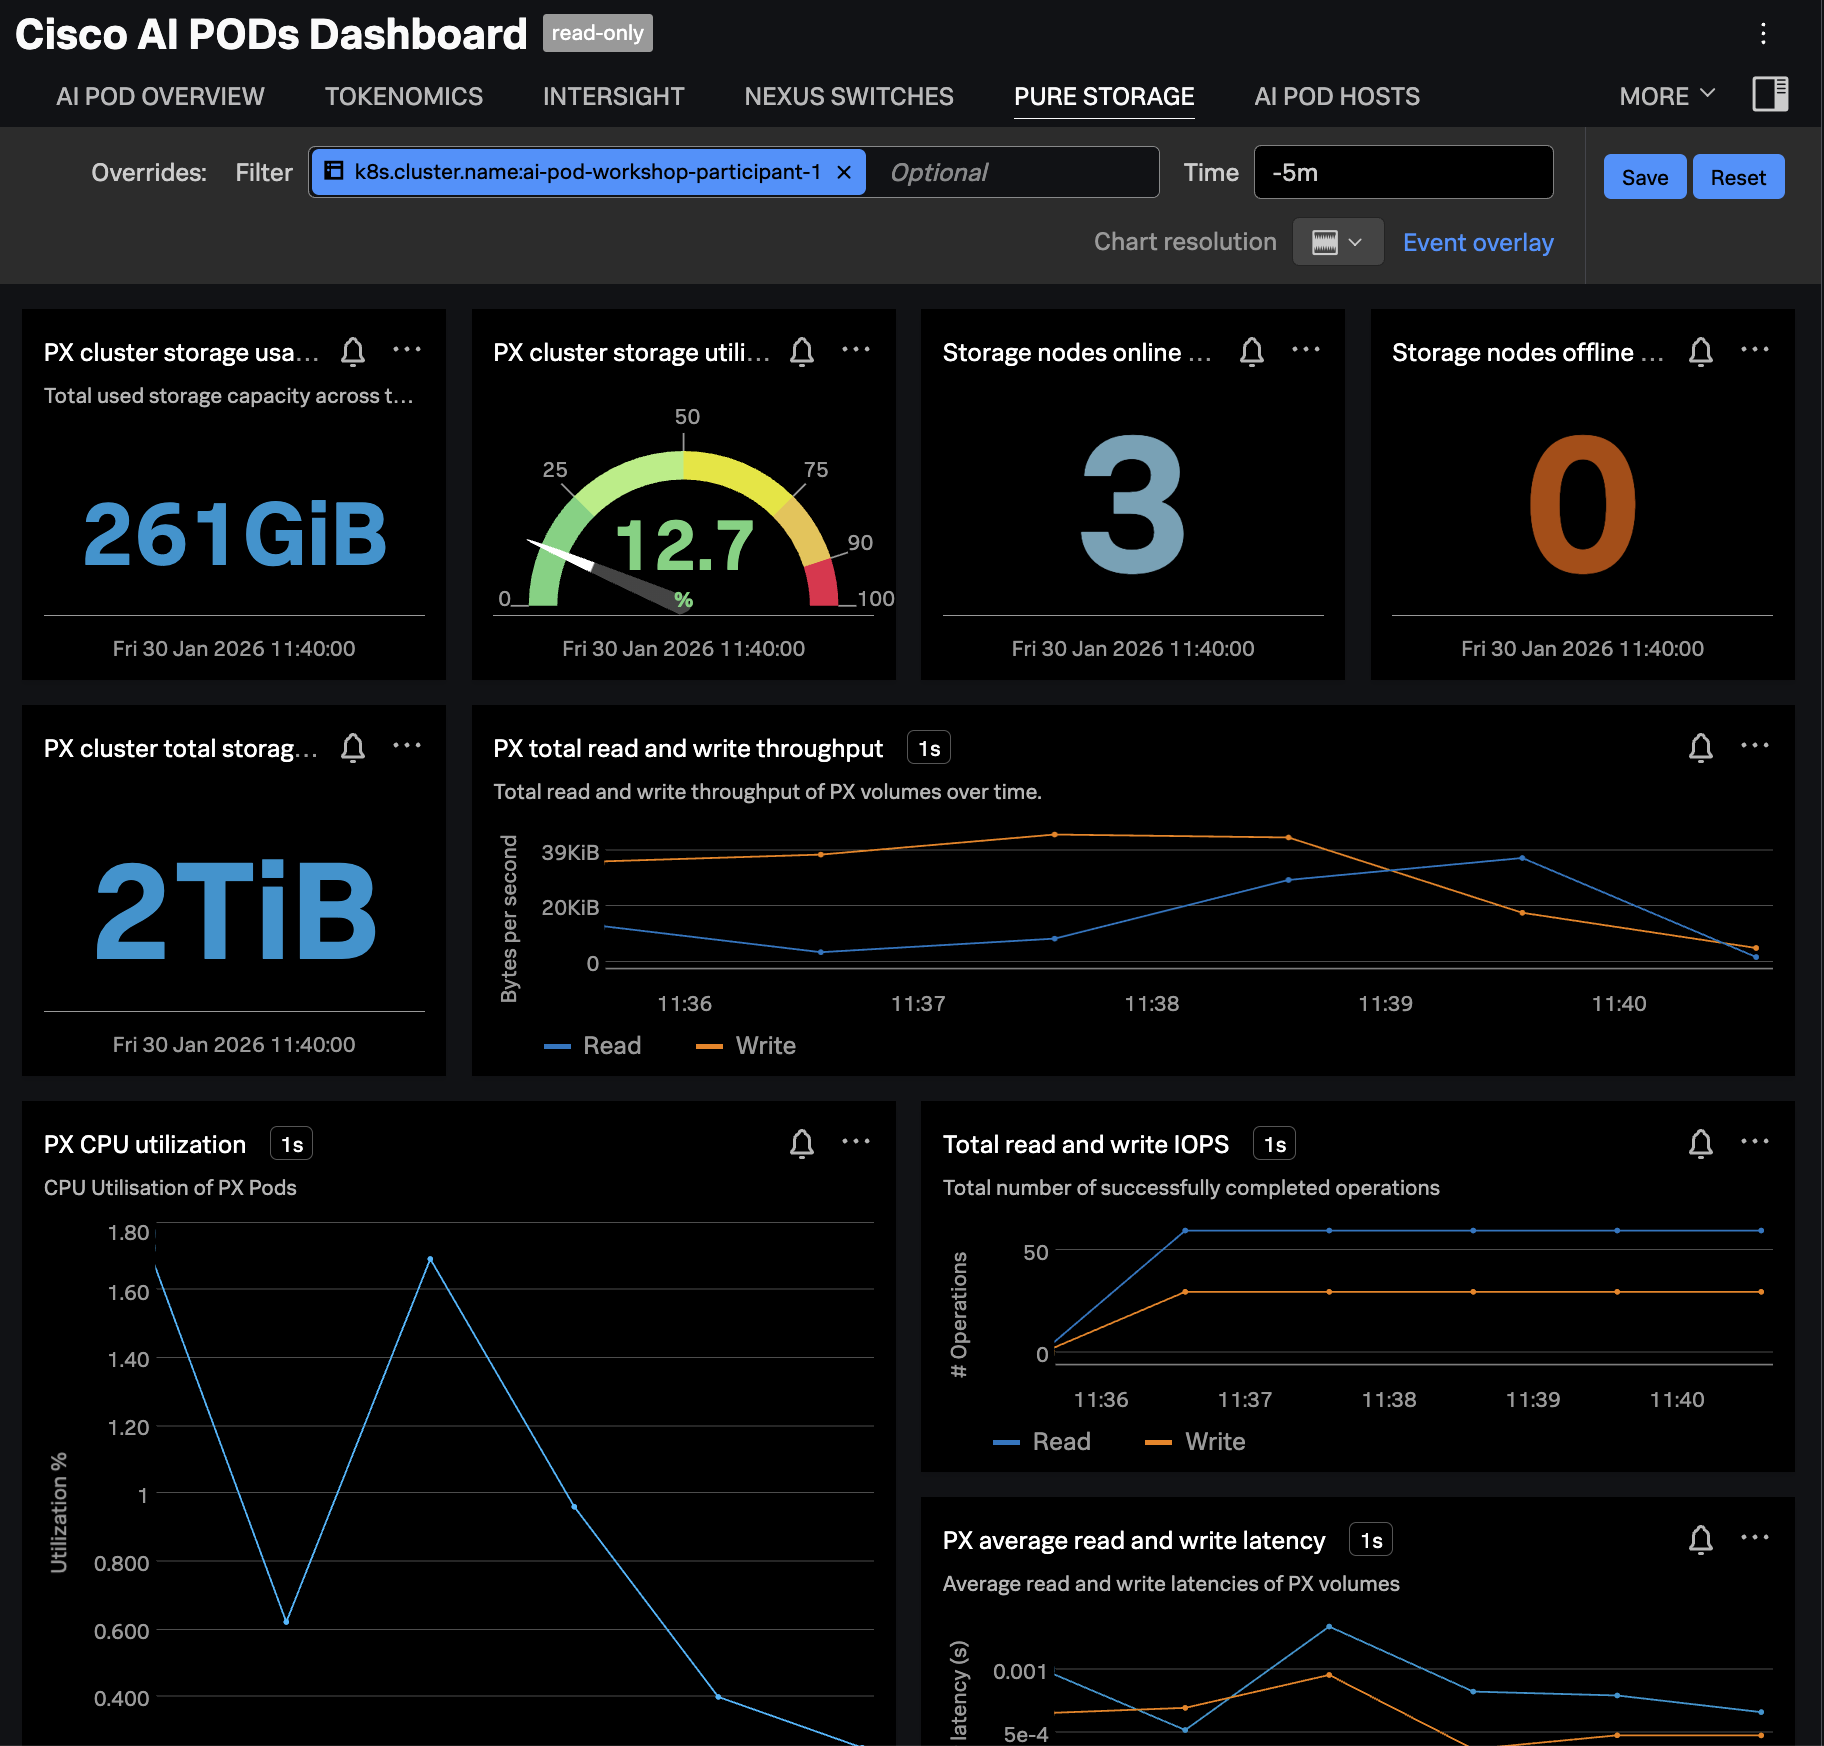
Review the Pure Storage Dashboard Tab #
Navigate to the PURE STORAGE tab and ensure the dashboard is filtered
on your OpenShift cluster name. The charts should be populated as in the
following example:
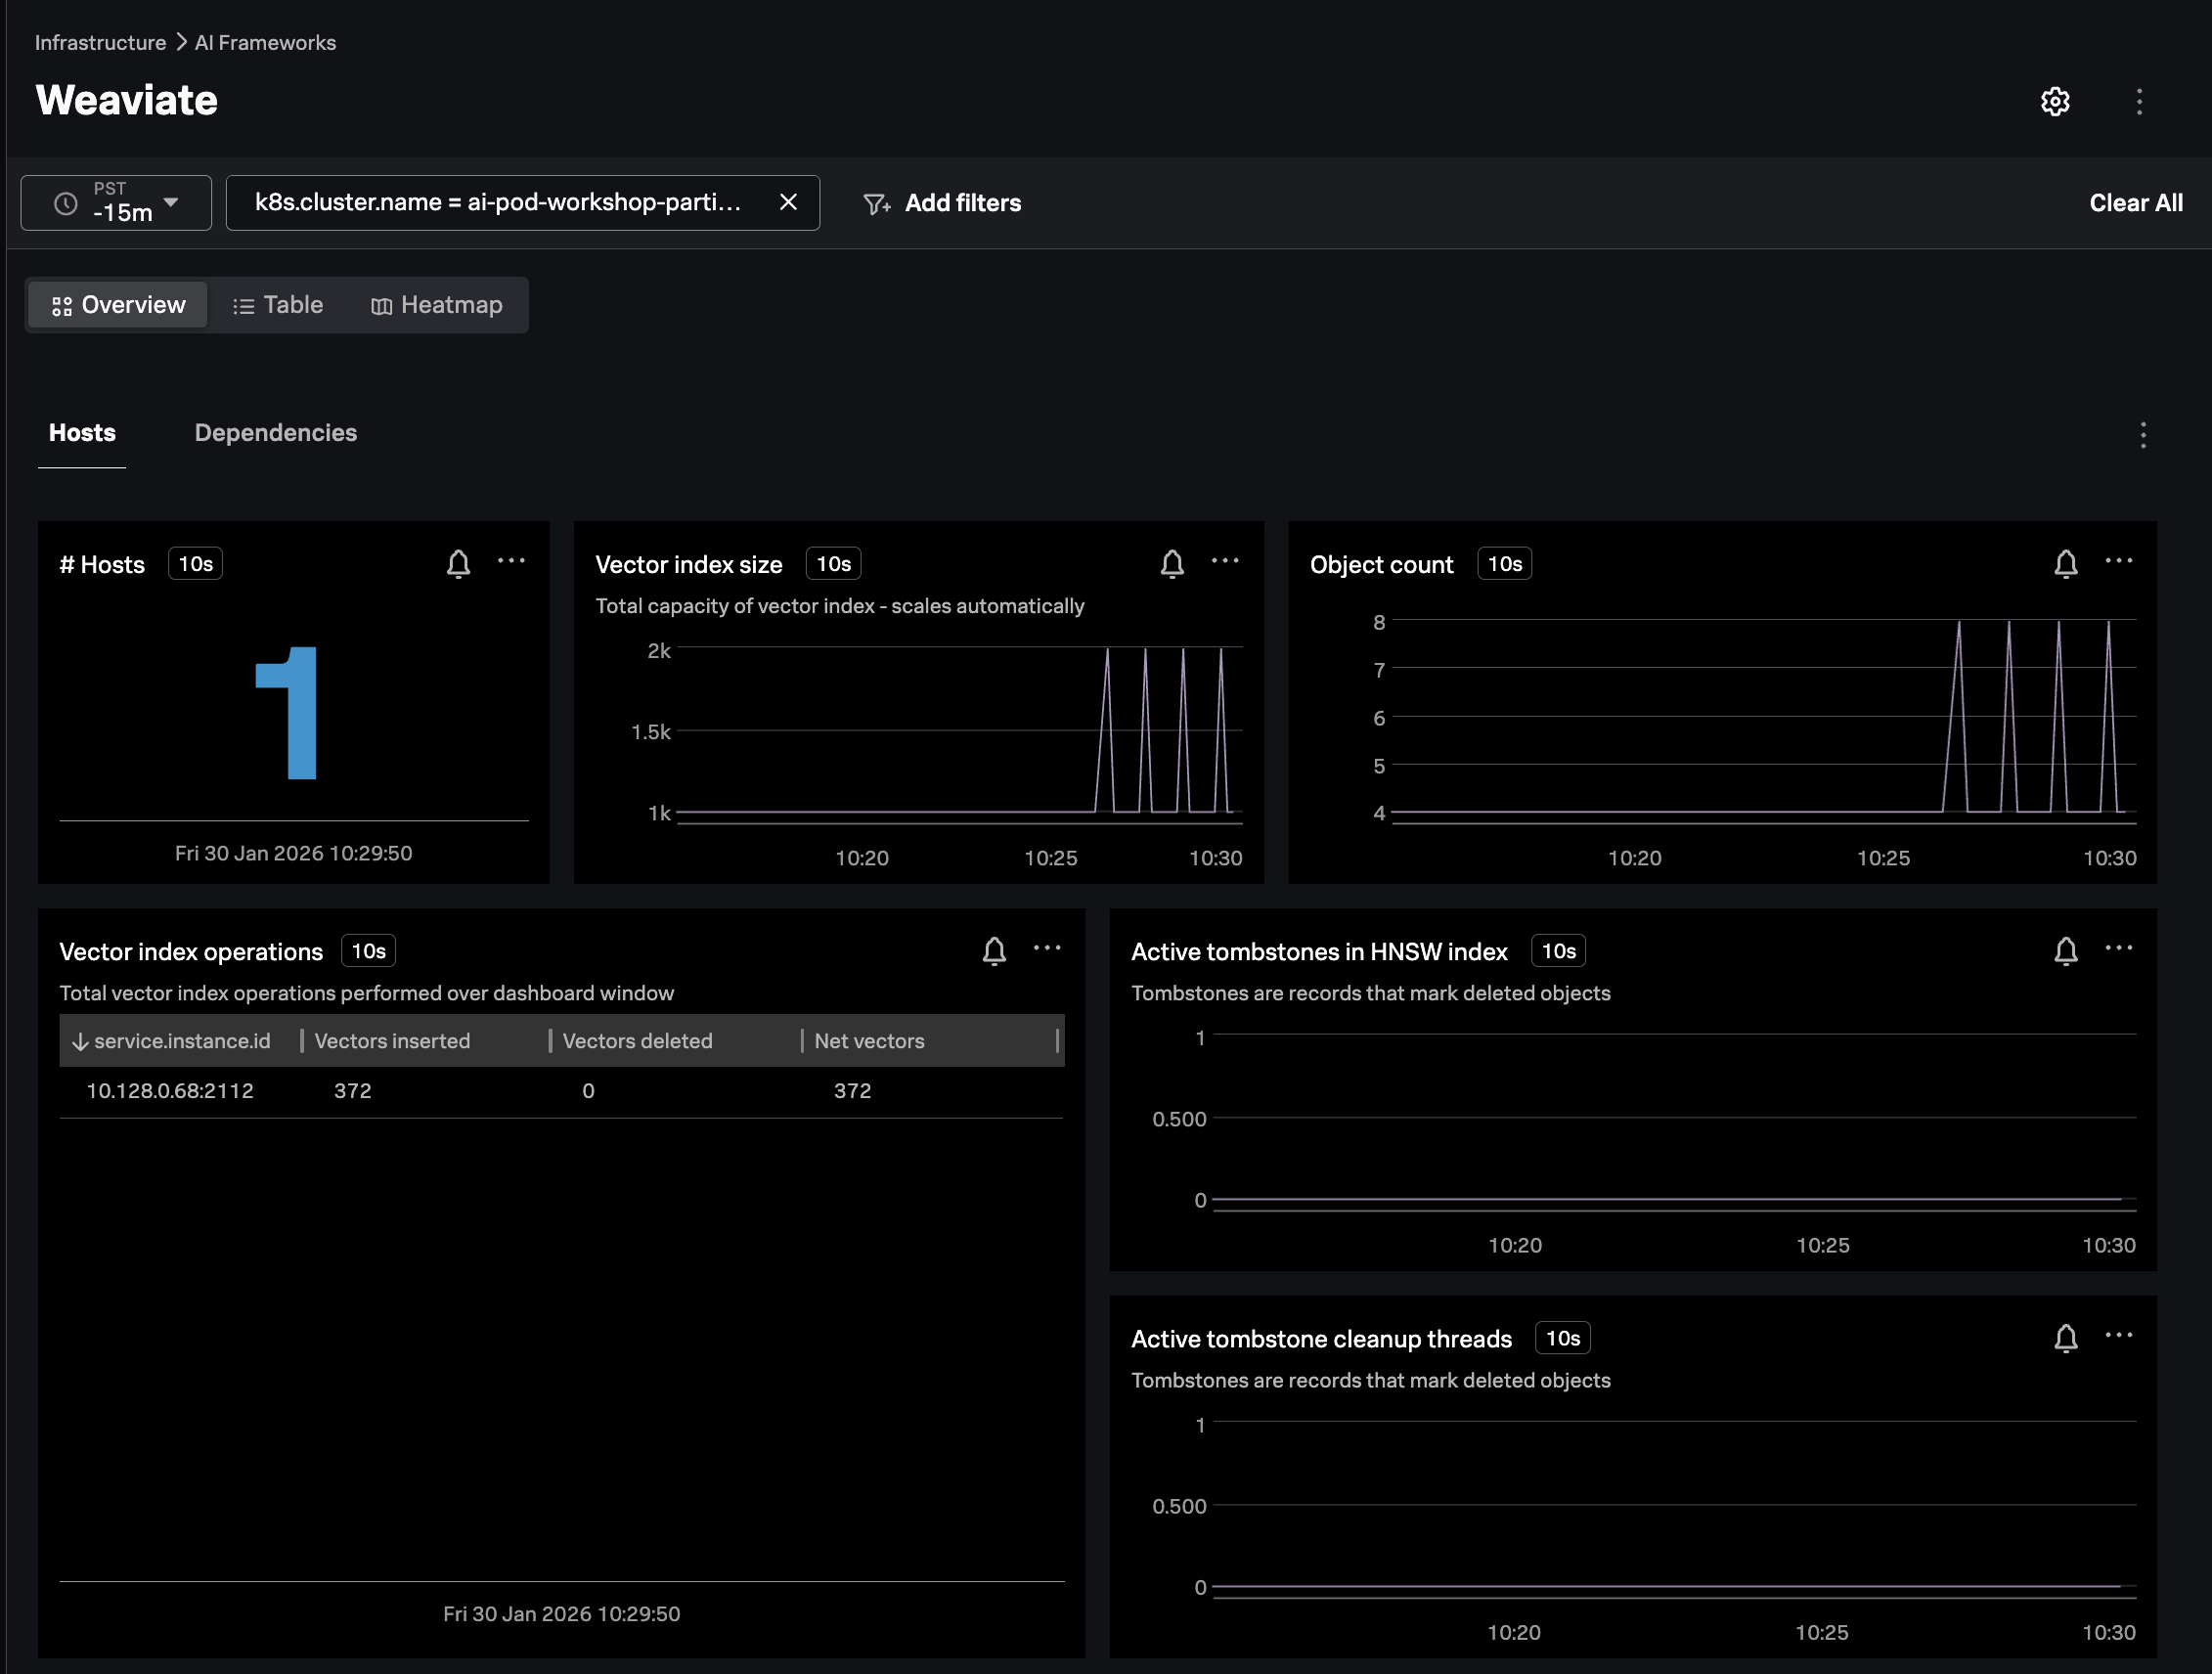
Review the Weaviate Infrastructure Navigator #
Since Weaviate isn’t included by default with an AI POD, it’s not included on the out-of-the-box AI POD dashboard. Instead, we can view Weaviate performance data using one of the infrastructure navigators.
In Splunk Observability Cloud, navigate to Infrastructure -> AI Frameworks -> Weaviate.
Filter on the k8s.cluster.name of interest, and ensure the navigator is populated as in the
following example: