1. Real Browser Test
1.3 Import JSON
To begin configuring our test we need to import the JSON file we exported from the Chrome DevTools Recorder. Splunk Synthetic Monitoring understands the recorder’s native JSON format directly, so there’s no conversion step — the importer reads each recorded step and creates a corresponding synthetic-test step, preserving the selectors, viewport, and any asserted navigation events.
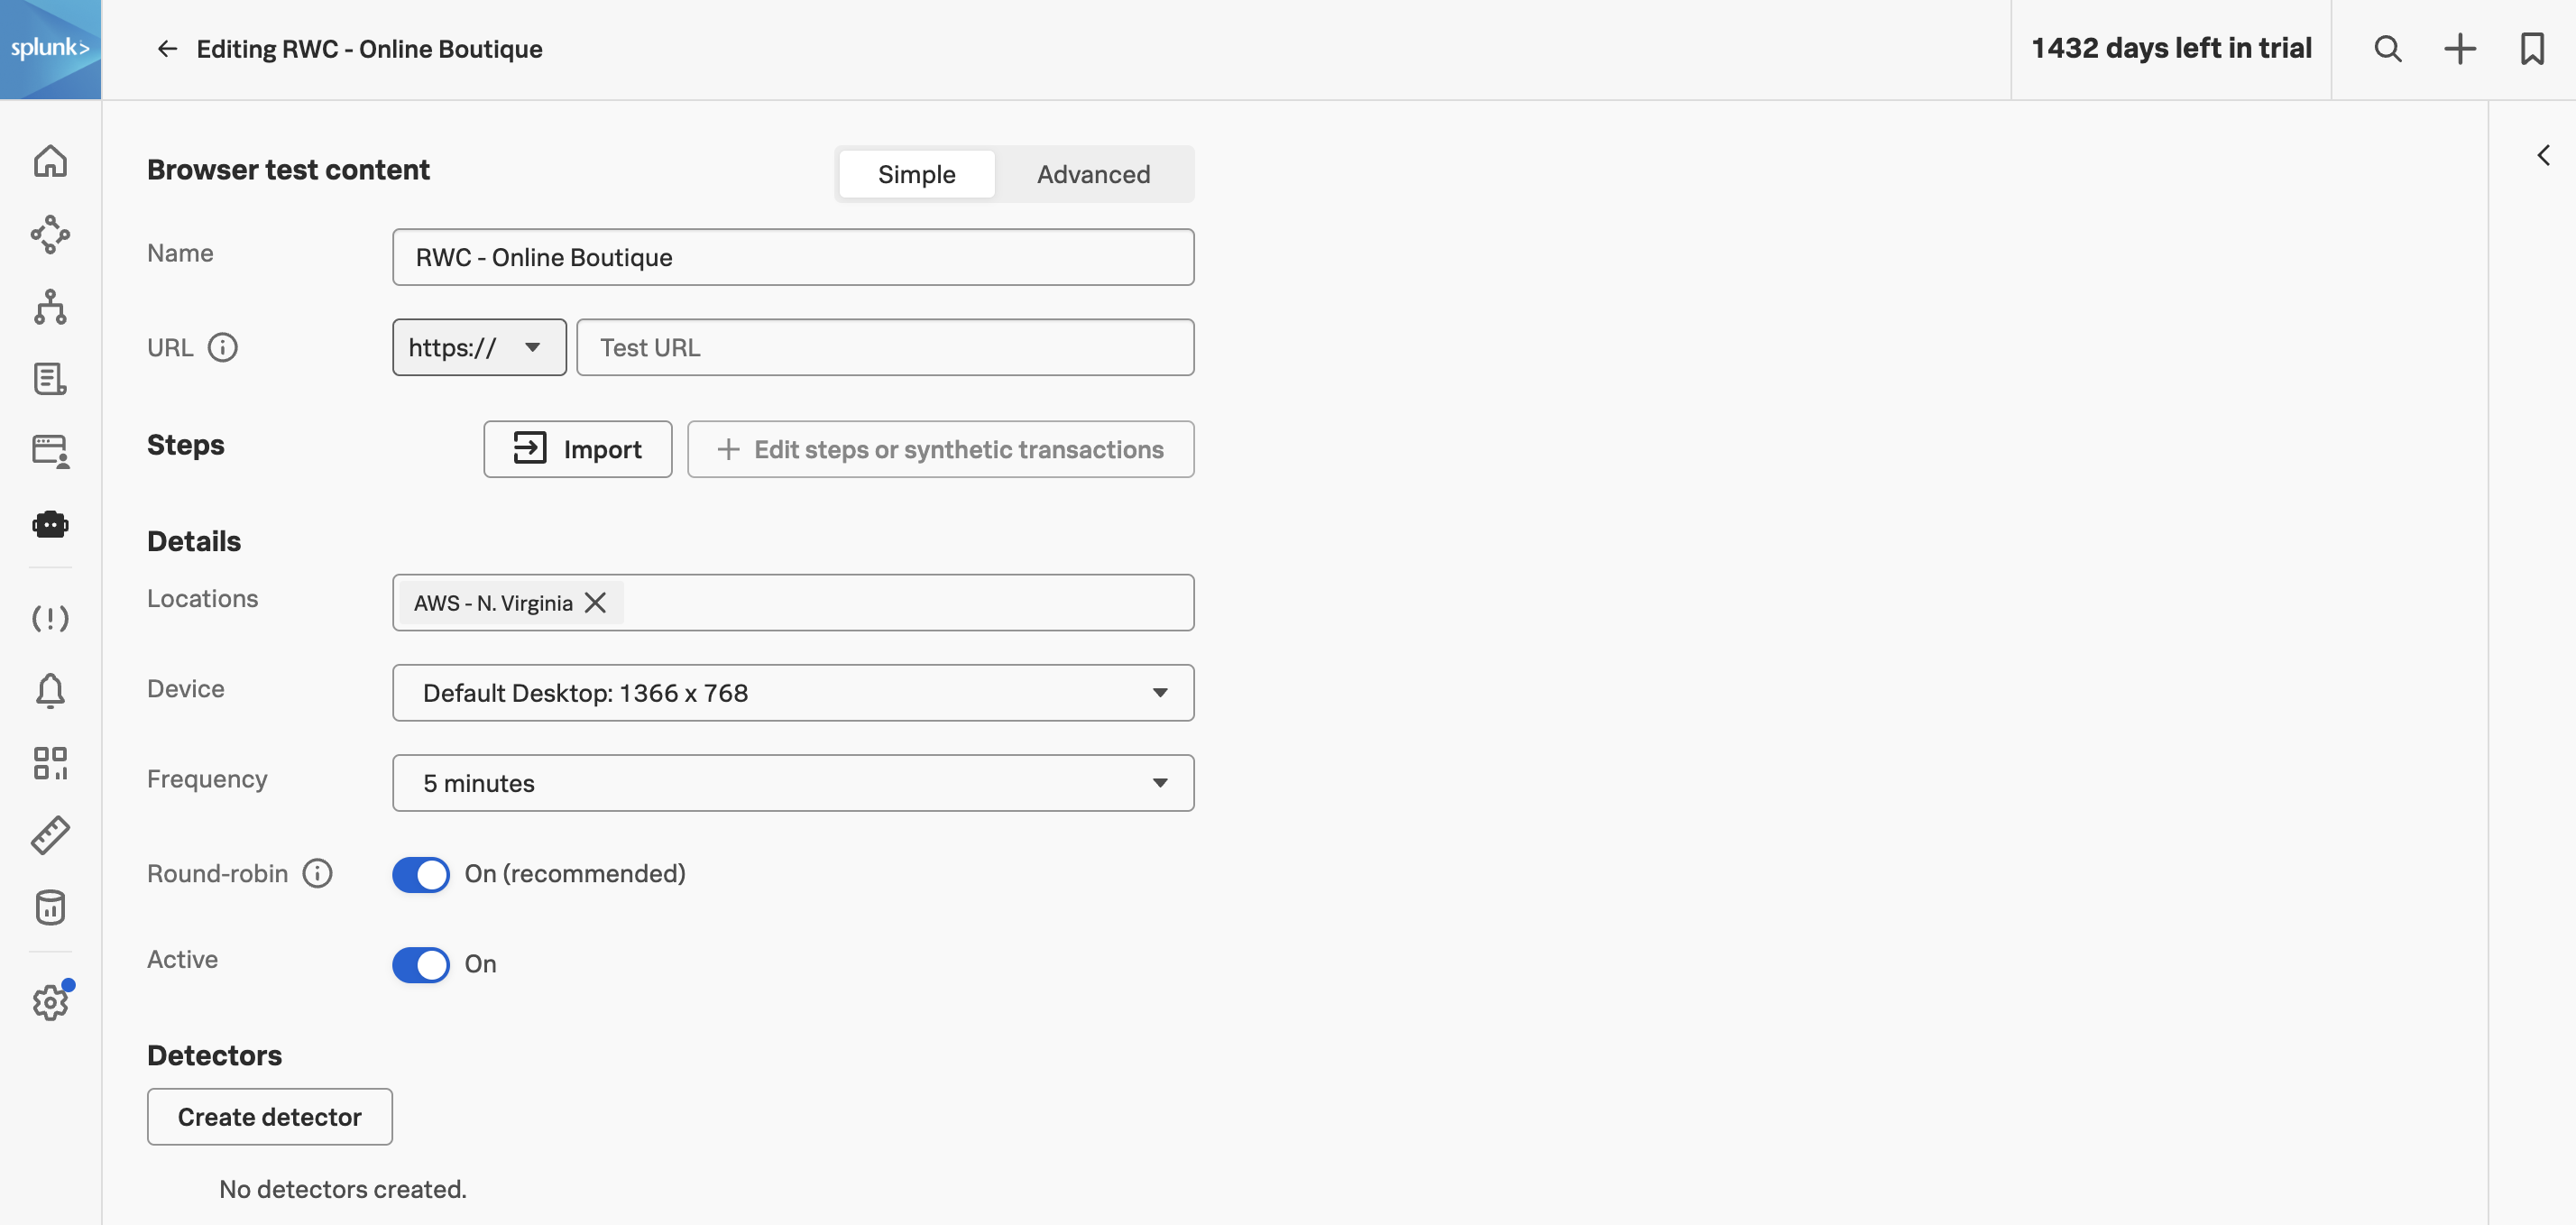
To enable the button, we must first give our test a name. Use the same convention as the recording — your initials followed by the journey, e.g. <your initials> - Online Boutique. Prefixing with initials makes it easy for trainers and teammates to find each other’s work in a shared organisation.
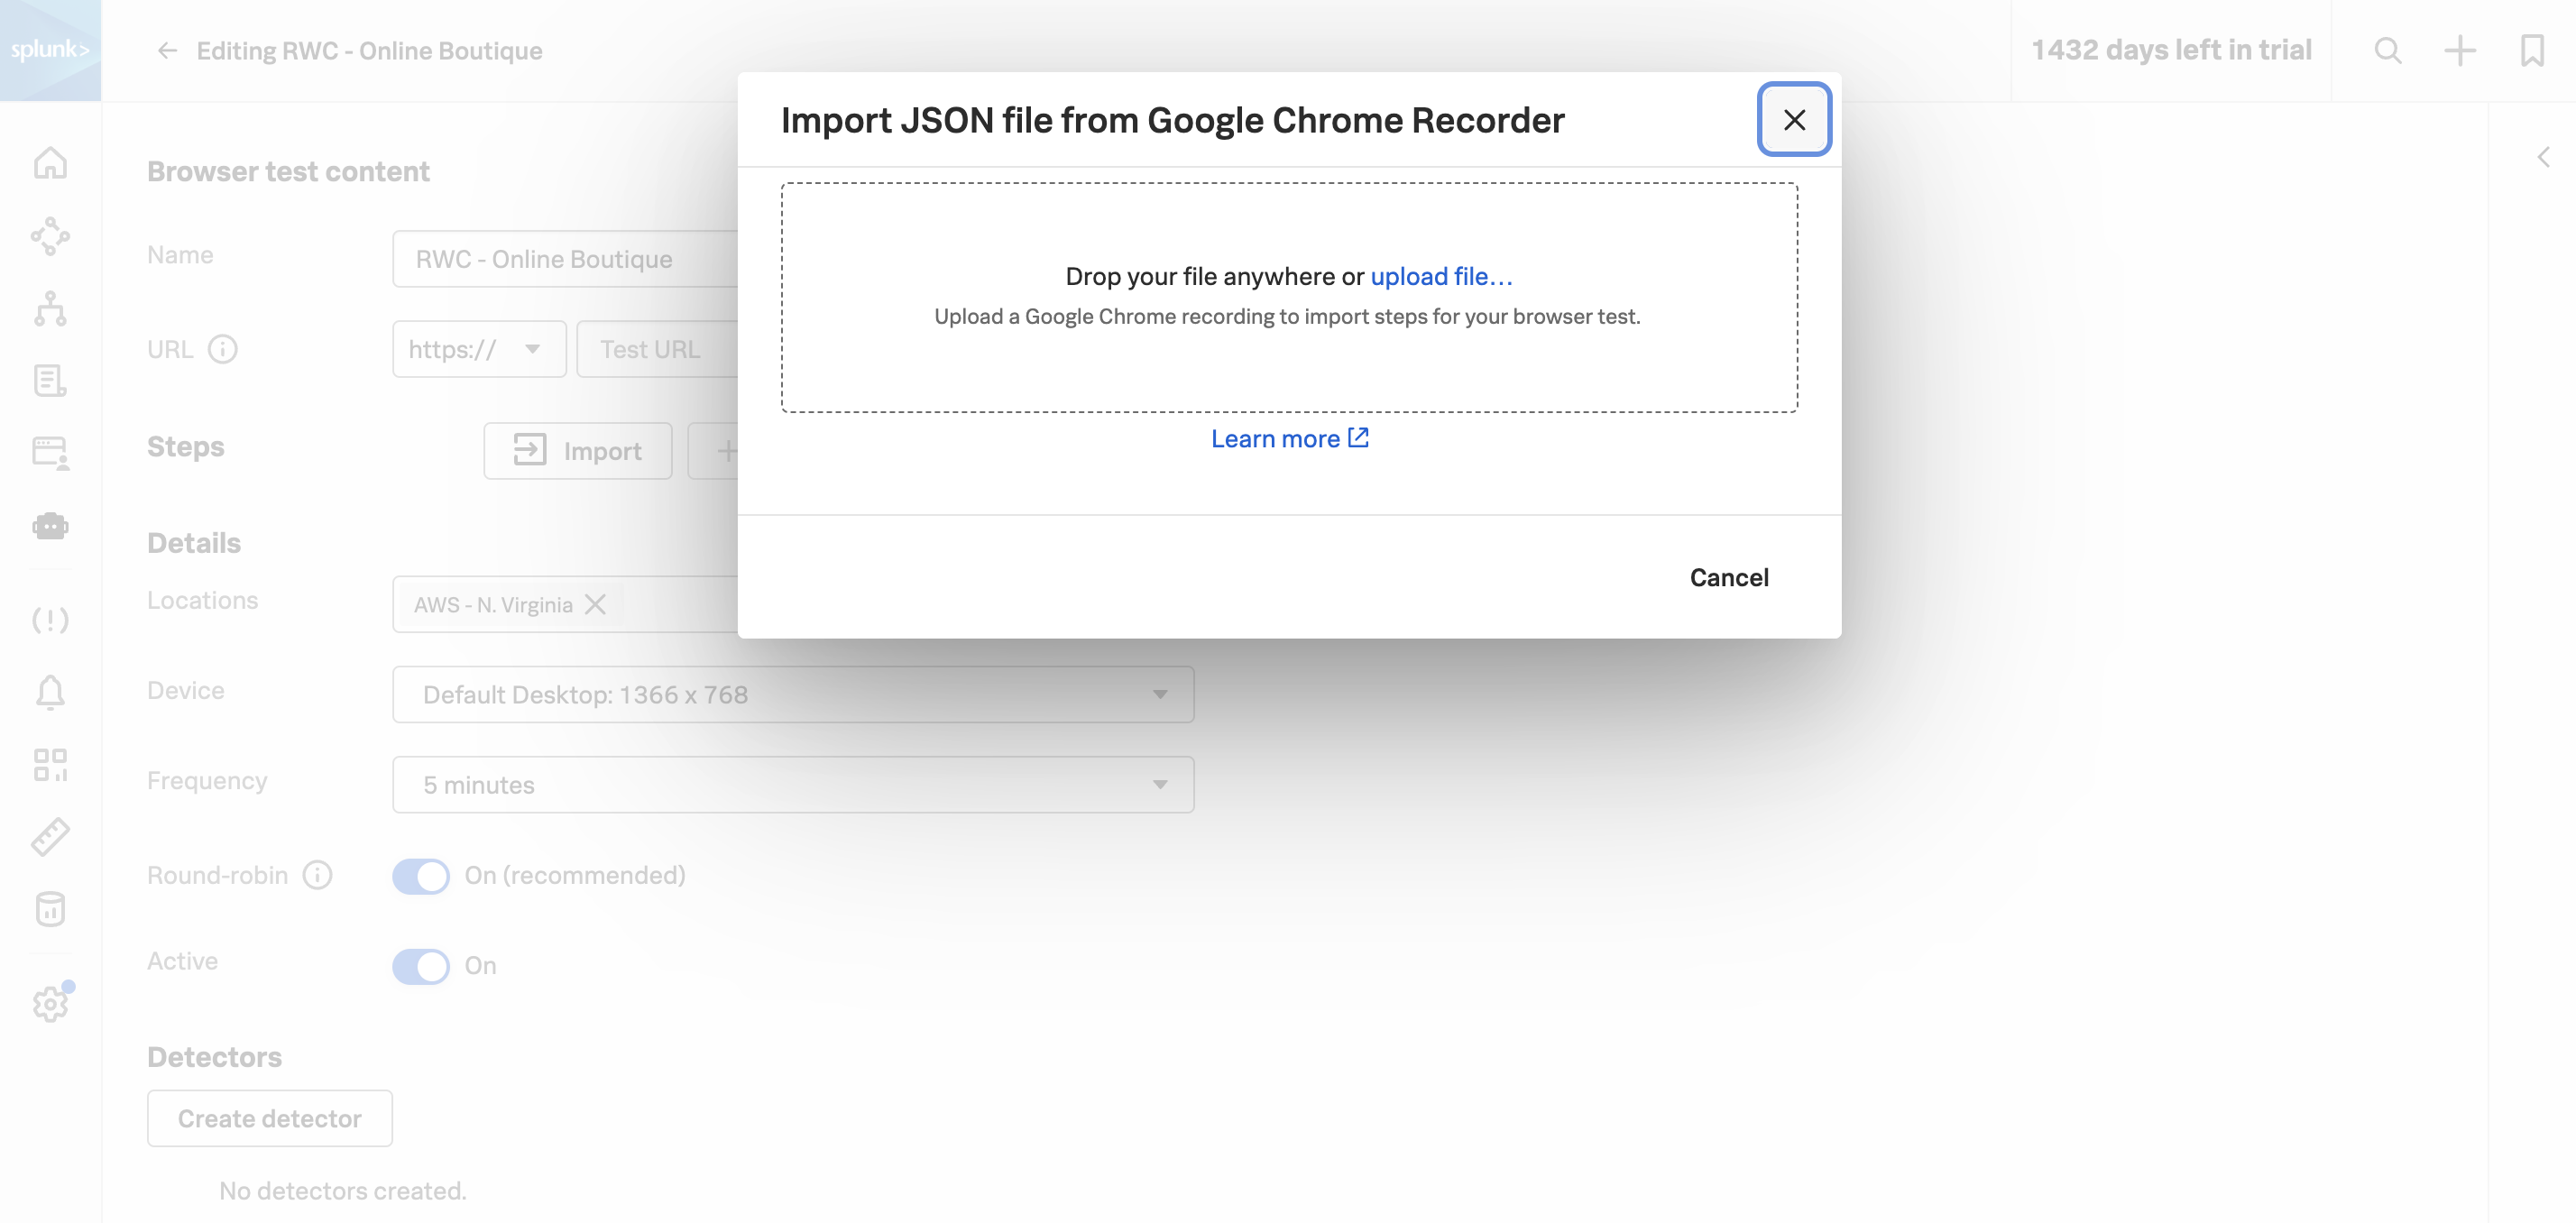
Once the button is enabled, click on it and either drop the JSON file that you exported from the Chrome DevTools Recorder, or browse for it.
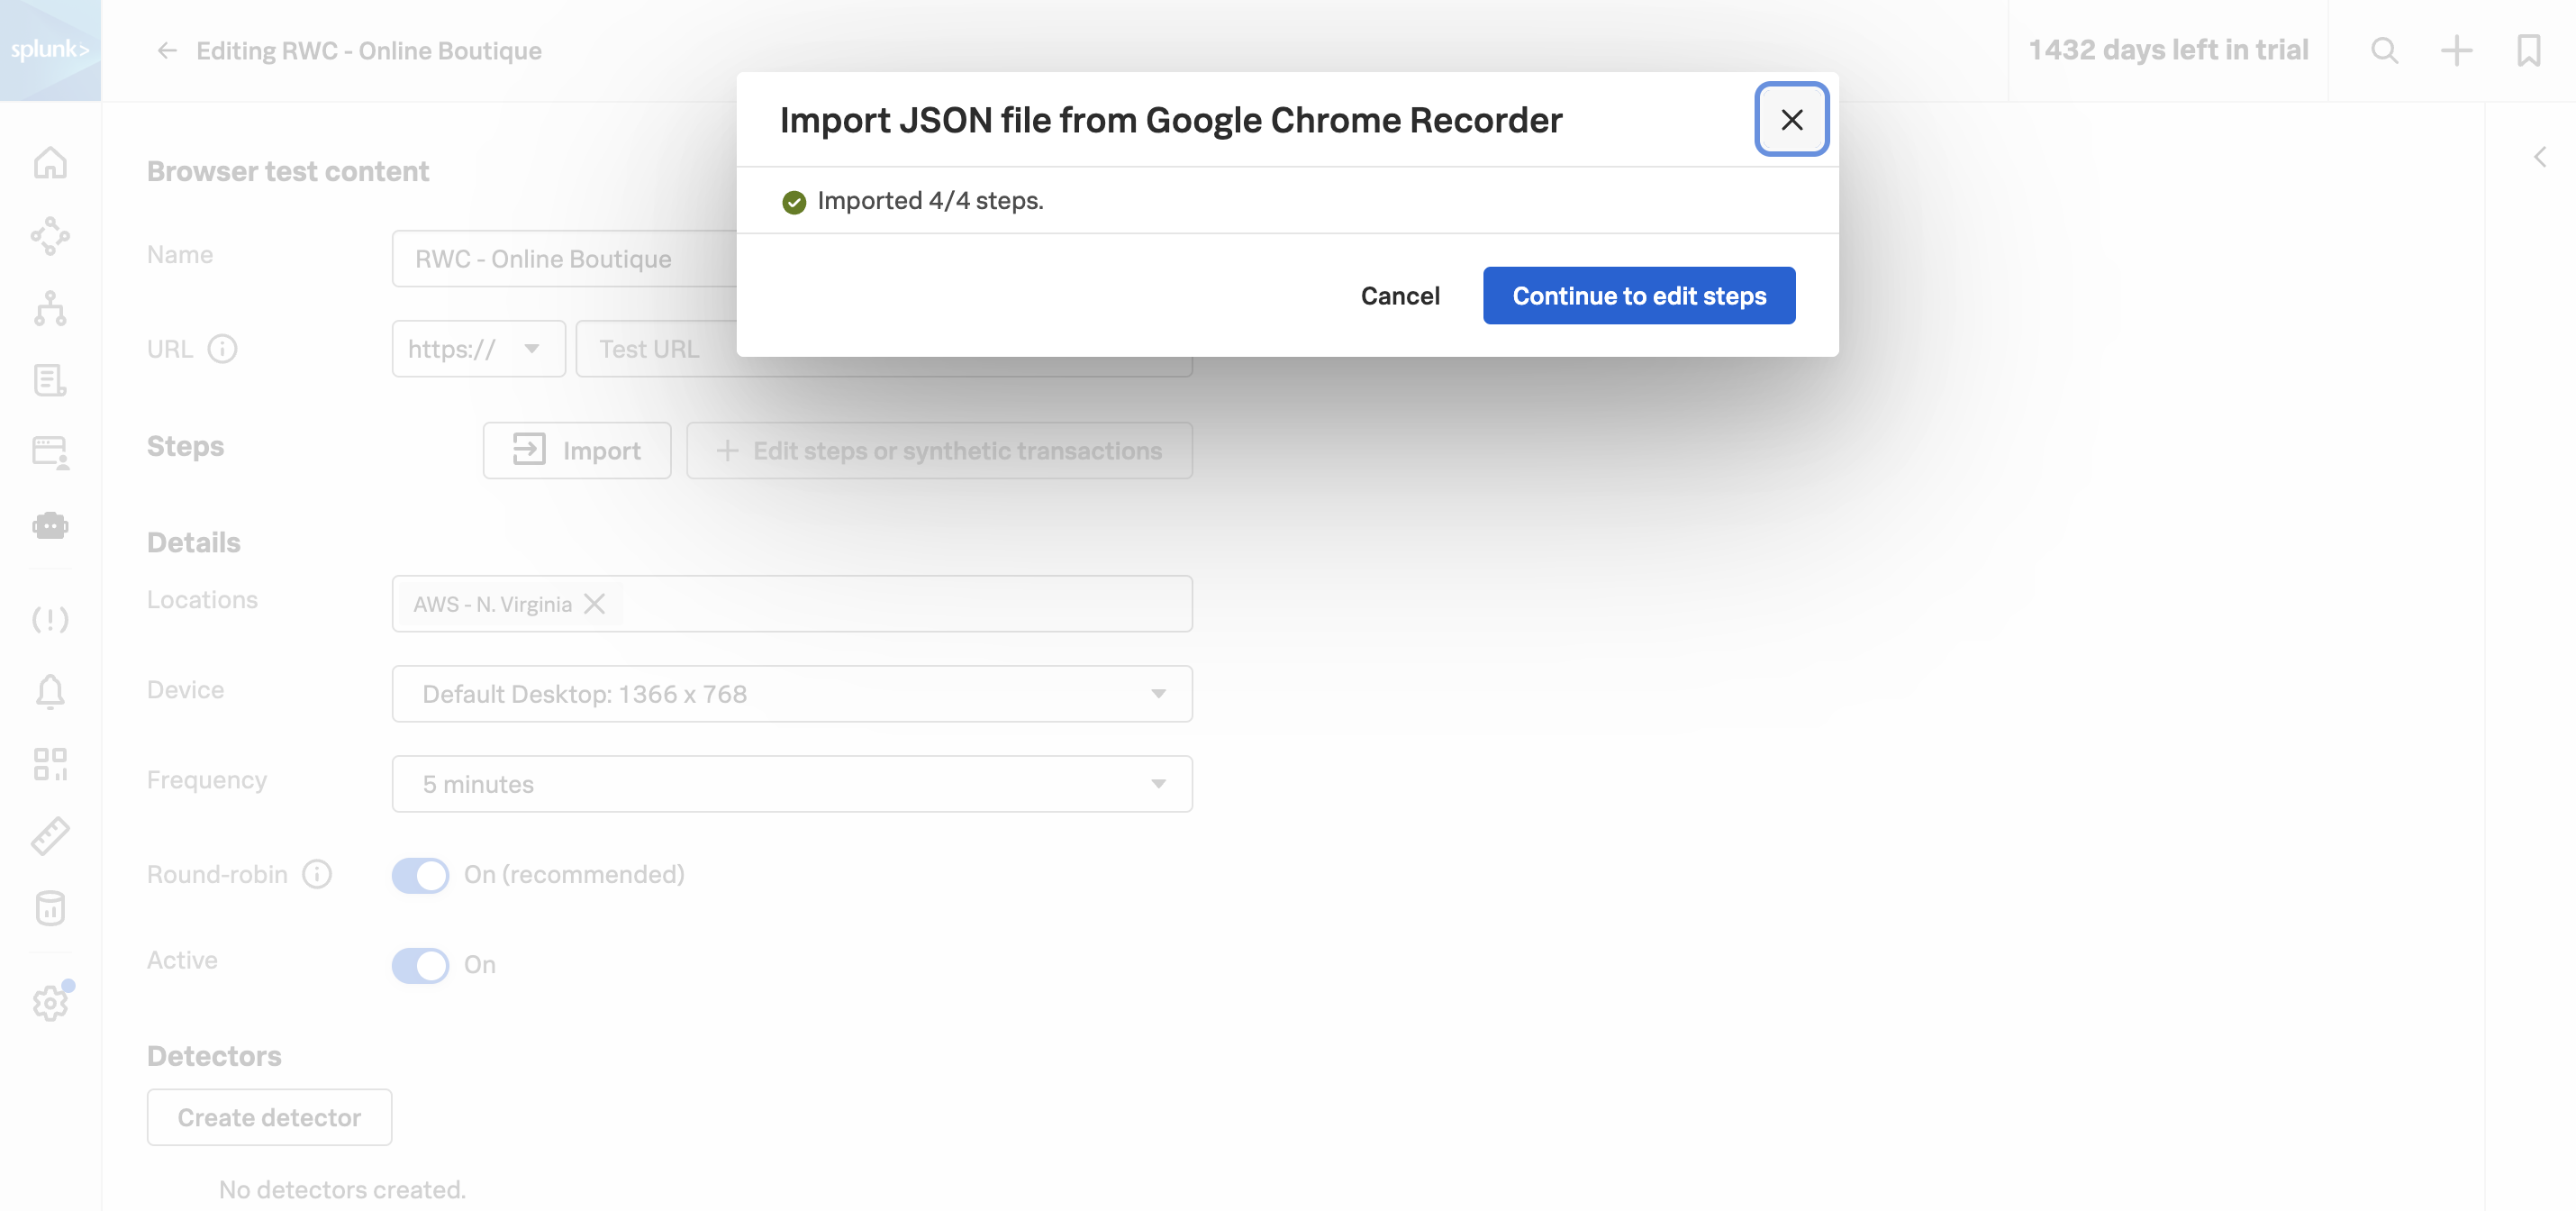
Once the JSON has been parsed, you’ll see a green confirmation showing the number of steps imported. If you ever see a smaller number than you expected here, it usually means one of the recorded actions wasn’t in a format the Synthetics importer recognised — re-recording that specific interaction usually resolves it.
Click on .
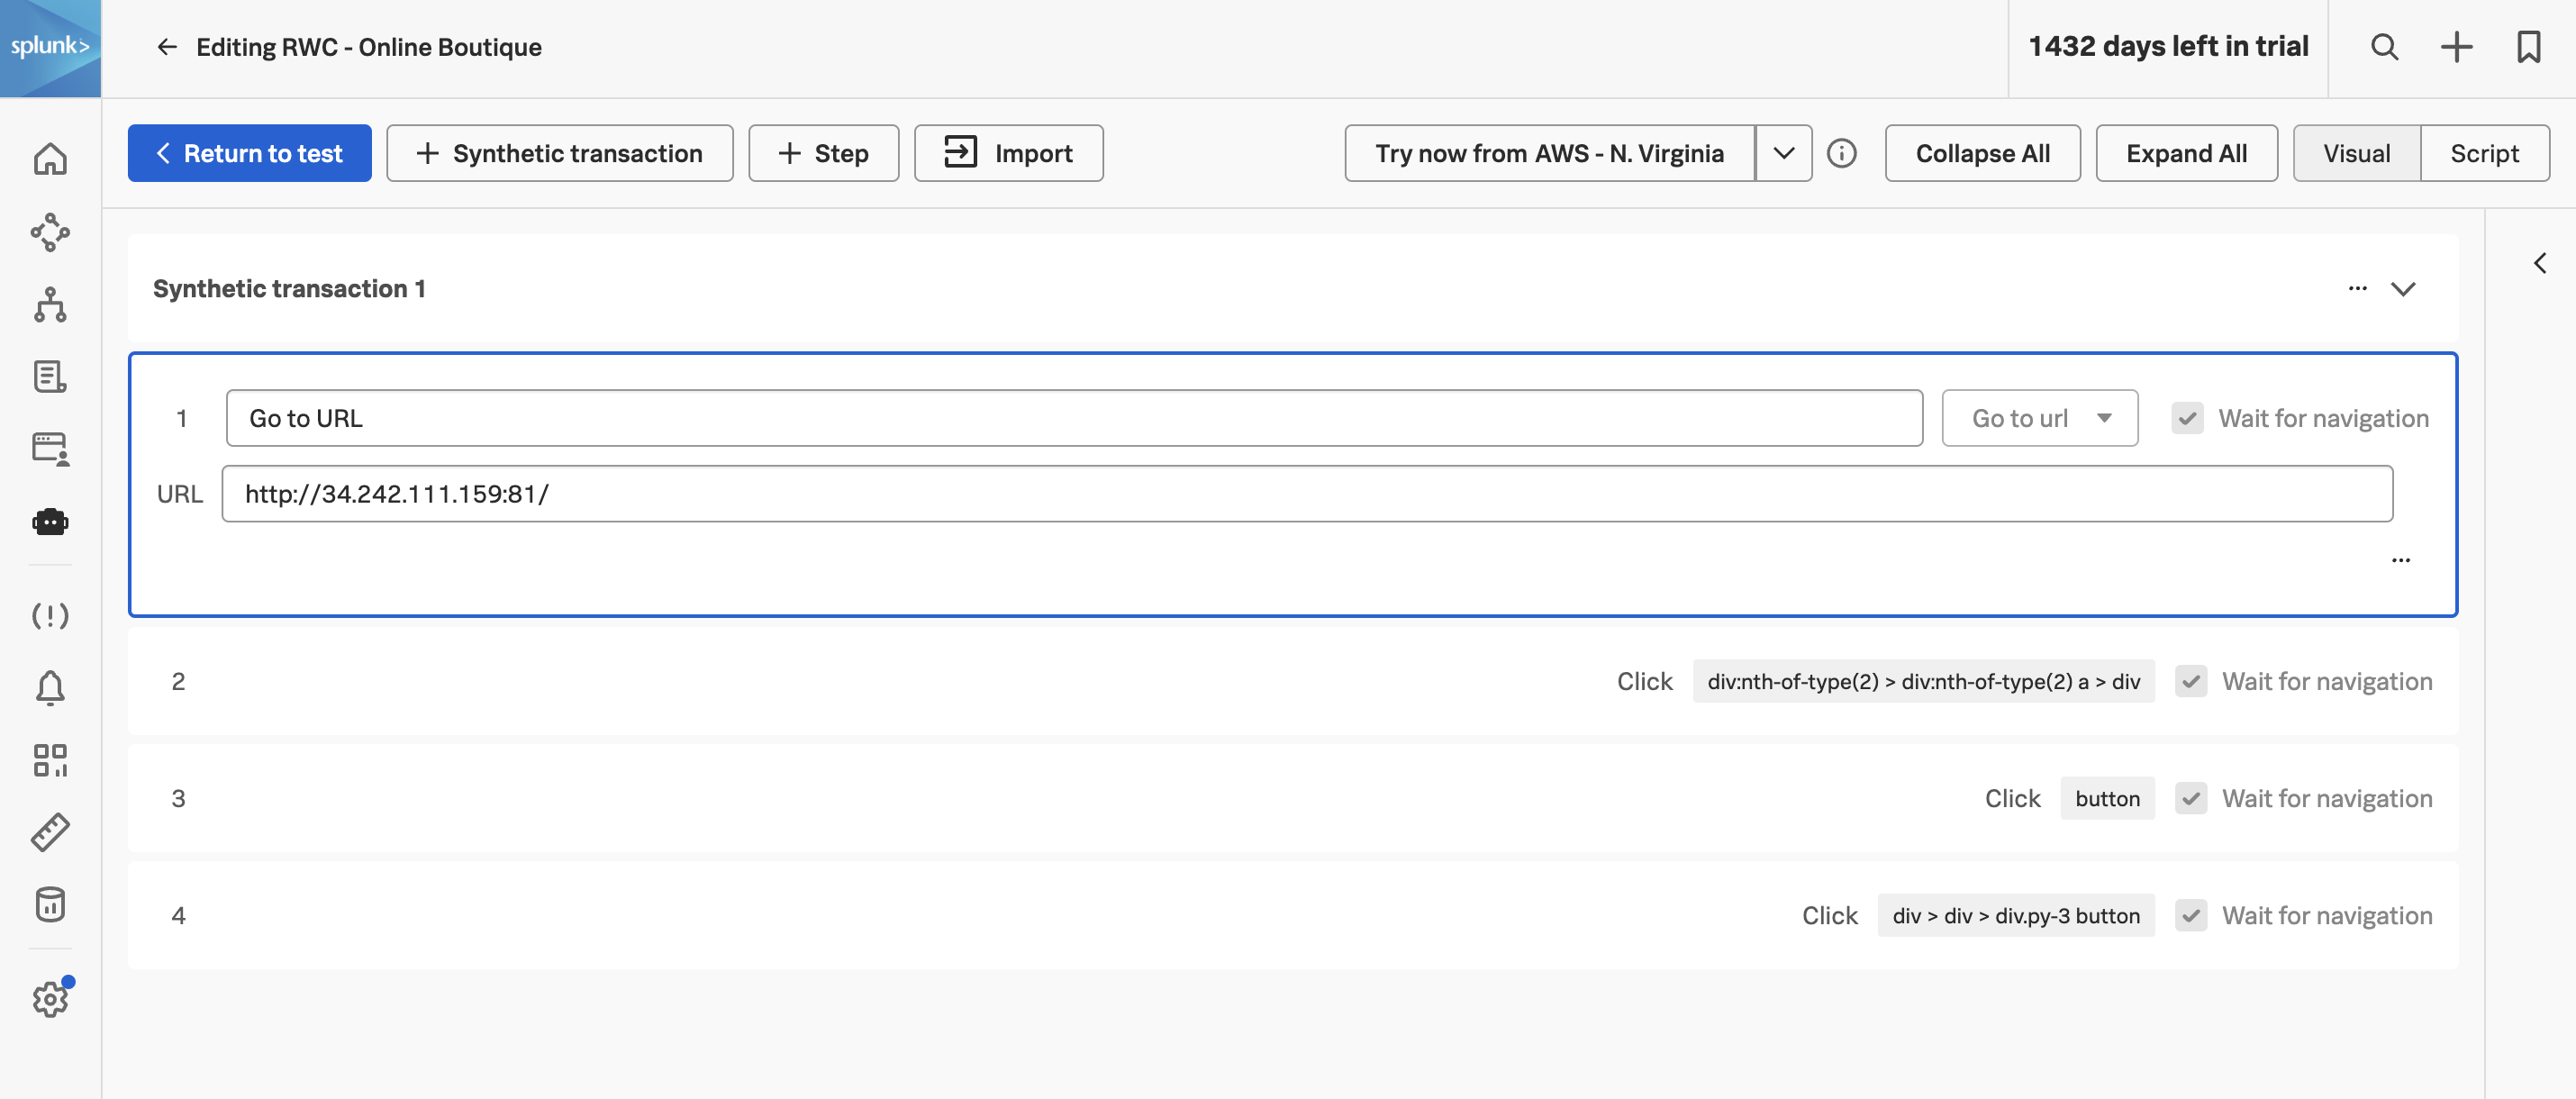
The Edit steps view shows each imported step in order, with the action type, target selector, and any wait conditions. You can reorder, add, or remove steps from here — but we’ll come back to that in a later section.
Before we make any edits to the steps themselves, let’s first configure the test’s run-time settings — where it runs from, how often, and on what device. Click on .