1. Real Browser Test
1.6 Edit test steps
By default the steps that come out of the Chrome Recorder have generic names like “Go to URL” or “Click on <button>”. That’s fine while you’re authoring the test, but the moment a step fails and a colleague is staring at an alert at 3am, “Step 3 failed: Click on <button>” tells them nothing useful. “Step 3 failed: Add to Cart” tells them exactly where in the user journey the regression is.
Step names also surface in:
- The Synthetic Monitoring run results UI (per-step waterfall, screenshots).
- Detector alert messages and notifications.
- Linked Observability Cloud dashboards that filter on
synthetic.step.
It’s worth a minute to make them readable.
To edit the steps click on the button.
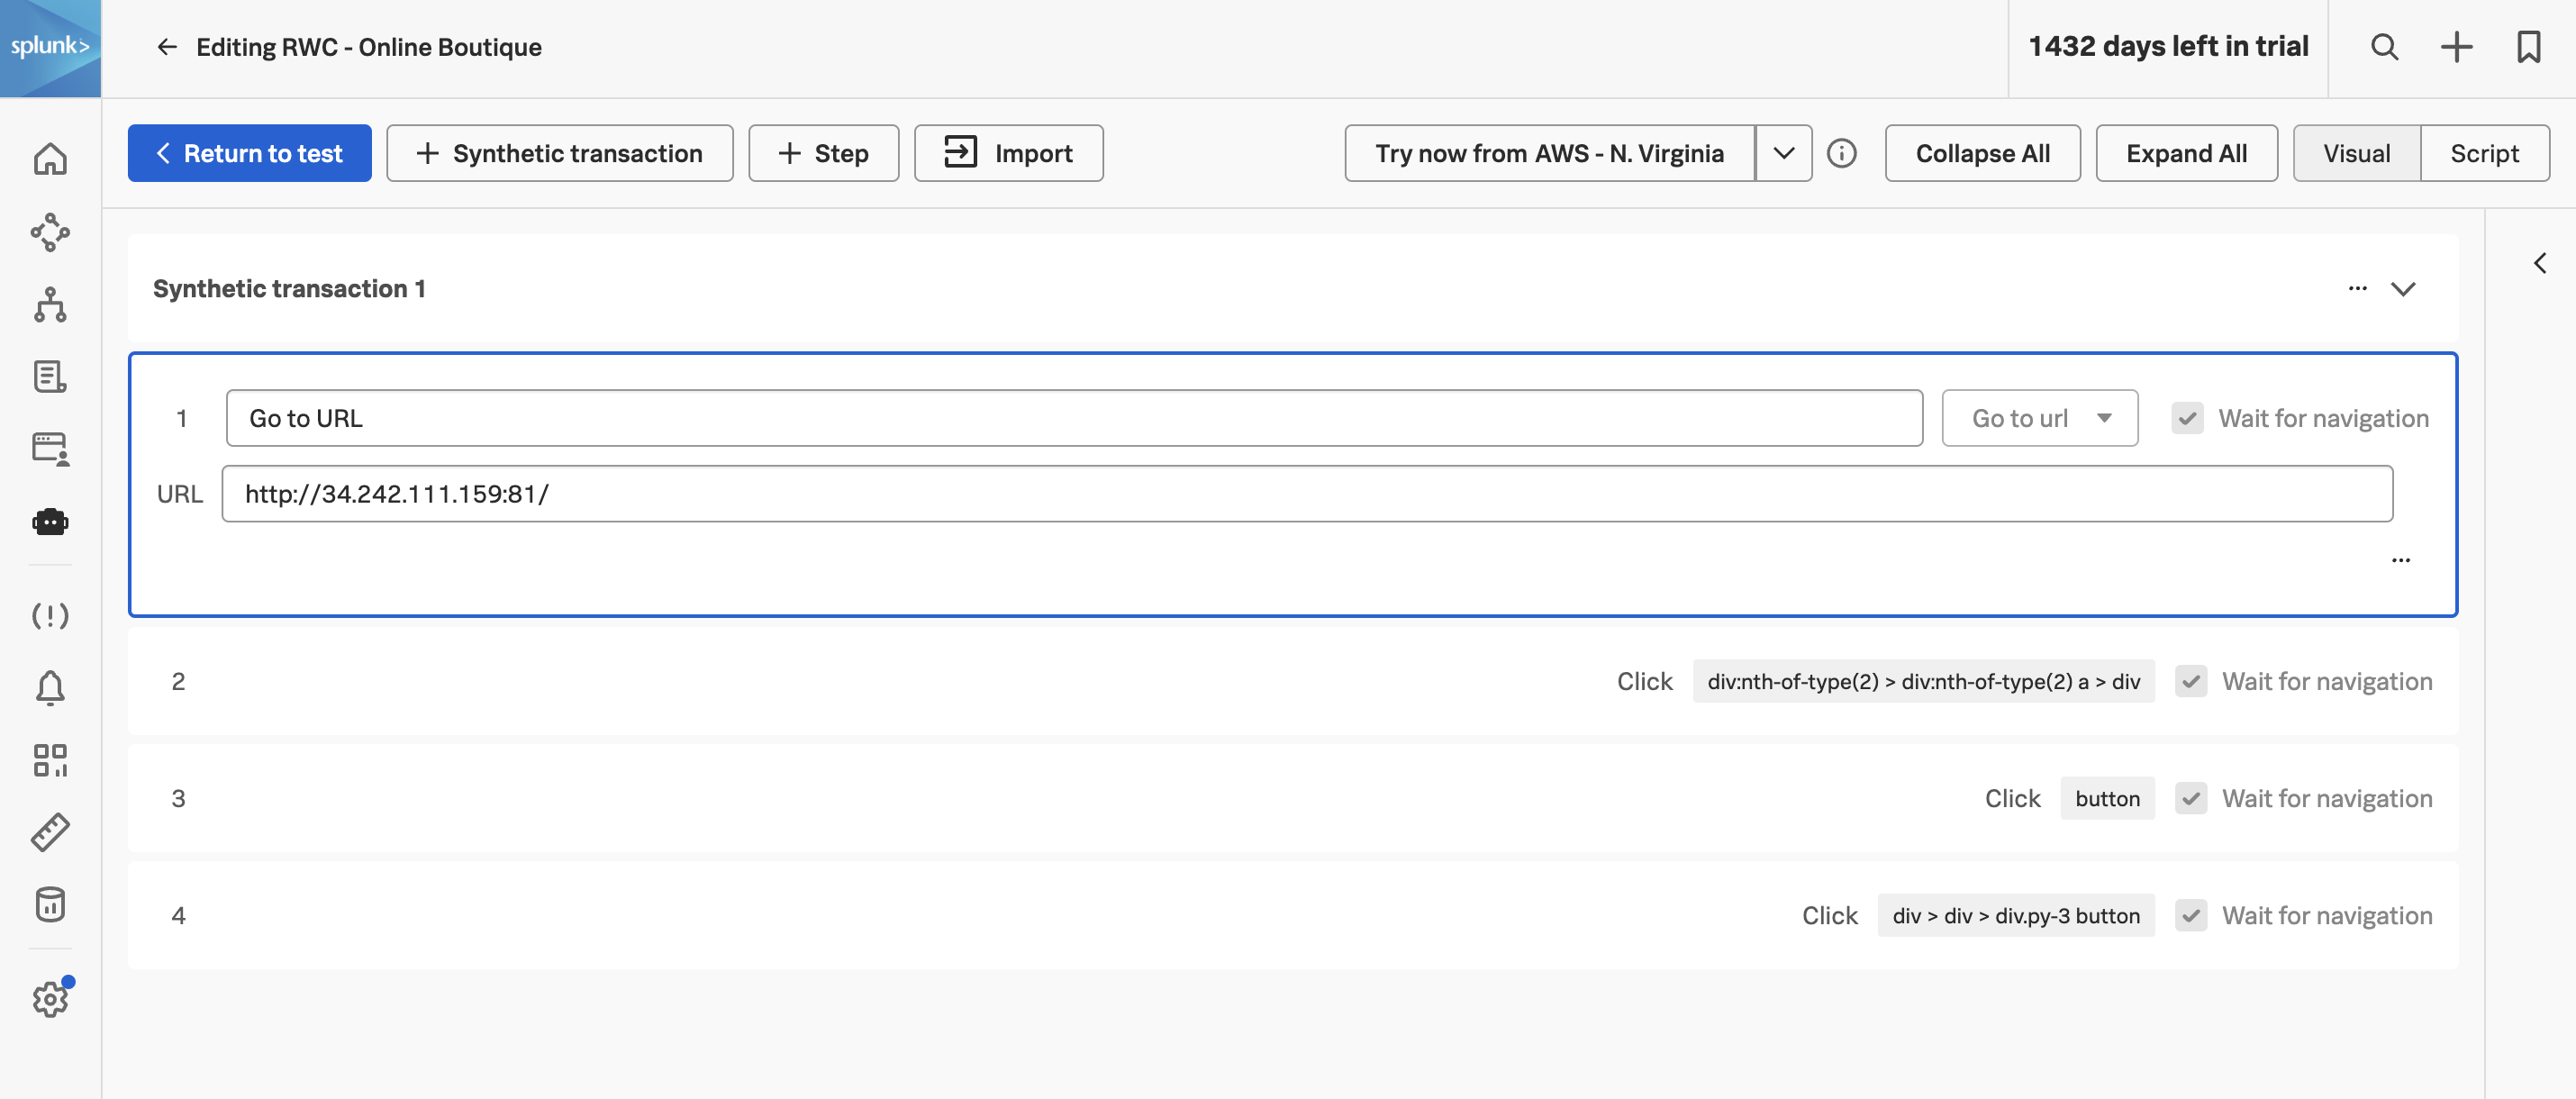
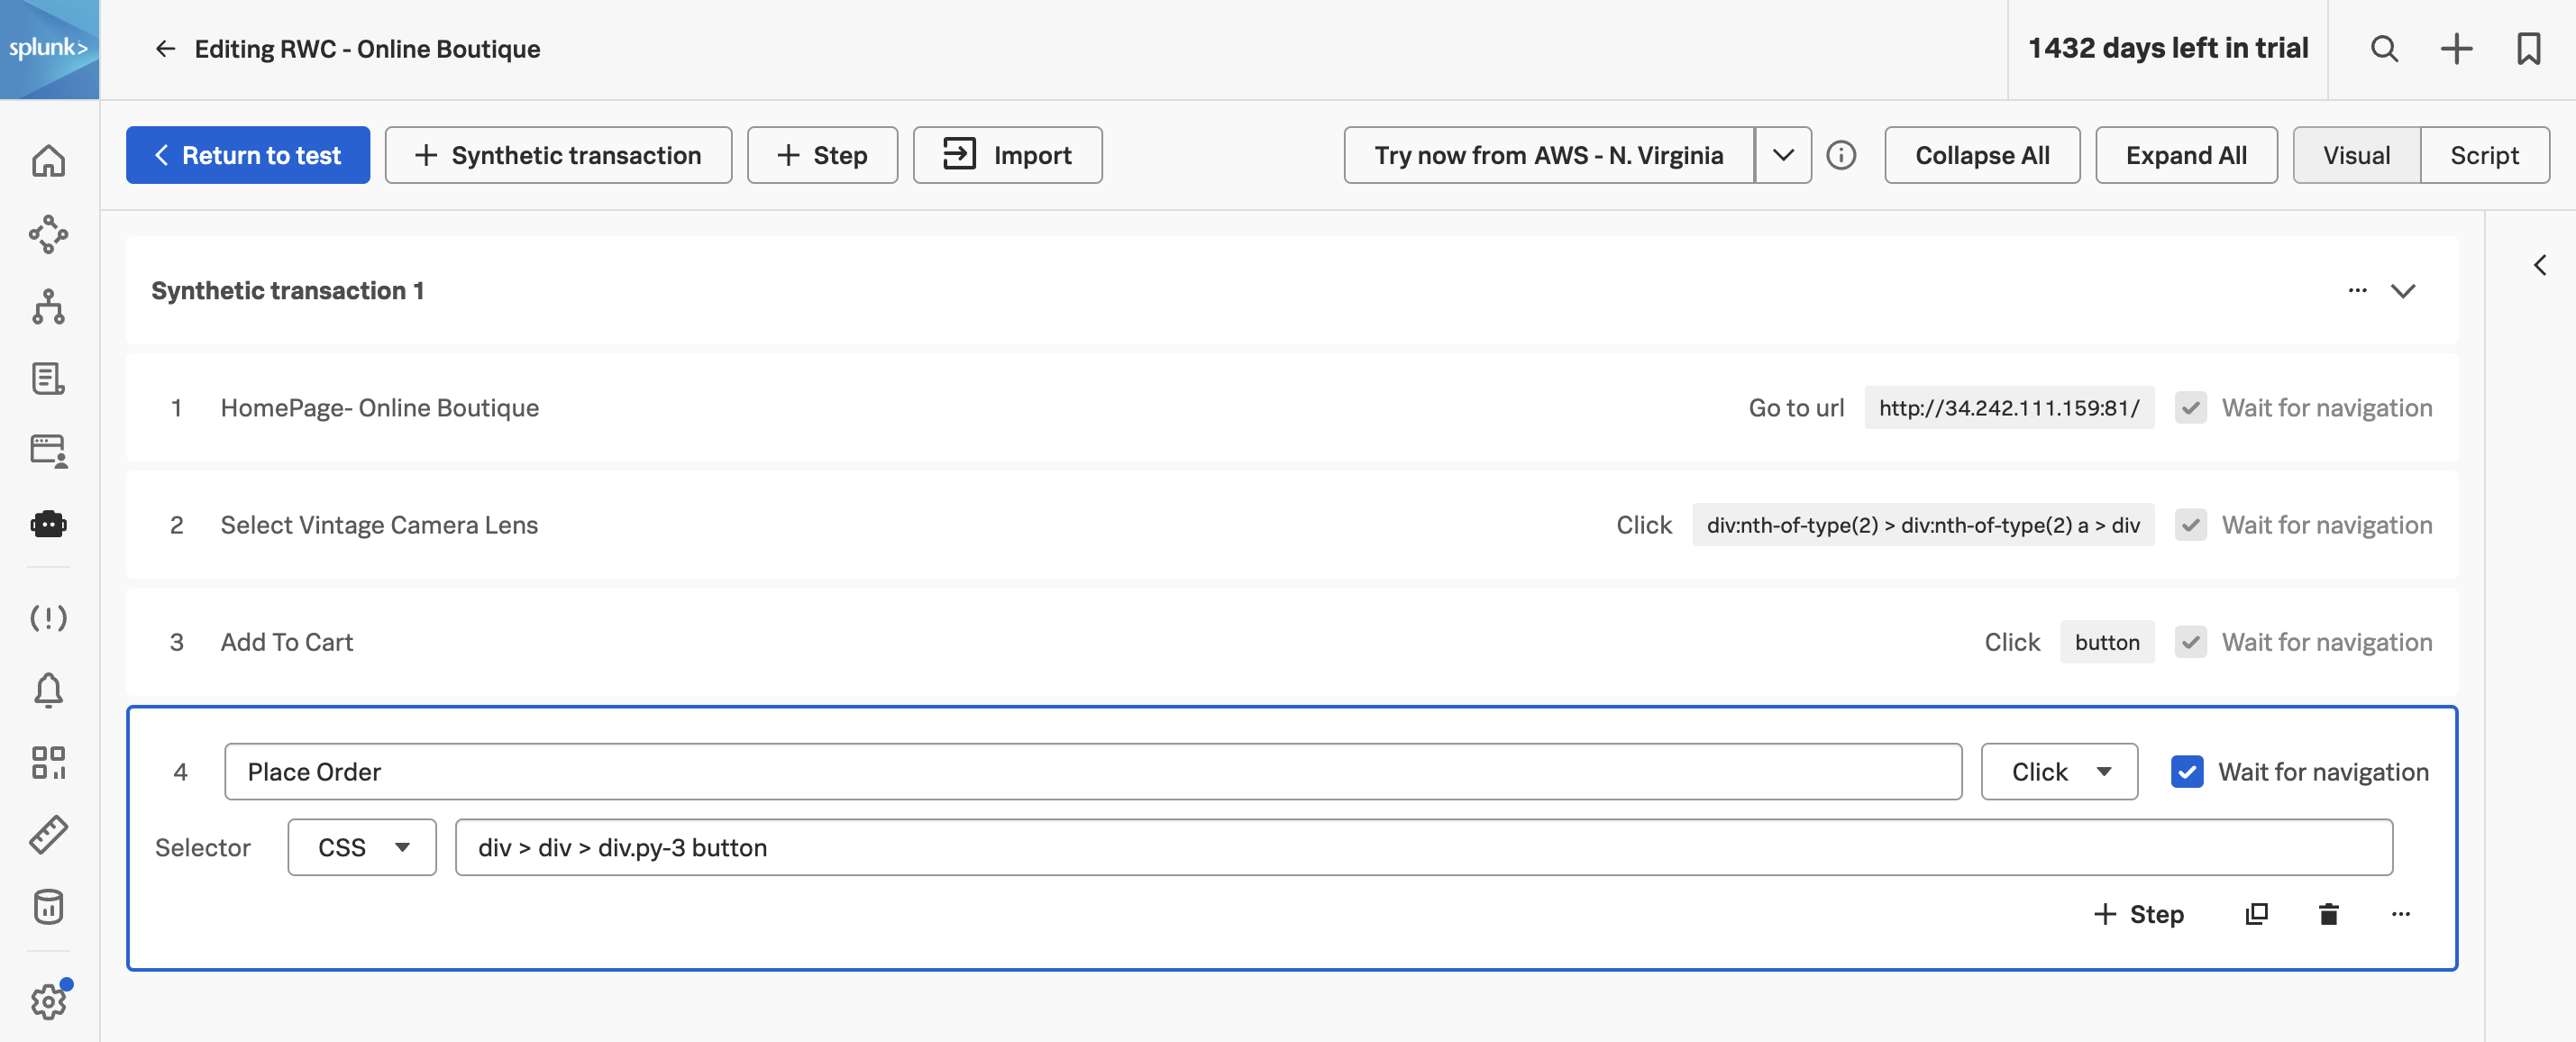
For each of the four steps, give it a meaningful name:
- Step 1 — replace Go to URL with HomePage - Online Boutique.
- Step 2 — enter Select Vintage Camera Lens.
- Step 3 — enter Add to Cart.
- Step 4 — enter Place Order.
Tip — Synthetic Transactions
Click to return to the test configuration page and click to save the test.
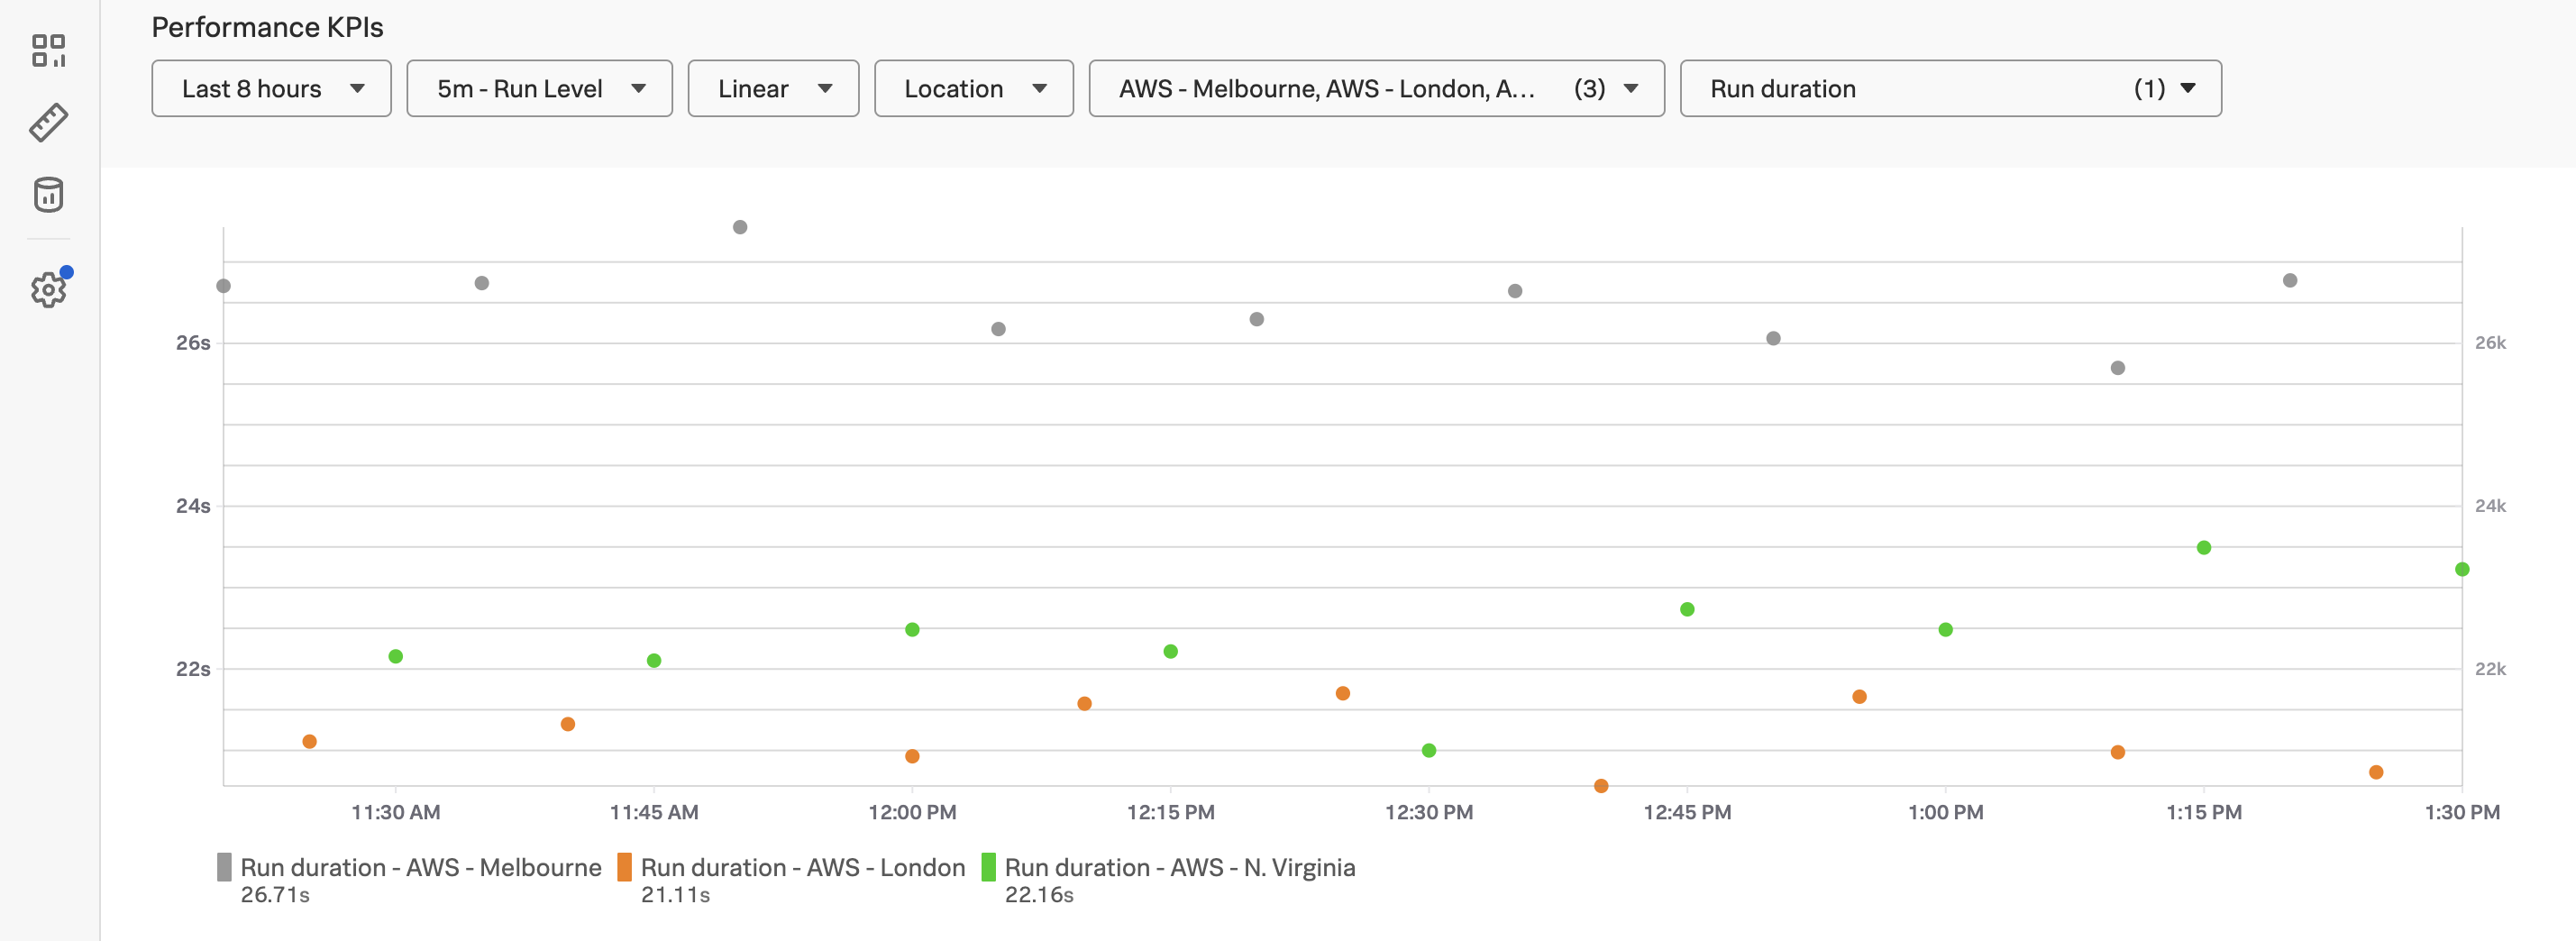
You’ll be returned to the test dashboard. After a couple of minutes the first results will start to appear in the Performance KPIs scatterplot.
Reading the scatterplot #
Each dot on the scatterplot is one test run:
- X axis is time — newest runs on the right.
- Y axis is run duration in seconds — lower is faster.
- Colour is location — in this workshop you’ll see three series (N. Virginia, London, Melbourne).
The controls along the top let you change the time range, the aggregation interval (5m, 1h, etc.), the scale (linear or logarithmic — log is useful when one location is much slower than the others), the location filter, and the metric you’re plotting (defaults to run duration, but you can switch to any individual web vital).
Watch for two patterns over time: a step change in duration (something changed in the site or its dependencies — usually a deploy or a CDN config), and a spread between locations widening (a regional issue — a CDN edge, a regional dependency, a DNS problem).
Congratulations! You have successfully created a Real Browser Test in Splunk Synthetic Monitoring. Next, we’ll click into a single run and unpack everything Synthetics captured about it.