1. Real Browser Test
1.7 View test results
In the Scatterplot from the previous step, click on one of the dots to drill into the test run data. Preferably, select the most recent test run (farthest to the right) so the run is as close to the current site state as possible.
This single page captures everything Splunk Synthetic Monitoring recorded for that one run from that one location. It’s worth understanding what each section is for — these are the views you’ll spend the most time in when triaging a regression.
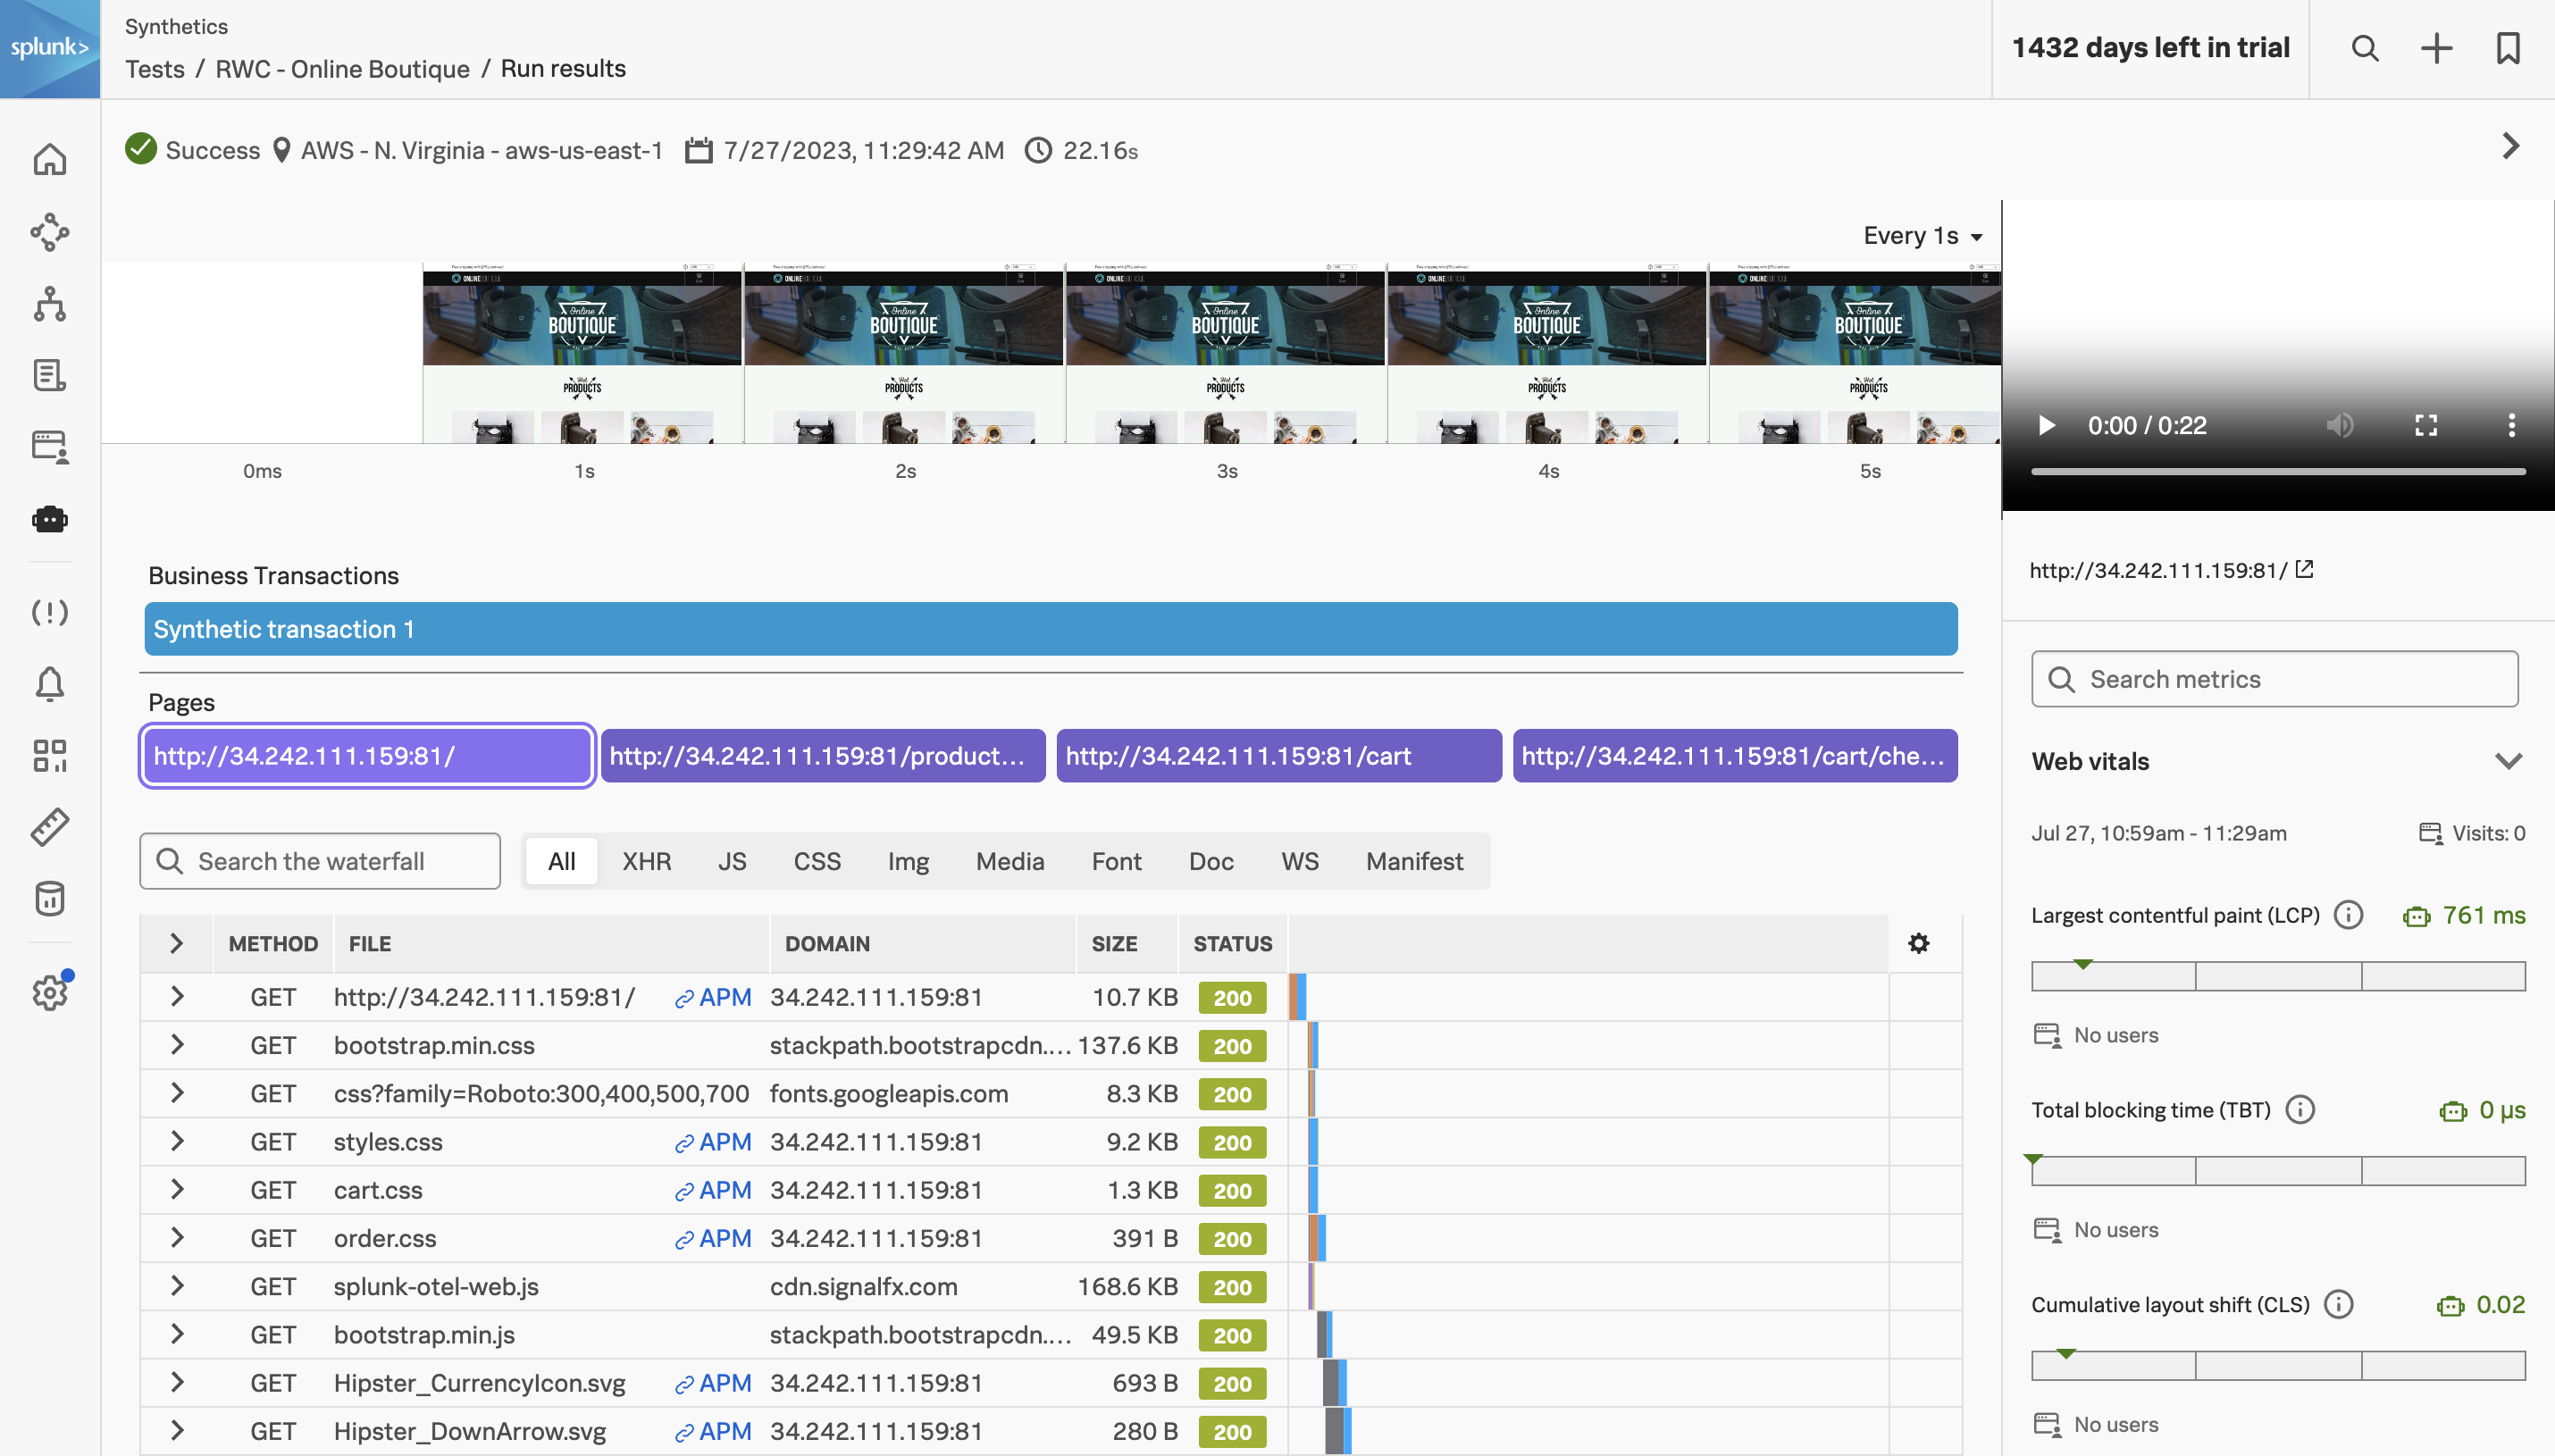
Result header #
At the top of the page you’ll see the run’s high-level outcome:
- Status — Success or Failure, with the failing step called out by name if there was one (this is why the step renaming in the previous chapter pays off).
- Location — the AWS region the run came from. Cross-reference with the scatterplot if you’re chasing a region-specific regression.
- Timestamp — when the run started, in your local timezone.
- Total duration — how long the journey took end to end.
Filmstrip and video #
The strip of screenshots across the top is a filmstrip — Synthetic Monitoring captures a screenshot at regular intervals throughout the run, so you can scrub through the entire journey visually. On the right is a video replay of the page as the test saw it, with a standard player you can scrub through frame by frame.
Filmstrip and video are by far the fastest way to answer “what did the user actually see?” — particularly useful when a step failed because of an unexpected modal, a content-shift error, or a missing element. They’re often the only thing you need to share with a developer to make a bug reproducible.
Business transactions and pages #
Below the filmstrip you’ll see two summary rows:
- Business Transactions — any synthetic transactions you defined in the step editor (we didn’t define any in this workshop, so you’ll see a default “Synthetic transaction 1” entry). Each transaction shows up as its own bar with its own duration.
- Pages — every distinct URL the journey visited, in order. For the Online Boutique test you’ll see four: the home page, the product page for the Vintage Camera Lens, the cart, and the checkout confirmation. Click any of them to filter the waterfall below to only that page’s resources.
Waterfall #
The waterfall is the workhorse of the results page — every individual HTTP request the page made, in order, with the timing and status of each. The filter bar lets you narrow by resource type (All / XHR / JS / CSS / Img / Media / Font / Doc / WS / Manifest), and each row shows:
- METHOD — usually
GET, but POSTs to APIs will surface here too. - FILE — the resource path. Clicking a row expands timing details (DNS, connect, TLS, request, response, content download).
- DOMAIN — useful for spotting third-party tax: if
cdn.googletagmanager.comor your A/B test SDK consistently shows up near the top of the slow list, you’ve found a candidate to defer or remove. - SIZE — the over-the-wire size. Watch for surprises here (a 4 MB hero image, an un-minified bundle).
- STATUS — the HTTP status code. Anything red is worth investigating, but also watch for unexpected
301/302chains that add latency without failing.
Web Vitals #
On the right of the page, Splunk reports the Core Web Vitals for this run:
- Largest Contentful Paint (LCP) — how long until the largest visible content element (usually a hero image or main heading) finished rendering. Good: ≤ 2.5s, needs improvement: ≤ 4s, poor: > 4s.
- Total Blocking Time (TBT) — total time the main thread was blocked by long tasks during page load. The lab-environment analogue of First Input Delay. Good: ≤ 200ms, poor: > 600ms.
- Cumulative Layout Shift (CLS) — how much the layout shifted unexpectedly during load (think: a banner pushing the article down after you’ve started reading). Good: ≤ 0.1, poor: > 0.25.
Because these are Google’s standard web-vitals metrics, you can chart them and alert on them the same way you would in any RUM tool — and unlike RUM, the synthetic version comes from a controlled environment, so a regression in synthetic LCP is almost always a code change rather than a user-environment change.
What to do next #
Once you’re comfortable with this view, a few useful follow-ups in real production use:
- Create detectors on the metrics surfaced here (run duration, step duration, individual web vitals). Splunk Synthetic Monitoring’s detectors live alongside your other Observability Cloud detectors and can fire to the same notification channels.
- Correlate with RUM. If the site is RUM-instrumented and shows the same regression in real-user data, you have a production-impacting issue. If only synthetic regresses, it’s often a third-party dependency or a code path users aren’t currently hitting.
- Compare runs across locations by going back to the scatterplot — if Melbourne consistently runs 8 seconds slower than London for the same journey, your CDN coverage for APAC is doing real damage you can quantify.
This run is now part of your test’s history forever — every metric on this page is also a time series you can chart, dashboard, and alert on.