API Test
View results
View results #
Wait a few minutes for the test to provision and dispatch its first run. Once you see at least one successful run on the test dashboard, click it to drill into the run results.
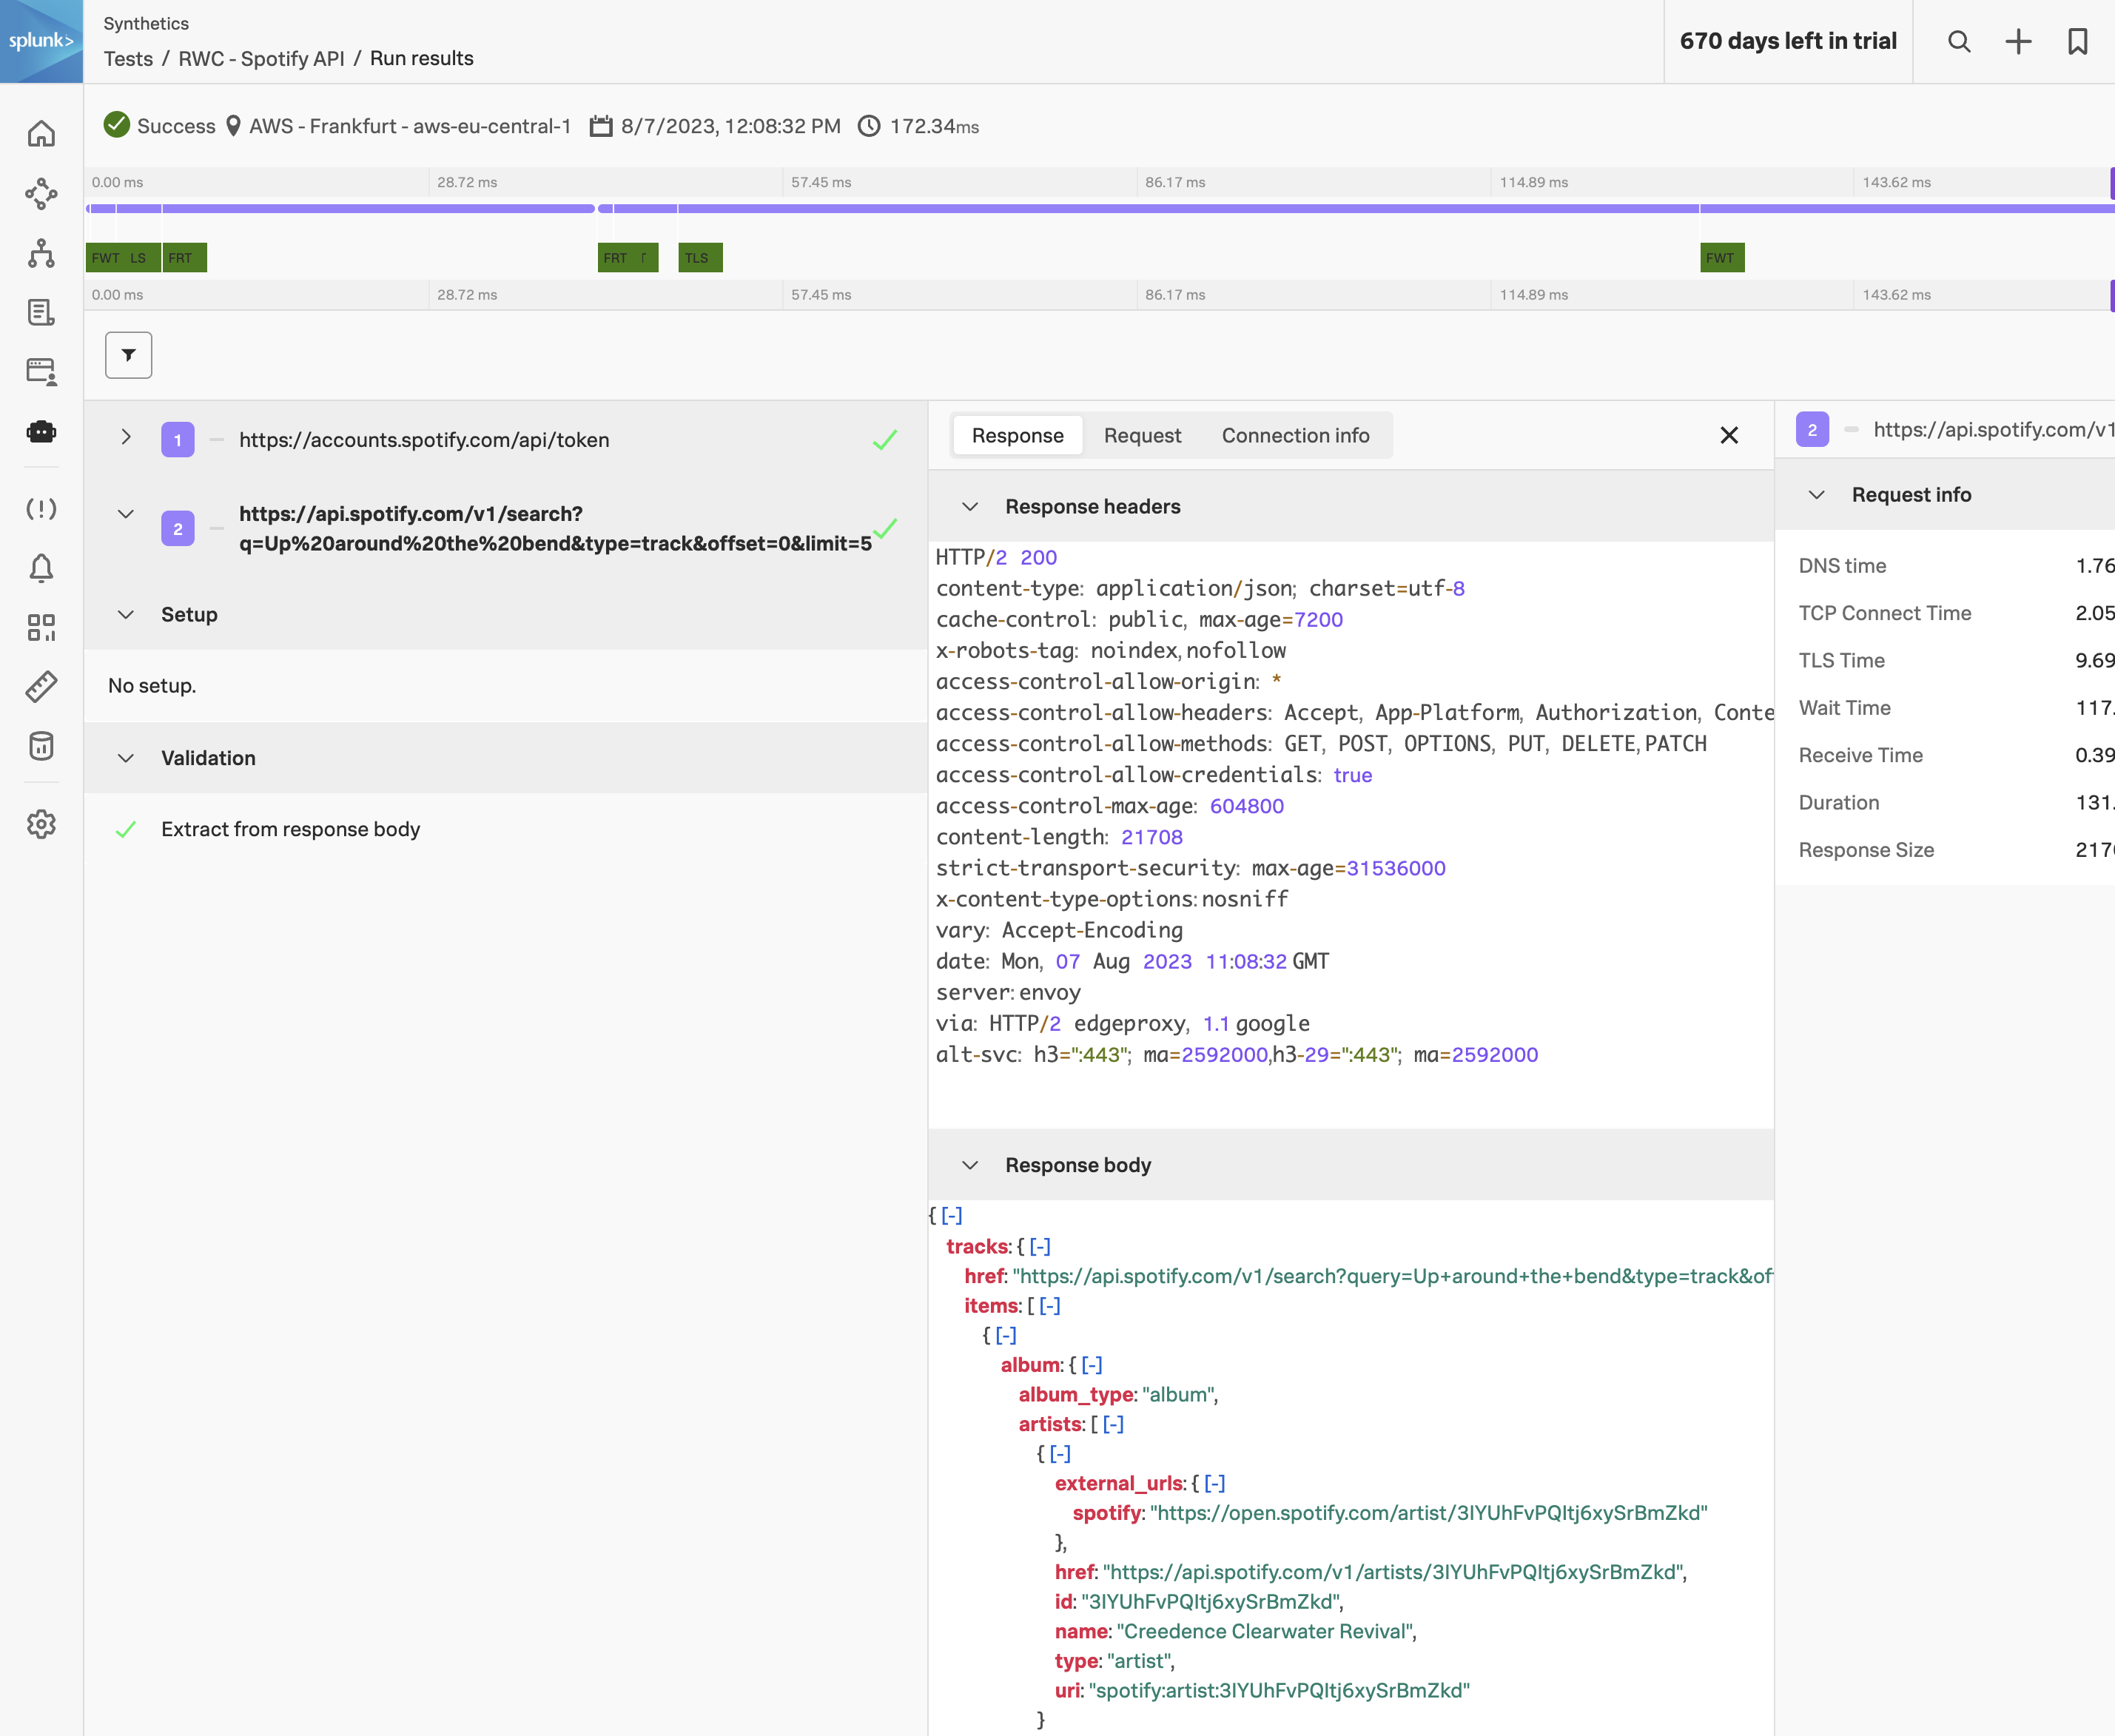
The API test results page is laid out like a slimmed-down version of the Real Browser Test results — the same general anatomy, but without the screenshots, video, or web vitals (none of which apply, since no browser ran).
Result header #
At the top: Status, Location, Timestamp, and Total duration. Notice how short the total duration is compared to the RBT — typically tens to hundreds of milliseconds for the whole multi-step transaction. That’s the cost-frequency advantage of API tests in action.
Request timeline #
A horizontal bar for each request in the transaction, in execution order. Green is a successful step (any 2xx response that also satisfies your validation rules); red is a failure. The bar lengths are proportional to each request’s total duration, so you can spot which step in a chain is the slow one at a glance.
Request detail panes #
Click any request in the timeline (or the list on the left) to open three tabs:
- Response — full response body, headers, and status code. Useful for one-off debugging (“what is Spotify actually returning?”) and for verifying that your extraction rules are pointing at the right field. The response body is captured every run, so you can compare today’s response against last week’s if behaviour has changed.
- Request — exactly what was sent on the wire: method, URL (with global variables already expanded so you can verify the substitution), headers, and body. Sensitive values from concealed variables are still concealed here.
- Connection info — TLS version, cipher suite, certificate chain. Worth a look when you’re debugging certificate or protocol-handshake issues.
Request info — the timing breakdown #
The right-hand sidebar is the single most useful diagnostic view in the page. For the selected request, it breaks the total duration down into its component phases:
- DNS time — how long it took to resolve the hostname. Sudden spikes here usually mean a regional DNS provider issue.
- TCP Connect time — opening the TCP socket to the server. Sudden spikes usually mean network congestion or a target server under load.
- TLS time — completing the TLS handshake. Spikes here can indicate certificate-chain issues or TLS renegotiation thrash.
- Wait time — server processing time, between the request being fully sent and the first byte of the response coming back. This is server-side latency and is usually the most actionable number on the page — a regression here points squarely at the API team.
- Receive time — how long it took to read the response body off the wire. Large for big response payloads.
- Duration — total wall-clock time for this single request.
- Response Size — bytes received. Watch for unexpected growth — schema changes that bloat responses are a common cause of subtle latency regressions.
Every one of these is also a time series you can chart, dashboard, and alert on. A typical production setup creates detectors on (a) overall run failure, (b) total run duration P95, and (c) the Wait time of any request whose backend SLO matters.
Where to go from here #
- How to Create an API Test — the official docs walk through every option in detail, including validation rules we didn’t cover here.
- API Test Overview — concept-level introduction with all the supported request types and validation operators.
- Synthetic Monitoring detectors — turn this run’s metrics into alerts wired into the same notification channels as the rest of your Observability Cloud detectors.
Congratulations! You’ve built a complete multi-step API test from scratch, including an OAuth-authenticated business transaction. The same auth-then-action pattern — with whatever JSON extraction and validation rules your real backends need — covers the bulk of what teams use Splunk Synthetic Monitoring API Tests for in production.