

Install oTel Collector
In this step, you’ll deploy the Splunk Distribution of the OpenTelemetry Collector to your k3d cluster using Helm. The collector receives traces and metrics from instrumented services and forwards them to Splunk Observability Cloud.
Note
Each application pod sends data to the collector via the node IP:
Pod → http://$(NODE_IP):4318 → Splunk OTel Collector DaemonSet → Splunk O11y CloudInstall via Helm #
Check that the values are exported successfully:
env | grep -E '^(REALM|ACCESS_TOKEN|INSTANCE|CLUSTER_NAME|DEPLOYMENT_ENV|RUM_APP_NAME)='ACCESS_TOKEN=abcdefgh
REALM=realm
INSTANCE=1234
CLUSTER_NAME=1234-cluster
DEPLOYMENT_ENV=workshop-1234
RUM_APP_NAME=workshop-1234Then run:
cd ~/workshop/context-propagation
make collectorsource .env
helm repo add splunk-otel-collector-chart https://signalfx.github.io/splunk-otel-collector-chart
helm repo update
helm upgrade --install splunk-otel-collector splunk-otel-collector-chart/splunk-otel-collector \
--namespace cosmic-shop \
--create-namespace \
-f deploy/helm/splunk-otel-values.yaml \
--set="splunkObservability.realm=${REALM}" \
--set="splunkObservability.accessToken=${ACCESS_TOKEN}" \
--set="clusterName=${CLUSTER_NAME}" \
--set="environment=${DEPLOYMENT_ENV}"Validation Checklist #
Run these commands after make collector completes.
1. Confirm Helm release is installed #
helm list -n cosmic-shopNAME NAMESPACE REVISION STATUS CHART APP VERSION
splunk-otel-collector cosmic-shop 1 deployed splunk-otel-collector-0.x.x 0.x.xSTATUS must be deployed. If it shows failed, re-check REALM and ACCESS_TOKEN in env.
2. Confirm collector pods are running #
kubectl -n cosmic-shop get pods -l 'app=splunk-otel-collector,component=otel-collector-agent'NAME READY STATUS RESTARTS AGE
splunk-otel-collector-agent-xxxxx 1/1 Running 0 60s
splunk-otel-collector-agent-xxxxx 1/1 Running 0 60sREADY should be 1/1 and STATUS should be Running. If STATUS is CrashLoopBackOff, check logs in step 3.
3. Confirm collector logs show no auth errors #
kubectl -n cosmic-shop logs -l 'app=splunk-otel-collector,component=otel-collector-agent' --tail=30... Everything is ready. Begin running and processing data.Failure indicators to watch for:
401 Unauthorized
access token is invalid
failed to export
connection refused
If you see auth errors, verify your access token and realm in env, then reinstall:
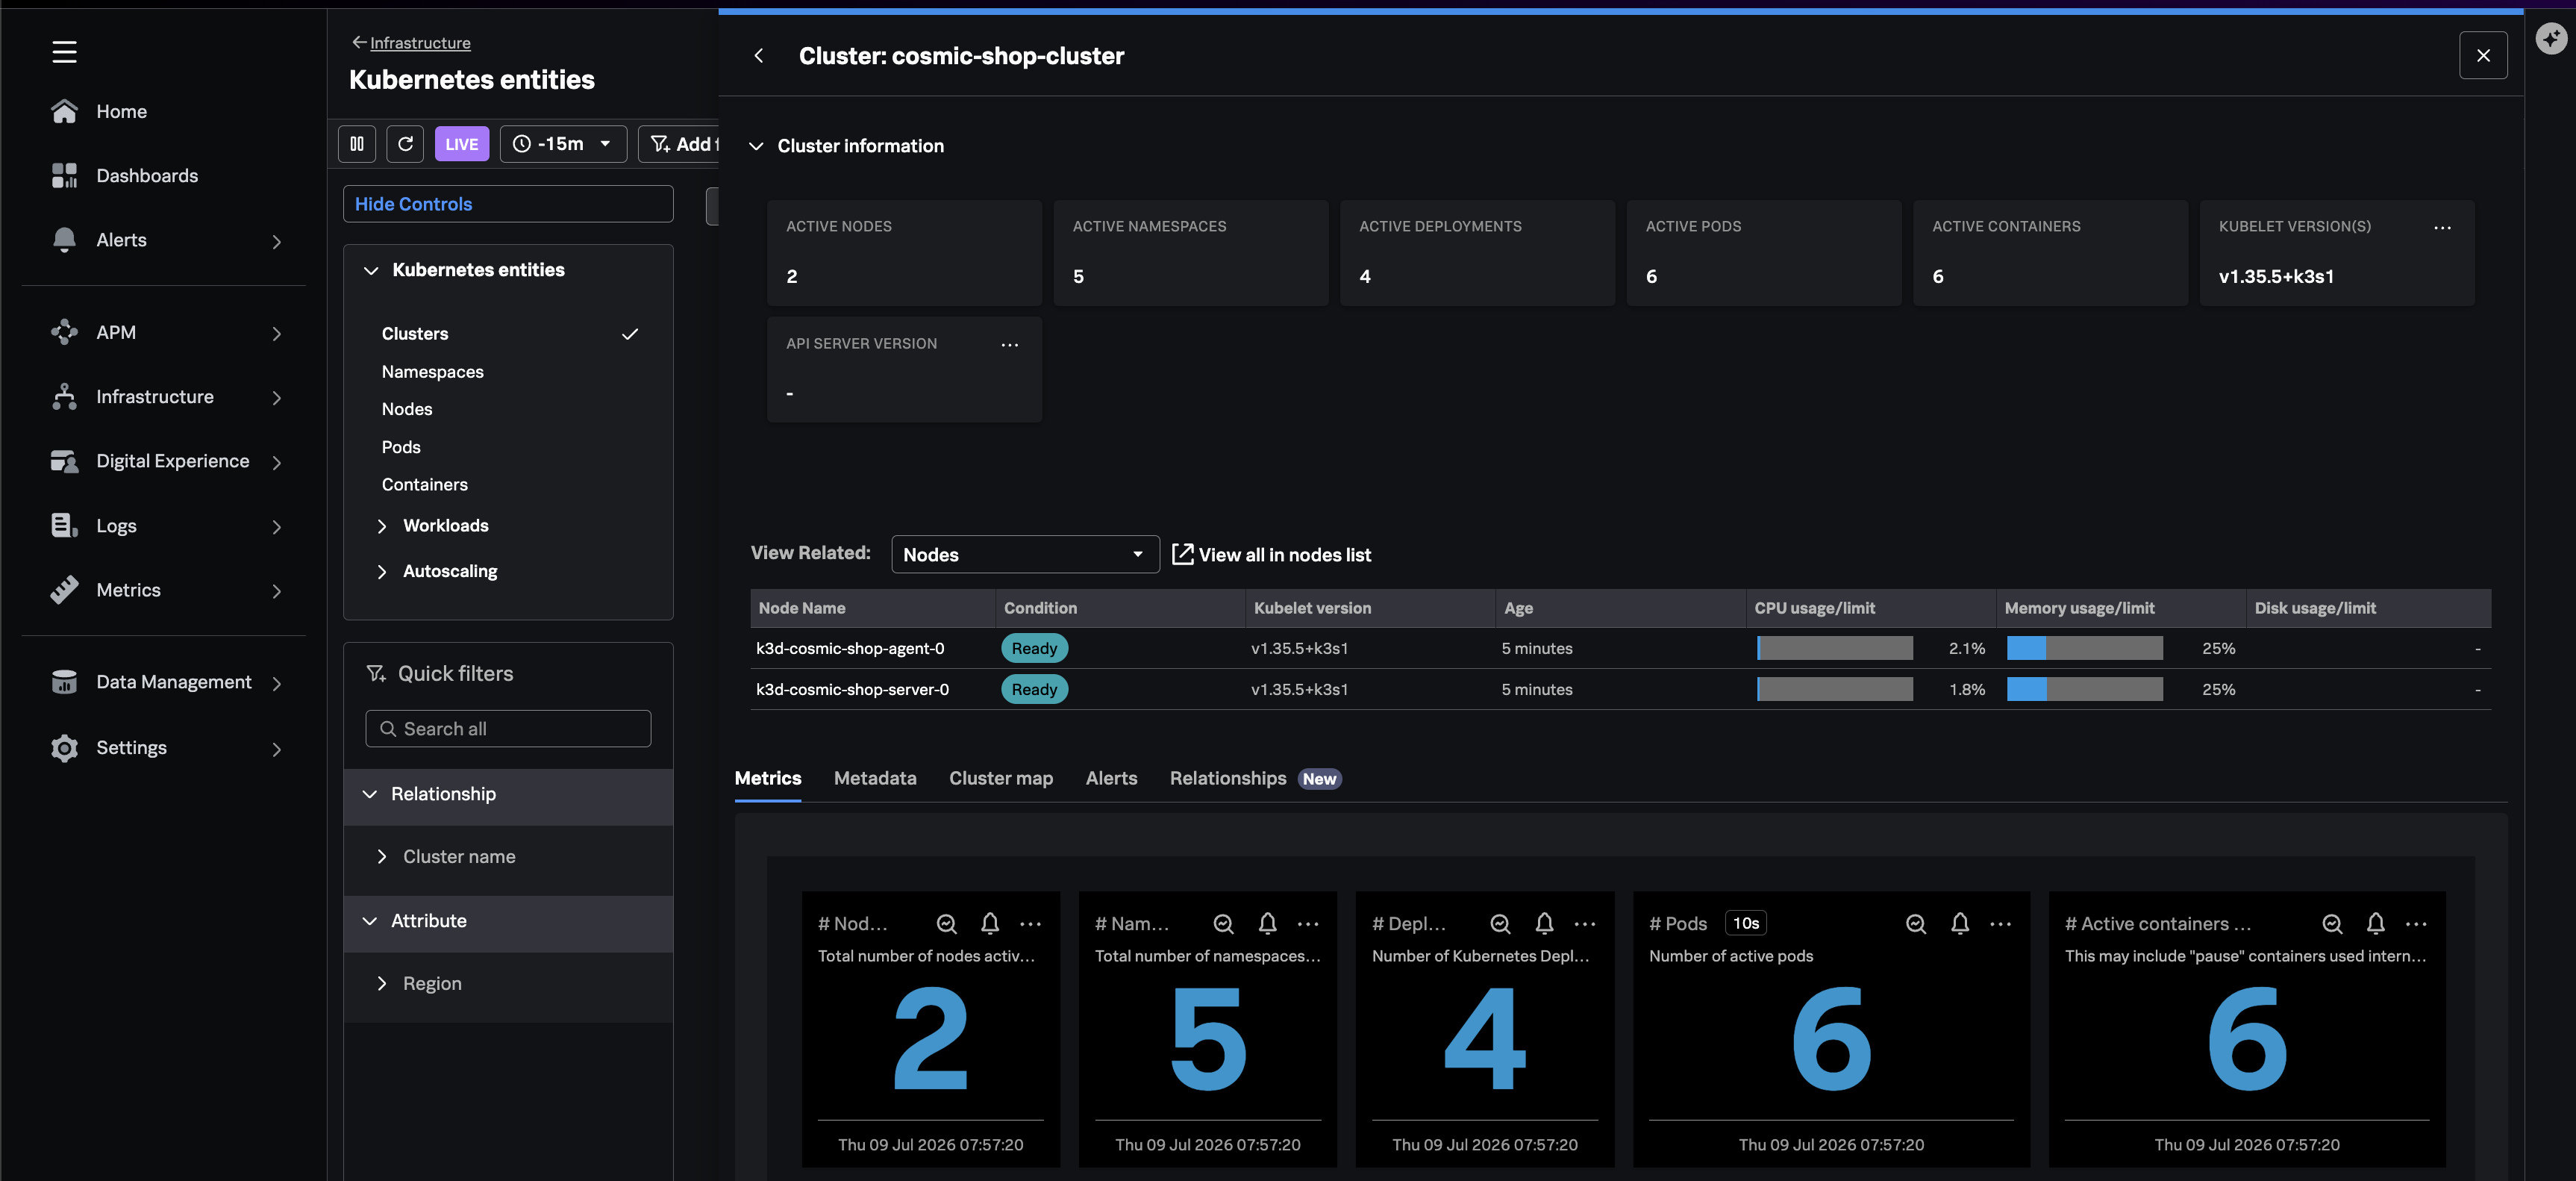
make collectorConfirm your Cluster in Splunk Observability Cloud #
- Open Splunk Observability Cloud
- Navigate to Infrastructure → Kubernetes → Kubernetes Entities → Clusters
- Search for your cluster name (
$INSTANCE-clusteror the value ofCLUSTER_NAMEinenv)
The cluster should appear within a few minutes of the collector starting.
Troubleshooting #
Here’s some of the potential issues you may encounter in this step & suggested remediation steps.