Build & Deploy Application
Explore APM in Splunk
In this step, you’ll observe how disconnected traces appear in Splunk Observability Cloud. This is the “problem state” that the rest of the workshop fixes.
The APM Request Path #
When you clicked Place order, the request flowed through:
text
Browser (RUM span)
  → Frontend NGINX
    → Edge Gateway NGINX     ← break #1: trace headers dropped
      → Order API
        → Catalog API        ← direct HTTP
        → Payment Gateway    ← break #2: strips headers to payment-api
          → Payment API
            → RabbitMQ       ← break #3: no trace context in message
              → Fulfillment Worker  ← orphan root trace
Three breaks occur:
- HTTP break #1 at the edge NGINX gateway (browser → order API)
- HTTP break #2 at the payment-gateway proxy (order API → payment API)
- Messaging break at RabbitMQ (payment API → fulfillment worker)
Observe in Splunk APM #
Note
Allow 2-5 minutes after generating data for metrics to appear..
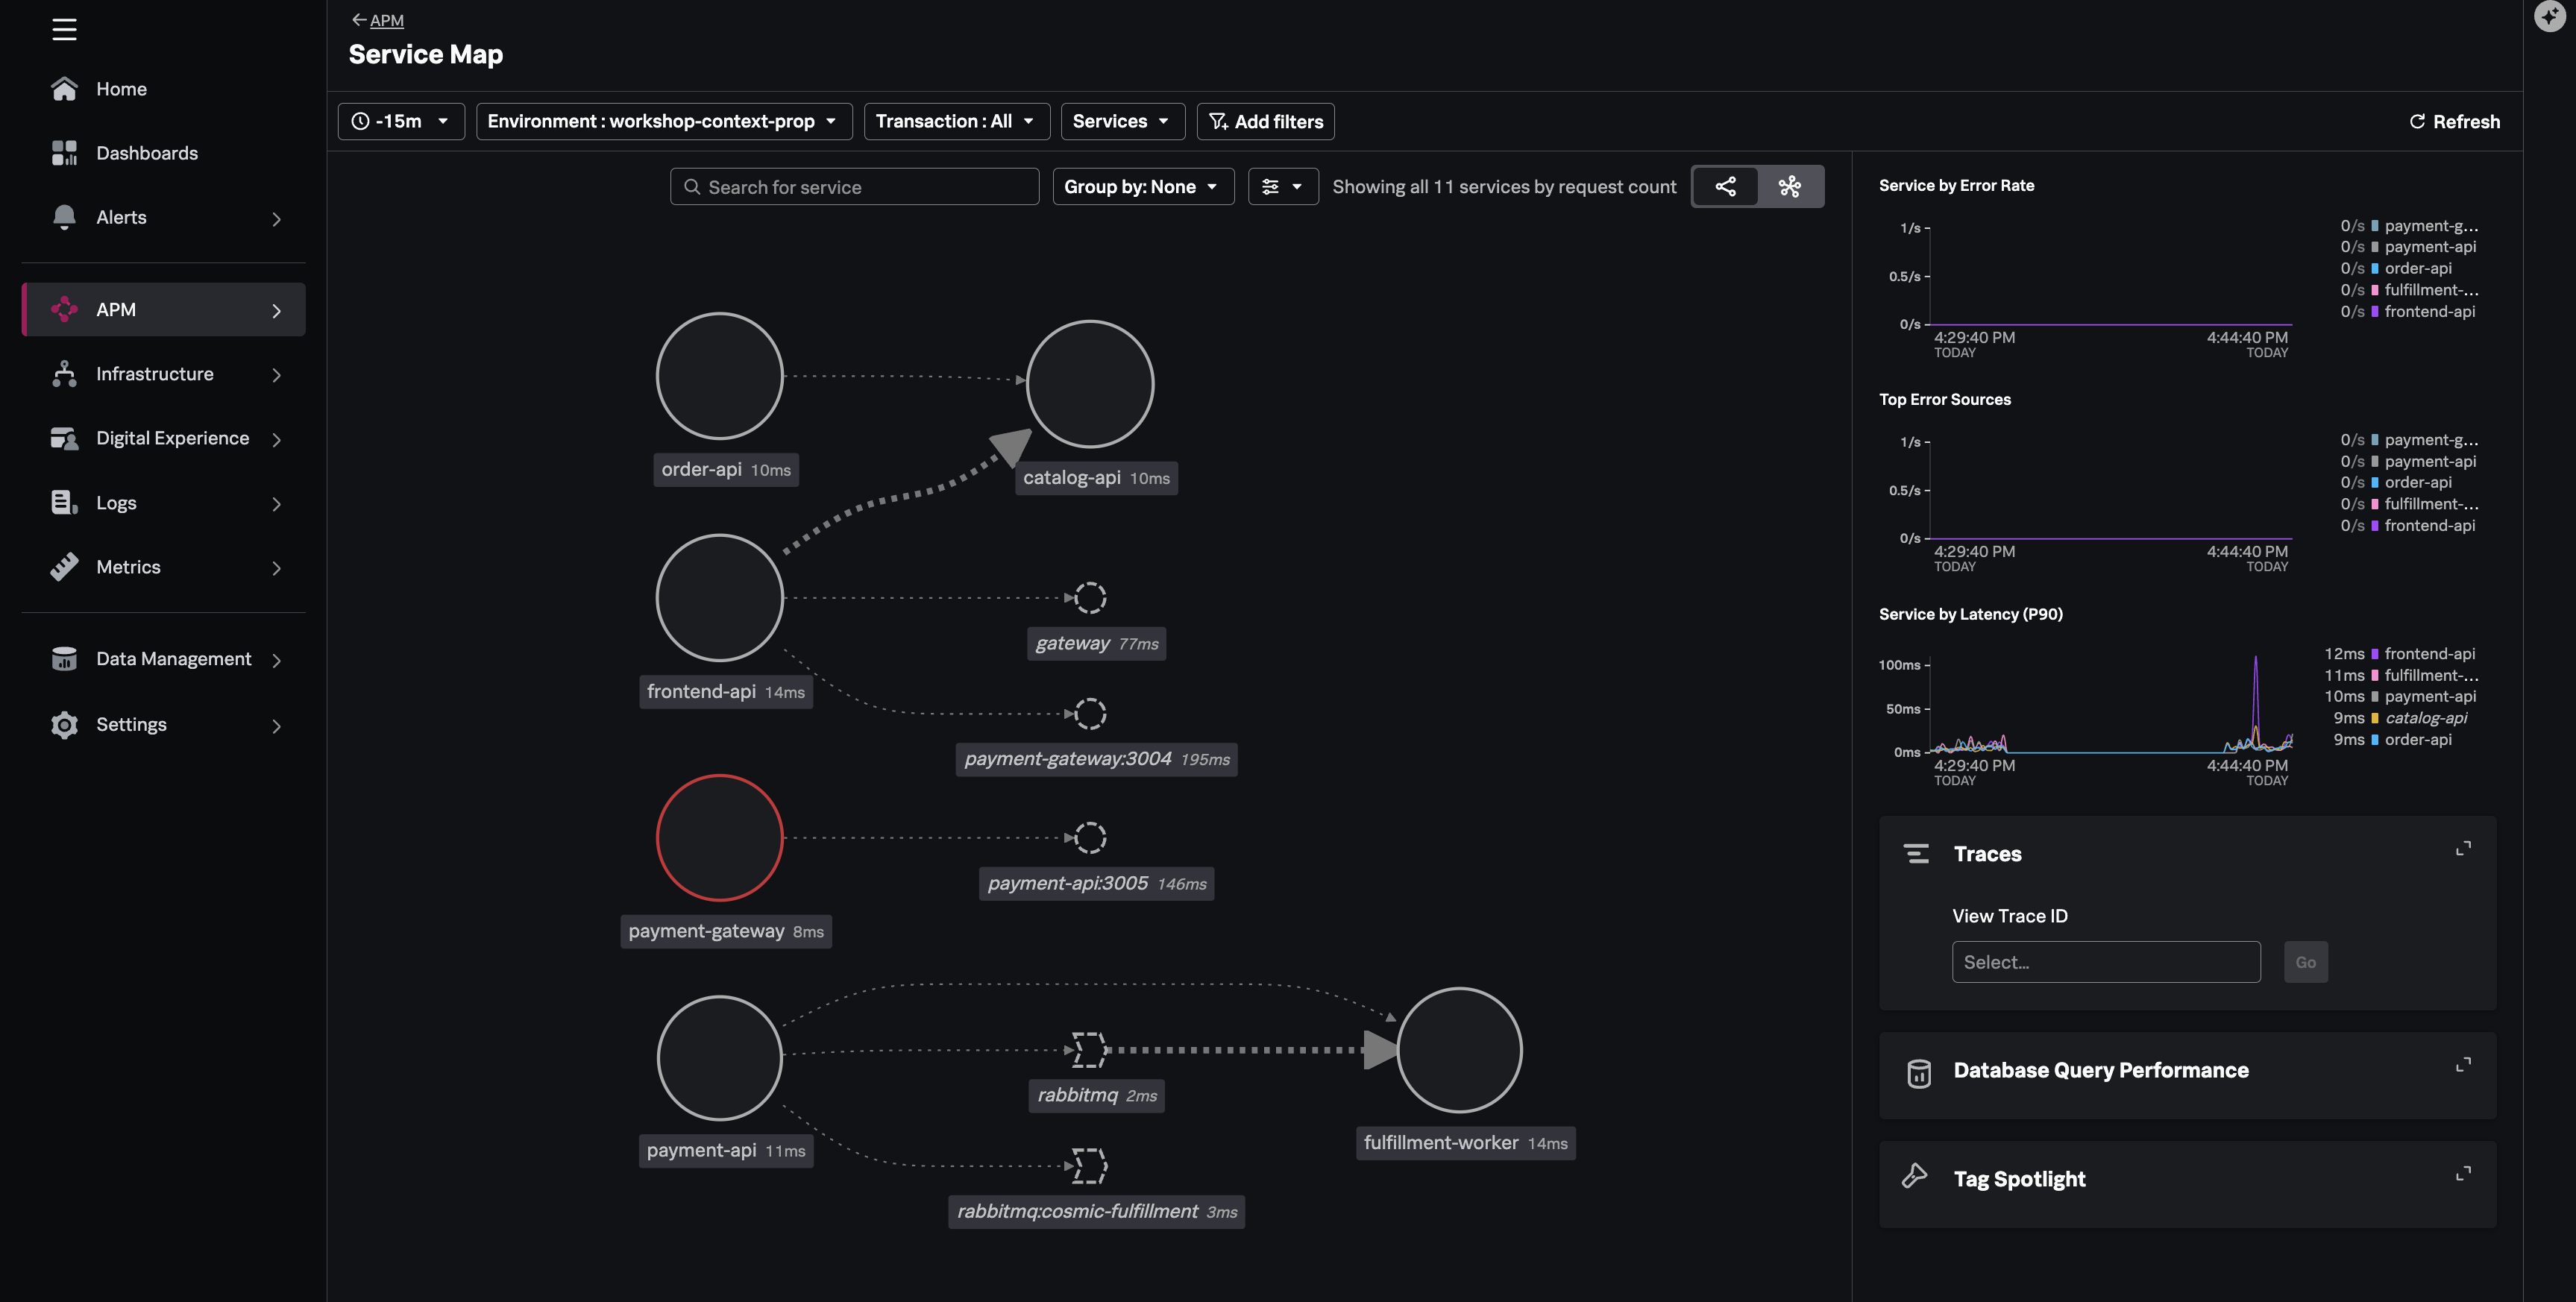
Service Map #
- Navigate to APM → Service Map
- Filter environment:
workshop-$INSTANCE - You should see services:
order-api,payment-gateway,payment-api,fulfillment-worker,catalog-api
Trace Search #
- Navigate to APM → Trace Analyzer
- Filter:
- Environment:
workshop-$INSTANCE - Service:
order-api - Operation:
POST /api/orders(orstorefront.place_order)
- Environment:
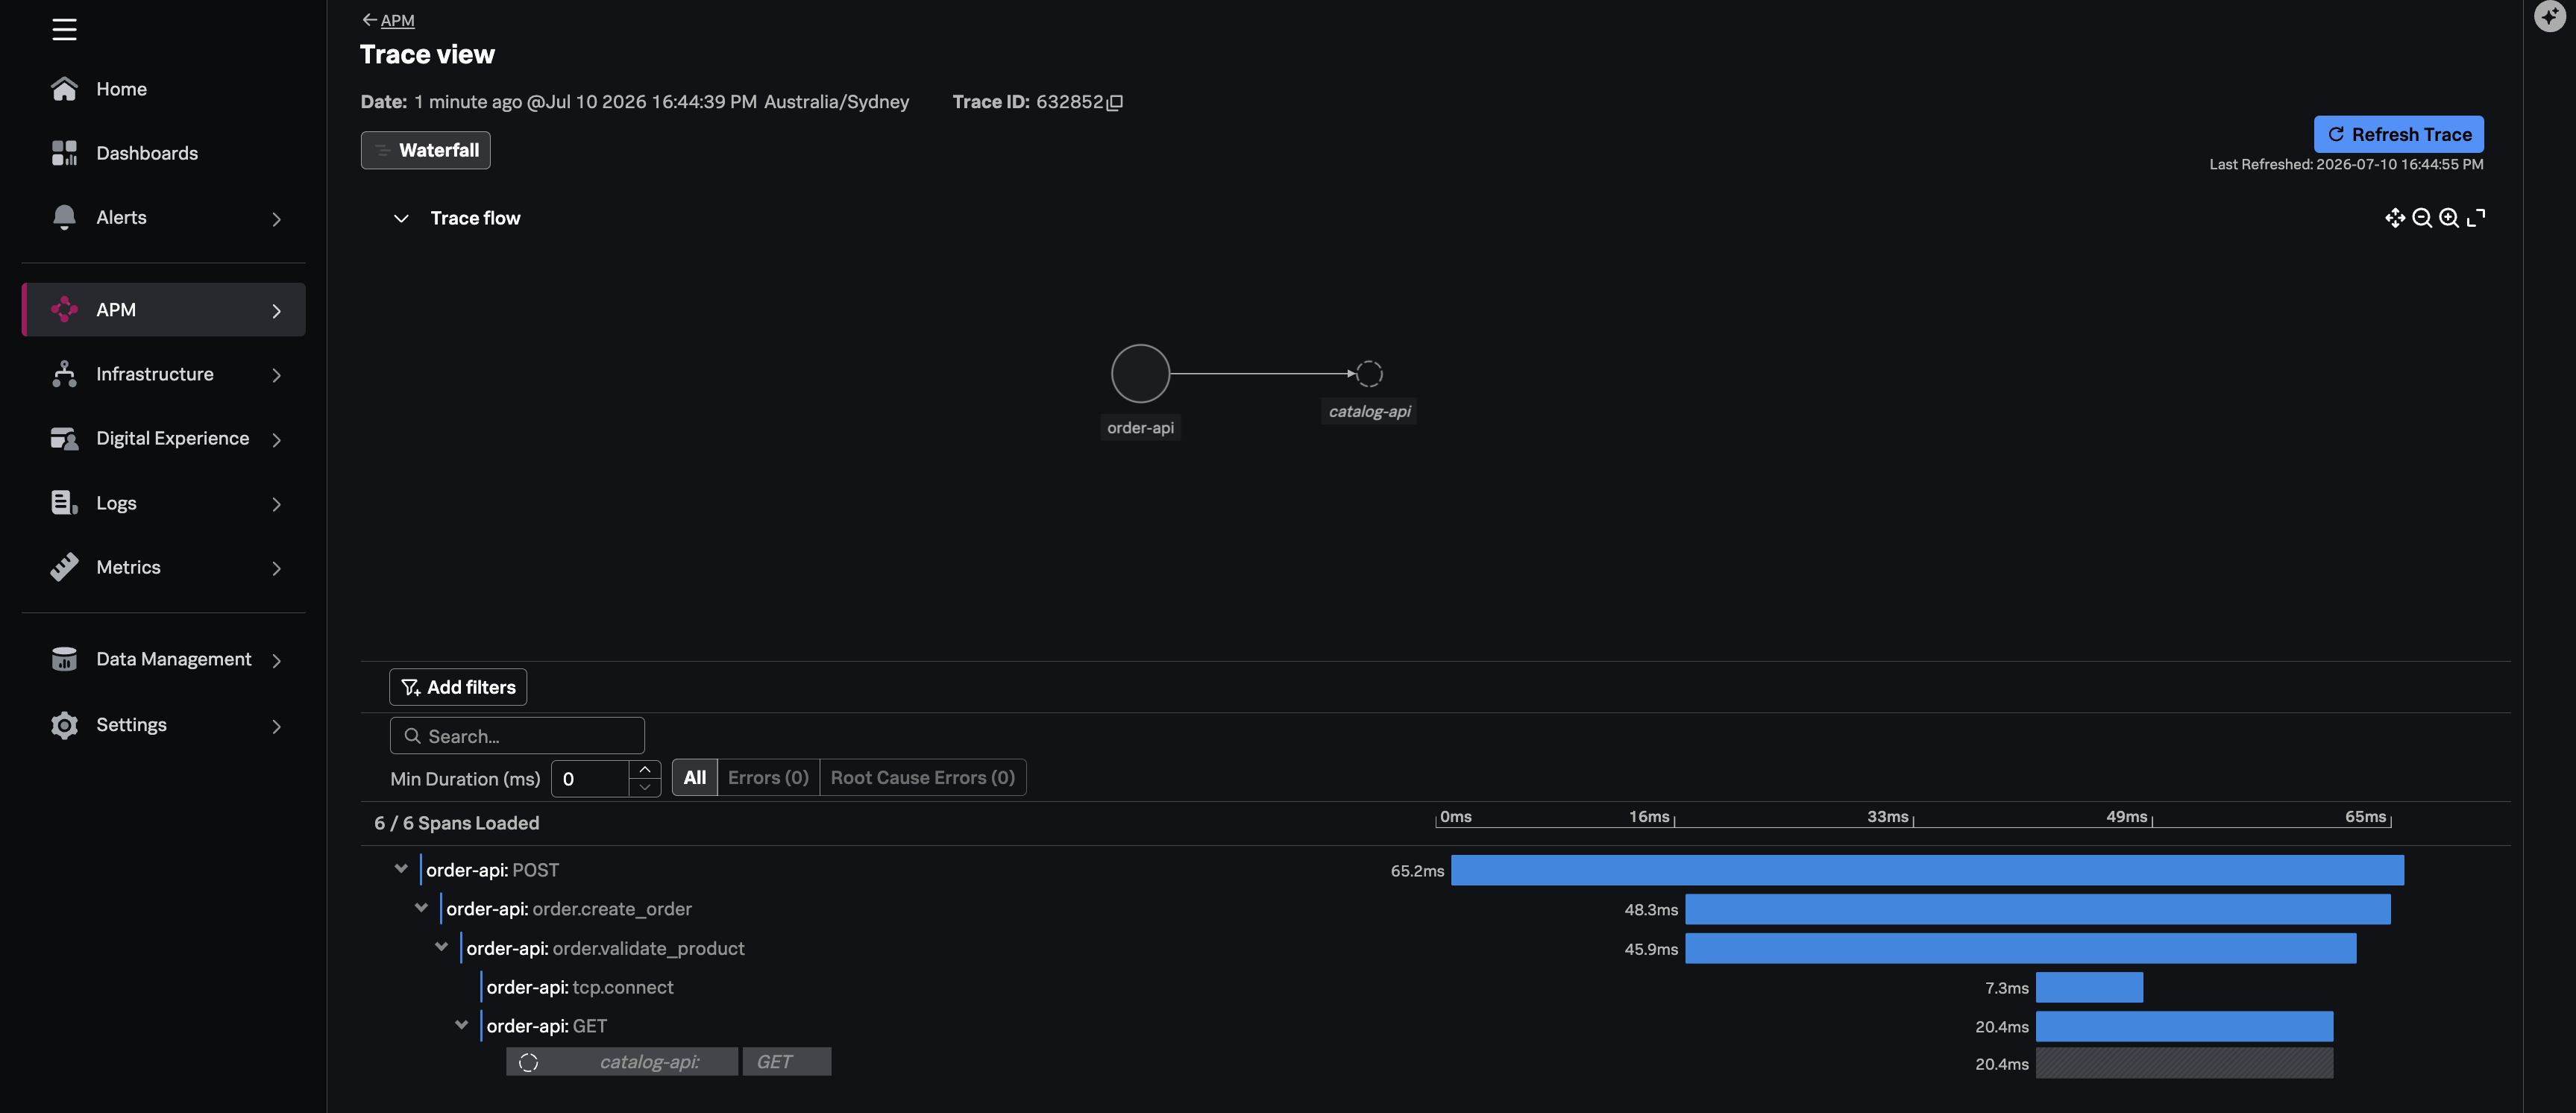
- Open a recent trace
What you’ll see (broken state)